Samsung Electronics (005930.KS) and SK hynix (000660.KS) Foreign Selling: Where the KRW 207 Trillion Went
English edition of the author’s Korean note on where foreign investors’ money went after selling Samsung Electronics and SK hynix.
On December 27, 1999, the U.S. financial weekly Barron’s ran an article on Warren Buffett of Berkshire Hathaway, a major Coca-Cola shareholder, under the headline “What’s Wrong, Warren?” The article opened by suggesting that Buffett, after more than 30 years of success, might be losing his “magic touch.” It was a year in which internet and tech stocks climbed by the day. Buffett did not buy tech stocks. He held shares of old companies such as Coca-Cola, and Berkshire’s stock fell 19.9% that year. Three months later the Nasdaq peaked and collapsed, the money that had sold tech moved into the stocks people had called boring, and Berkshire’s stock rose 26.6% in 2000.
In 2026 it is foreign investors who are selling the stocks that rose the most. From January 2 to October 23 this year, foreigners net sold KRW 206.97tn (about $156.1bn) of Korean stocks, and nine-tenths of it was Samsung Electronics and SK hynix. So where did the money go this time? Into stocks like Coca-Cola, into cash, or into resources such as oil and gold? This report answers with numbers from the Korea Exchange (KRX), which publishes every stock’s trading by investor type each day; the Bank of Korea, the central bank; and the Financial Supervisory Service (FSS), Korea’s financial regulator; together with global fund flow data. The conclusion first: foreigners didn’t abandon AI, they trimmed Korean memory.
As of: October 25, 2026 (Korean stocks are KRX regular-session data for October 23; overseas prices are October 23 closes; Bank of Korea statistics are the October 16 release). Dollar figures in parentheses use KRW 1,326.0 per dollar, the October 23, 2026 rate (Yahoo Finance KRW=X). Numbers the author calculated are marked as such.
Some Korea-specific background. The KOSPI is the main board of the Korea Exchange and its benchmark index; the KOSDAQ is the exchange’s smaller growth-company board. Tickers ending in .KS trade on the KOSPI, and Samsung Electronics and SK hynix are its two largest stocks. Korea counts large sums in jo (one trillion won) and eok (100 million won); this report shows them as KRW tn and KRW bn, and shows the dollar flows the Bank of Korea reports in units of $100mn as $bn.
Topics covered: Buffett in 1999 and 2000; key terms; what foreigners sold and at what price; other Korean stocks and bonds; Bank of Korea flow data and the stronger won; selling by nationality; the rules each kind of seller follows; the emerging market index, Taiwan and Brazil; how global fund managers allocate; Coca-Cola and defensive stocks; cash and money market funds; oil, energy and gold; returns by asset; signals of a return and dates to check; and the basis of calculation.
This is the author’s personal analysis and view. The author’s calculations and estimates are not confirmed facts.
1999 to 2000: money from the stocks that soared went to the boring ones
Every year Berkshire Hathaway opens its shareholder letter with a table setting the annual change in its share price beside that of the S&P 500 including dividends. In the 2024 letter’s table, Berkshire’s stock fell 19.9% in 1999 while the S&P 500 rose 21.0%. In 2000, Berkshire rose 26.6% and the S&P 500 fell 9.1%. Within two years the market’s order had flipped. The Nasdaq hit a record close of 5,048.62 on March 10, 2000 and ended the year down 39.3%. That same year the Russell 1000 Value index of large value stocks rose 7.0%, and the Russell 1000 Growth index fell 22.4%.
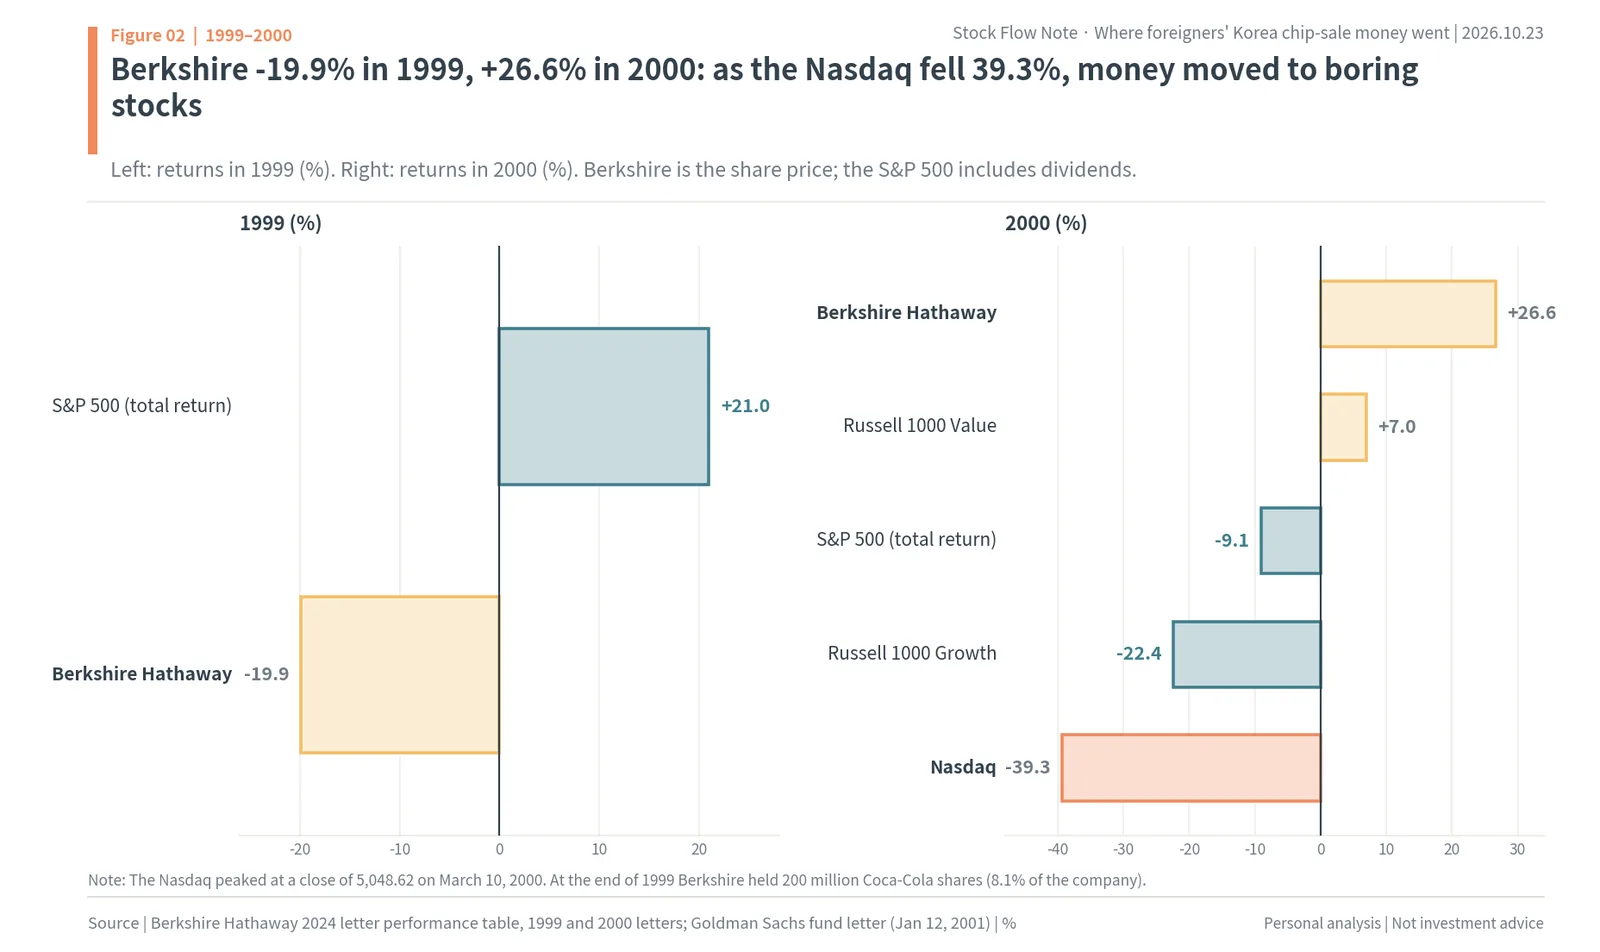
One of the big stocks Berkshire held at the end of 1999 was Coca-Cola. According to the 1999 shareholder letter, Berkshire owned 200 million Coca-Cola shares (8.1% of the company), worth $11.65bn at year-end. At the end of 2000 the same 200 million shares were worth $12.188bn. In the 1999 letter Buffett explained that he did not own shares of technology companies he did not understand well. An Associated Press market story in October 2000 quoted an analyst saying money was going to companies that would keep growing earnings no matter what, such as drugs, beverages and food.
This story frames the question of this report. Money from selling stocks that soared does not vanish; it lands somewhere else. In 2000, tech itself collapsed, so money moved out of tech into companies with steady earnings. The Samsung Electronics and SK hynix shares foreigners sold in 2026 also soared on AI demand. So did money leave AI again this time, for companies like Coca-Cola? As the chapters below show, this time the answer differs from 2000. Rather than leaving AI, the money trimmed Korean memory inside AI and moved elsewhere.
Key terms: net buying, KRX versus Bank of Korea data, nationality, the emerging market index and the fund manager survey
This report follows the money by joining numbers published by different institutions. Each counts in its own way, so even for the same month the numbers differ slightly. Before reading them, here is what each one counts.
Net buying is the amount bought minus the amount sold. The KRX publishes net buying by stock and by investor type every trading day. In this report, “the money foreigners sold” is what the KRX investor type “foreigners” net sold on the KOSPI and KOSDAQ from January 2 to October 23. KRX numbers are counted on the day an order is executed (the trade date). Add up one stock’s net buying across all investors and the total is zero, so whatever foreigners sold, domestic retail investors, institutions and companies bought.
The Bank of Korea counts the same money at a different door. The foreign portfolio investment flows in its monthly International Finance and Foreign Exchange Market Trends release add up, in dollars, the money foreigners put into and pulled out of Korean stocks and bonds. Equity flows are counted on the day the money changes hands (the settlement date), so they differ from KRX numbers by a few days each month. A negative number means foreign money left Korea. The FSS’s monthly Foreign Investors’ Securities Trading report counts listed stocks and listed bonds separately in won and also discloses trading and holdings by nationality. Nationality is the country where the fund or account is registered, which can differ from the country where the asset manager is headquartered.
The emerging market index means the MSCI Emerging Markets (EM) index. Many emerging market funds around the world use it as their benchmark; holding more of a country than its index weight is called overweight, and holding less is called underweight. When Samsung Electronics and SK hynix rise, Korea’s weight in the index grows, and a fund that does nothing becomes more concentrated in one country and two stocks.
The BofA Global Fund Manager Survey is a monthly poll in which Bank of America asks several hundred fund managers around the world how they allocate. “A net X% overweight” is the share who say they are overweight minus the share who say they are underweight. The same bank also publishes weekly fund flows (the Flow Show) based on data from EPFR, a fund flow data provider. Money market funds (MMFs) invest in short-term government bonds and deposits; in effect, they are cash that earns interest.
Nine-tenths of the KRW 206.97tn foreigners sold this year was Samsung Electronics and SK hynix
To start with the conclusion, the money foreigners raised by selling Korean stocks this year came from two stocks. Over the 197 trading days from January 2 to October 23, foreigners net sold KRW 209.05tn on the KOSPI and net bought KRW 2.07tn on the KOSDAQ, for combined net selling of KRW 206.97tn (KRX). Of that, Samsung Electronics accounted for KRW 93.64tn (about $70.6bn; KRW 88.19tn of common shares and KRW 5.45tn of preferred) and SK hynix for KRW 92.38tn (about $69.7bn). The two together, KRW 186.02tn (about $140.3bn), are 89.9% of all foreign net selling. All the other 2,796 stocks added together were net sold by KRW 20.95tn. Among them, foreigners bought 1,141 stocks for KRW 36.85tn and sold 1,655 for KRW 57.80tn.
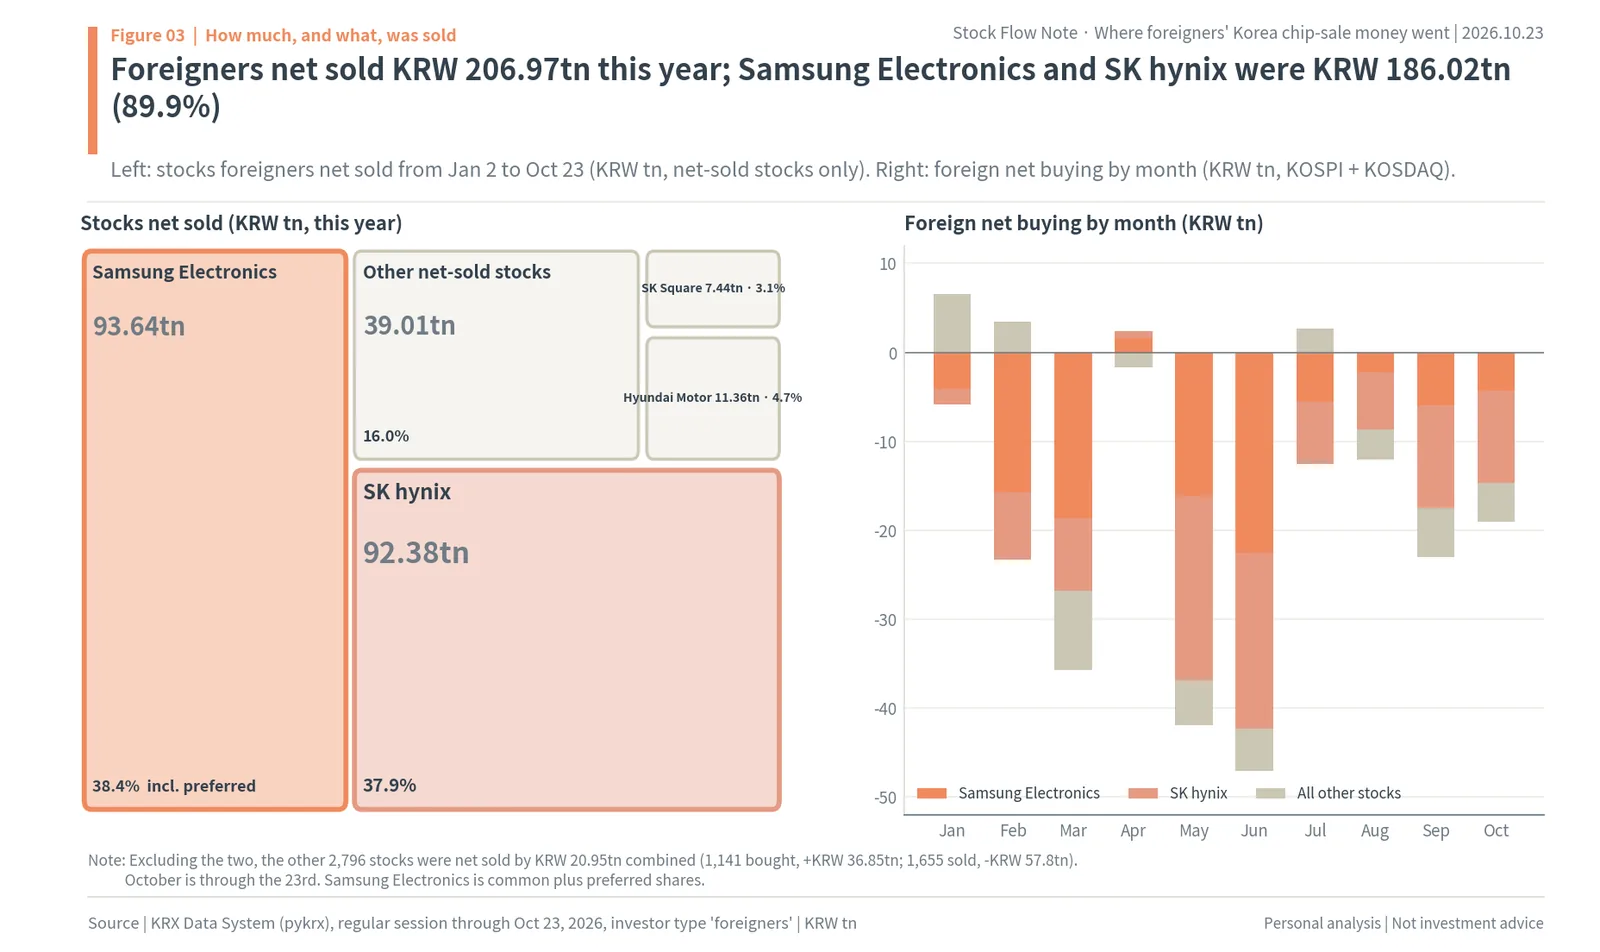
The left of the figure stacks the stocks foreigners net sold this year by size. The Samsung Electronics and SK hynix boxes take up three-quarters of the picture, and the next largest, Hyundai Motor (KRW 11.36tn) and SK Square (KRW 7.44tn), are the size of a corner of either one. The right is foreign net buying by month. In January (+KRW 0.64tn) and April (+KRW 0.73tn) foreigners actually bought a little, and they sold KRW 19.86tn in February, KRW 35.71tn in March, KRW 41.88tn in May and KRW 47.03tn in June. After June 22, when the KOSPI peaked, they kept selling: KRW 9.81tn in July, KRW 12.02tn in August, KRW 23.00tn in September and KRW 19.03tn in October (through the 23rd). In February, March and June they sold more Samsung Electronics, and in May and from July on they sold more SK hynix. In October alone, SK hynix was KRW 10.32tn and Samsung Electronics KRW 4.32tn of the KRW 19.03tn foreigners sold, so the two stocks’ share fell to 76.9%, and the rest of the market was net sold by KRW 4.40tn. The selling is slowly spreading from the two stocks to Korean stocks as a whole.
They sold at around twice last year’s closing price
The two stocks foreigners sold were the large caps that rose the most this year. Samsung Electronics closed at KRW 119,900 on the last trading day of 2025, rose to KRW 362,500 on June 18, and closed at KRW 215,500 (about $163) on October 23, 40.6% below its high but 79.7% above last year’s close. SK hynix rose from KRW 651,000 to KRW 2,919,000 on June 22, then fell 56.3% to KRW 1,277,000 (about $963), still 96.2% above last year’s close. Even after the big fall, both stocks trade near twice their year-end prices.
The prices foreigners actually sold at were high as well. Dividing this year’s foreign net sales value by the net number of shares sold, foreigners sold 378.2 million Samsung Electronics common shares for KRW 88.19tn, an average of KRW 233,164 (about $176), and 57.8 million SK hynix shares for KRW 92.37tn, an average of KRW 1,596,955 (about $1,204). That is 1.94 times and 2.45 times last year’s closing price. If foreigners had held these shares since the end of last year, KRW 97.56tn (about $73.6bn), or 54.0%, of the KRW 180.56tn they took in would be this year’s gain (author’s calculation). In reality many of the shares were bought much earlier, so the gain is larger.
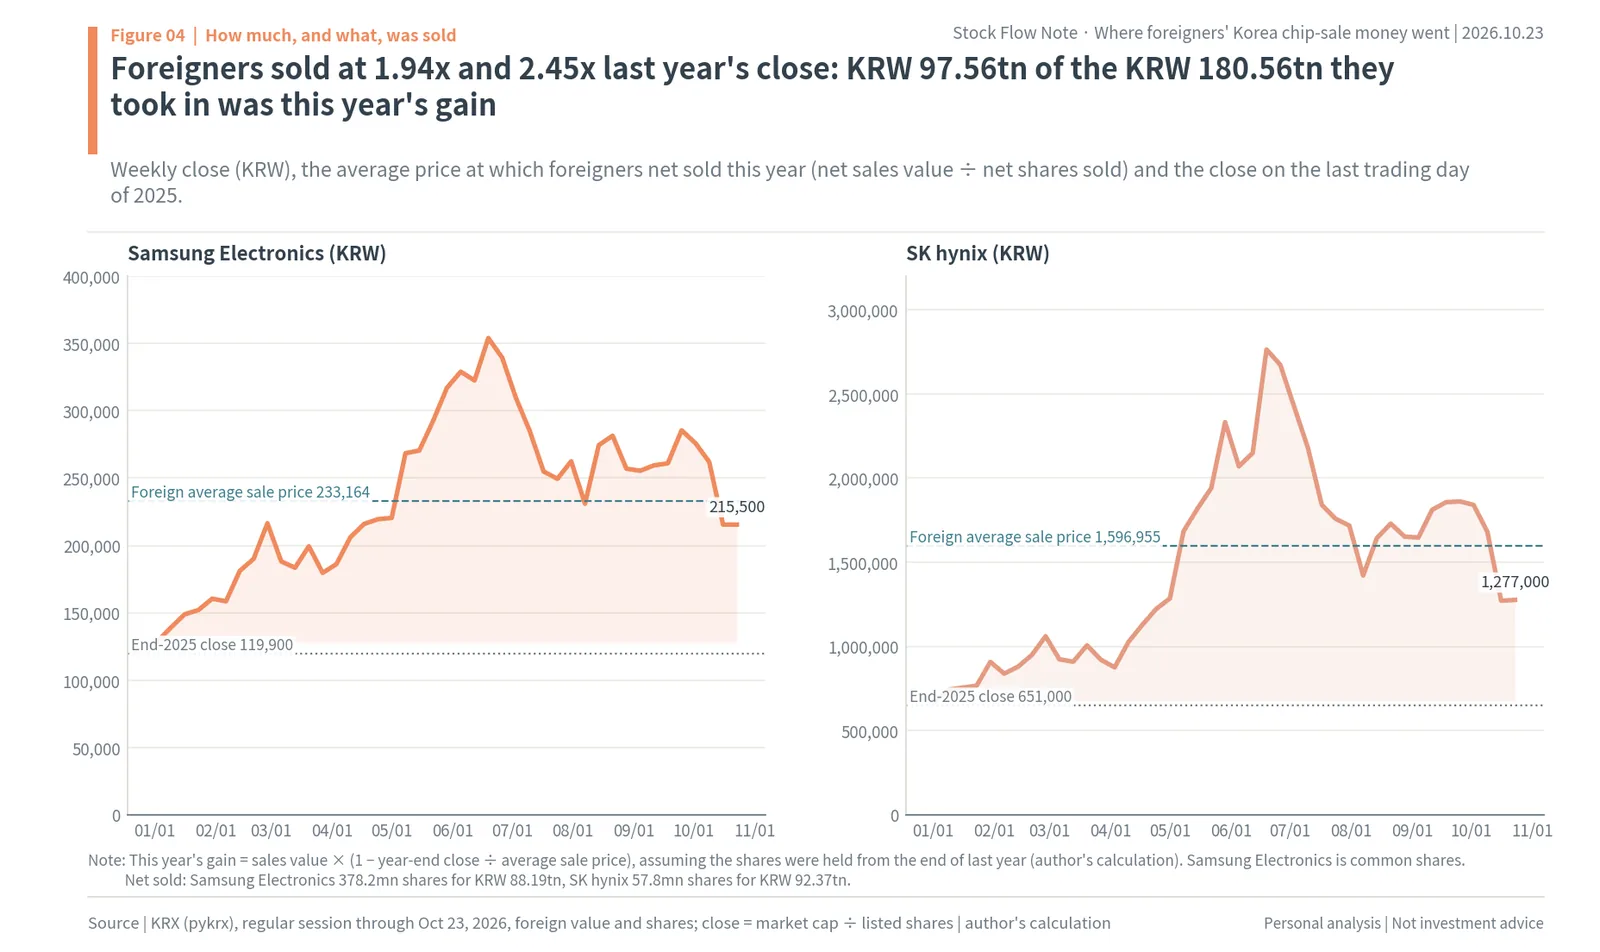
The figure shows the two stocks’ weekly closes, the average foreign sale price (teal dashed line) and last year’s close (gray dotted line). For both stocks, the average price foreigners sold at sits far above last year’s close. For SK hynix, the average sale price of KRW 1,596,955 is even above the October 23 close of KRW 1,277,000. Foreigners sold high, and those who bought after them are now sitting on losses.
The reasons the Bank of Korea gave month by month point the same way. It described January’s equity outflow as “profit-taking selling on the share price rise,” February’s as “profit-taking and caution over artificial intelligence (AI) investment,” May’s as “portfolio rebalancing and profit-taking supply,” and June’s as “adjusting the weight of domestic stock holdings.” Rebalancing means selling an asset that has grown too large in order to return to a set ratio. Foreigners’ share of KOSPI market capitalization fell from 41.40% on June 22 to 38.46% on October 23. The foreign selling looks less like frightened money fleeing and more like money trimming the weight of two stocks that had made big gains. So the next question is where the trimmed money landed.
The money did not stay in other Korean stocks or in Korean bonds
Start with the other side. Someone bought the shares foreigners sold, and the money foreigners received was paid by those buyers. This year the KRW 206.97tn foreigners sold on the KOSPI and KOSDAQ was taken by retail investors (KRW 93.51tn), other corporations (KRW 62.85tn) and institutions (KRW 49.82tn). Other corporations are ordinary non-financial companies; the treasury shares Samsung Electronics and SK hynix bought on the market show up in this column. Within institutions, securities firms (financial investment) bought KRW 83.78tn, much of it liquidity providers buying shares to create the ETF units retail investors bought. Pension funds actually sold KRW 9.10tn. The cash foreigners took home came, in the end, from Korean households’ savings and companies’ cash. This chapter and the next check whether that money stayed in Korea.
If foreigners had used the money from selling Samsung Electronics and SK hynix to buy other Korean stocks, their net buying of other stocks should have jumped. The numbers say otherwise. The stock foreigners bought most this year is Celltrion, at KRW 1.75tn, which is 0.9% of the KRW 186.02tn of net selling in the two stocks. Next come APR (KRW 1.23tn), Hyundai Rotem (KRW 1.15tn), Korean Air (KRW 1.11tn), SK Innovation (KRW 0.94tn), LG Energy Solution (KRW 0.72tn), FADU (KRW 0.72tn), Samsung SDI (KRW 0.70tn), Hanwha Ocean (KRW 0.67tn) and POSCO Holdings (KRW 0.67tn). The top 10 together come to KRW 9.66tn, just 5.2% of the two stocks’ net selling.
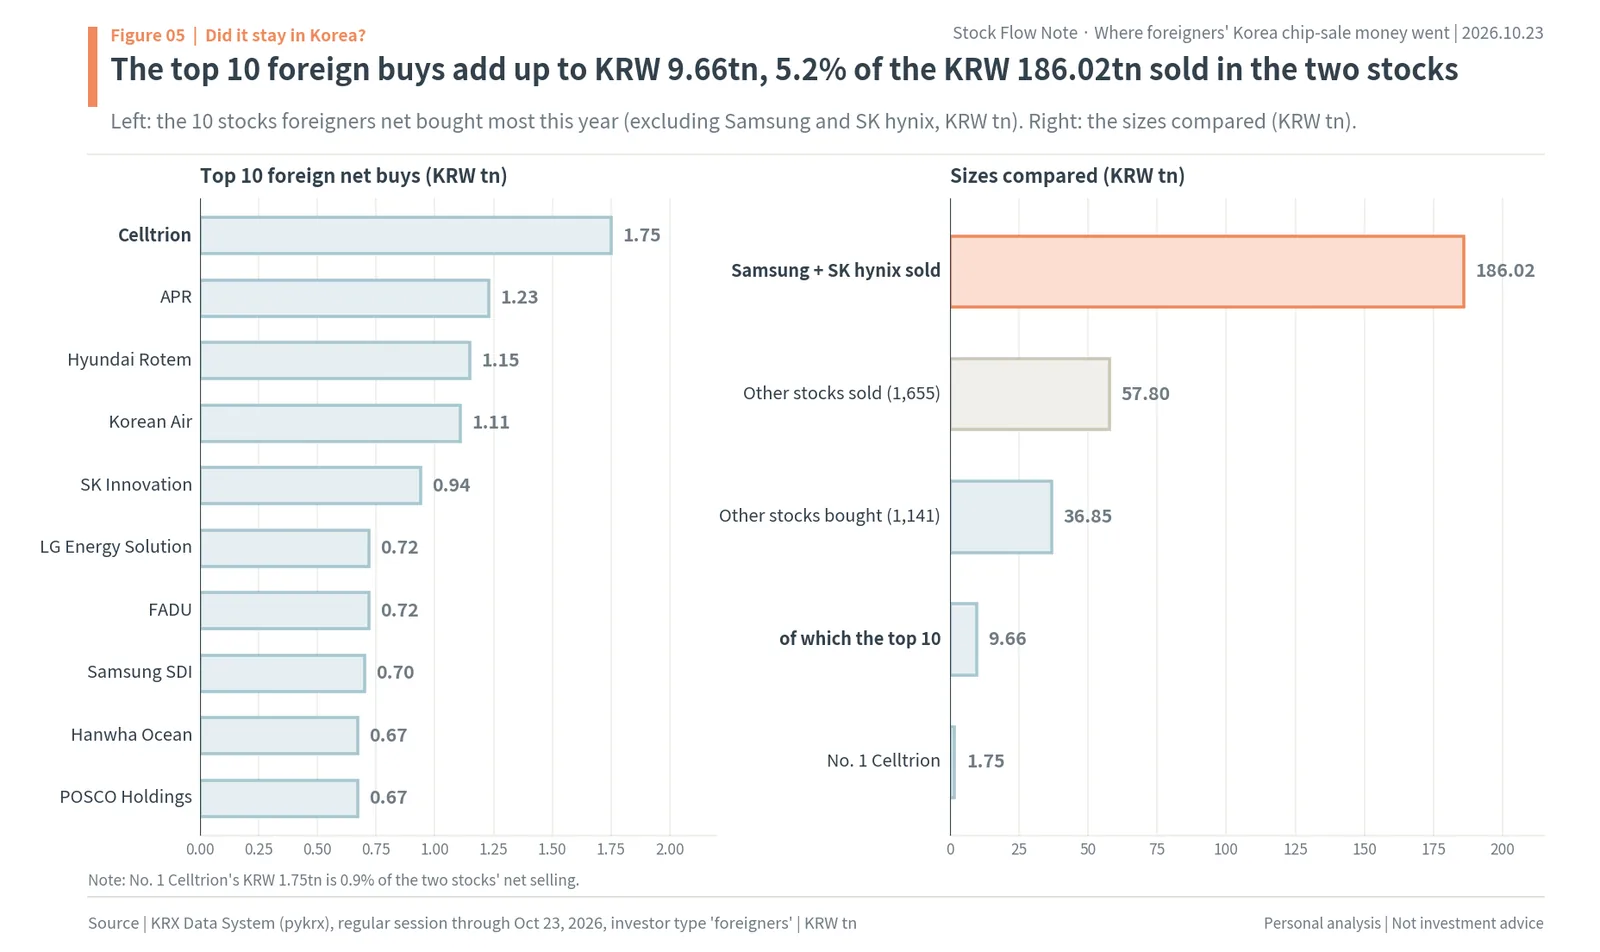
The left of the figure shows the top 10 stocks by foreign net buying, and the right sets their size beside the selling of the two stocks. The buys are spread evenly across industries, biotech (Celltrion), cosmetics (APR), defense (Hyundai Rotem), airlines (Korean Air) and batteries (LG Energy Solution, Samsung SDI), with no sign of money crowding into any one industry. On the selling side are Hyundai Motor (KRW 11.36tn), SK Square (KRW 7.44tn), Hyundai Mobis (KRW 3.75tn), LG Electronics (KRW 1.99tn) and KB Financial Group (KRW 1.69tn). SK Square is the holding company that owns 20.01% of SK hynix, so it can be seen as sold for the same reason as SK hynix. Foreigners did not sell only the two stocks; they cut their weight in Korean stocks as a whole, and the two stocks were the largest part of it.
The KOSDAQ is a little different. Foreigners net bought KRW 2.07tn on the KOSDAQ this year. Their biggest buys were FADU (KRW 0.72tn), Koh Young (KRW 0.39tn), HPSP (KRW 0.38tn), EcoPro BM (KRW 0.37tn) and L&C Bio (KRW 0.34tn), a mix of chip design and equipment, battery materials and biotech. The size, though, is about one-hundredth of the KRW 209.05tn net sold on the KOSPI. Had foreigners dumped semiconductors wholesale, they would have sold the chip equipment makers too; instead they bought small and mid-sized chip-related KOSDAQ stocks bit by bit, which ties in with the “trimmed” reading later in this report.
After the peak they bought a few financials
Taking only the period from June 22, when the KOSPI peaked, to October 23, foreign net selling was KRW 91.36tn, of which Samsung Electronics (KRW 27.59tn) and SK hynix (KRW 50.49tn), together KRW 78.08tn, made up 85.5%. All other stocks combined were net sold by KRW 13.28tn. The biggest buys in this period were Woori Financial Group (KRW 0.96tn), LG Innotek (KRW 0.88tn), Korean Air (KRW 0.45tn), Mirae Asset Securities (KRW 0.42tn), SK Innovation (KRW 0.42tn), Hyundai Mobis (KRW 0.36tn), Korea Investment Holdings (KRW 0.34tn) and Hyundai Rotem (KRW 0.33tn). The biggest sales were SK Square (-KRW 3.34tn), Samsung Electro-Mechanics (-KRW 1.96tn), KB Financial Group (-KRW 1.04tn) and Doosan Enerbility (-KRW 0.99tn).
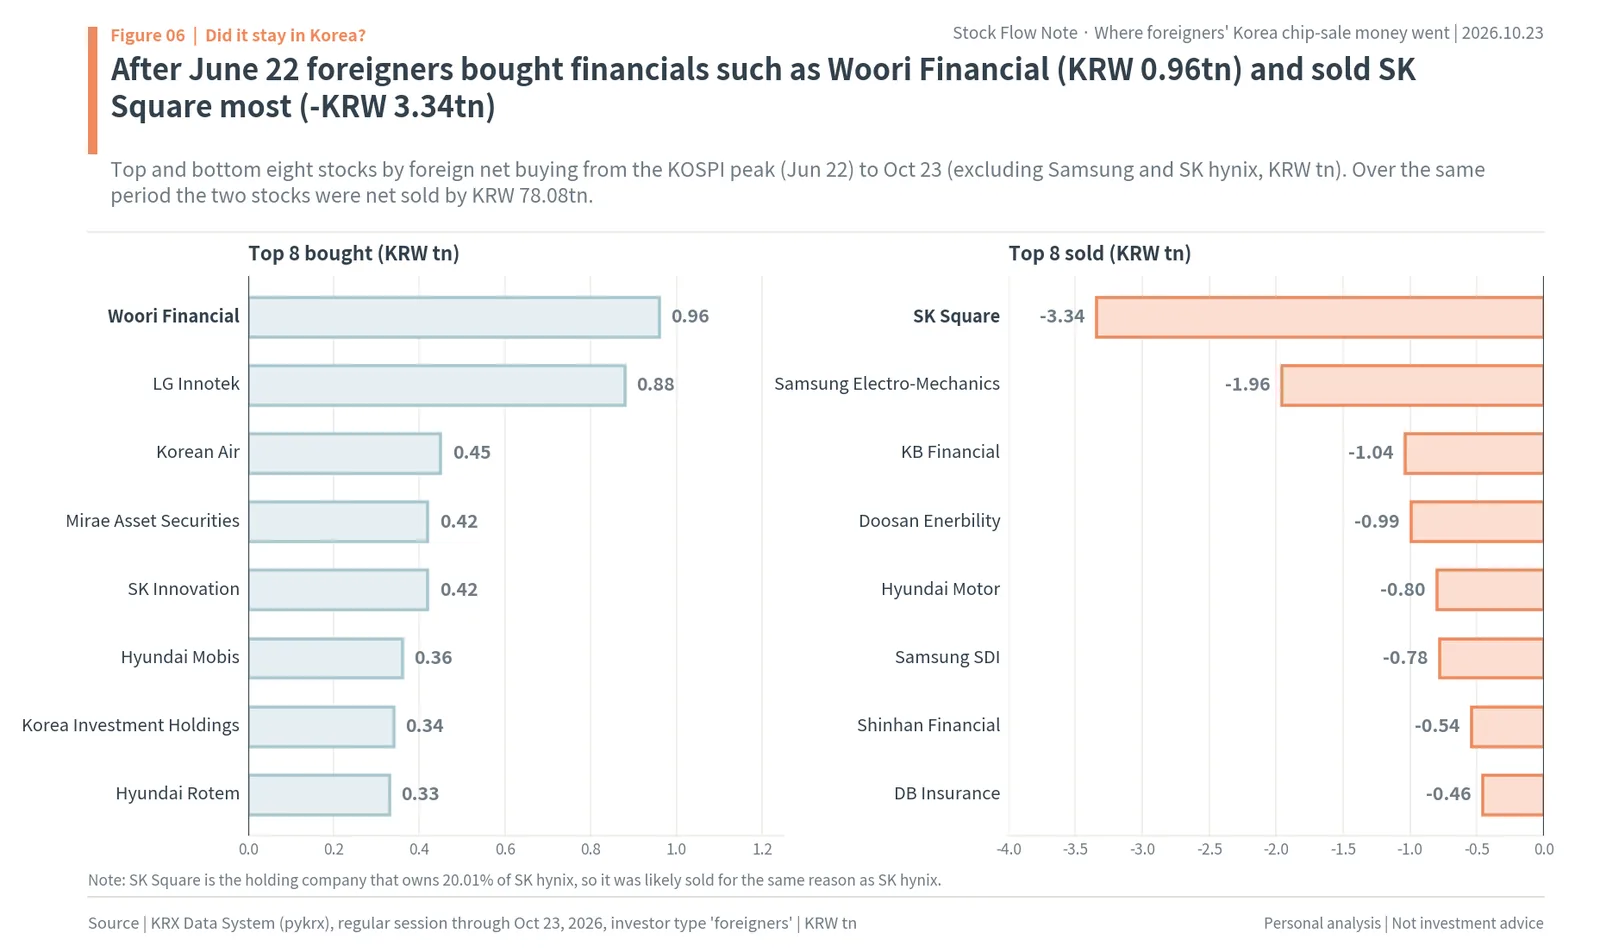
Among the stocks bought after the peak, a bank (Woori Financial Group) and brokerages (Mirae Asset Securities, Korea Investment Holdings) stand out. These industries earn more in years of heavy stock trading and high interest rates. Even so, the top buy, Woori Financial Group’s KRW 0.96tn, is 1.2% of the two stocks’ net selling over the same period. In October alone, foreigners sold KRW 19.03tn through the 23rd, and their biggest buys were Woori Financial Group (KRW 0.46tn) and Samsung E&A (KRW 0.29tn). Some money did rotate within Korea, but next to what was sold it is little more than a trace.
Bonds took money in during the first half and lost it from July to September
Consider whether the money moved into Korean bonds instead of stocks. Korean government bonds are being added to the FTSE World Government Bond Index (WGBI) this year. FTSE Russell said it would phase them in over eight months starting April 1 and finish in November, with Korea at 1.75% of the index once fully included. By the Ministry of Economy and Finance’s count, foreigners net bought KRW 37.3tn of Korean Treasury bonds on a trade basis from March 30 to June 26. By the Bank of Korea’s count, foreign bond flows were a net inflow of $9.28bn in January to June.
From July, though, money left bonds too. By the Bank of Korea’s count, bonds saw net outflows three months running, -$0.96bn in July, -$4.53bn in August and -$5.81bn in September, leaving January to September at -$2.02bn. By the FSS’s count, listed bonds saw a net withdrawal of KRW 4.74tn in August (maturities and sales exceeded new investment). The Bank of Korea cited Treasury bond maturities and the reversal of the short-term arbitrage incentive. The arbitrage incentive is the interest gap left, after hedging costs, when dollars are converted to won and put into Korean short-term bonds; when it turns negative, short-term bond money leaves.
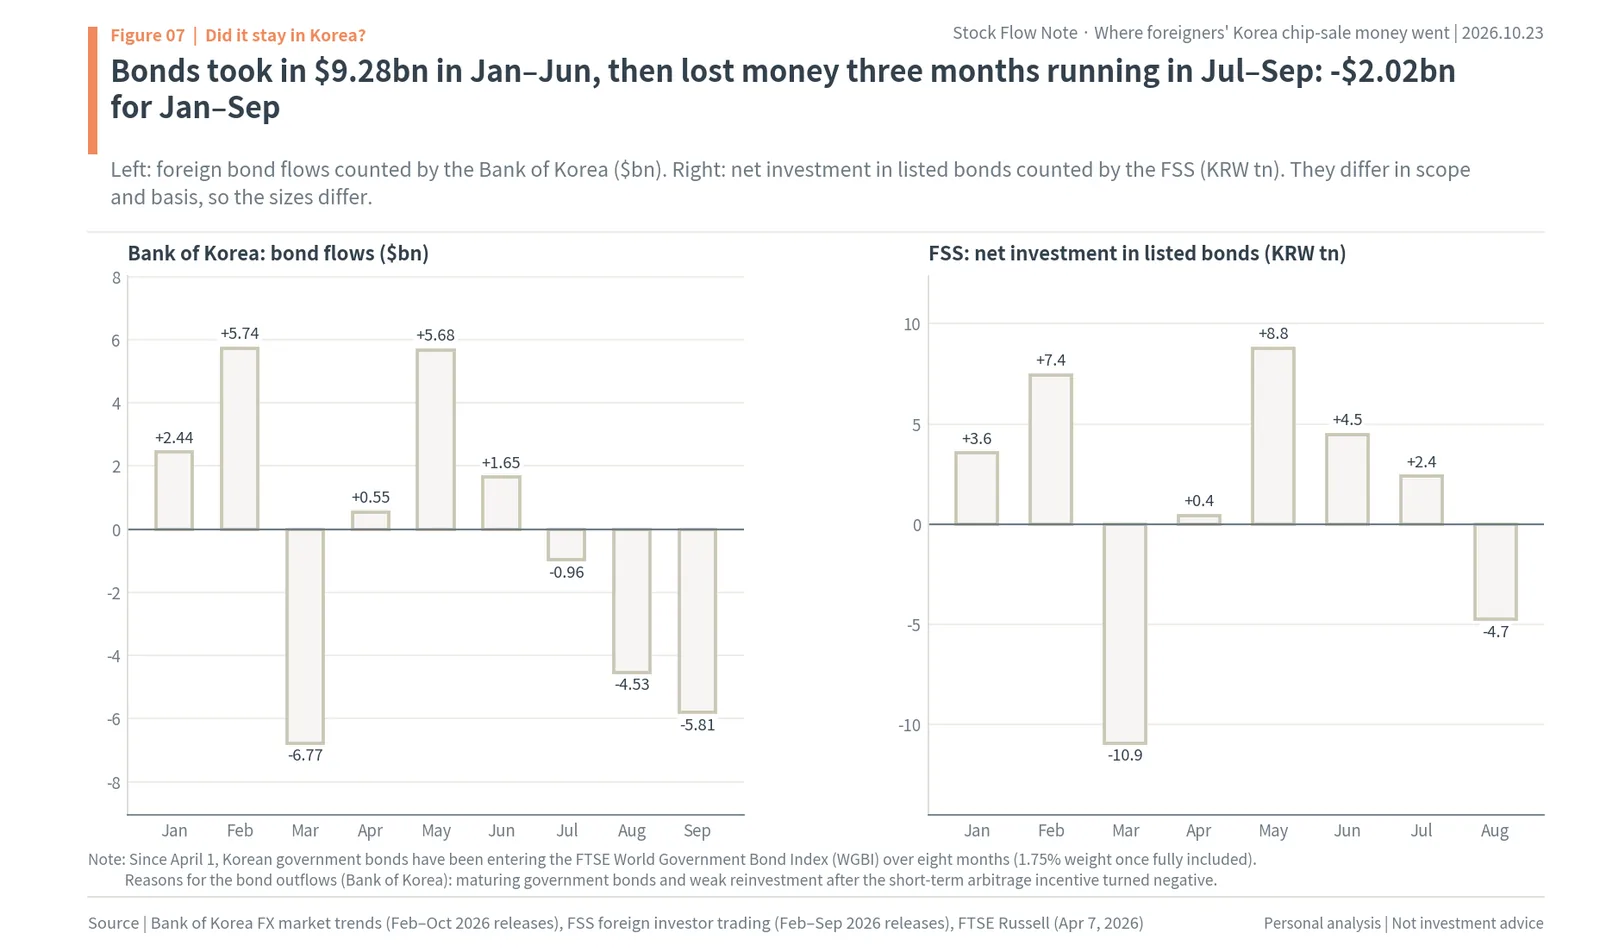
In short, the money that came into bonds was bond funds buying government bonds to track the index, a different pocket from the money that sold stocks. The timing does not line up either. In May and June, when foreigners sold the most stock, $7.33bn came into bonds by the Bank of Korea’s count, while equity outflows over the same two months were $64.20bn. And from July to September, as the stock selling continued, money left bonds as well. The money from selling stocks did not stay in Korean bonds.
Almost all of the money was converted to dollars and left Korea
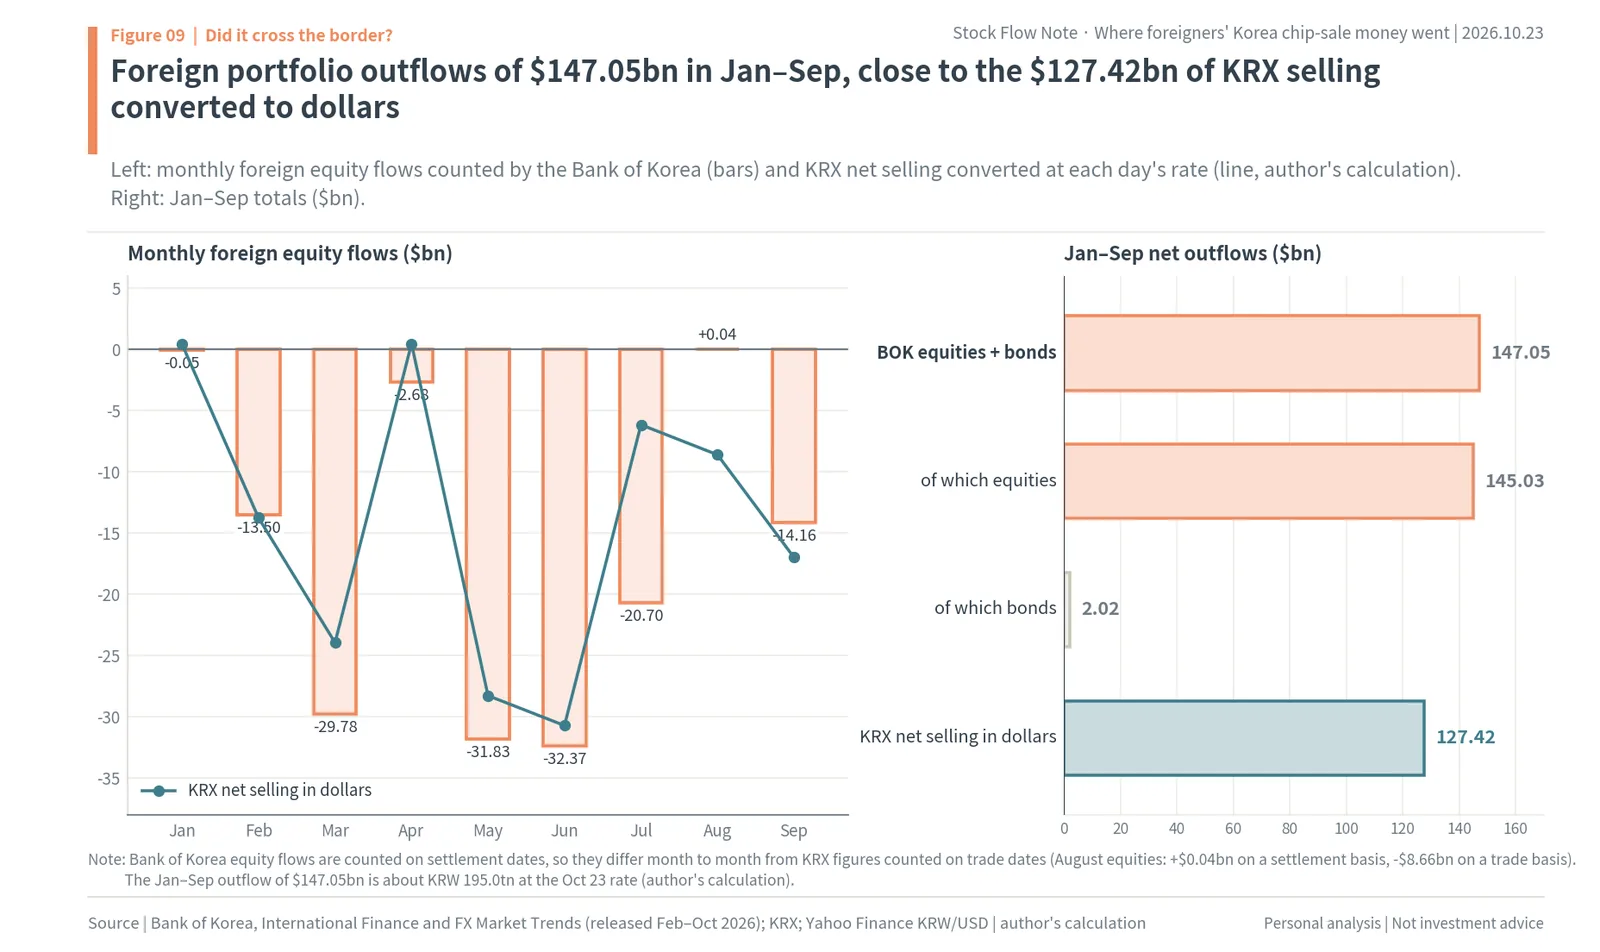
If the money did not stay in Korea, it must have crossed the border, and this the Bank of Korea counts directly. It adds up, in dollars, what foreigners put into and pulled out of Korean stocks and bonds, and publishes the totals every month in its International Finance and Foreign Exchange Market Trends. According to the October 16 release, foreign portfolio investment in January to September was a net outflow of $147.05bn: $145.03bn from stocks and $2.02bn from bonds. At the October 23 rate (KRW 1,326.0), that is about KRW 195.0tn, close in size to the KRW 206.97tn foreigners sold on the exchange (author’s calculation).
Month by month, the Bank of Korea’s equity flows were -$13.50bn in February, the largest monthly outflow on record at the time, and the record kept being broken: -$29.78bn in March, -$31.83bn in May and -$32.37bn in June. Another -$20.70bn left in July. August paused briefly at +$0.04bn on a settlement basis before September grew again to -$14.16bn. Converting KRX foreign net selling over the same period into dollars at each day’s won-dollar rate gives $127.42bn for January to September (author’s calculation), 87.9% of the Bank of Korea’s equity outflow of $145.03bn.
Putting the Bank of Korea’s monthly explanations together shows how the character of the selling changed. January was “profit-taking on the share price rise,” and in February “caution over AI investment” was added to profit-taking. In March profit-taking overlapped with a wish to avoid Middle East geopolitical risk, and in April sentiment recovered a little after the U.S.-Iran ceasefire agreement and outflows shrank. May was “portfolio rebalancing and profit-taking,” and June was “caution over global AI investment” and “adjusting the weight of domestic stock holdings.” July was Middle East tension and caution over AI investment, August paused on “solid results at U.S. tech companies,” and September was “rising global long-term interest rates and worries about slowing AI investment.” In the first half the selling trimmed stocks that had risen a lot; in the second half it was selling mixed with interest rates and doubts about AI.
The bars on the left of the figure are the Bank of Korea’s monthly equity flows, and the teal line is KRX net selling converted to dollars. The two count the same money at different doors, so they differ month to month. The Bank of Korea uses the settlement date, so the money from shares sold at the end of a month shows up the next month. The Bank of Korea itself said August equity flows were +$0.04bn on a settlement basis but -$8.66bn on a trade basis. Over nine months, though, the two numbers converge to similar sizes. Most of the money foreigners got from selling on the exchange can be read as converted into dollars and gone from Korea.
Yet the won got stronger
One thing looks odd here. When foreigners sell stocks and convert the proceeds into dollars to leave, they sell won and buy dollars, so the won should weaken. Until June it did. The won-dollar rate rose from KRW 1,437.9 at the end of last year to KRW 1,554.5 on June 8. After that it moved the other way, reaching KRW 1,326.0 on October 23. Against the June high, the won’s value against the dollar rose 17.2% (author’s calculation). The won strengthened most from July to October, while the foreign selling continued.
The answer is dollars that came in through another door. Bank of Korea current account data show a surplus of $279.2bn in January to August, mostly semiconductor export earnings. Foreign portfolio outflows over the same period were $127.08bn. The dollars coming in were 2.2 times the dollars going out (author’s calculation). On October 16 the Bank of Korea attributed September’s fall in the won-dollar rate to “more dollar selling by exporters,” and the Monetary Policy Board’s October 22 decision statement said the exchange rate had fallen considerably, helped by better foreign exchange supply and demand from the large current account surplus.
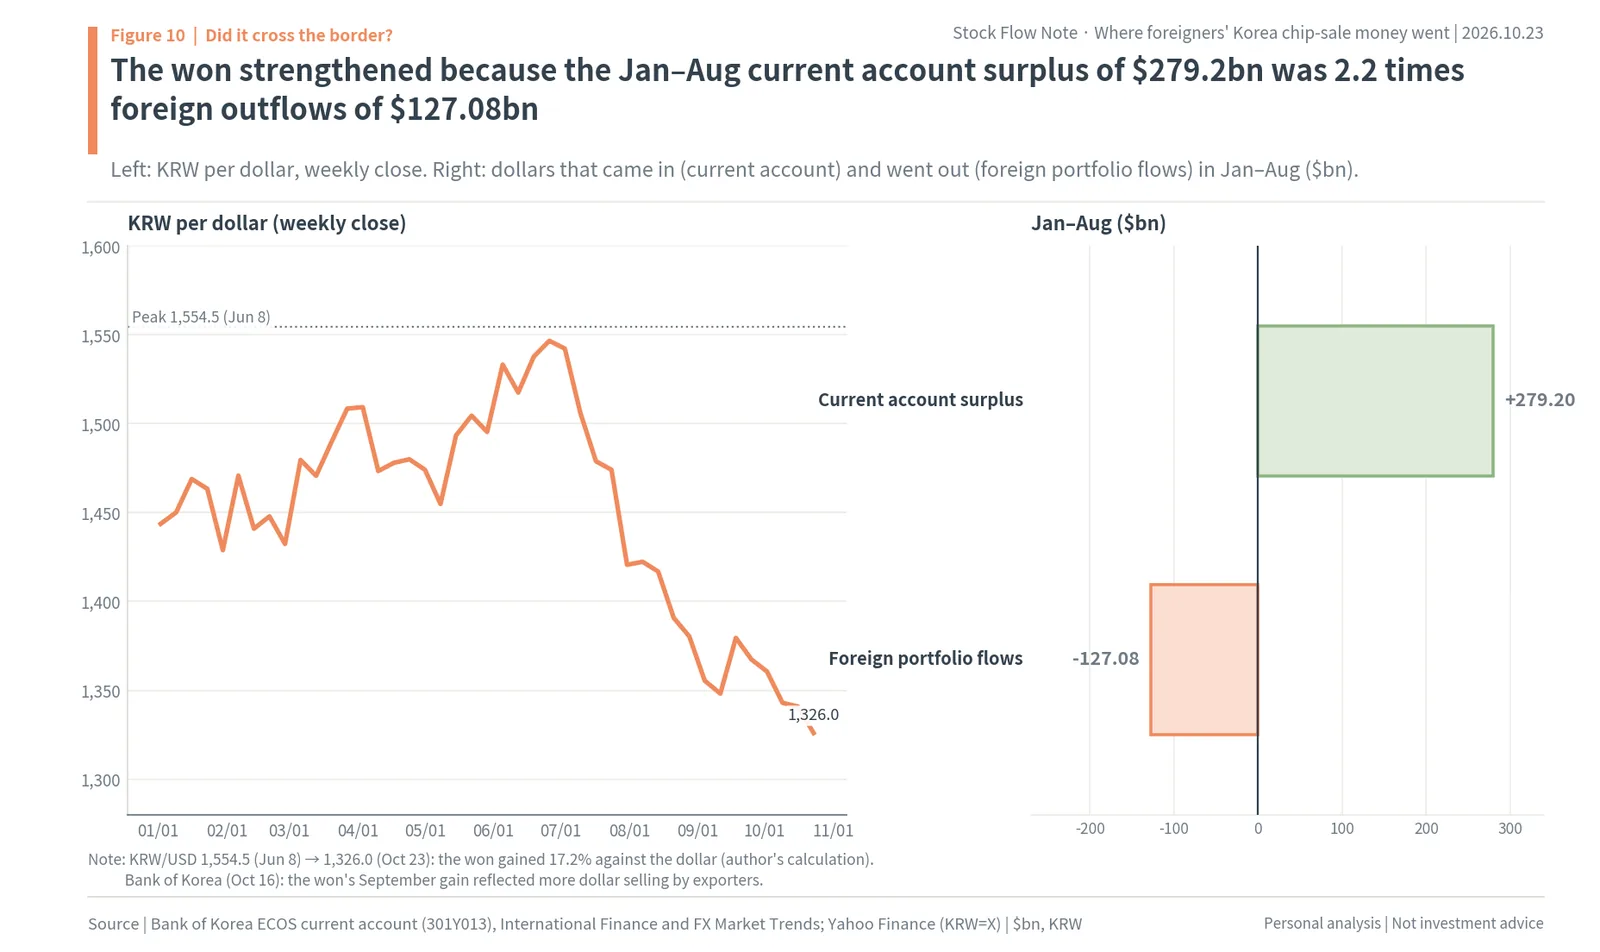
What this figure says is that reading the exchange rate alone as “foreign money did not leave” is a mistake. Foreign money left, and even more dollars came in from the companies that sold chips. From the foreign side, shares sold after the won strengthened turned into more dollars. Changing the same amount of won on October 23 rather than June 8 yields 17.2% more dollars. Even shares sold at a loss in won lost less in dollars.
U.S.-registered money sold in the first half, U.K.-registered money in July and August
The FSS discloses foreign trading by nationality. Only each month’s top net-selling and net-buying countries have been reported, but the pattern is clear. U.S.-registered money sold KRW 7.80tn in January, KRW 8.7tn in February, KRW 9.5tn in March, KRW 28.86tn in May and KRW 23.18tn in June. In May the U.S. alone accounted for more than half of all foreign net selling. In July, though, the U.S. turned to net buying of KRW 3.45tn, and in August KRW 13.4tn. U.K.-registered money, by contrast, sold KRW 16.3tn in March, KRW 32.2tn in June, KRW 20.24tn in July and KRW 16.9tn in August. U.S. net buying in July and August was +KRW 16.85tn, and U.K. net selling from June to August was -KRW 69.34tn (author’s sums).
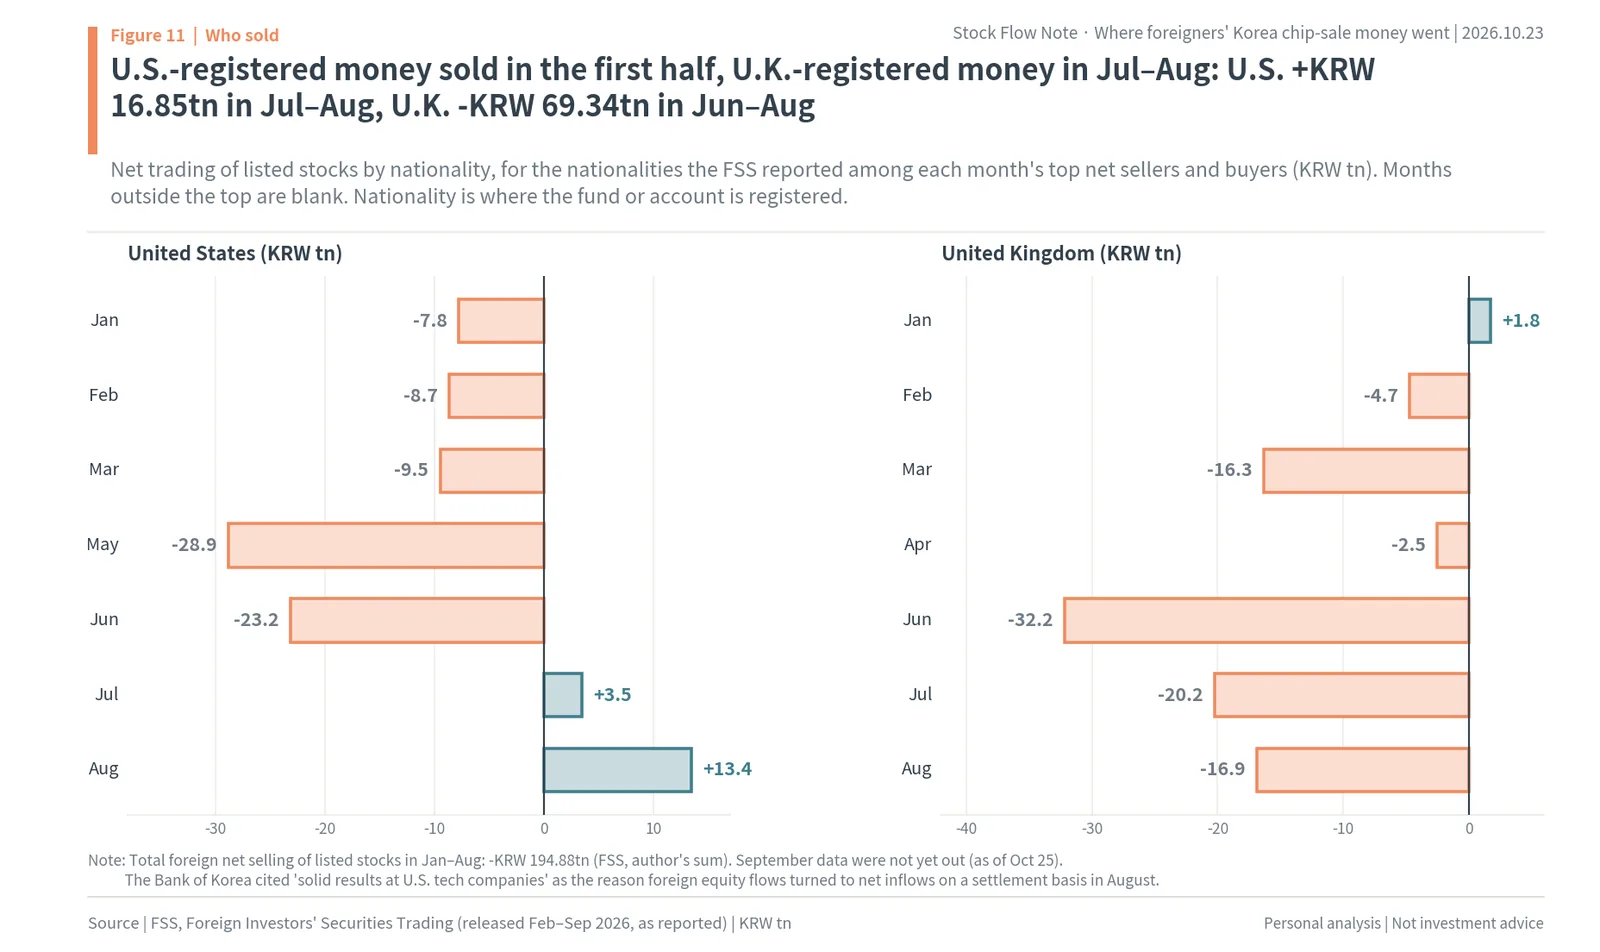
Nationality is where a fund or account is registered, so it does not necessarily match the home country of the actual asset manager. Still, the record shows that until June, U.S.-registered money, which holds more than 40% of foreign-held Korean stocks, led the selling, and that from July the U.S. side bought again while the U.K. side kept selling. By the FSS’s count, U.S.-registered holdings of Korean stocks were KRW 1,222.3tn at the end of June (42.0% of all foreign holdings). The Bank of Korea cited “solid results at U.S. tech companies” as the reason foreign equity flows turned to a net inflow on a settlement basis in August. Even among foreigners, where the money went depends on who sold, and that is where the next chapter starts.
Foreign investors do not all follow the same rules: passive funds, EM funds, global funds, hedge funds and sovereign funds
To see where the money that left went, “foreigners” first has to be split. KRX data put foreigners in a single column, but money with completely different rules is mixed inside it. By the FSS’s count, foreign-held Korean stocks at the end of June by nationality were U.S. KRW 1,222.3tn (42.0%), Europe KRW 899tn (30.9%), Asia KRW 411.2tn (14.1%) and the Middle East KRW 60.6tn (2.1%). More important than nationality, though, are the rules the money moves by. Different rules mean different places the sale proceeds can go.
First is passive money: index funds and ETFs that simply track an index. This money holds stocks at their index weights, so it does not change weights when prices rise or fall. It has no reason to sell on its own and sells only when its own investors withdraw. SK hynix’s list of shareholders above 5% includes BlackRock Fund Advisors (5.00%, reported February 20). Interestingly, this side’s money is actually coming in. By EPFR’s count, Korea equity funds (including ETFs) took in $1.1bn in the week to October 14 and $5.8bn in the week to October 21, the latter the most since July. BofA calculated that at the current pace inflows to Korea funds this year would run at an annualized $76bn, a record.
Second are active emerging market funds. They use the MSCI EM index as their benchmark and choose which countries to hold more or less of than the benchmark. When Samsung Electronics and SK hynix soar, Korea’s index weight grows, and funds that already hold a lot of Korea sell to reduce the risk of concentration in one country and two stocks. These funds cannot take the proceeds out of emerging markets. Their benchmark is the EM index, so if they trim Korea they have to add other emerging markets such as Taiwan, India, Brazil and China. Capital Group of the U.S., which had held more than 5% of SK hynix, cut its stake by more than half, from 7.23% in July 2025 to 3.53% in June 2026 (5% holding reports on DART, Korea’s electronic corporate disclosure system).
Third are global funds. They can buy any country, so they can move money from Korea into U.S., Japanese or European stocks, into bonds or into commodities. The BofA fund manager survey mostly shows what these managers think. Fourth are hedge funds. They trade with borrowed money too, so they cut quickly when losses mount. Goldman Sachs prime brokerage data showed that in the five days to October 15 hedge funds cut their tech exposure at the fastest pace since the data began in 2016, with semiconductors the largest amount cut. Bloomberg reported that around the same time hedge funds sold Goldman Sachs’s AI basket five days in a row and moved the money into health care and consumer staples.
Fifth are sovereign wealth funds and pension funds. This is money that looks decades ahead and keeps set ratios, so it trims after big rises and adds after big falls. The FSS’s nationality data show months when such money moved against other countries. In May, when U.S.-registered money sold KRW 28.86tn, Norwegian-registered money net bought KRW 2.29tn, and it had also bought KRW 1.7tn in April. As for who actually sold how much, June data from the U.S. custody bank BNY offer one clue. Of June’s net selling of Korean stocks, mutual funds accounted for $7.5bn, pensions $4.35bn and hedge funds $1.87bn. The main sellers in the first half were asset managers’ funds and pensions rather than short-term money.
Split this way, “where did the money foreigners sold go?” is not one question but five. Passive money is actually coming in, EM fund money stays inside emerging markets, global fund and hedge fund money goes to other sectors, countries and assets, and sovereign funds move by their ratios. The next two chapters follow the two largest streams, the money of EM funds and of global funds.
Path 1: EM fund money left Asia for Brazil, and in October also went into China funds
EM funds use the MSCI EM index as their benchmark. Korea’s weight in that index went from 10.97% at the end of September 2025 to 21.4% on September 30, 2026, 1.95 times as large (Seoul Economic Daily and MSCI; author’s calculation). As of September 30, Taiwan was 28.94%, China 19.8% and India 10.65%, and Samsung Electronics (7.55%) and SK hynix (5.90%) alone added up to 13.45%. When prices rise, a country’s index weight grows by itself. Passive funds that track the index leave it alone, but active funds have to reduce the risk of concentration in one country and two stocks. That is exactly the “adjusting the weight of domestic stock holdings” the Bank of Korea cited for June’s outflow. So where inside emerging markets did the trimmed money go? People often say “if it’s AI, then Taiwan,” but foreigners sold Taiwanese stocks too.
By the count of Taiwan’s Financial Supervisory Commission, foreigners (including mainland Chinese investors) net sold NT$570.676bn of listed and OTC Taiwanese stocks in June and NT$652.854bn in July. They bought only in August, NT$222.235bn, then sold NT$86.27bn in September and NT$662.06bn on October 1 to 19. This year’s net selling passed NT$2tn for the first time by October 19, and the NT$302.555bn sold on October 15 was the largest single-day net sale on record. Reuters’ dollar count (LSEG data) agrees. Foreign net selling across seven Asian markets in January to June was $137.36bn, the fastest pace since the data began in 2010, of which Korea was $70.8bn and Taiwan $29.6bn. In July Taiwan, at $22.95bn, was sold more than Korea ($6.26bn). India was no exception: by the count of NSDL, India’s National Securities Depository, foreign portfolio equity investment from January 1 to October 23 this year was a net outflow of $32.79bn.
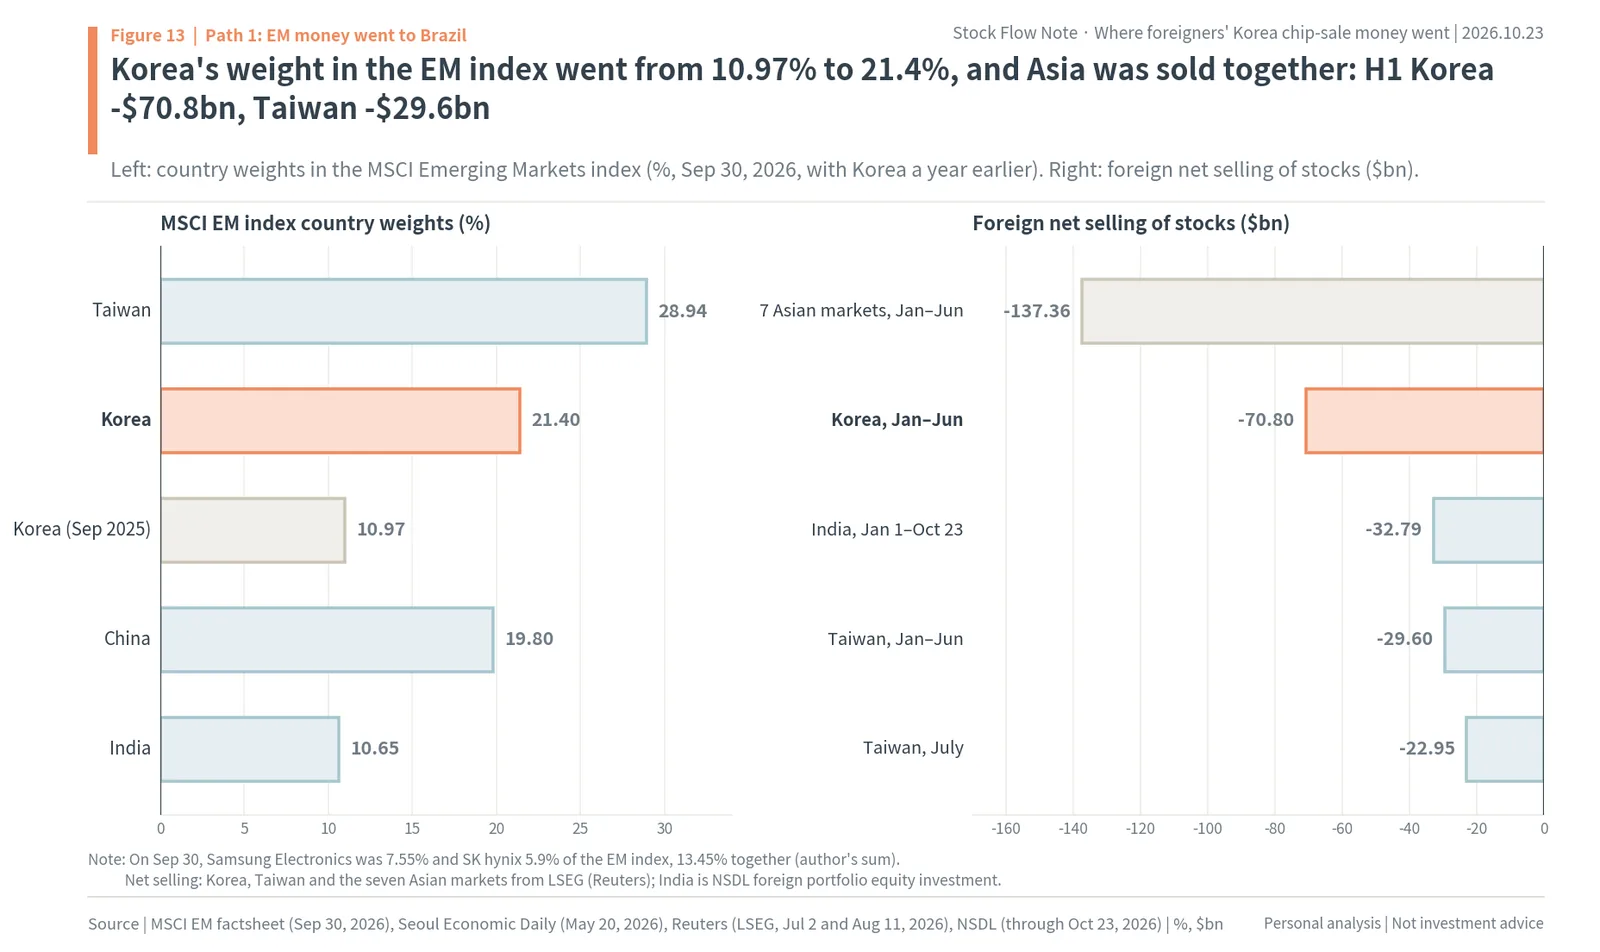
The left of the figure shows country weights in the EM index, and the right shows foreign net selling. Korea and Taiwan, Asia’s AI chip markets, were sold together, and India lost money too. The U.S. bank BNY described June’s selling of Korea as “rebalancing and profit-taking, not a broad rejection,” meaning foreigners were adjusting weights and taking profits rather than abandoning Korea wholesale. In the same report, analysts said the money may have been hedged, sent home or moved out of Asia. In Taiwan, though, foreign remittances hit a record net inflow of $108.39bn in January to September even as stocks were sold. Money from selling stocks moves alongside other money (bonds, deposits and so on), so equity flows should not be read from currency flows alone.
Brazil was different
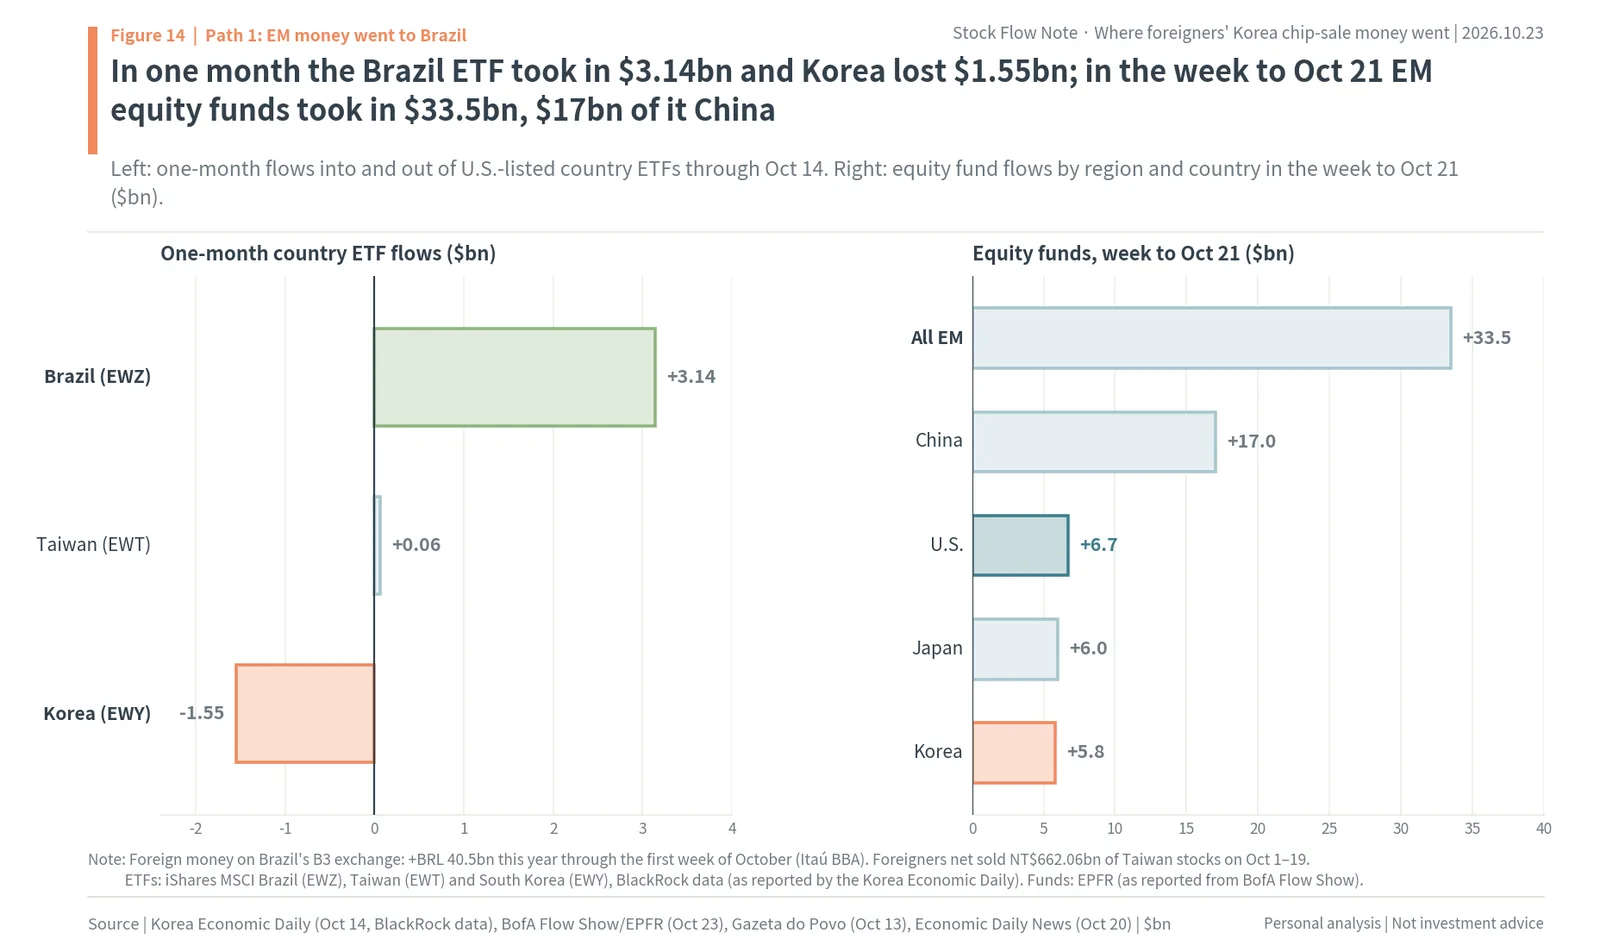
Inside emerging markets, the place foreign money clearly went into was Brazil. By Itaú BBA’s count, foreign money on Brazil’s stock exchange, B3, was a net inflow of BRL 40.5bn this year through the first week of October. It was BRL 32.03bn through September, and BRL 13.1bn came in during the first week of October alone. In August BRL 18.12bn left, the largest outflow since 2021, before September turned to a net inflow of BRL 9.11bn, and on October 5, the day after the first round of the presidential election, the single-day inflow hit a record. In U.S.-listed ETFs, the Brazil ETF (EWZ) took in $3.14bn in the month to October 14 while the Korea ETF (EWY) lost $1.55bn and the Taiwan ETF (EWT) took in only $0.06bn (BlackRock data, reported by the Korea Economic Daily). JPMorgan raised its rating on Brazilian stocks by one notch. And in October money came back into EM equity funds as a whole. By EPFR’s count, EM equity funds took in $33.5bn in the week to October 21, a fourth straight week of inflows, and China funds took $17bn of it, the most since July.
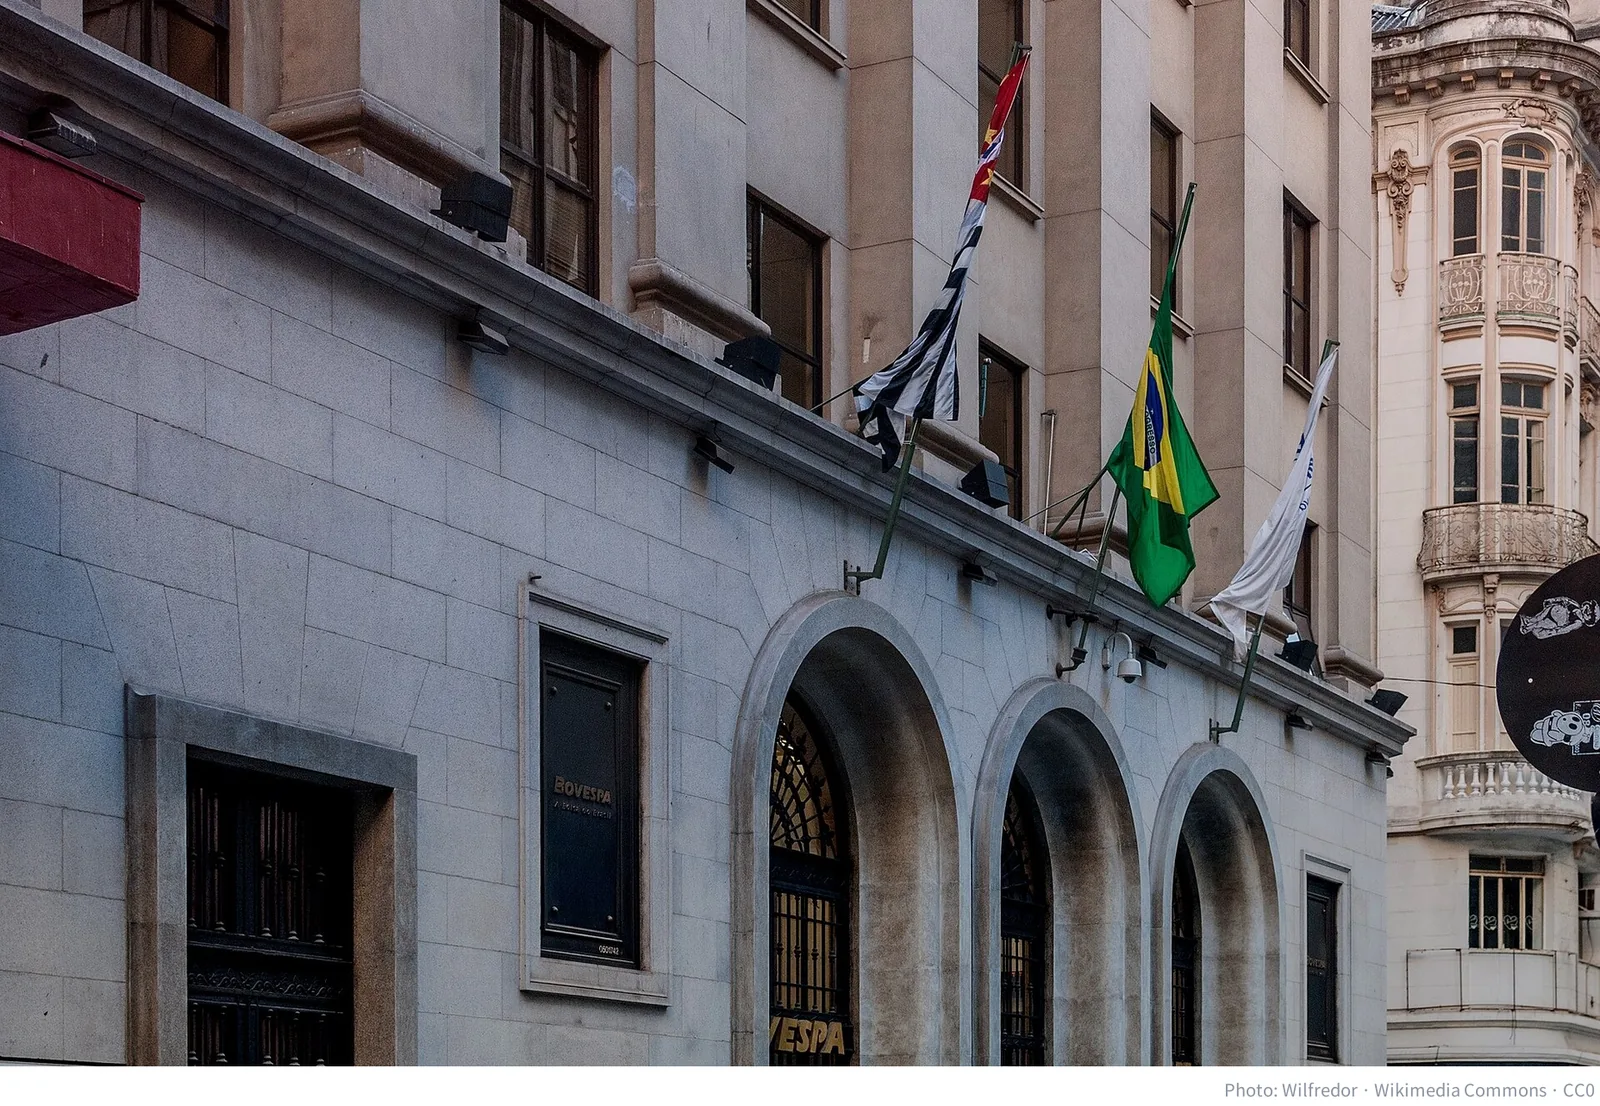
There are three likely reasons money flocked to Brazil (author’s interpretation). One is that it is an emerging market with a small weight in AI chips. Another is that, as an exporter of oil and minerals, it benefits from higher oil prices. The last is the election calendar. In that same month Brazil’s Bovespa index rose 12.6%, while Taiwan’s index fell 2.9% and the KOSPI fell 12.5%. Brazil’s stock market, represented by the Sao Paulo exchange B3, was this year a stage for foreign buying rather than selling.
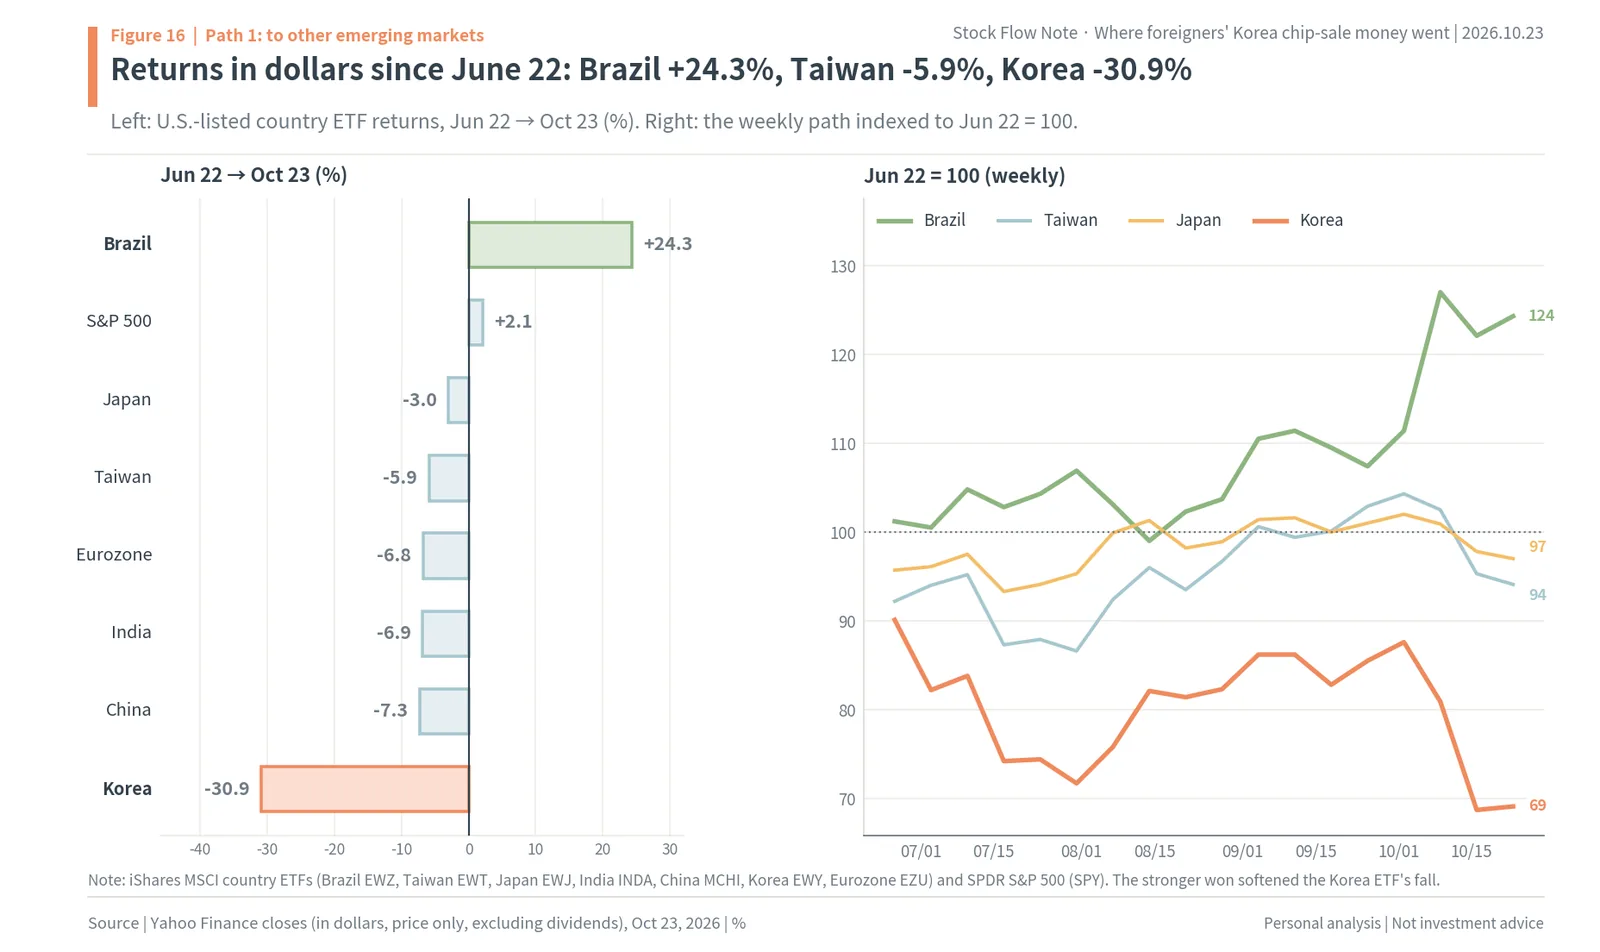
Measured in dollars over the four months since June 22, the gap is even clearer. By U.S.-listed country ETFs, Brazil rose 24.3% and the S&P 500 2.1%. Japan was -3.0%, Taiwan -5.9%, the eurozone -6.8%, India -6.9% and China -7.3%, and Korea fell the most, at -30.9%. Because the won strengthened in the meantime, Korea’s fall in dollars is smaller than the KOSPI’s (-39.1%).
What stands out is where fund managers’ words and the money’s path part ways. In BofA’s August Asia fund manager survey, the markets named as the biggest beneficiaries of the next phase of AI were Taiwan (27%), Japan (23%), and China and the U.S. (18% each), with Korea fifth at 9%. Yet actual money left Taiwanese stocks too. The reading that fits the numbers is that EM fund money trimmed Asia’s AI chip markets as a whole and then moved to Brazil, with its small AI weight, and in October to China.
Path 2: global funds did not abandon AI; they cut their chip concentration and moved to other AI and to Japan
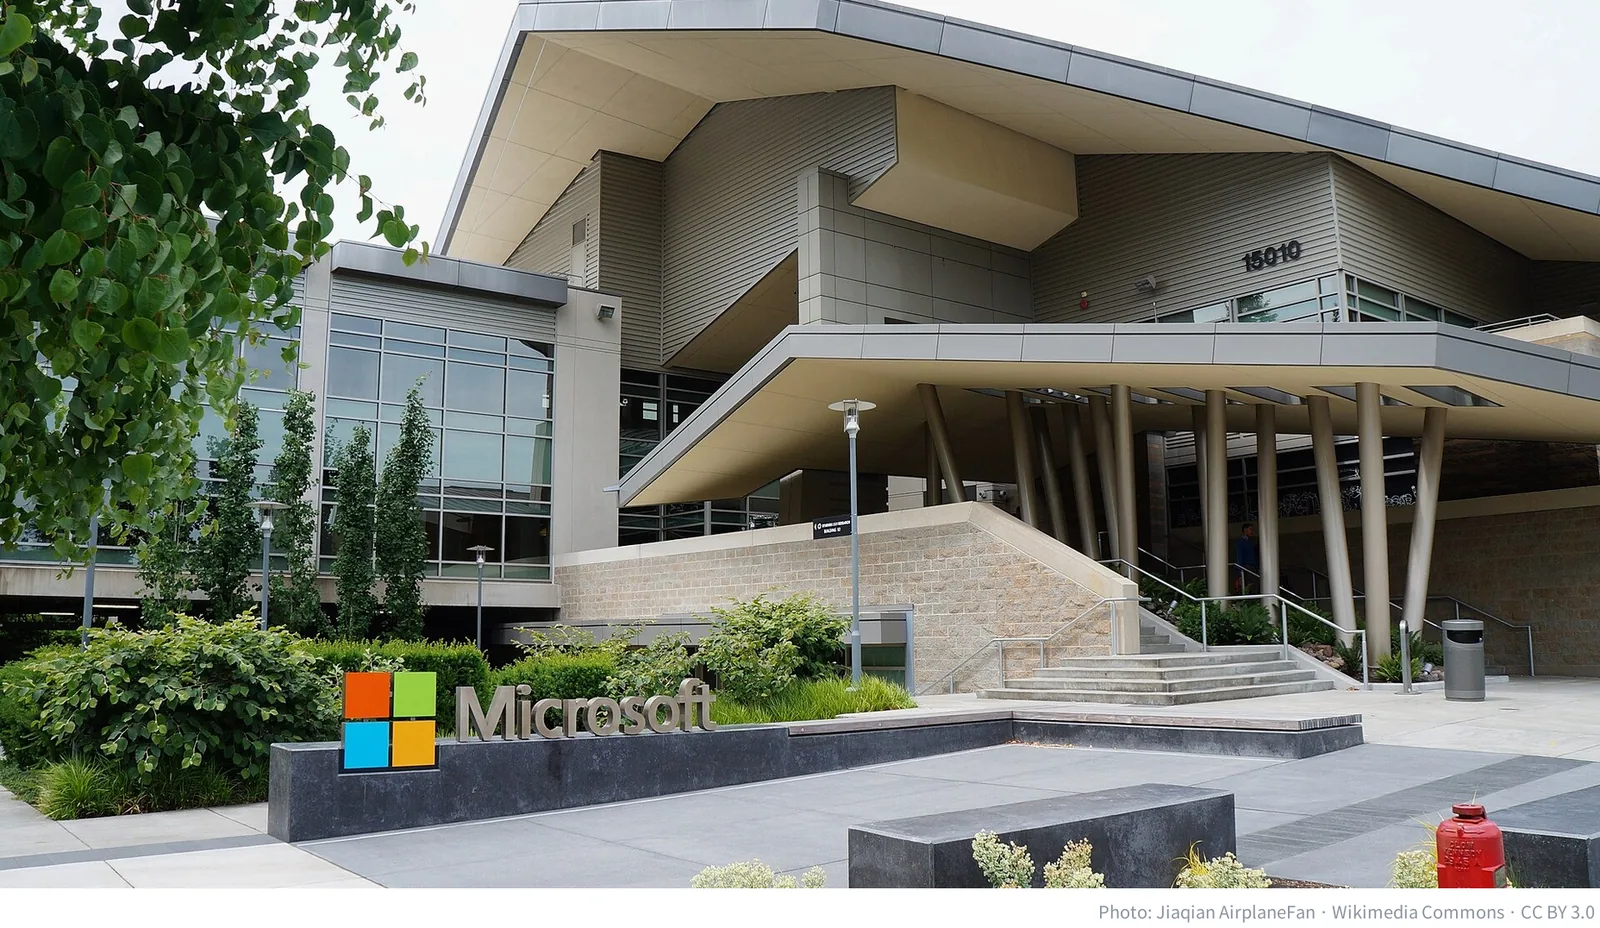
Global funds, which can buy stocks in any country, have more choices than EM funds. What they bought with the money from selling Samsung Electronics and SK hynix can be inferred from two sources: the monthly BofA allocation survey of fund managers, and EPFR’s weekly fund flows. Both point the same way. Money came out of the chip concentration but did not leave tech. Over the same period since June 22, the U.S. semiconductor ETF (SOXX) fell 27.0% while Microsoft rose 42.8%.
The share of fund managers in the BofA survey naming long semiconductors as the “most crowded trade” rose to 73% in May, 80% in June and a record 82% in July, then fell to 53% in August and September and 45% in October. The crowding eased. Yet in the same October survey the net overweight in tech rose from +30% in September to +37%, the highest since August 2020. Managers saw semiconductors as less crowded but held more tech. Second and third among the crowded trades were short U.S. Treasuries (27%) and long Magnificent 7, the seven largest U.S. tech stocks (up from 7% in September to 16%). By region, the net overweight in U.S. stocks fell from +25% in September to +11% in October, and Japan rose from -1% to +9%. Emerging markets slipped from +38% to +34% but are still heavily held. By sector, health care is at +23% and consumer staples at -32%.
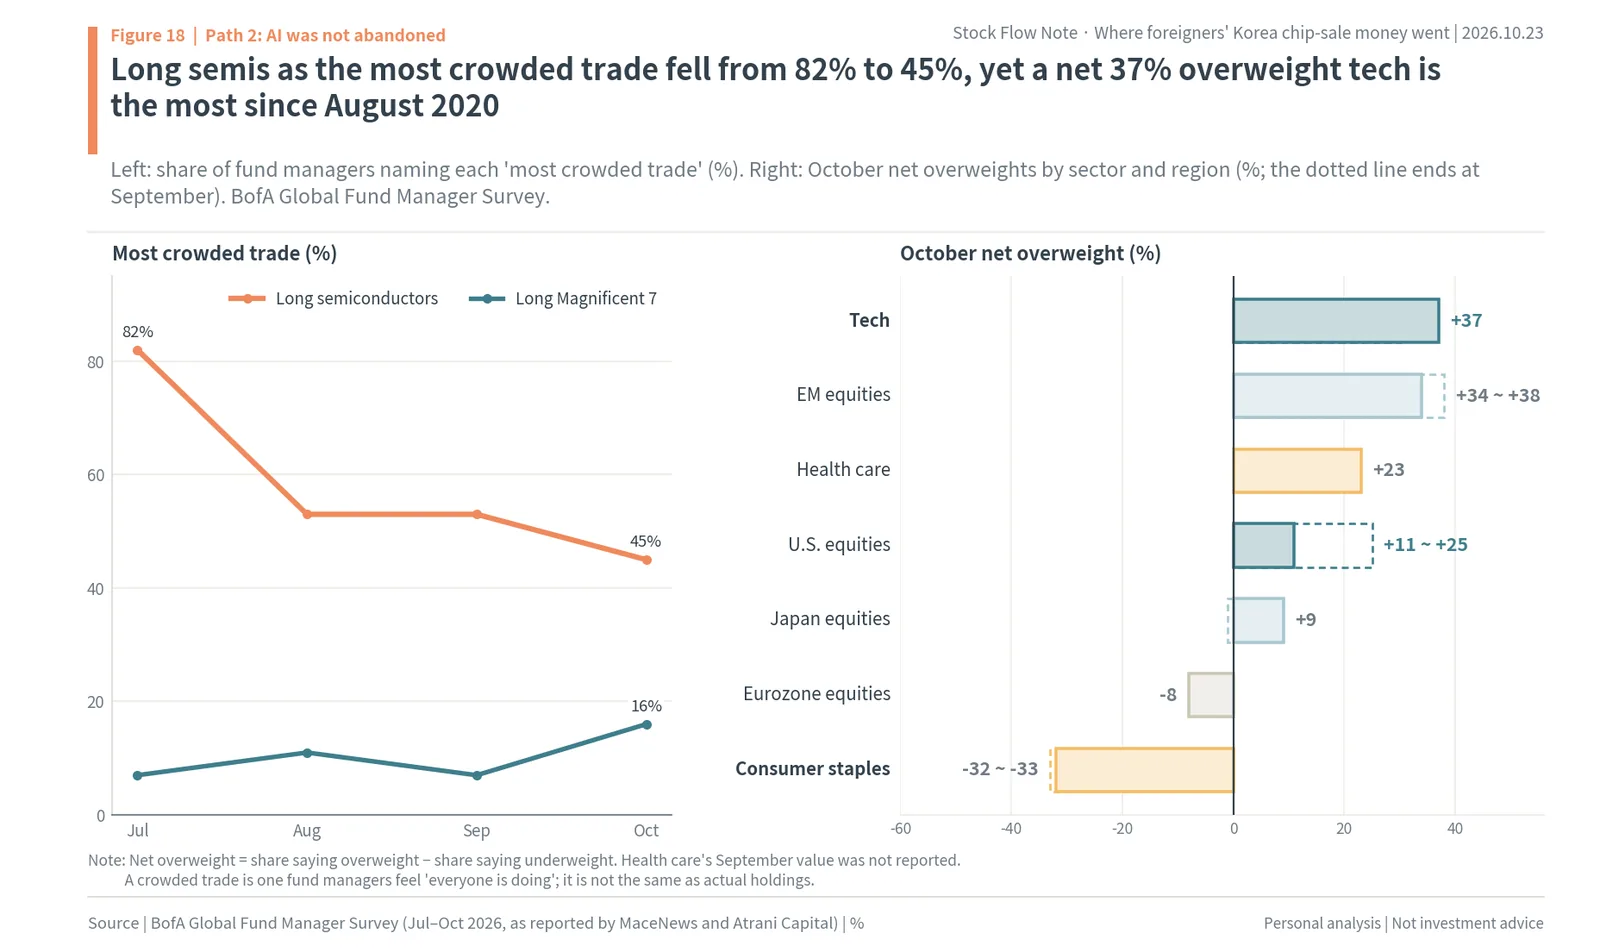
Fund flows point the same way. By EPFR’s count, tech funds took in $18.8bn in the week to October 21, the most since July, after $10.7bn the week before. BofA calculated that at the current pace tech fund inflows this year would reach a record $196bn, more than double the $75bn of 2025. The reading that fits the numbers is that foreigners sold Korean memory not to get out of AI but to spread weight that had piled up in one corner of AI to other places.
Not all big U.S. tech stocks rose equally, though. While Microsoft rose 42.8% after June 22, Nvidia was up 1.1% and Alphabet was -8.4%, and an equal-weighted ETF of the Magnificent 7 (MAGS) rose 9.5%. The Nasdaq 100 was -4.5%, TSMC’s U.S. depositary receipts -10.5% and Micron -27.6%. Even within AI, money seems to have left the parts whose profits swing widely with the cycle, such as chips and memory, for the parts whose profits build up steadily, such as cloud and software (author’s interpretation). The Magnificent 7 climbing back to third among the most crowded trades fits the same pattern.
Equities trimmed, bonds and commodities added, cash unchanged
Across assets, fund managers’ net overweight in equities hit +56% in August, the highest since November 2021, then fell to +49% in September and +44% in October. The net position in bonds became less negative, from -48% in September to -37% in October, and bonds were the asset added most in October. The commodity overweight was +11% in July, +24% in August, +19% in September and +21% in October. Cash fell from 4.1% in June to 3.5% in August and stood at 3.9% in September and October. BofA treats cash at or below 4.0% as a “sell signal” for stocks, because low cash means little money left to buy more.
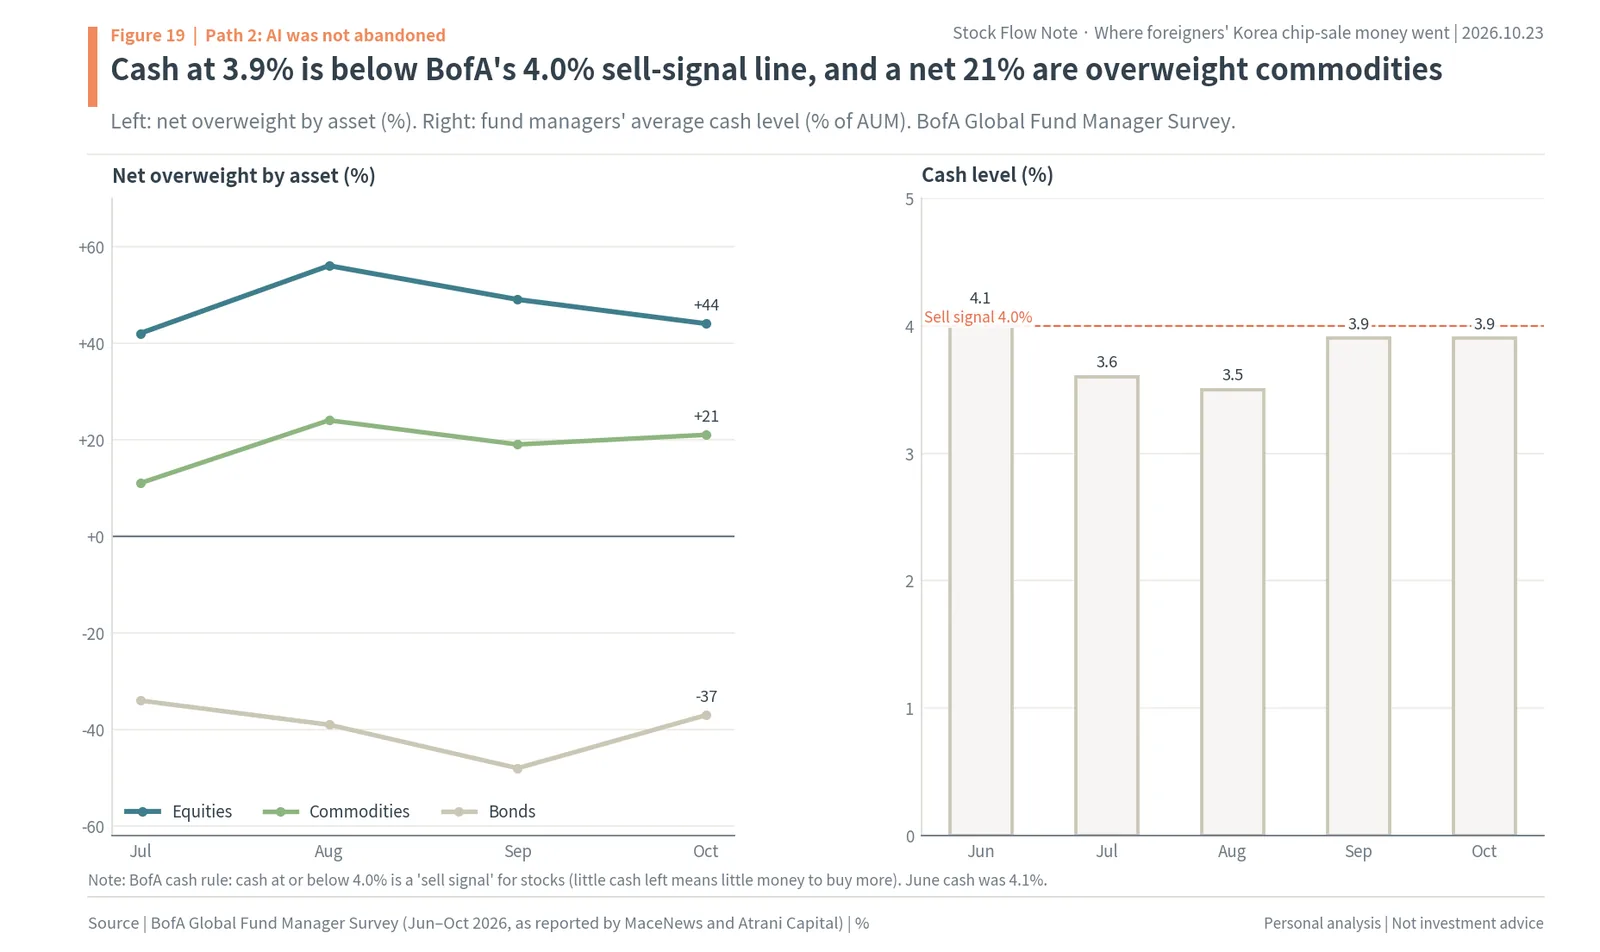
This figure shows where the sale proceeds were mainly placed. Managers trimmed equities a little and added a little to bonds and commodities, but cash stayed low. Rather than piling up the proceeds from Korean memory as cash, fund managers moved them straight into other assets.
Japan was one of the places they added
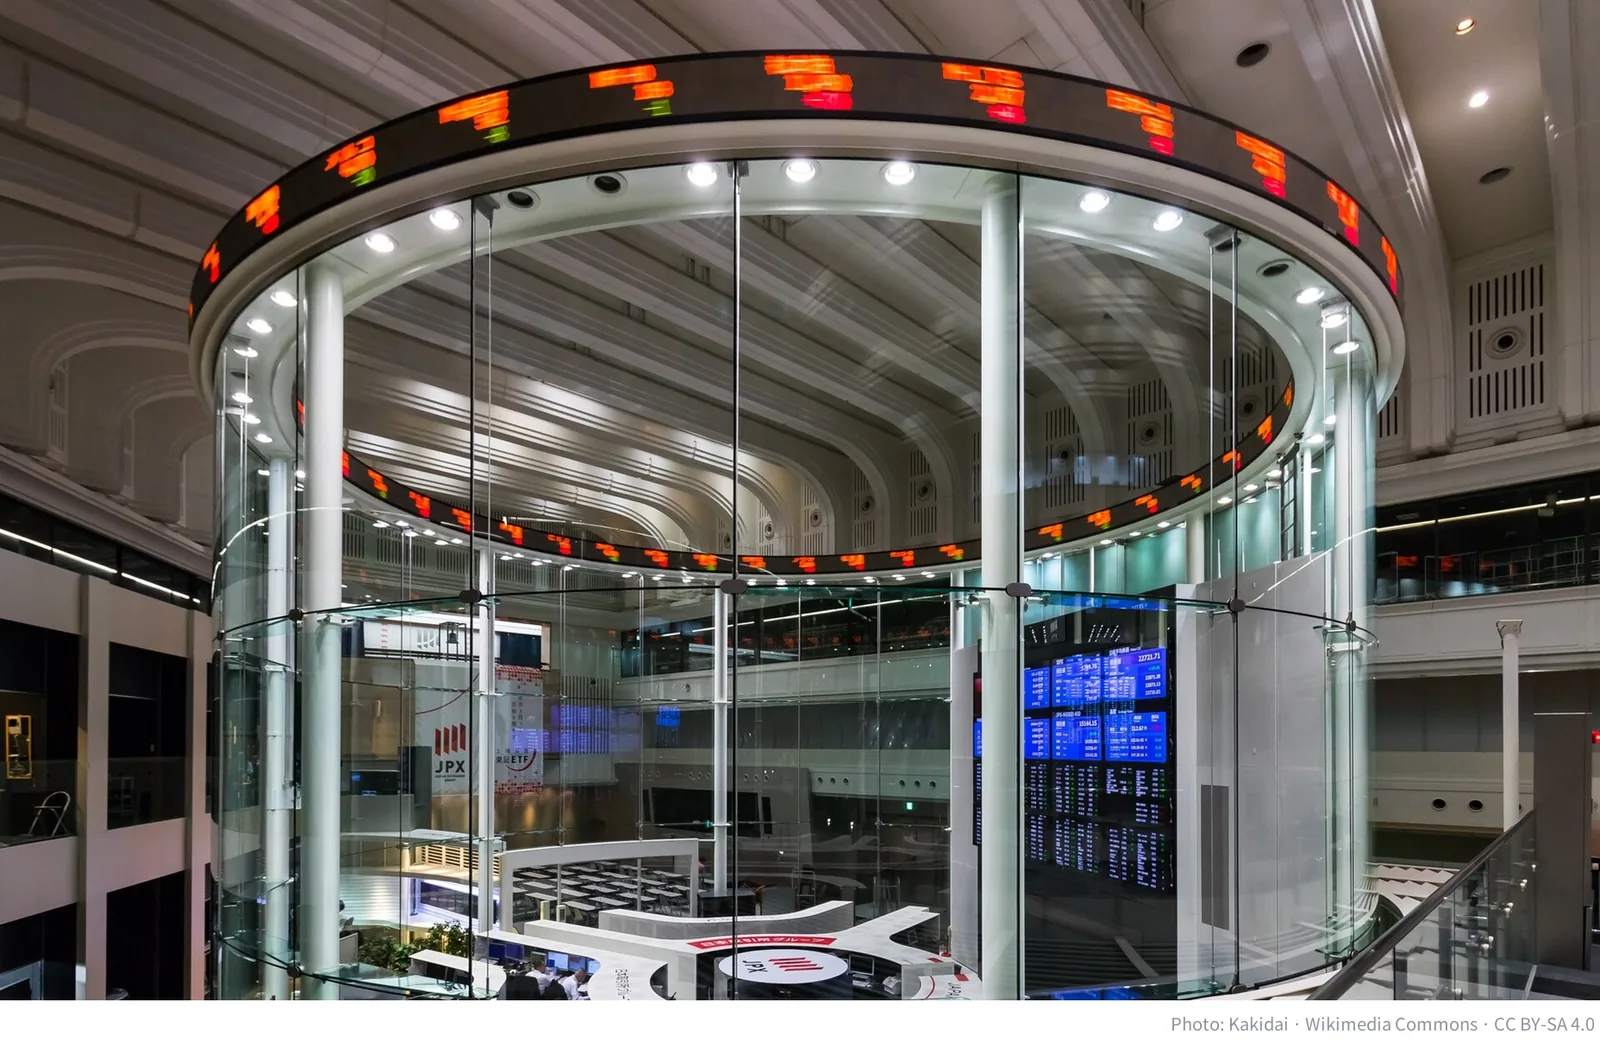
In the October survey, the net position in Japanese stocks swung from underweight to overweight, from -1% in September to +9%. By EPFR’s count, Japan equity funds lost $3.3bn in the week to October 7, then took in $6.0bn in the week to October 21. Japan was also the market where foreigners made record purchases of cash equities in the first half (Korea Economic Daily, July 2). But Tokyo Electron, Japan’s flagship AI stock, fell 39.2% after June 22, so the money that went to Japan did not go into chips.
One more number is worth noting. In BofA’s October Asia survey, memory was named the part of the AI chain with the best risk-reward, and that response rose from 20% to 30%. While the crowding eases, the view that memory has become cheap is growing as well. This point comes back in the chapter on signals of a return.
Did it go to Coca-Cola? Prices rose, but money left defensive funds
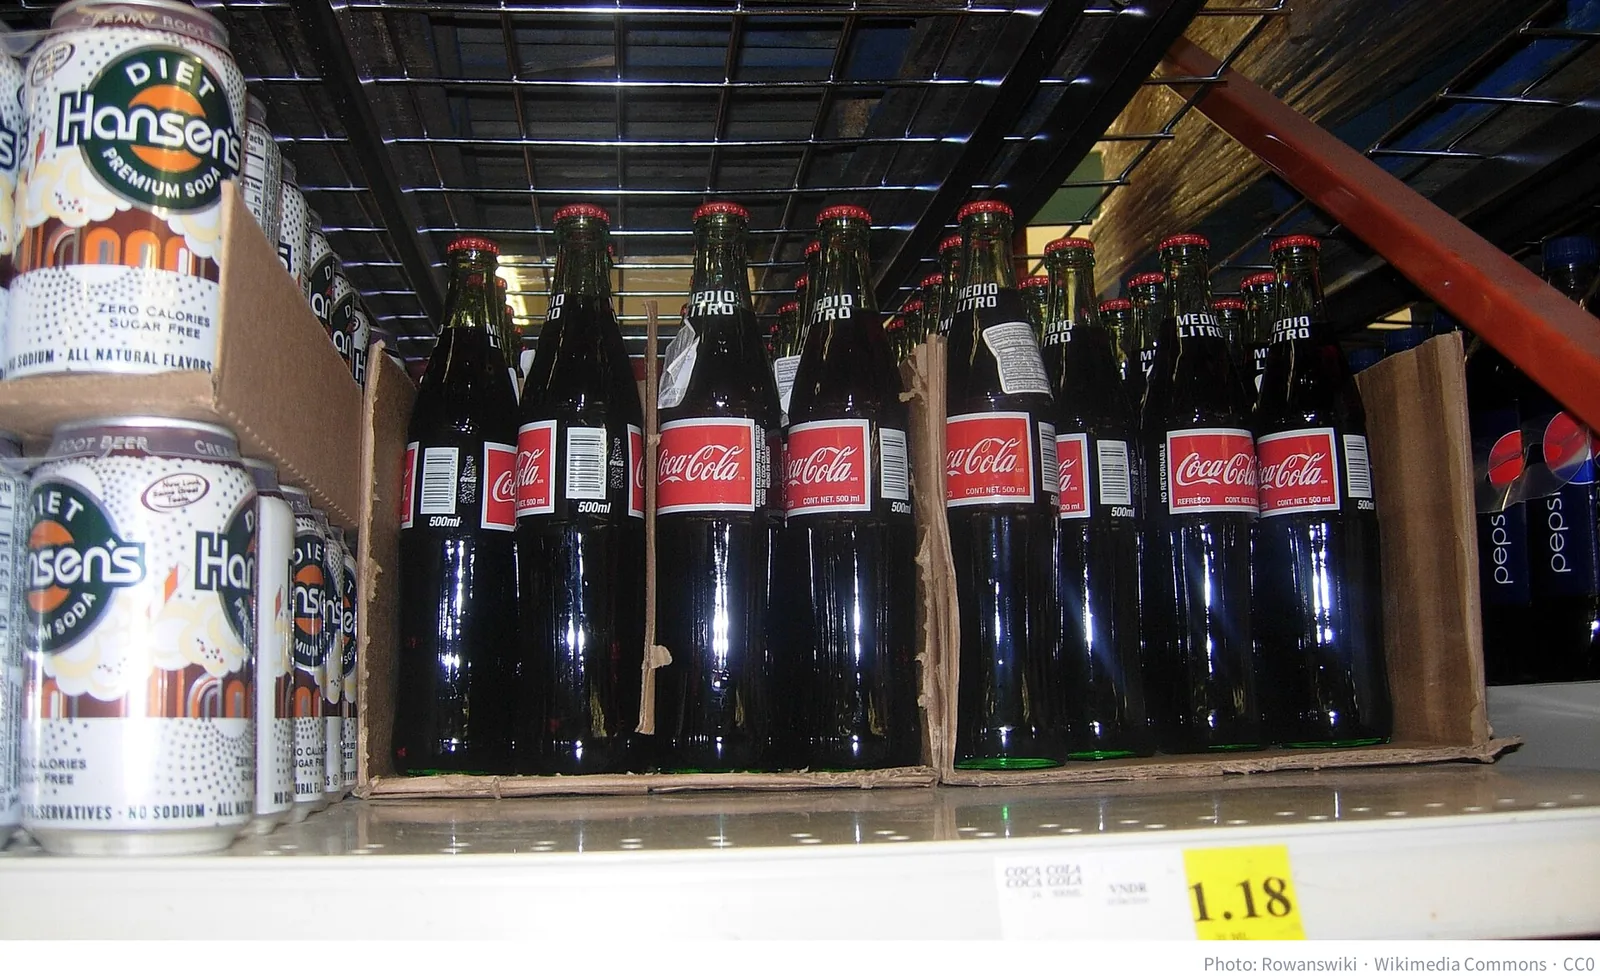
If the 1999 to 2000 story held, money from selling chips should again have gone to defensive stocks such as Coca-Cola. On prices alone, it looks that way. Coca-Cola’s stock rose 16.6% after June 22, 7.7% since September 30 alone and 32.6% this year. The U.S. consumer staples sector ETF (XLP) rose 7.4% after June 22 and 9.5% in October alone, and P&G rose 9.0% after June 22. Over the same period the U.S. semiconductor index fell 27.0%. While chips fell, Coca-Cola rose.
The money flows say the opposite. By EPFR’s count, consumer sector funds lost $2.1bn in the week to October 21, the most since February 2014 and the second largest outflow on record. Utility funds lost $1.6bn the same week, the most since March 2015 and also the second largest on record. Tech funds, by contrast, took in $18.8bn and energy funds $1.1bn. The fund manager survey agrees. The net position in consumer staples was -19% in August, -33% in September (the most bearish since January 2004) and -32% in October, still deeply underweight. Consumer discretionary was also at -34% in October, the most underweight since July 2008.
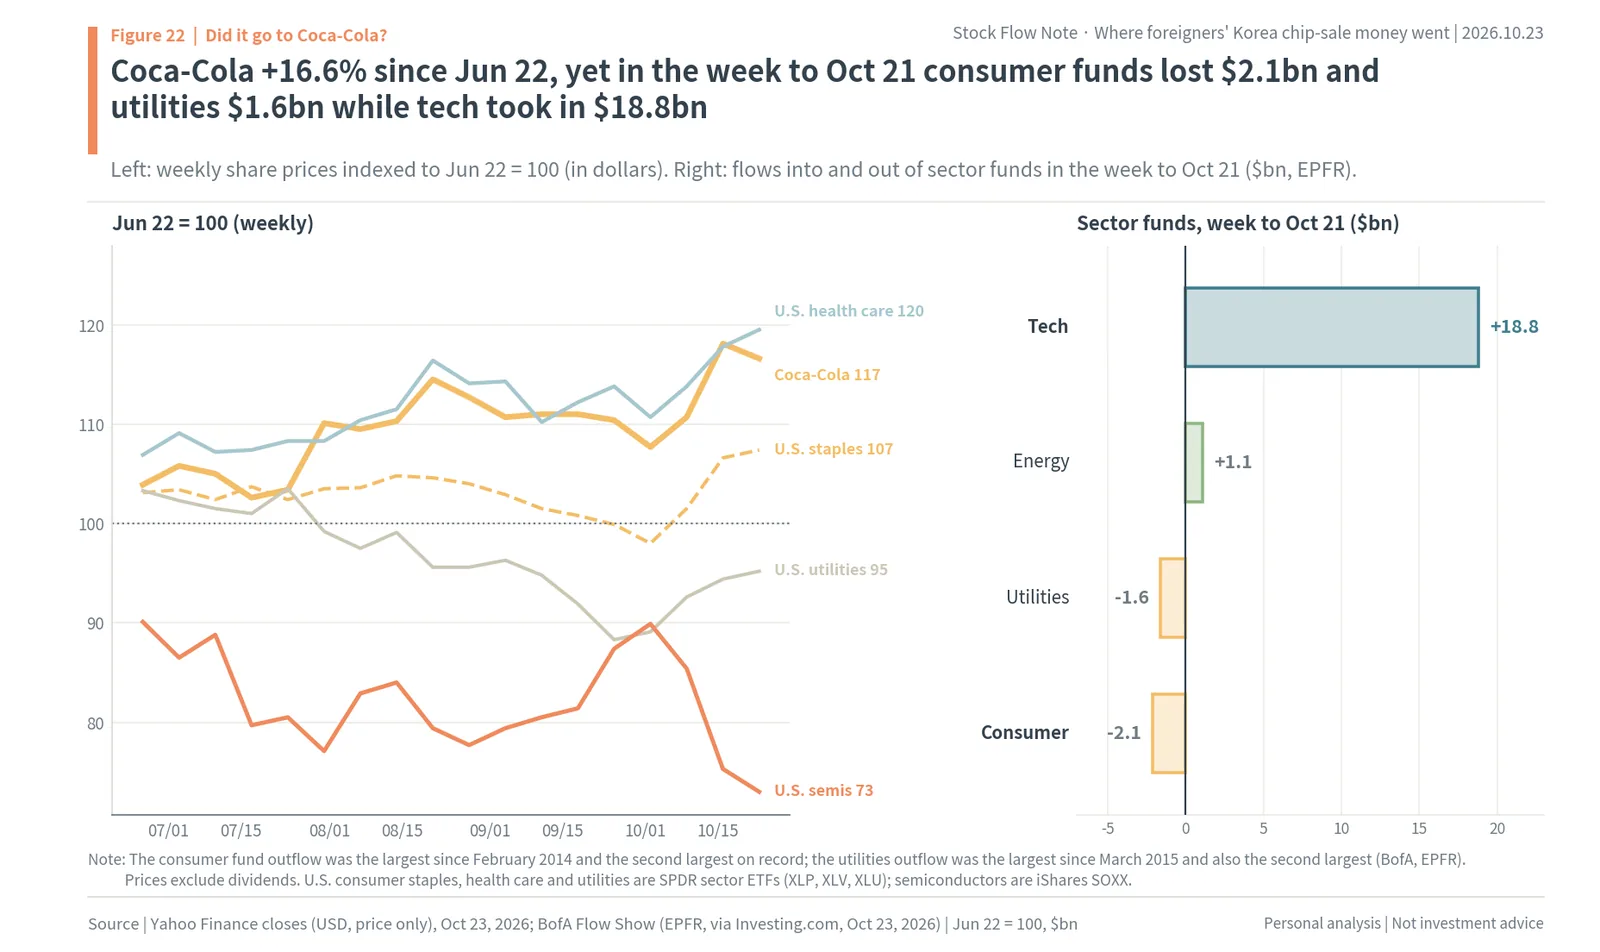
The left of the figure shows share prices indexed to June 22 = 100. U.S. health care (XLV) is at 120, Coca-Cola at 117 and consumer staples at 107, far apart from semiconductors (73). The right shows money going into and out of sector funds around the same time. The sectors whose prices rose and the sectors money went into are different. Prices can rise because other sectors fall more or because a little money is buying, but in the fund flows this report found no evidence that big money moved out of tech into defensives as it did in 2000. BofA naming long consumer staples as a “contrarian trade” in October also means defensives are out of favor right now.
Short-term money behaved a little differently. Bloomberg reported that for five days in a row from October 8 hedge funds sold Goldman Sachs’s AI basket (about 100 stocks) and moved the money into health care and consumer staples. Some of the rise in stocks like Coca-Cola may have come from this hedge fund money (author’s estimate). This money is small and does not stay long, though, so it did not change the flows of sector funds as a whole.
Health care is the exception. Fund managers’ net overweight in health care was a large +23% in October, health care funds took in $1.2bn in the week to October 14, and the sector ETF rose 19.5% after June 22. Utilities are mixed. In the October survey they were among the sectors with the biggest increase in weight, yet utility funds saw the second largest outflow on record. In short, the guess “other stocks like Coca-Cola” is half right on prices and short-term hedge fund money, but wrong as a description of where the sale proceeds actually went.
Cash was a brief stop
The first place money from selling stocks lands is cash. When funds sell stocks, they hold the money in cash or MMFs until they find the next investment. So the guess “they are holding it in cash” can be right or wrong depending on timing. The numbers say this cash did not stay long.
By EPFR’s count, global MMFs took in $166.4bn in the week to October 7, the most in a single week since the COVID shock of April 2020. But in the following week (to October 14) $53.1bn left, and the week after that $28.8bn came in. In the week to September 30, $118.0bn had left as quarter-end money, so over the four weeks MMFs had net inflows of $24.1bn. Equity funds took in $148.3bn over the same four weeks.
Total U.S. MMF assets compiled by the Investment Company Institute (ICI) have barely moved either: about $7.90tn on June 24, $7.95tn on July 1 (a record at the time), $7.98tn on September 2 and $7.94tn on October 21. From June, when foreigners sold the most Korean stock, until now, total U.S. MMF assets grew by only about $40bn (author’s calculation). The fund manager cash level seen in the previous chapter was 3.9% in both September and October, below the 4.0% BofA treats as a sell signal.
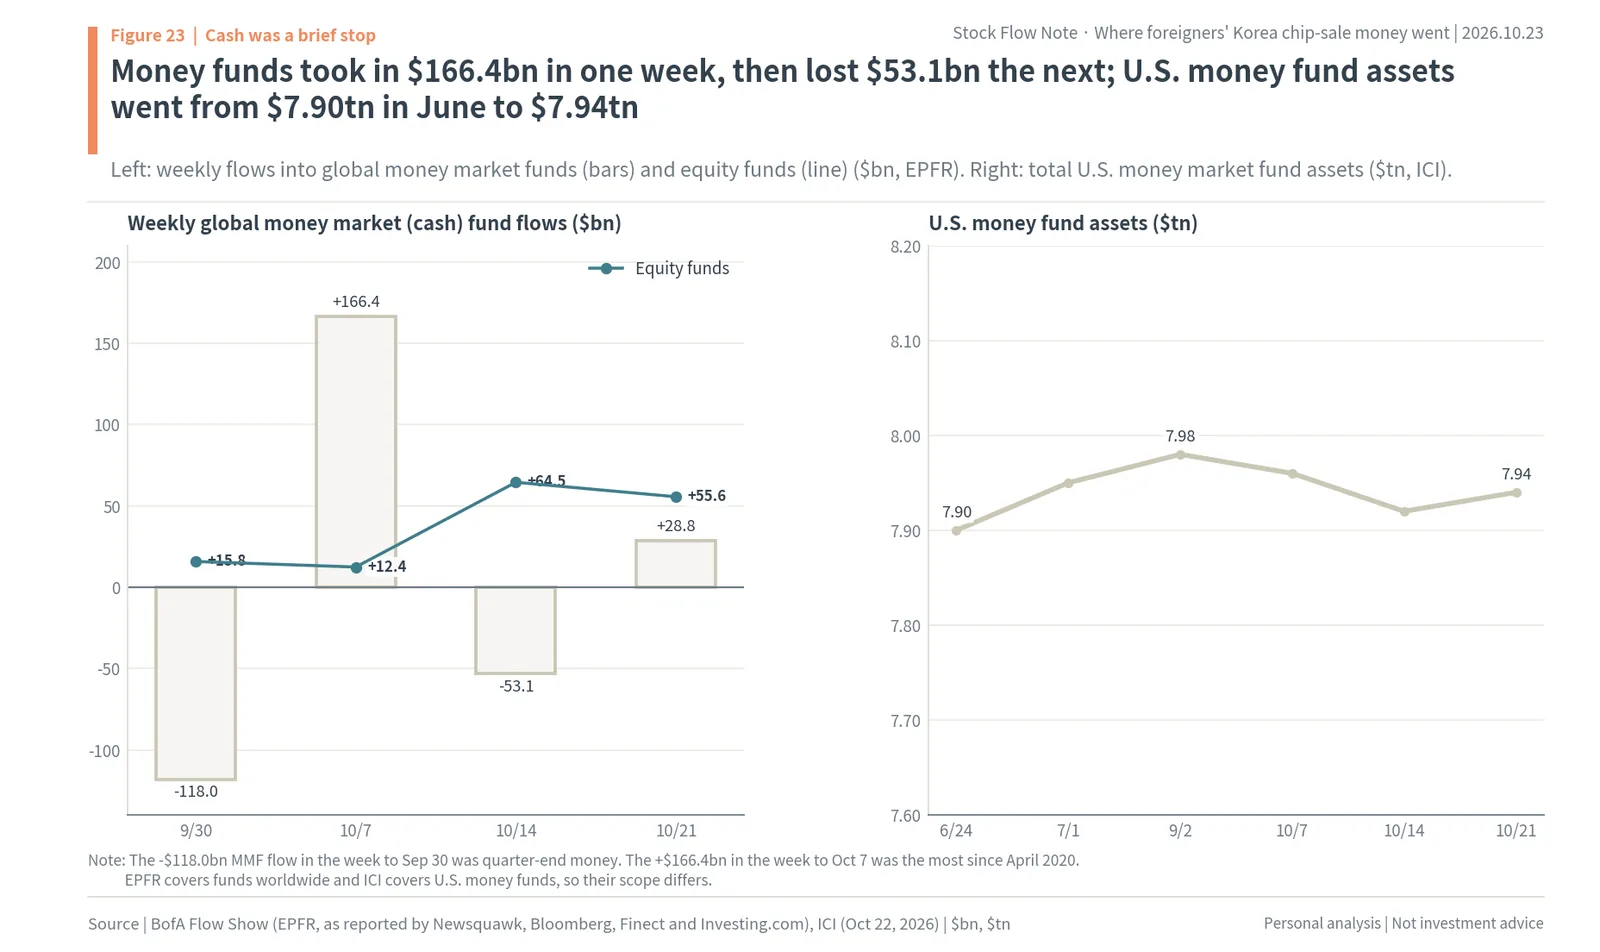
That is not because cash is unattractive. The U.S. Federal Reserve raised its policy rate by 25bp to 3.75% to 4.00% on September 16, and the U.S. short-term Treasury yield BofA cited is 4.2%. BofA’s Michael Hartnett summed it up as “No rate cuts, no cash cuts”: without rate cuts, cash will not shrink. By BofA’s count, MMF assets have swelled from $5tn in 2023 to $8tn and produce $330bn of interest a year. Cash is already a huge reservoir. Yet total assets barely grew after June, which means that as money came into MMFs, other money left them for stocks and bonds. The guess “they are holding it in cash” was right a week at a time, and only half right over several months.
Money did go to resources, but gold fell even as money went in
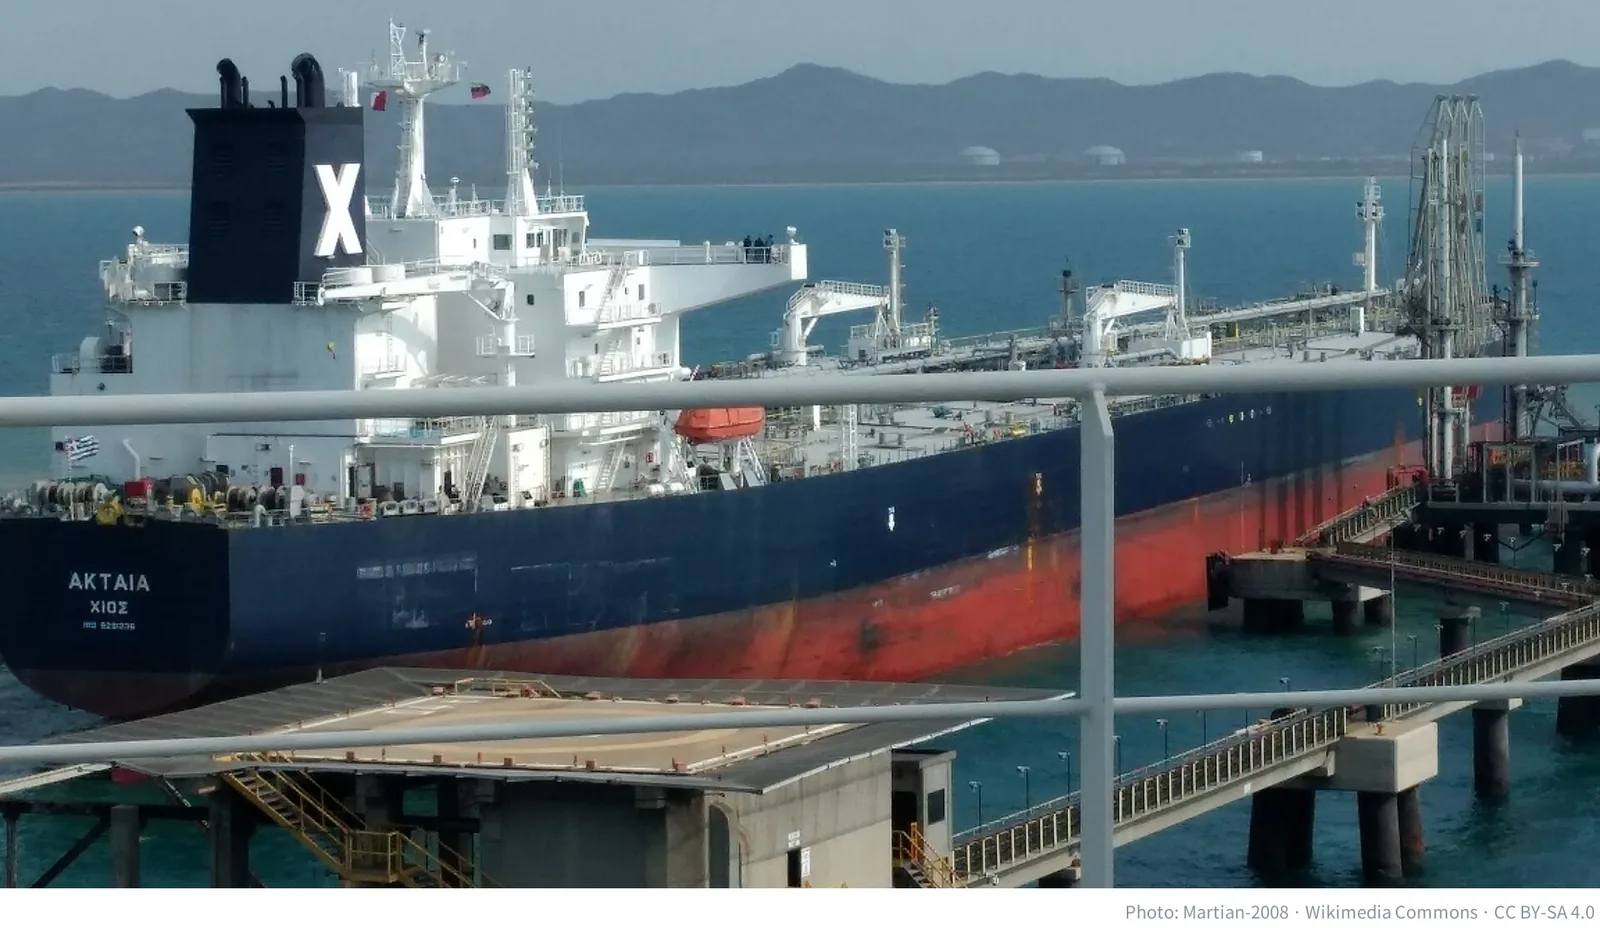
Of the three guesses, resources fits the numbers best. Oil is the asset that rose the most this year. After the U.S. and Israel attacked Iran on February 28, Iran closed the Strait of Hormuz; the strait reopened briefly on April 17 and then closed again. On October 23, with attacks on ships in the strait continuing, December Brent crude settled at $116.72. The Brent oil ETF (BNO) rose 64.6% after June 22 and 150.7% this year. U.S. energy stocks (XLE) rose 28.2% after June 22, broad commodities (DBC) 24.4%, and the stocks of resource exporter Brazil (EWZ) 24.3%.
Money went there too. Fund managers’ commodity overweight rose from +11% in July to +24% in August and is still +21% in October. By EPFR’s count, energy funds took in $1.1bn in the week to October 21, the most since April. Gold ETFs took in $10bn in September and $31bn in the third quarter by the World Gold Council’s count. Third-quarter inflows were a quarterly record, and gold ETF holdings also hit a record 4,256 tonnes. Gold funds took in another $2.6bn in the week to October 21.
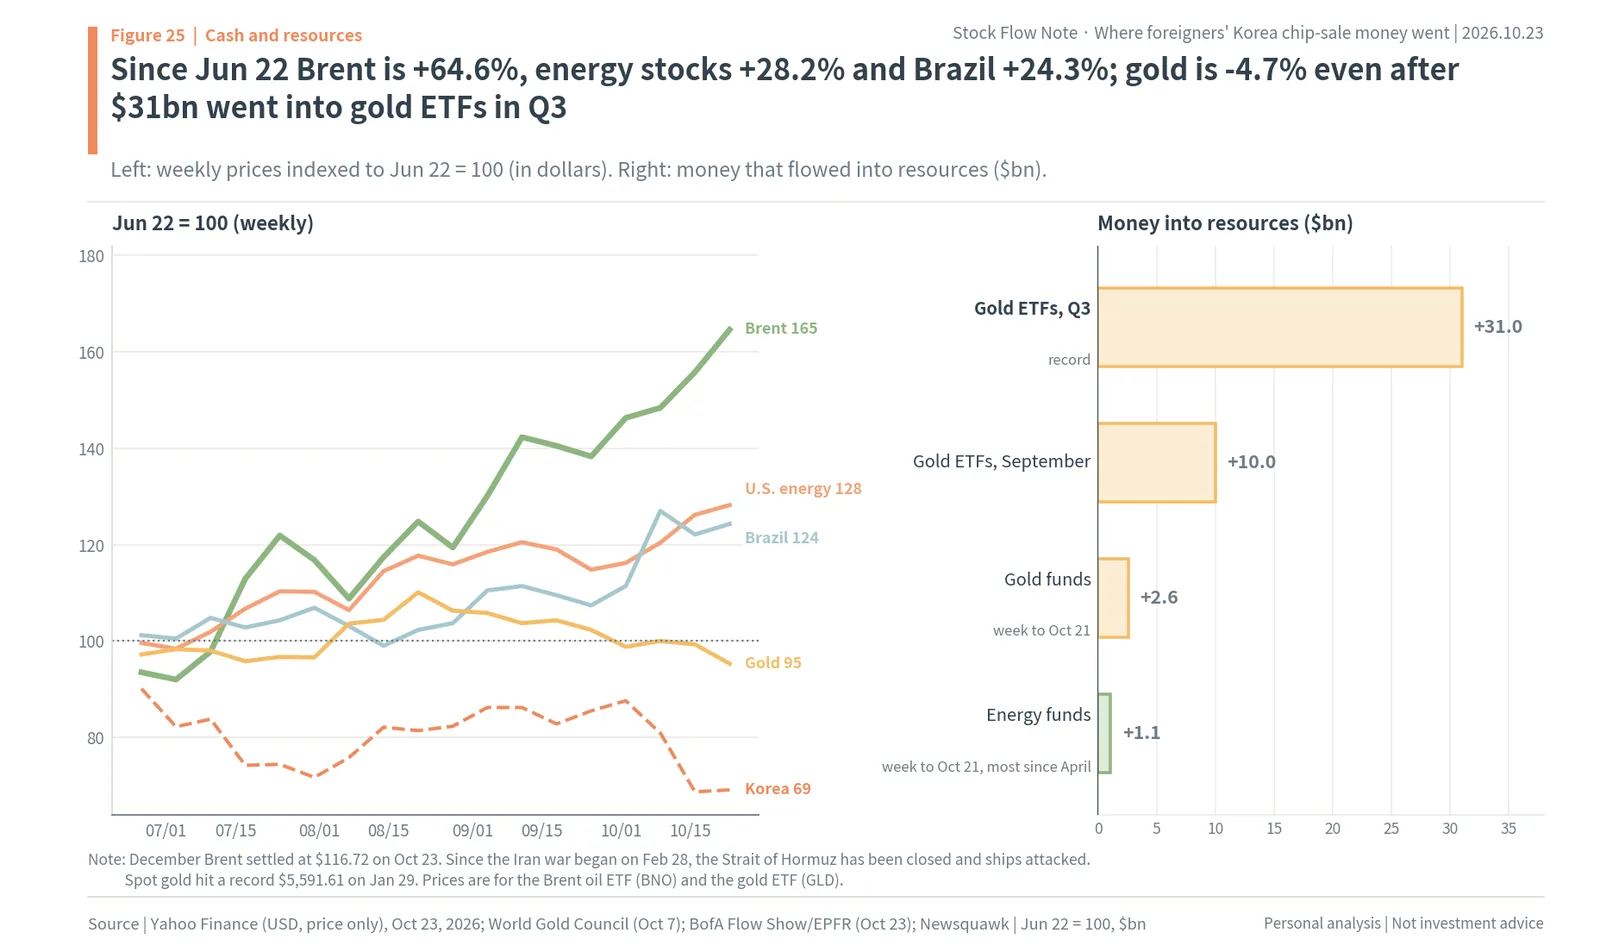
Gold, though, fell even as money went in. Spot gold hit a record $5,591.61 on January 29, fell 9.5% the next day alone, and on October 23 traded between $3,986 and $4,034. That is 28.3% below the January peak (author’s calculation, using the midpoint of the range). The gold ETF (GLD) fell 4.7% after June 22 and 7.5% this year. While some money bought gold through ETFs, others sold more. Gold’s plunge on October 20 was covered separately in the author’s October 20 note.

Money did go to resources, but whether it was the money from selling Korea cannot be traced in the numbers. Above all, oil rose because war cut supply. It is more accurate to say that rising oil and energy and resource-country stocks were among the few places able to absorb the sale proceeds than to say the proceeds drove oil prices up. In the October survey, fund managers also expected Brent at $94 by year-end, so they do not see the current price ($116.72) lasting. The guess “they are investing in resources” is mostly right, while for gold alone it is half an answer: money went in, but the price fell.
Returns by asset: answers to the three guesses, and two answers no one guessed
Line up returns by asset in dollars from the KOSPI peak on June 22 to October 23 and the path of the money is visible at a glance. Brent rose the most, 64.6%, followed by Microsoft at 42.8%, U.S. energy stocks at 28.2%, broad commodities at 24.4%, Brazil at 24.3%, U.S. health care at 19.5% and Coca-Cola at 16.6%. The Magnificent 7 rose 9.5%, U.S. consumer staples 7.4% and the S&P 500 2.1%. On the other side, Japan was -3.0%, gold -4.7%, long-term U.S. Treasuries -5.5%, Taiwan -5.9% and India -6.9%, while U.S. semiconductors fell 27.0% and Korea fell the most, 30.9%.
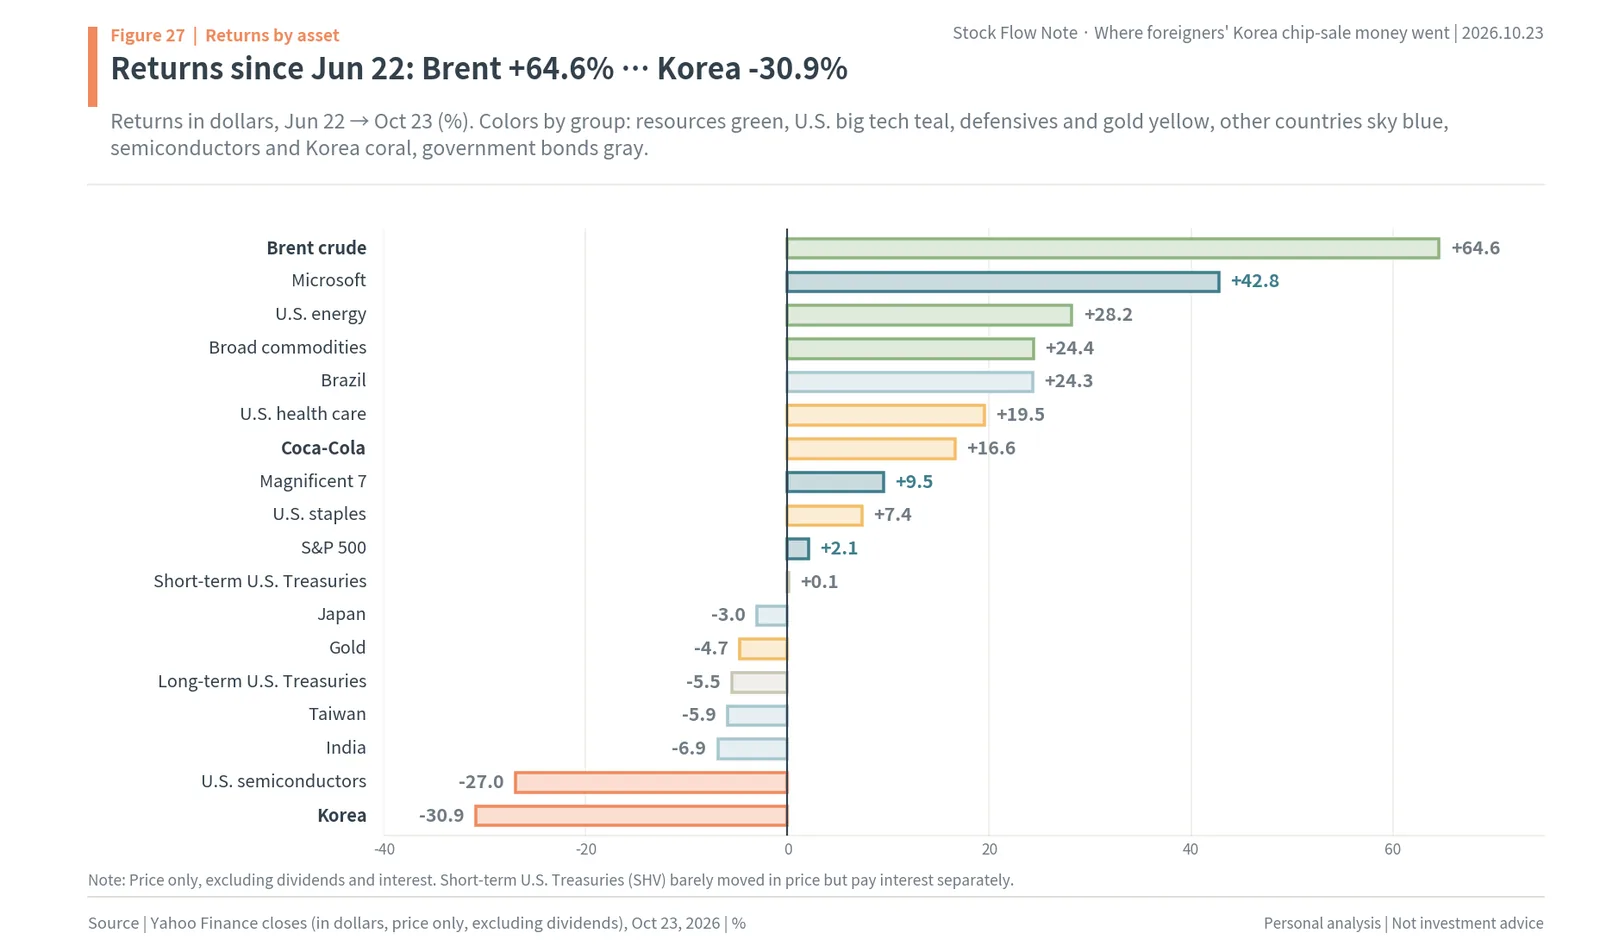
This ranking mixes “where the money went” with “where prices rose,” so it has to be read together with the fund flow numbers in the earlier chapters. Here are the answers to the three guesses posed at the start (cash, Coca-Cola and resources).
First, are they holding it in cash? Half right. Global MMFs took in $166.4bn in the first week of October, but $53.1bn left the next week, and total U.S. MMF assets barely changed, from $7.90tn in June to $7.94tn. Fund manager cash is low, at 3.9%. The proceeds stopped briefly in cash and then moved to other assets.
Second, are they investing in other stocks like Coca-Cola? Half right on prices and short-term hedge fund money, but not for fund flows as a whole. Coca-Cola rose 16.6% after June 22, but in the third week of October consumer and utility funds saw their second largest outflows on record, and fund managers are deeply underweight consumer staples at -32%. Among defensives, health care is about the only place money went.
Third, are they investing in resources? Mostly right. The commodity overweight is still raised at +21%, and money went into energy funds and gold ETFs. But much of oil’s rise came from the war, and gold is 28.3% below its January peak even though money went in.
And there are two answers that were not among the guesses. One is other AI. Fund managers’ net overweight in tech is the highest since August 2020, and tech funds took in the most money since July. The other is other emerging markets. EM funds cannot take the money from selling Korea out of emerging markets, so they trimmed Asia’s AI chip markets, Taiwan included, and put the money back into Brazil and, in October, China. Foreigners didn’t abandon AI, they trimmed Korean memory, and the trimmed money went to other AI, to other emerging markets and partly to resources. In one line: not abandoned, but trimmed.
Signals of a return: for the trimmed money to come back, crowding must ease and memory profits must be confirmed
If foreigners trimmed Korean memory rather than abandoning it, the conditions for adding it back should be the reverse: the crowding unwinds far enough, the weight after trimming falls below the benchmark, and memory profits are confirmed to last. The numbers today are about halfway there.
First, crowding. The share in the BofA survey naming long semiconductors as the most crowded trade fell from 82% in July to 45% in October. It is still first, but almost half unwound. In the same October BofA Asia survey, the share naming memory as the best risk-reward in the AI chain rose from 20% to 30%. Second, how much has been trimmed. Foreigners’ share of KOSPI market capitalization fell from 41.40% on June 22 to 38.46% on October 23. Third, the direction of money. By EPFR’s count, Korea equity funds (including ETFs) took in $5.8bn in the week to October 21, the most since July. The Bank of Korea’s September foreign equity flows, on the other hand, were -$14.16bn, still an outflow. Fund manager cash of 3.9% means there is not much ammunition for new buying.
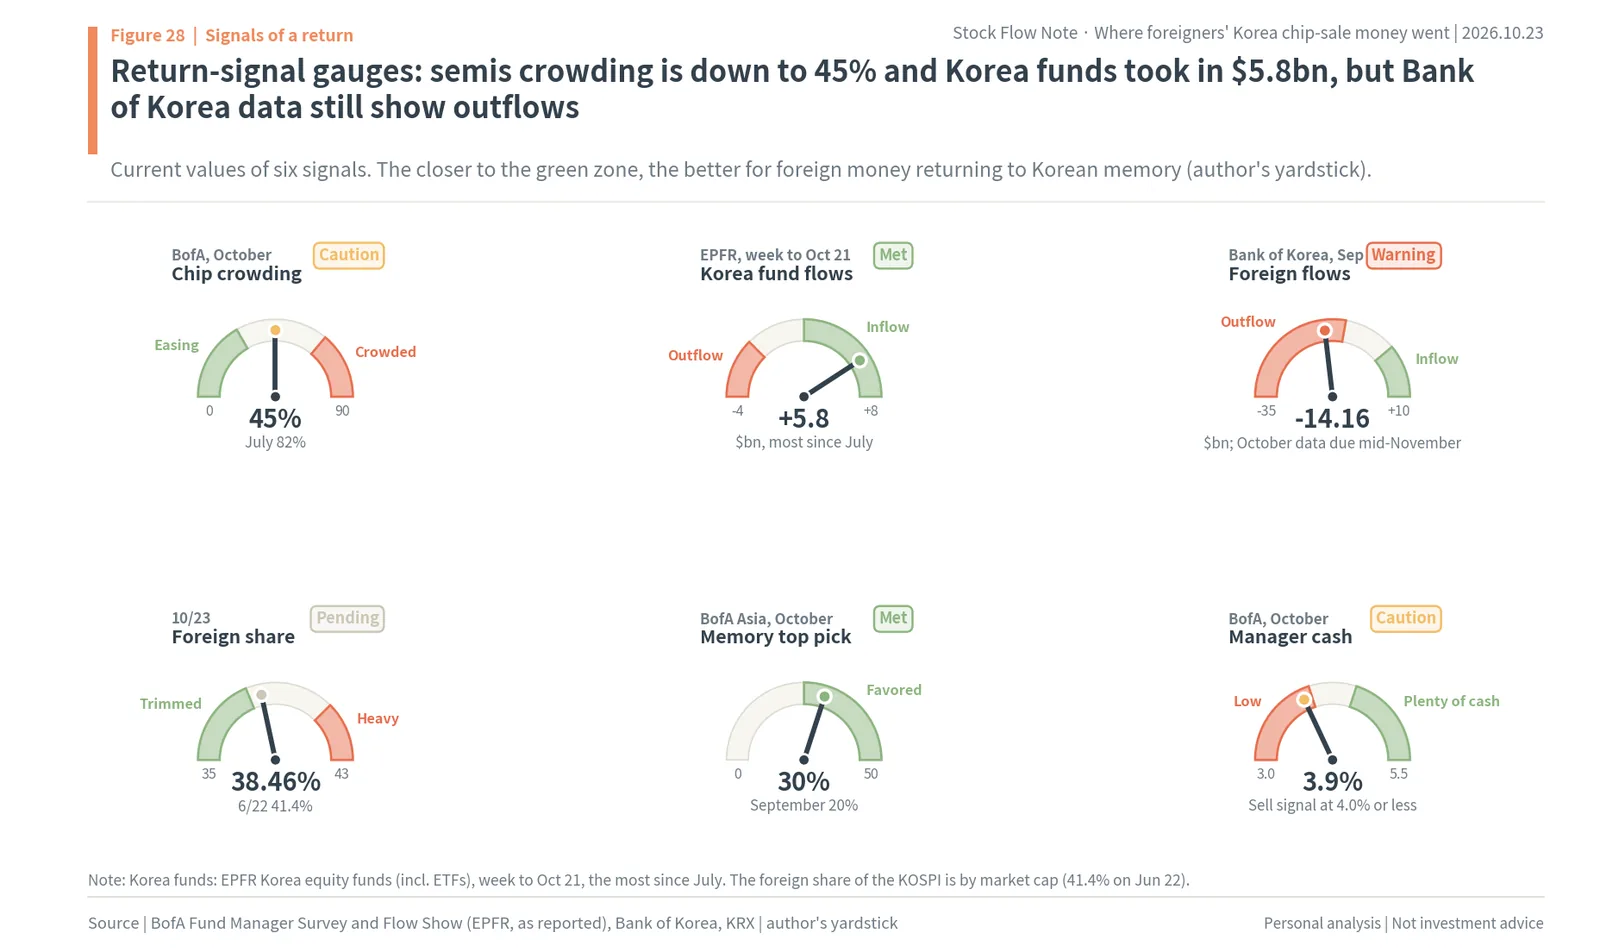
Money coming into Korea equity funds while foreigners keep net selling on the exchange means different foreigners are moving in opposite directions. As seen earlier, money that buys Korea wholesale through ETFs and the money of active and global funds that adjust weights against an index follow different rules. When money into Korea ETFs grows and the active side finishes trimming, the exchange numbers will turn as well. The numbers that will show that sequence are the Bank of Korea’s October foreign flows (out in mid-November) and the FSS’s September and October trading by nationality. On the exchange, foreign net selling of KRW 19.03tn on October 1 to 23, converted at each day’s rate, comes to $14.23bn, so the Bank of Korea’s October figure is likely to show an outflow too (author’s estimate). Still, while money into Korea ETFs is growing, the first thing to watch is whether the outflow is smaller than September’s.
The author reads this foreign selling as trimming an overweight in Korean memory, and sees the conditions for a return as the crowding unwinding and memory profits being confirmed. The crowding has eased about halfway, and money has started coming into Korea ETFs. What remains is profits. That makes SK hynix’s results and shareholder return announcement on October 28 and Samsung Electronics’ conference call on October 29 the first test. Samsung Electronics reported preliminary third-quarter operating profit of KRW 107.4tn (about $81.0bn) on October 8, yet its stock fell a further 17.7%, from KRW 262,000 that day to KRW 215,500 on October 23. More than the numbers themselves, the explanation of how many years these profits will last will decide whether foreigners add the stock back.
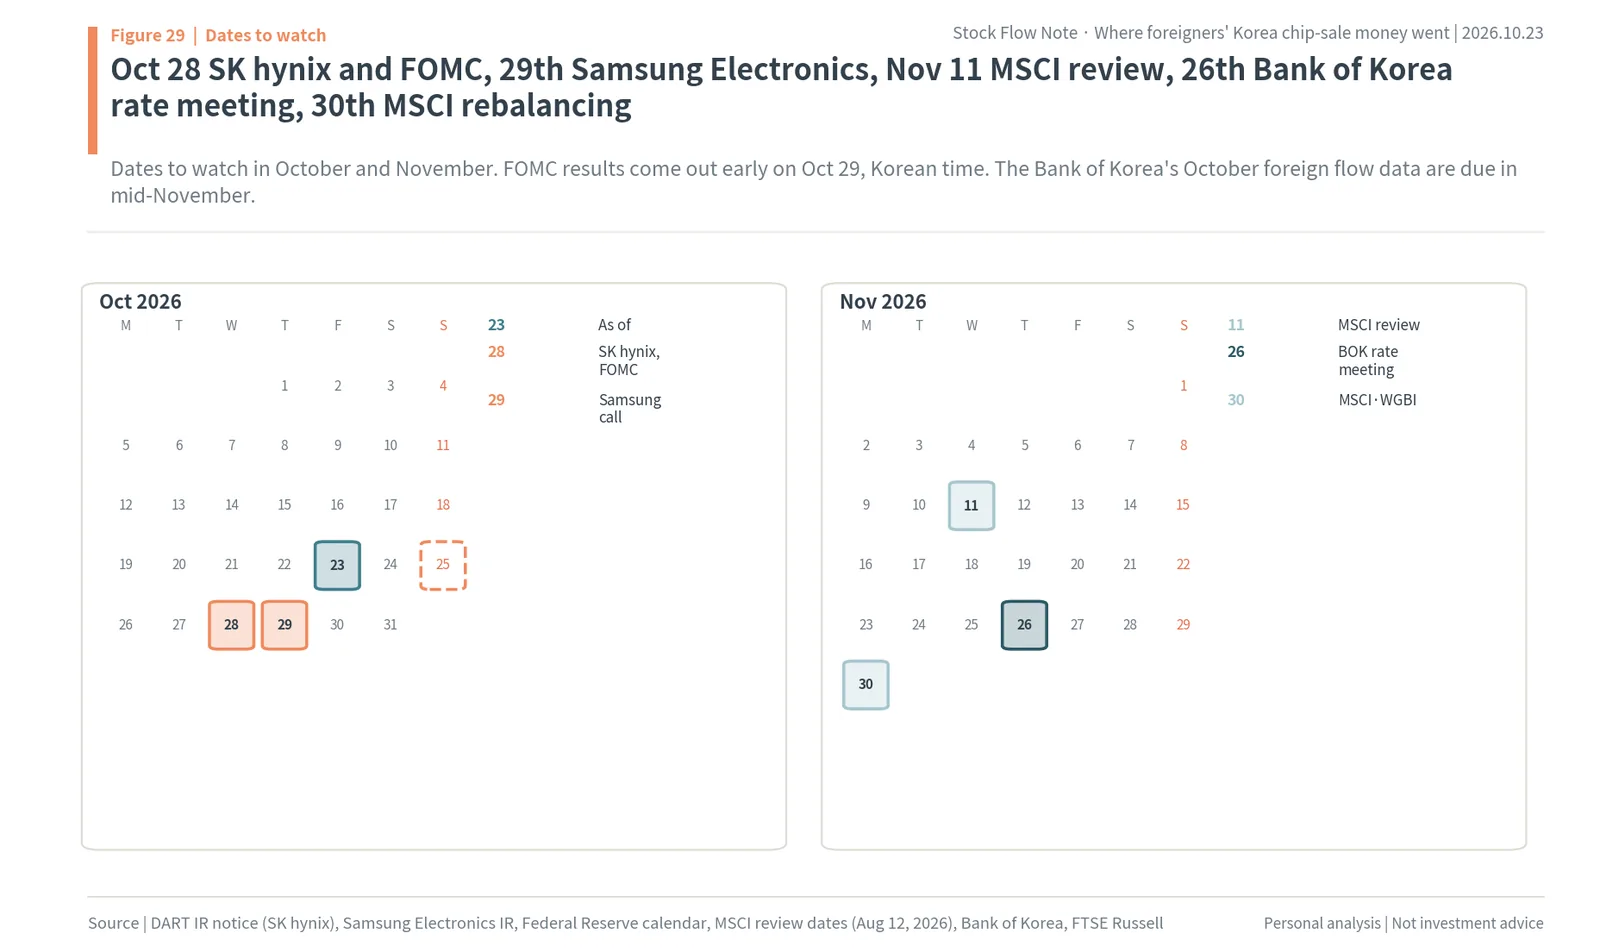
On the calendar come SK hynix’s results and the U.S. FOMC on October 28 (the decision arrives early on the 29th, Korean time), Samsung Electronics’ conference call on the 29th, the MSCI quarterly index review announcement on November 11, the Bank of Korea’s Monetary Policy Board meeting on November 26 and MSCI rebalancing on November 30. The inclusion of Korean government bonds in the World Government Bond Index also finishes with the November index composition. How the next BofA fund manager survey’s chip crowding response and its emerging market and Japan weights change are numbers to watch as well.
Common questions: seven things that are easy to misread about foreign selling of Samsung Electronics and SK hynix
This chapter regroups the numbers from the earlier chapters as questions. It makes no new claims.
The first question is how much foreigners sold this year, and what. From January 2 to October 23, foreigners net sold KRW 206.97tn on the KOSPI and KOSDAQ. Samsung Electronics (including preferred shares) at KRW 93.64tn and SK hynix at KRW 92.38tn add up to KRW 186.02tn, 89.9% of the total. The average prices foreigners sold at were KRW 233,164 for Samsung Electronics common shares and KRW 1,596,955 for SK hynix, 1.94 times and 2.45 times last year’s closing prices.
The second question is whether the money bought other Korean stocks. Hardly. All other stocks combined were also net sold, by KRW 20.95tn, and Celltrion, the stock foreigners bought most, took KRW 1.75tn, 0.9% of the two stocks’ net selling. Korean bonds took in $9.28bn in January to June on WGBI inclusion but lost money for three straight months from July to September, leaving a net outflow of $2.02bn for January to September.
The third question is whether foreign money really left when the won got stronger. It did. By the Bank of Korea’s count, foreign portfolio flows were a net outflow of $147.05bn in January to September. The won strengthened because the January to August current account surplus of $279.2bn was 2.2 times foreign outflows of $127.08bn over the same period. The Bank of Korea explained September’s fall in the exchange rate by more dollar selling by exporters.
The fourth question is whether the money went to defensive stocks like Coca-Cola. Prices rose, but in fund flows as a whole money did not go in; only some short-term hedge fund money went that way. Coca-Cola rose 16.6% after June 22, but in the week to October 21 consumer funds lost $2.1bn and utility funds $1.6bn, both the second largest outflows on record. Fund managers’ net position in consumer staples is -32%. Tech funds took in $18.8bn the same week.
The fifth question is whether the money is being piled up as cash. It stopped by briefly and moved on. Global MMFs took in $166.4bn in the week to October 7, but $53.1bn left the next week, and total U.S. MMF assets barely changed, from about $7.90tn on June 24 to $7.94tn on October 21. Fund manager cash of 3.9% is also below the 4.0% BofA treats as a sell signal.
The sixth question is whether the money went to Taiwan on the logic of “if it’s AI, then Taiwan.” Not into its stocks. Foreigners also net sold more than NT$2tn of Taiwanese stocks this year through October 19, and the NT$302.555bn sold on October 15 was the largest single-day net sale on record. The U.S.-listed Taiwan ETF (EWT) took in only $0.06bn over the same month. The place inside emerging markets that clearly took money was Brazil: the Brazil ETF (EWZ) took in $3.14bn over the same month, and foreign money on Brazil’s stock exchange was a net inflow of BRL 40.5bn through the first week of October.
The seventh question is when foreigners will come back. This is a matter of judgment. The author sees the conditions as the crowding unwinding and memory profits being confirmed. The chip crowding response fell from 82% in July to 45% in October, and Korea equity funds took in $5.8bn in the week to October 21, the most since July. What remains is the explanation of profits that SK hynix and Samsung Electronics will give on October 28 and 29.
Basis of calculation: how KRX, Bank of Korea, FSS and overseas numbers were joined
This chapter states where each number in this report came from and how it was calculated.
Foreign net selling is the net buying value of the KRX Data System investor type “foreigners” (pykrx, regular session through October 23, 2026). “Other foreigners” are not included. This year means the 197 trading days from January 2 to October 23; after the peak means June 22, when the KOSPI peaked, to October 23; and October means October 1 to 23. Period net buying by stock was downloaded in one pass for 947 KOSPI stocks and 1,852 KOSDAQ stocks over the same periods, and Samsung Electronics combines common and preferred shares. Monthly numbers are foreign net buying for the whole KOSPI and KOSDAQ markets.
Closing prices are KRX market capitalization divided by listed shares, because from September 14 the pykrx price table mixes in Nextrade after-market trades and differs from the regular-session close. Last year’s close is the value on the last trading day of 2025 (December 30). The average foreign sale price is this year’s total foreign net sales value divided by the total net shares sold, a net figure that adds up all buying and selling day by day. “This year’s gain” is sales value × (1 − year-end close ÷ average sale price), and assumes foreigners held the shares from the end of last year.
The dollar conversion divides KRX daily foreign net buying (in won) by that day’s won-dollar rate (Yahoo Finance KRW=X close) and adds the results up by month. Bank of Korea equity flows are on a settlement basis and include OTC trades and other equity-related flows, so they do not equal the converted KRX figure. The won equivalent of the Bank of Korea’s January to September net outflow of $147.05bn (about KRW 195.0tn) multiplies it by the October 23 rate of KRW 1,326.0. The current account adds up the monthly January to August values in Bank of Korea ECOS (series 301Y013).
Trading by nationality uses only the values reported among the top net buyers and sellers in news coverage of the FSS Foreign Investors’ Securities Trading report. Months not in the top (the U.S. in April, the U.K. in May) are left blank and were not counted as zero in the sums. FSS equity numbers are on a settlement basis and cover a different scope from the KRX, so they can differ a lot from KRX numbers in a given month (for example, July was -KRW 31.66tn by the FSS and -KRW 9.81tn by the KRX). So this report uses KRX numbers for stock amounts and FSS numbers for nationality and bonds.
Overseas prices are Yahoo Finance closes and measure price change excluding dividends. Country returns use U.S.-listed iShares MSCI country ETFs (in dollars). Because they are measured in dollars, they include the movement of each country’s currency. For example, the Korea ETF (EWY) fell 30.9% after June 22, less than the KOSPI’s 39.1%, because the won strengthened in the meantime. The price of the short-term Treasury ETF (SHV) barely moves, but it pays interest separately.
The BofA fund manager survey and EPFR fund flows were checked through press coverage because the BofA originals are not public. Where reports differed, such as the number of respondents (161 or 185), the figure was not used in this report. Gold ETF flows are the World Gold Council’s monthly data.
Foreign selling of Samsung Electronics and SK hynix: quick answers
Q. How much Korean stock did foreigners sell in 2026, and how much was Samsung Electronics and SK hynix?
From January 2 to October 23, 2026, foreign investors net sold KRW 206.97tn of Korean stocks on the KOSPI and KOSDAQ. Samsung Electronics (including preferred shares) accounted for KRW 93.64tn and SK hynix for KRW 92.38tn, KRW 186.02tn together or 89.9% of the total. Foreigners sold at average prices of KRW 233,164 for Samsung Electronics common shares and KRW 1,596,955 for SK hynix, 1.94 and 2.45 times last year’s closing prices.
Q. Did foreigners use the money to buy other Korean stocks or bonds?
Hardly. All other stocks combined were also net sold, by KRW 20.95tn, and the top 10 foreign buys, led by Celltrion at KRW 1.75tn, add up to KRW 9.66tn, 5.2% of the selling in the two stocks. Korean bonds took in $9.28bn in January to June but lost money from July to September, leaving a net outflow of $2.02bn for January to September.
Q. If foreign money left, why did the Korean won get stronger?
Foreign money did leave: the Bank of Korea counted a net outflow of foreign portfolio investment of $147.05bn in January to September. But the January to August current account surplus of $279.2bn was 2.2 times foreign outflows of $127.08bn over the same period. The won-dollar rate fell from 1,554.5 on June 8 to 1,326.0 on October 23.
Q. Did the money go to Coca-Cola and other defensive stocks?
Prices rose, but fund money did not follow. Coca-Cola rose 16.6% after June 22, yet in the week to October 21 consumer funds lost $2.1bn and utility funds $1.6bn, both the second largest outflows on record, while tech funds took in $18.8bn. Fund managers’ net position in consumer staples was -32% in October.
Q. Are foreign investors sitting on the money as cash?
Only briefly. Global money market funds took in $166.4bn in the week to October 7, but $53.1bn left the next week, and total U.S. money market fund assets barely changed, from about $7.90tn on June 24 to $7.94tn on October 21. Fund manager cash was 3.9% in October, below the 4.0% BofA treats as a sell signal.
Q. Where did the money go, and what would bring it back to Korean memory?
Global funds stayed in tech: fund managers’ net overweight in tech rose to 37%, the highest since August 2020, and EM funds moved money to Brazil, whose ETF took in $3.14bn in a month, and in October to China funds. The author sees a return as depending on the semiconductor crowding unwinding, already down from 82% to 45%, and on memory profits being confirmed, with SK hynix results on October 28 and Samsung Electronics’ call on October 29.
Sources
- Korea Exchange (KRX) Data System: net buying by stock and by investor type (foreigners) on the KOSPI and KOSDAQ; market capitalization, trading value and volume by investor type for Samsung Electronics and SK hynix (pykrx, regular session through Oct 23, 2026)
- Bank of Korea, International Finance and Foreign Exchange Market Trends (January to September 2026), as reported by: Metro Seoul (link), Feb 12, 2026; Herald Economy (link), Mar 12, 2026; Herald Economy (link), Apr 9, 2026; Korea Economic Daily (link), May 15, 2026; Aju Business Daily (link), Jun 15, 2026; Money Today (link), Jul 14, 2026; MTN (link), Aug 13, 2026; SBS Biz (link), Sep 17, 2026; Newspim (link), Oct 16, 2026; Financial Post Korea (link), Oct 16, 2026
- Bank of Korea ECOS, current account (301Y013), January to August 2026; Monetary Policy Board decision statement, Oct 22, 2026
- Financial Supervisory Service, Foreign Investors’ Securities Trading (January to August 2026), as reported by: Korea Economic Daily (link), Feb 13, 2026; Herald Economy (link), Mar 26, 2026; Kyunghyang Shinmun (link), Apr 16, 2026; Herald Economy (link), May 28, 2026; SBS Biz (link), Jun 26, 2026; Newsis (link), Jul 31, 2026; Asia Economy (link), Aug 21, 2026; KDI Economic Information Center, original release (link), Sep 18, 2026; Herald Economy (link), Sep 18, 2026
- FTSE Russell, Fixed Income Country Classification March 2026 Results (link), Apr 7, 2026; Ministry of Economy and Finance WGBI monitoring task force (link), Jun 30, 2026
- DART 5% holding reports on SK hynix (Capital Group and BlackRock), Dec 2024 to Jun 2026
- Other markets: Reuters via Interaksyon, Foreigners sell Asian stocks at a record pace (link), Jul 2, 2026; Central News Agency, Taiwan foreign selling (link), Oct 5, 2026; NSDL, FPI yearly investment (link), accessed Oct 25, 2026; Gazeta do Povo, Foreign capital on B3 in October (link), Oct 13, 2026; Korea Economic Daily, Country ETF flows (link), Oct 14, 2026; Seoul Economic Daily, Korea’s MSCI weighting doubles (link), May 20, 2026
- BofA Global Fund Manager Survey coverage: MaceNews, October (link), Oct 13, 2026; MaceNews, August (link) and July (link); Atrani Capital, October (link), September (link), August (link) and July (link)
- BofA Flow Show (EPFR) coverage: Investing.com (link), Oct 23, 2026; Investing.com (link), Oct 9, 2026; Bloomberg via Yahoo Finance (link), Oct 9, 2026; Finect (link), Oct 20, 2026; Newsquawk (link), Oct 2, 2026; Cardano Capital (link), Oct 23, 2026
- Investment Company Institute (ICI), Money Market Fund Assets (link), Oct 22, 2026; Hellenic Shipping News (link), Jul 6, 2026
- World Gold Council, Gold ETF Flows September 2026 (link), Oct 7, 2026; Profit by Pakistan Today, Spot gold record high (link), Jan 29, 2026; Finect, Gold near $4,000 (link), Oct 23, 2026
- Newsquawk, Crude settlement (link), Oct 23, 2026; The Nightly, Strait of Hormuz closure (link), Mar 2, 2026; Fox9, Iran war updates (link), Apr 18, 2026
- Barron’s, “What’s Wrong, Warren?” (Dec 27, 1999), reprinted by Hedge Fund Alpha (link); Berkshire Hathaway 2024 shareholder letter performance table (link), 1999 letter (link) and 2000 letter; Fortune on the Nasdaq’s 2000 peak (link); Goldman Sachs fund shareholder letter (SEC, https://www.sec.gov/Archives/edgar/data/822977/000095013001500217/dn30d.htm), Jan 12, 2001; AP via HeraldNet, Blue chips surge but technology issues fall again (link), Oct 29, 2000
- Korea Economic Daily, Where did the foreigners who sold KRW 200 trillion go (link), Oct 14, 2026; Korea Economic Daily, Foreign buying of Japanese stocks hits a record (link), Jul 2, 2026
- Samsung Electronics IR notices (link); DART, SK hynix notice of IR event (link), Oct 14, 2026; MSCI Index Review Dates (link)
- Yahoo Finance, closing prices of U.S.-listed ETFs and stocks and the won-dollar rate (Oct 23, 2026)
- Photos: JonClee86 (CC BY-SA 3.0), ::::=UT=:::: (CC BY-SA 3.0), Anas1712 (CC BY 4.0), Wilfredor (CC0), Jiaqian AirplaneFan (CC BY 3.0), Kakidai (CC BY-SA 4.0), Rowanswiki (CC0), Martian-2008 (CC BY-SA 4.0), Stevebidmead (CC0), via Wikimedia Commons
Disclaimer
This post records the author’s personal analysis and views based on publicly available information and does not recommend any particular product or company. It does not recommend buying or selling any financial investment product and is not an investment advisory service.
Figures are as published at the time of writing. The average foreign sale prices and this year’s gain, the dollar conversion of KRX net selling, the ratio of the current account surplus to foreign outflows and gold’s fall from its peak were calculated by the author from public data and market prices and are not confirmed facts. BofA and EPFR figures are cited from press reports, not the originals. Accuracy and completeness are not guaranteed.
“Author’s calculation,” “author’s view” and “author’s estimate” mark the author’s own calculations and assumptions, not confirmed facts. This post does not recommend trading at any particular time or promise any return.
Author’s interests: not disclosed
Responsibility for decisions and their outcomes lies with the reader.
As of: October 25, 2026
Was this note useful?
Thanks. Your answer helps decide what to cover next.
Korea market snapshot · Oct 27, 2026
New to Korean stocks? Start here for the basics.
Most read lately
3Balance Sheet Recession: Japan’s Lost Years and Korea’s KRW 2,000 Trillion Household Debt (2026)
4Commodity Cycle Order: Gold Peaks First, Grains Last, Rates Next (2026)
5Hanwha Succession: Who Gained Among the Three Kim Brothers, from One Basket to Three Paths
Get the Saturday note on Korean stocks
One email every Saturday with the week’s new research on Korean listed companies and links to the updated data pages. Built from DART filings and KRX data. Free; unsubscribe in one click. See past issues