Commodity Cycle Order: Gold Peaks First, Grains Last, Rates Next (2026)
English edition of the author’s Korean note on the commodity cycle.
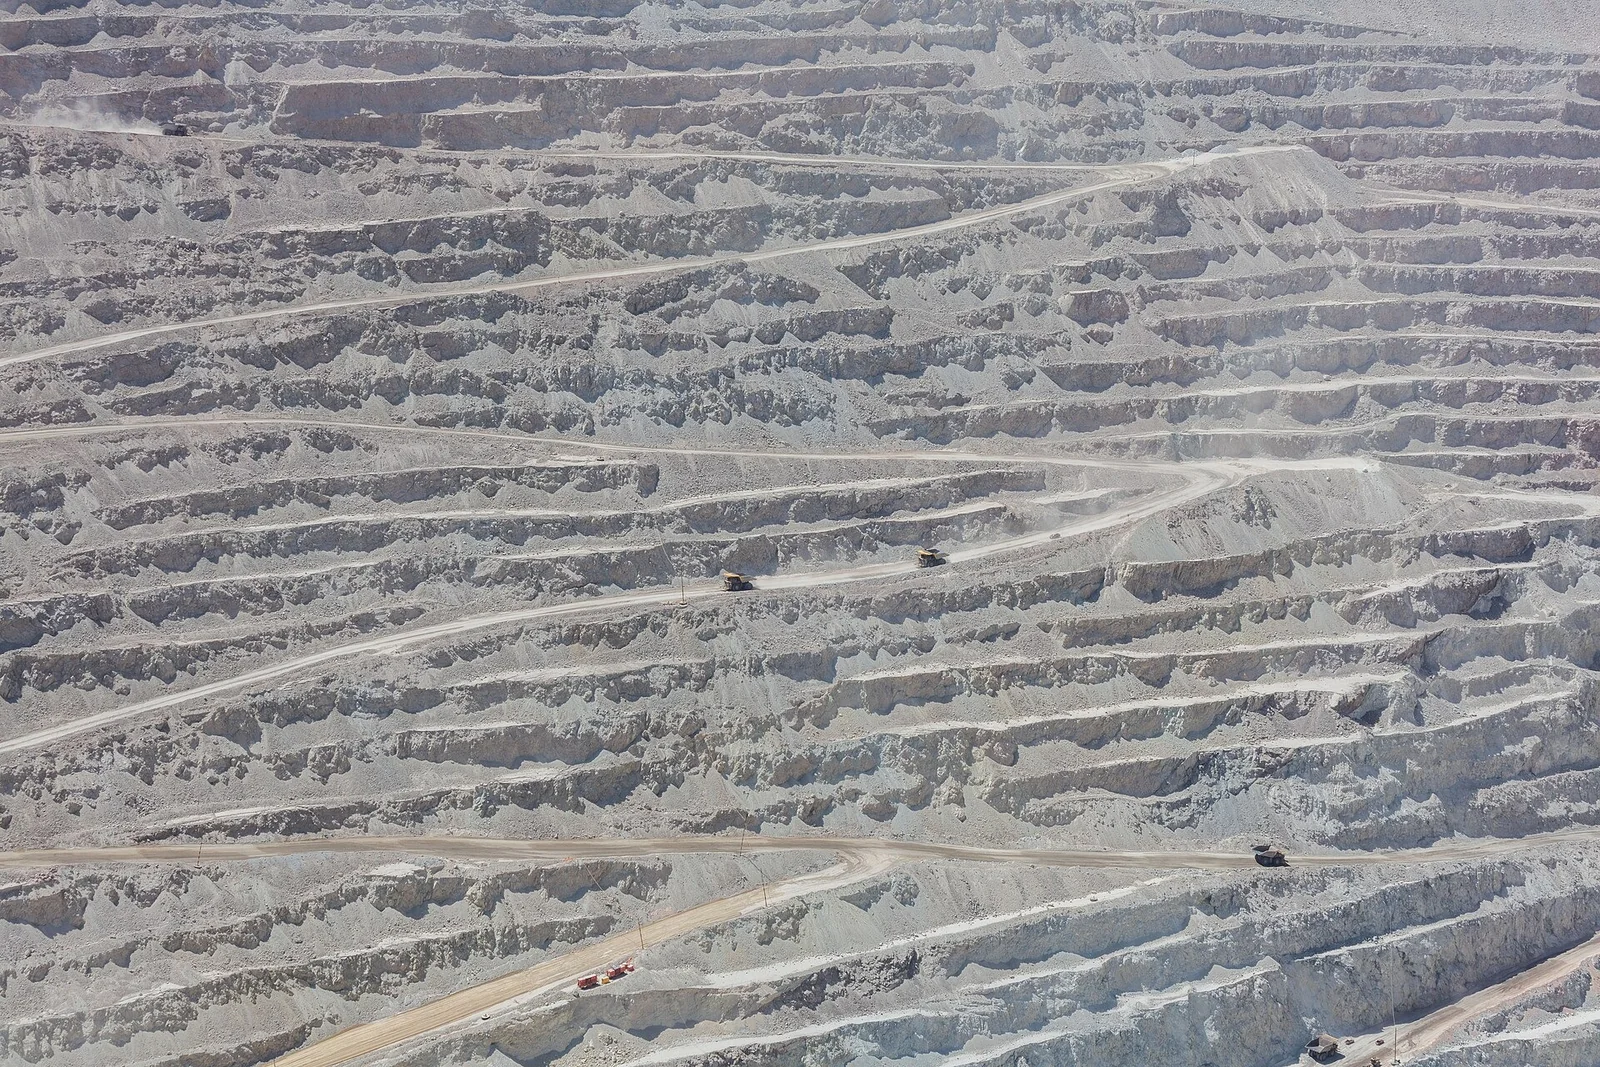
On September 29, 1980, the biologist Paul Ehrlich and the economist Julian Simon made a bet about natural resources. Ehrlich, who believed that a growing population would make resources scarce, picked five metals, chromium, copper, nickel, tin and tungsten, and notionally bought $200 of each, $1,000 in all. If their prices after inflation were higher ten years later, Simon would pay him the difference. Over that decade the world’s population grew by more than 800 million people. Yet on September 29, 1990, all five metals were cheaper after inflation, and in October that year Ehrlich mailed Simon a check for $576.07. Standing at the edge of a giant copper mine, the idea that more people must mean scarcer resources sounds obvious, but prices did not move that way.
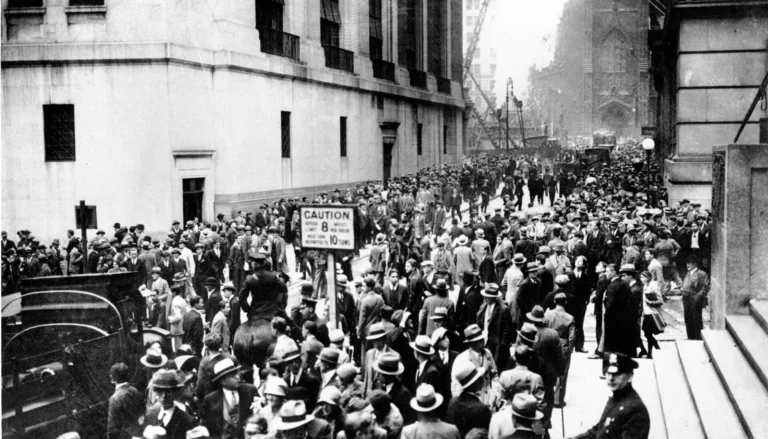
The story has a second half. In 2010 the economists Kiel, Matheson and Golembiewski re-ran the same bet over every possible ten-year window from 1900 to 2008. Simon would have won only 38.4% of them, and they counted 1980 to 1990 as one of the 15 worst periods in the whole 1900 to 2008 study. Their conclusion was that the lesson of the bet is not that resources can never run short, but that in a wager luck counts for more than expertise. In commodity prices, who turned out to be right depended less on scarcity or plenty than on when the clock started.
So this time the question is: gold, silver, copper, oil, fertilizer and grains have now risen one after another, so where in that chain are we, and what comes next? This report starts from the basic ideas for readers new to commodity investing and then follows, in order, why commodity prices swing so widely, the order shown by the last five commodity upswings, why each link from gold to grains rises, why supply cannot keep up and which industries win and lose, how the chain ends in inflation and interest rates and then runs back the other way, and the investment vehicles and taxes available to investors in Korea.
As of: October 25, 2026 (futures and share prices are closes on October 23; World Bank monthly prices are for September 2026; the FAO Food Price Index is the October 2 release). Won amounts are converted at KRW 1,326.0 per dollar, the USD/KRW rate on October 23, 2026.
Topics covered: basic terms and a hypothetical futures ETF example; why prices swing and how long mines take to build; the trough and peak order in five cycles and how many months each commodity lagged gold; prices after inflation; gold, real interest rates and central banks; the silver deficit and the gold/silver ratio; the copper ore shortage, tariffs and inventories; the 2026 oil shock; the link from gas to fertilizer and grains; the inflation peak and interest rates; the year after an oil peak; the World Bank outlook; cases where supply caught up; Korean stocks for each link; investment vehicles and tax; the author’s view and the signals to watch; and the basis of calculation.
Korean stocks covered: Korea Zinc (010130.KS), LS Corp (006260.KS), Taihan Cable & Solution (001440.KS), HD Hyundai Electric (267260.KS), Hyosung Heavy Industries (298040.KS), S-Oil (010950.KS), SK Innovation (096770.KS), Korean Air (003490.KS), Namhae Chemical (025860.KS), CJ CheilJedang (097950.KS) and Daehan Flour Mills (001130.KS), plus the ETFs ACE KRX Gold Spot (411060.KS) and KODEX Silver Futures (H) (144600.KS). Tickers ending in .KS trade on the KOSPI, the main board of the Korea Exchange (KRX). For comparison: CF Industries (CF), the VanEck Gold Miners ETF (GDX) and the Global X Copper Miners ETF (COPX).
Commodities pay no interest, so start with rates, the dollar and the cost of rolling futures
The conclusion of this chapter is that investing in commodities differs from investing in stocks in three ways. Commodities produce no profits or interest, so interest rates become the cost of holding them. Their prices are set in dollars, so they sway with the strength of the dollar. And most commodity investment products hold futures rather than the physical goods, so they carry a cost each time the contracts are rolled. With these three in mind, the order and timing that come later in this report are much easier to see.
Commodities fall into four groups, and each group moves for different reasons
Commodities, or raw materials, are usually sorted into four groups. Precious metals such as gold, silver and platinum are used in jewellery and industry, but their prices move mainly on confidence in the value of money. Industrial metals such as copper, aluminium, nickel and zinc go into power lines, buildings, cars and machines, and move with the business cycle and investment. Energy, meaning crude oil, natural gas and coal, powers factories and transport, so it moves with the economy but also swings hard on geopolitical supply shocks. Grains such as wheat, corn and soybeans, and the nitrogen, phosphate and potash fertilizers that grow them, move with the weather and with energy prices. The order this report talks about means that these four groups move one after another within the same cycle.
Commodities produce nothing while you hold them
A company earns profits and pays dividends, and a bond pays interest. A gold bar or a slab of copper in a warehouse produces nothing; it only costs storage and insurance. So when interest rates are high, holding commodities costs more than keeping the same money in a deposit or a government bond, and when rates look set to fall, that cost shrinks. The real interest rate, the rate after inflation, matters most. Even if a deposit pays 5%, prices rising 4% leave a gain in purchasing power of only about 1%. That is why gold tends to move against real interest rates.
Prices are set in dollars, so a weaker dollar makes commodities dearer in dollars
Almost every international commodity market prices in dollars. When the dollar weakens against other currencies, it takes more dollars to buy the same ounce of gold, so the dollar price rises. Investors in Korea have one more layer. A commodity product bought in won rides both the international price and the won/dollar exchange rate. Korean products that strip out the currency effect carry “(H)” at the end of their names, for hedged; they follow only the international price and leave the exchange rate out.
Futures are promises about future prices, and they must be rolled at every expiry
Most commodity products hold futures instead of the physical goods. A futures contract is a promise to buy or sell at a set price on a set date. When a contract nears expiry, the fund sells it and buys the next month’s contract so it never has to take delivery; this is called rolling over. When later months are dearer than the near month, the market is in contango, and every roll means buying something dearer, so small losses build up. When the near month is dearer than later months, the market is in backwardation, which means goods are short right now, and every roll adds a small gain.
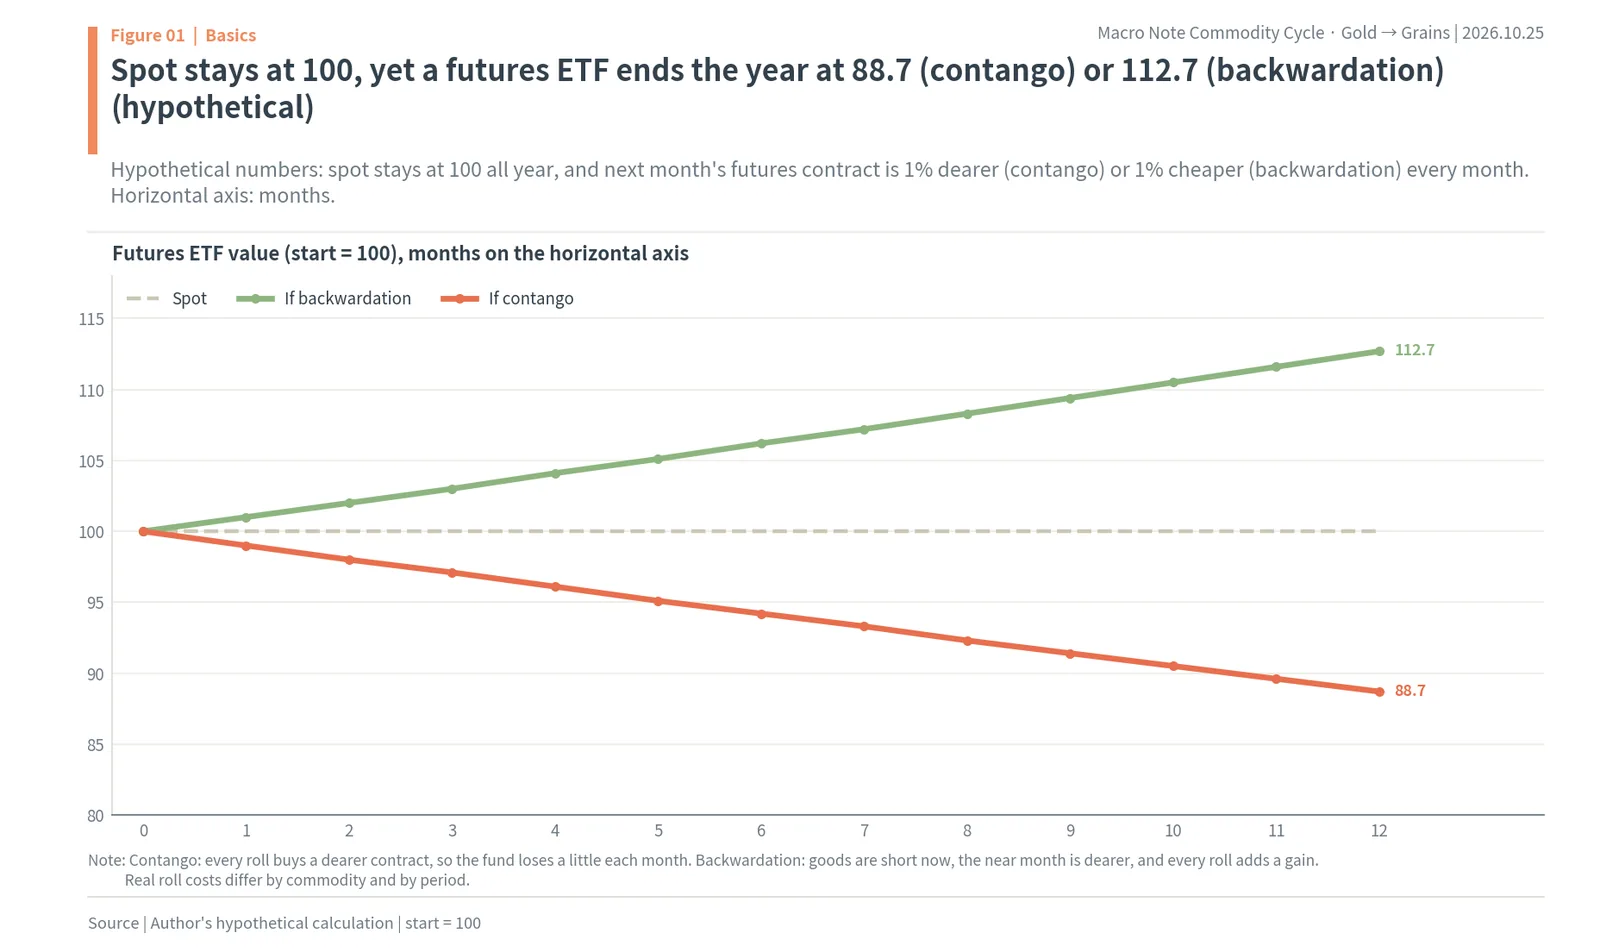
A hypothetical example shows how big the difference can be. Suppose the spot price of copper stays at 100 all year and the market stays in contango, with next month’s futures 1% dearer every month. A futures ETF that has to roll into a 1% dearer contract each month shrinks to about 88.7 after a year. The spot price has not moved, yet the product has lost more than 10%. If instead the market stays in backwardation, with the near month 1% dearer every month, the same calculation gives about 112.7 after a year. Real roll costs differ by product and period, but the point stands: the same commodity can give very different results depending on the product you hold it through.
A few more terms. Spot is the price for exchange right now, and a future is a promise that fixes a price ahead of time. AISC, or all-in sustaining cost, is what it costs a mine to produce one ounce of gold including operating costs and sustaining investment; when the price falls below it, mines struggle to keep going, so it acts as a floor. TC/RC, treatment and refining charges, is the processing fee a miner pays a smelter to take its ore; it rises when ore is plentiful and falls when ore is short. The gold/silver ratio is how many ounces of silver one ounce of gold can buy.
A mine takes 15.7 years from discovery to production, so slow supply makes commodity prices swing hard
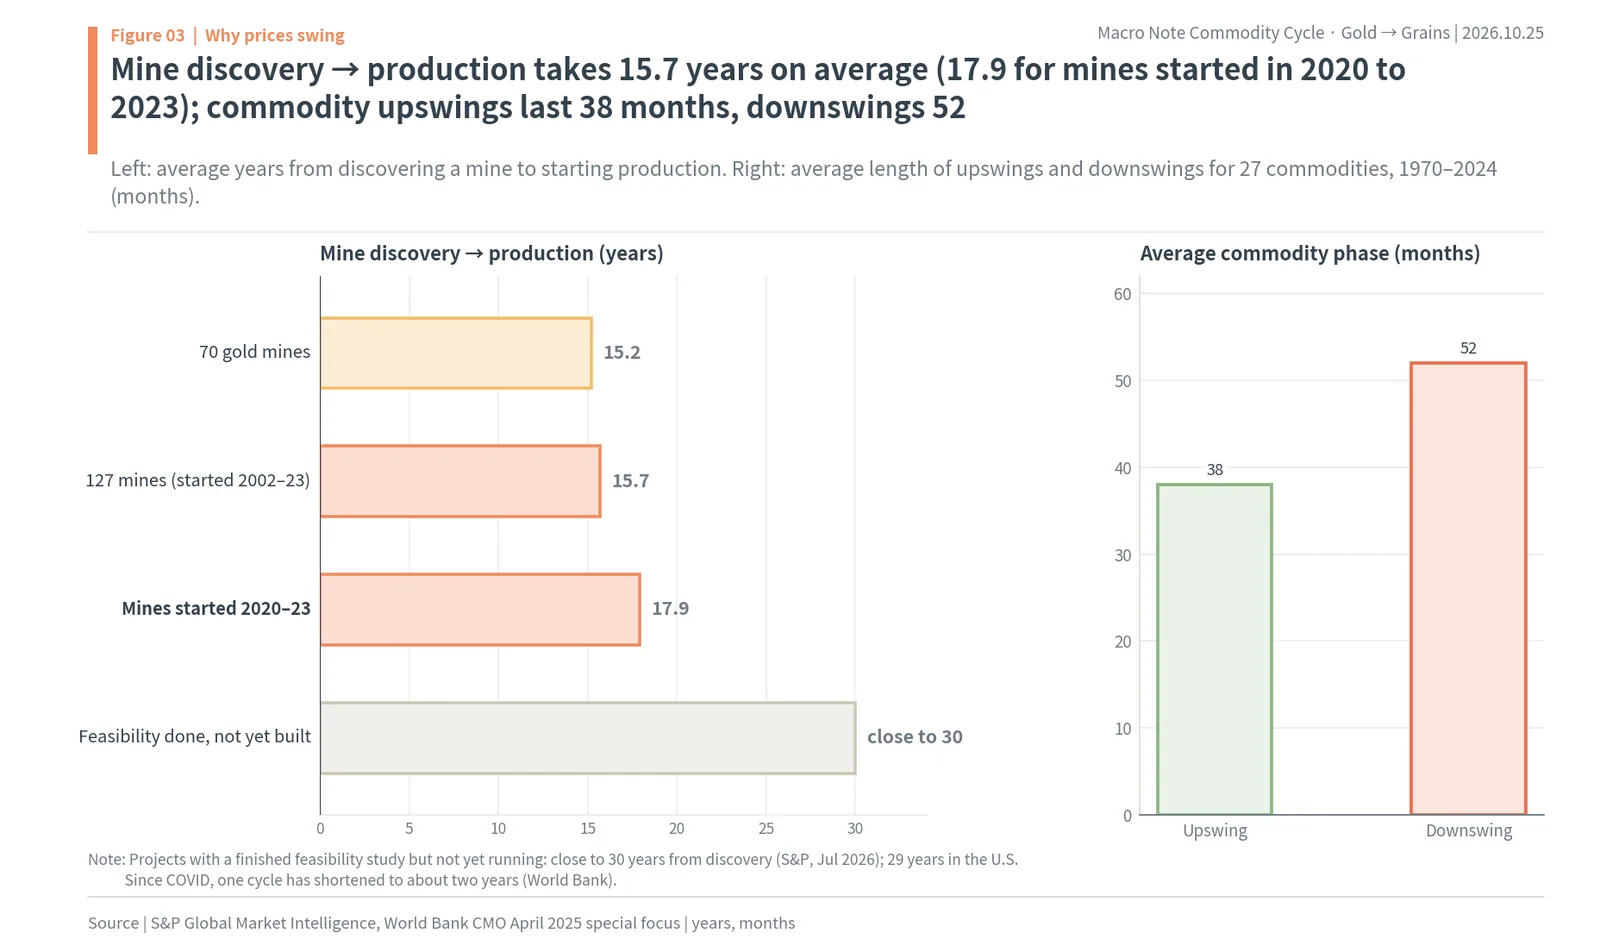
The conclusion of this chapter is that the big swings in commodity prices come from the slow response of supply. Demand can change within months with the economy and policy, but a new mine takes 15.7 years on average from discovery to production. So when demand rises, prices jump, and when mines started on the back of high prices open all at once a few years later, prices slump. On the World Bank’s count, commodity upswings last 38 months on average and downswings 52 months.
Demand changes fast, and what can be mined changes slowly
Commodity prices behave roughly like the amount needed divided by the amount that can be added right away. When factories get busy, power grids are rebuilt and electric cars multiply, demand for copper rises within a year or two. But the mines already running are producing at close to capacity, so little can be added quickly. Even when a new deposit is found, it takes a long time to confirm reserves, win permits, bring in roads, power and water, and build the plant.

S&P Global Market Intelligence studied 127 mines that started production between 2002 and 2023 and found that discovery to production took 15.7 years on average. For mines that started production in 2020 to 2023 it lengthened to 17.9 years, and the 70 gold mines in the study averaged 15.2 years. A July 2026 study found that projects that had finished feasibility studies but were not yet running had taken close to 30 years since discovery. Permits, agreements with local communities and stricter environmental standards are to blame. A World Bank analysis of 27 commodities over 1970 to 2024 found that upswings lasted 38 months and downswings 52 months on average, and that since COVID one cycle has shortened to about two years.
Prices have a floor, but high prices build their own ceiling
Every mine has a cost to produce one unit. When the price falls below the cost of the most expensive mines, they close and supply shrinks, and that creates a floor under the price. The all-in sustaining cost (AISC) of gold mines averaged $1,785 an ounce in the first quarter of 2026. A gold price of around $4,000 today is more than twice that, far from the floor.
The ceiling, by contrast, is built by high prices themselves. There is an old market saying that the cure for high prices is high prices. Nobody knows who said it first; the earliest dated use is a 1918 letter by the financier Henry Clews. When prices get high, users use less or switch to other materials, producers invest more, and scrap and recycling pick up. As these responses pile up, the shortage eases and the price turns down. In this report, substitution in silver and copper and the supply growth in lithium and iron ore are examples.
So commodity investing is a question of when more than what
When demand rises and supply follows slowly, buying the same commodity at different times can give opposite results. That is just how the winner of the Simon and Ehrlich bet depended on the starting date. So from the next chapter on, this report looks not at single commodities but at the order in which they move. Knowing which link is running now helps you guess what comes next and what is ending.
In all five upswings, gold and silver peaked first, copper and oil about half a year later, and fertilizer and grains a year later
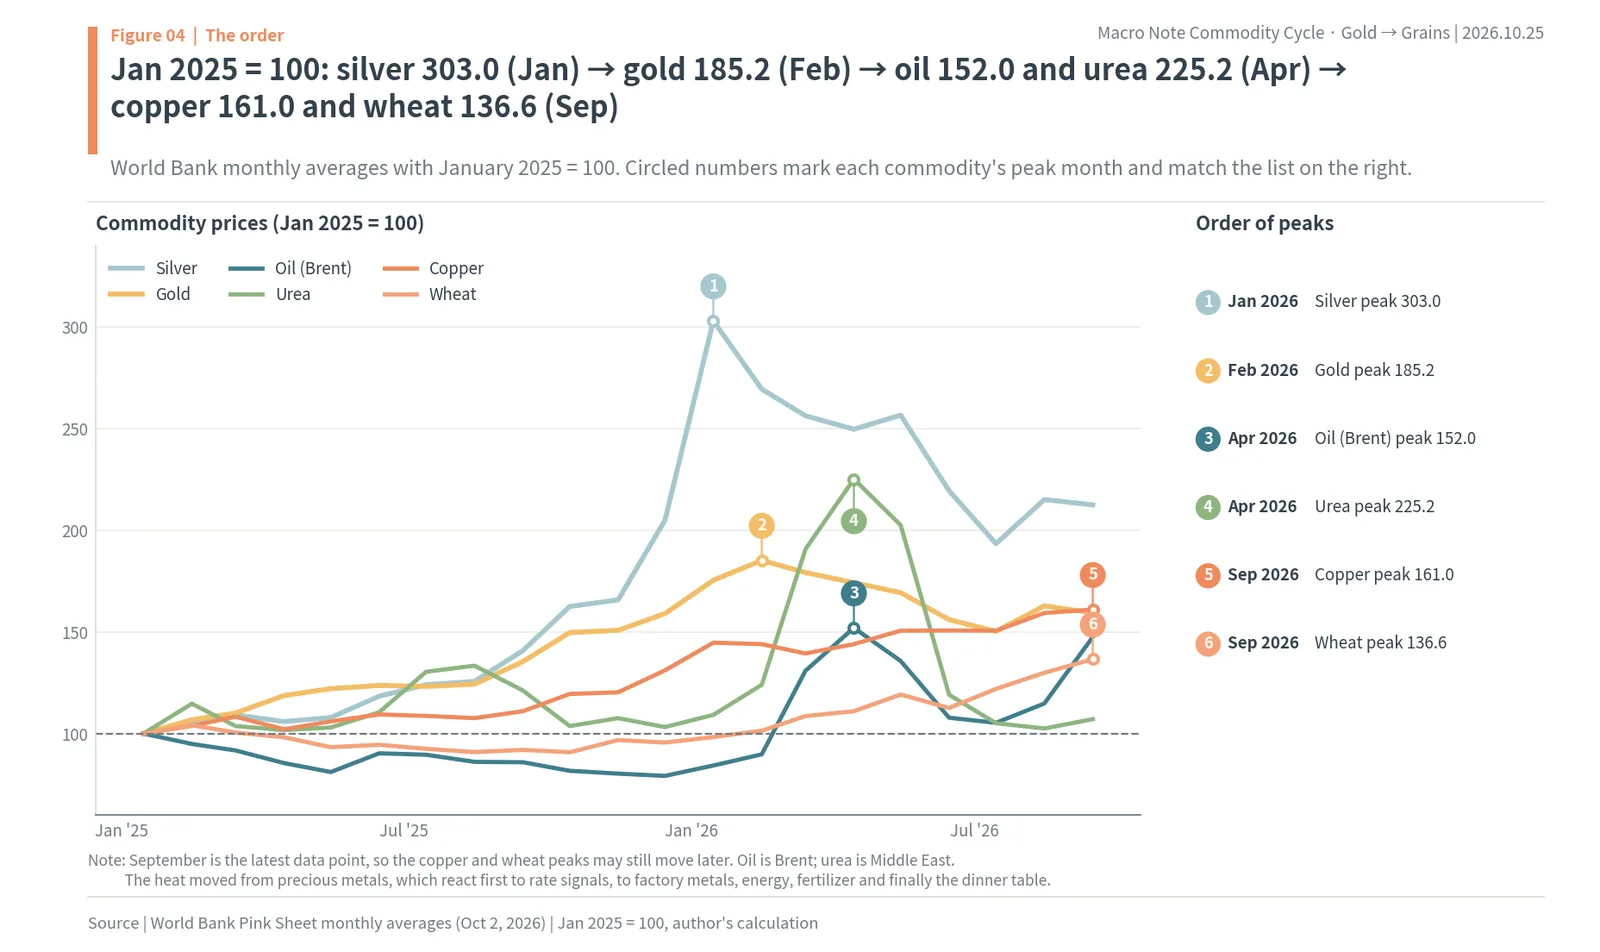
The conclusion of this chapter is that commodities do not rise and fall at random; they move in nearly the same order every time. Using World Bank monthly averages for the five upswings since 1999, the peaks came later than gold’s by 7 months for copper, 6 months for oil, 8 months for fertilizer (urea), 10 months for corn and 14 months for wheat (medians, author’s calculation). In 2025 and 2026 the same order held: silver peaked in January, gold in February, oil and urea in April, and copper, wheat and corn in September.
2025 to 2026: where this cycle’s chain has passed
Start with the most recent chain. Setting World Bank monthly averages at January 2025 = 100, silver rose first and furthest, to 303.0 in January 2026, and gold peaked at 185.2 in February. Brent crude then peaked at 152.0 in April and urea at 225.2 in April. Copper peaked at 161.0, wheat at 136.6 and corn at 111.8, all in September and all last; September is still the latest month, so the peaks of these three may yet move later. The heat moved from precious metals, which react first to signals about interest rates, to factory materials, energy, fertilizer and finally the dinner table, in the same order as before.
Troughs and peaks in five cycles, and how many months each came after gold
To see whether this time was special, the author took each commodity’s trough month and peak month in the five upswings since 1999 (the 2000s, 2009 to 2011, 2016 to 2018, 2020 to 2022 and 2022 to 2026). Counting how many months each lagged gold and taking the median, troughs came 0 months after gold for silver, 1 month for copper, 1 month for oil, 8 months for fertilizer, 11 months for wheat and 12 months for corn. Peaks came 1 month earlier than gold for silver (almost together), and 6 months later for oil, 7 for copper, 8 for fertilizer, 10 for corn and 14 for wheat. Oil peaked after gold in all five cycles and copper in four of five, and wheat and corn peaked 7 months or more after gold every time except once in the 2000s.
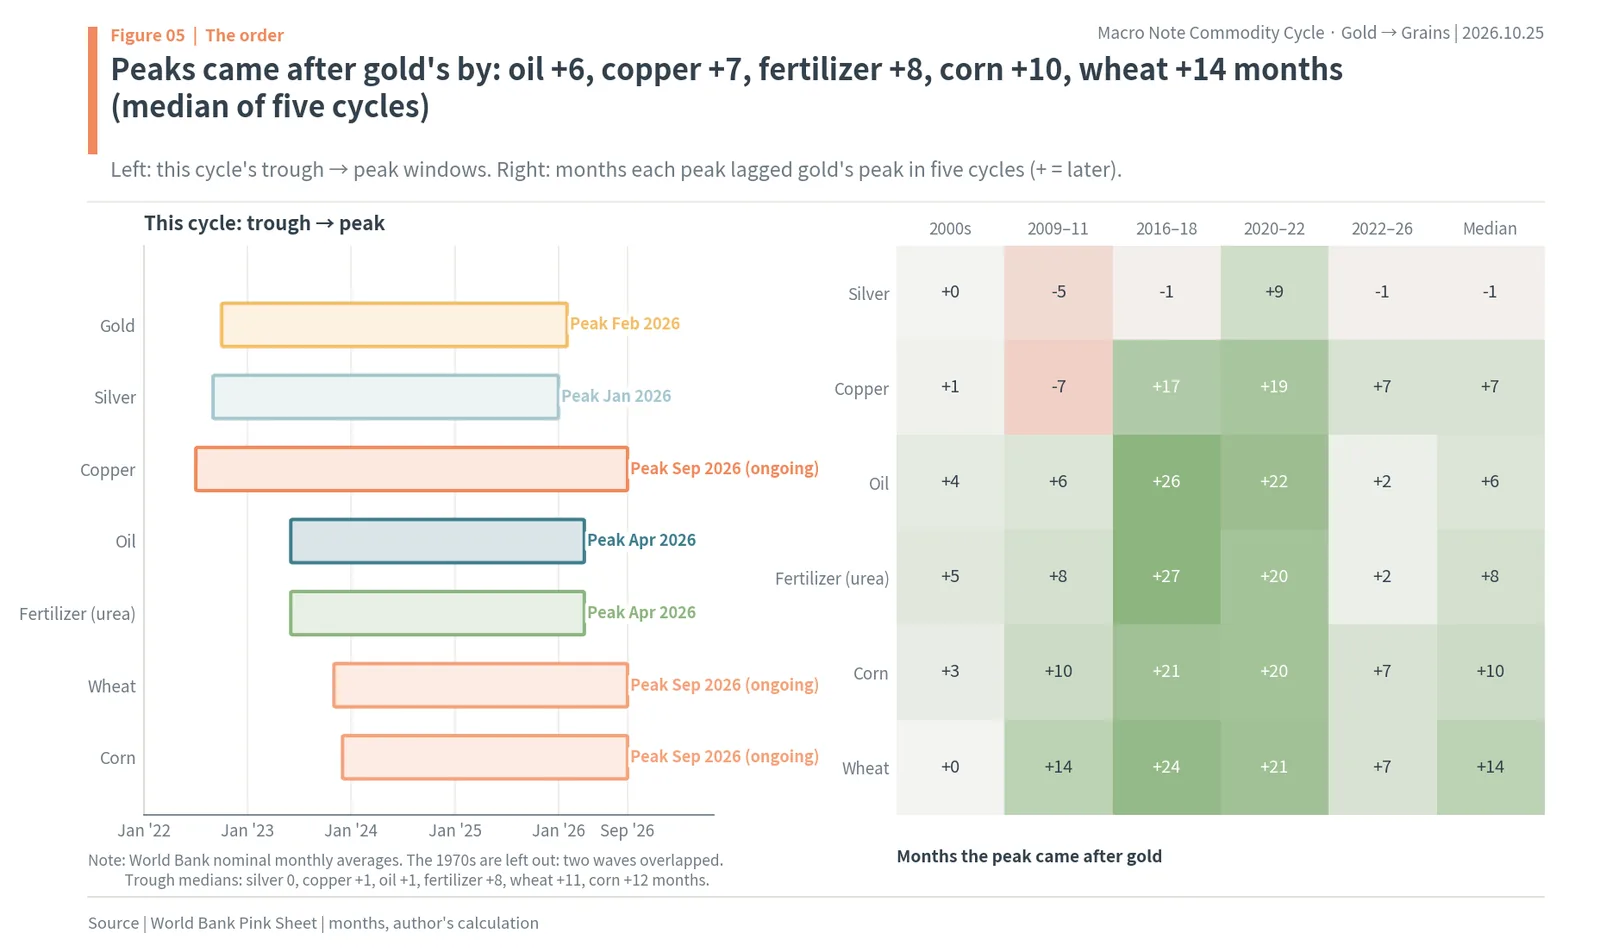
The order exists because each link reacts to something different. Gold reacts to expectations about interest rates and the dollar, so it is fastest. Silver rides both the heat in gold and factory demand. Copper rises only when spending on factories and power grids actually increases, and oil gets used more when those factories and transport actually run. Fertilizer takes a few months for gas prices to pass into its costs, and grains need a full farming cycle of buying fertilizer, planting and harvesting before prices respond. It takes time to go from expectations to investment, from investment to operation, from operation to costs, and from costs to the dinner table.
Measured again with group indices, the direction is the same
The author measured it again with World Bank group indices instead of single commodities, using cross-correlation: comparing 12-month changes from 2000 to 2026 and finding the lag at which they match best. Precious metals led base metals by 1 month (correlation 0.50), base metals led energy by 1 month (0.66) and energy led fertilizer by 2 months (0.57), and precious metals led agriculture by 4 months (0.44) and fertilizer by 10 months (0.44). Fertilizer and grains moved almost together, because when grain prices rise farmers buy more fertilizer, so the two push and pull on each other.
The 1970s are better looked at separately. Then the 1973 to 1974 oil shock and food crisis came first (the monthly average oil price rose about 4.4 times in a year, wheat peaked in February 1974 and urea in January 1974), and gold and silver peaked in January 1980. Because two waves overlapped, the period was left out of the median calculation. Even so, the second wave, with an oil peak in November 1979, a precious metals peak right after in January 1980, and then a long fall in every commodity under the Federal Reserve’s high interest rates, matches the last link in this report.
After inflation, only gold has passed its old peak
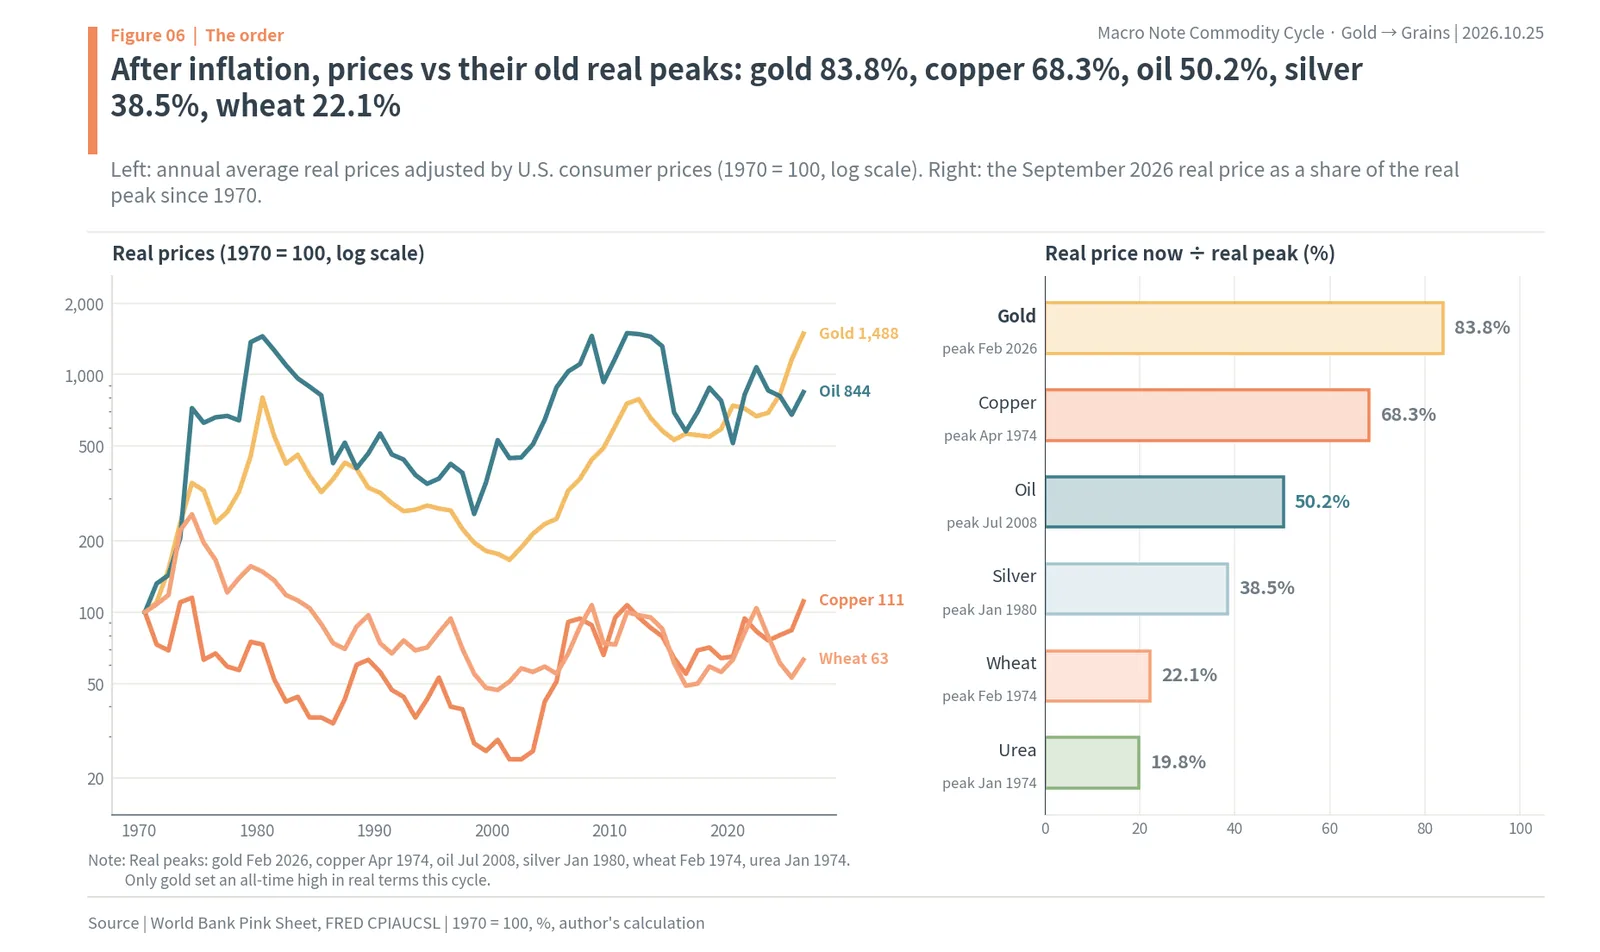
Nominal prices look high partly because the general price level has risen. Converted into September 2026 dollars using U.S. consumer prices, gold’s February 2026 price was a record even in real terms, and gold now stands at 83.8% of it. Copper is at 68.3% of its April 1974 peak, oil at 50.2% of July 2008, silver at 38.5% of January 1980, wheat at 22.1% of February 1974 and urea at 19.8% of January 1974. That only gold set a new real high shows that the front of this upswing was a precious metals market driven by central banks and distrust of money; grains and fertilizer rose a lot in this cycle but remain far below their old peaks after inflation.
① Money moves first: gold bottoms when rates look set to fall, and since 2022 central banks have masked its link with rates
The conclusion of this chapter is that gold is the first link of the chain. Gold moves less on what it is used for than on whether money can be trusted, so it bottoms first when interest rates look set to fall. From 2022, after Russia’s foreign reserves were frozen, central banks bought more than 1,000 tonnes a year, so gold rose even while rates were high. Gold futures peaked at a close of $5,318.4 on January 29, 2026 and fell to $4,007.9 on October 23, a move of -24.6%.
Gold bottomed when the direction of rates turned
Gold’s troughs have always come around turns in the direction of interest rates. The November 2008 trough came as the Federal Reserve cut its policy rate to near 0% (the effective federal funds rate was 0.39% that month), and the December 2015 trough came in the month of the Fed’s first hike in nine years (0.24%). The September 2018 trough came ahead of the last hike that December (1.95%), and the October 2022 trough came when the Fed’s pace of 0.75 percentage point hikes peaked (3.08%). Gold moves not after rates actually fall but at the moment it starts to look as if they will not rise any further.
At its peaks, real interest rates were low. At the September 2011 peak the real yield on 10-year inflation-protected Treasuries (TIPS) was 0.08%, and at the August 2020 peak it was -1.01%. At the January 2026 peak it was 1.91%, far higher than before, and what filled that gap was central bank buying.
Since 2022, central banks have doubled their gold buying
In 2022, when Russia was cut off from the international payment network and about $300 billion of its central bank assets were frozen, central banks around the world were reminded that their dollar assets could be frozen by another country. According to the World Gold Council (WGC), central banks’ net gold purchases averaged 473 tonnes a year from 2010 to 2021, then reached 1,080.0 tonnes in 2022, 1,050.8 tonnes in 2023 and 1,092.4 tonnes in 2024, above 1,000 tonnes three years running. In 2025 they fell 21% to 863.3 tonnes, and Poland was the largest buyer for the second year in a row at 102 tonnes. The first half of 2026 brought 345 tonnes (57 tonnes in the first quarter and 288.9 tonnes in the second), the smallest first half since 2022, and central banks bought another 62 tonnes in July and August. In the WGC’s 2026 survey a record 45% of central banks said they planned to raise their gold holdings.
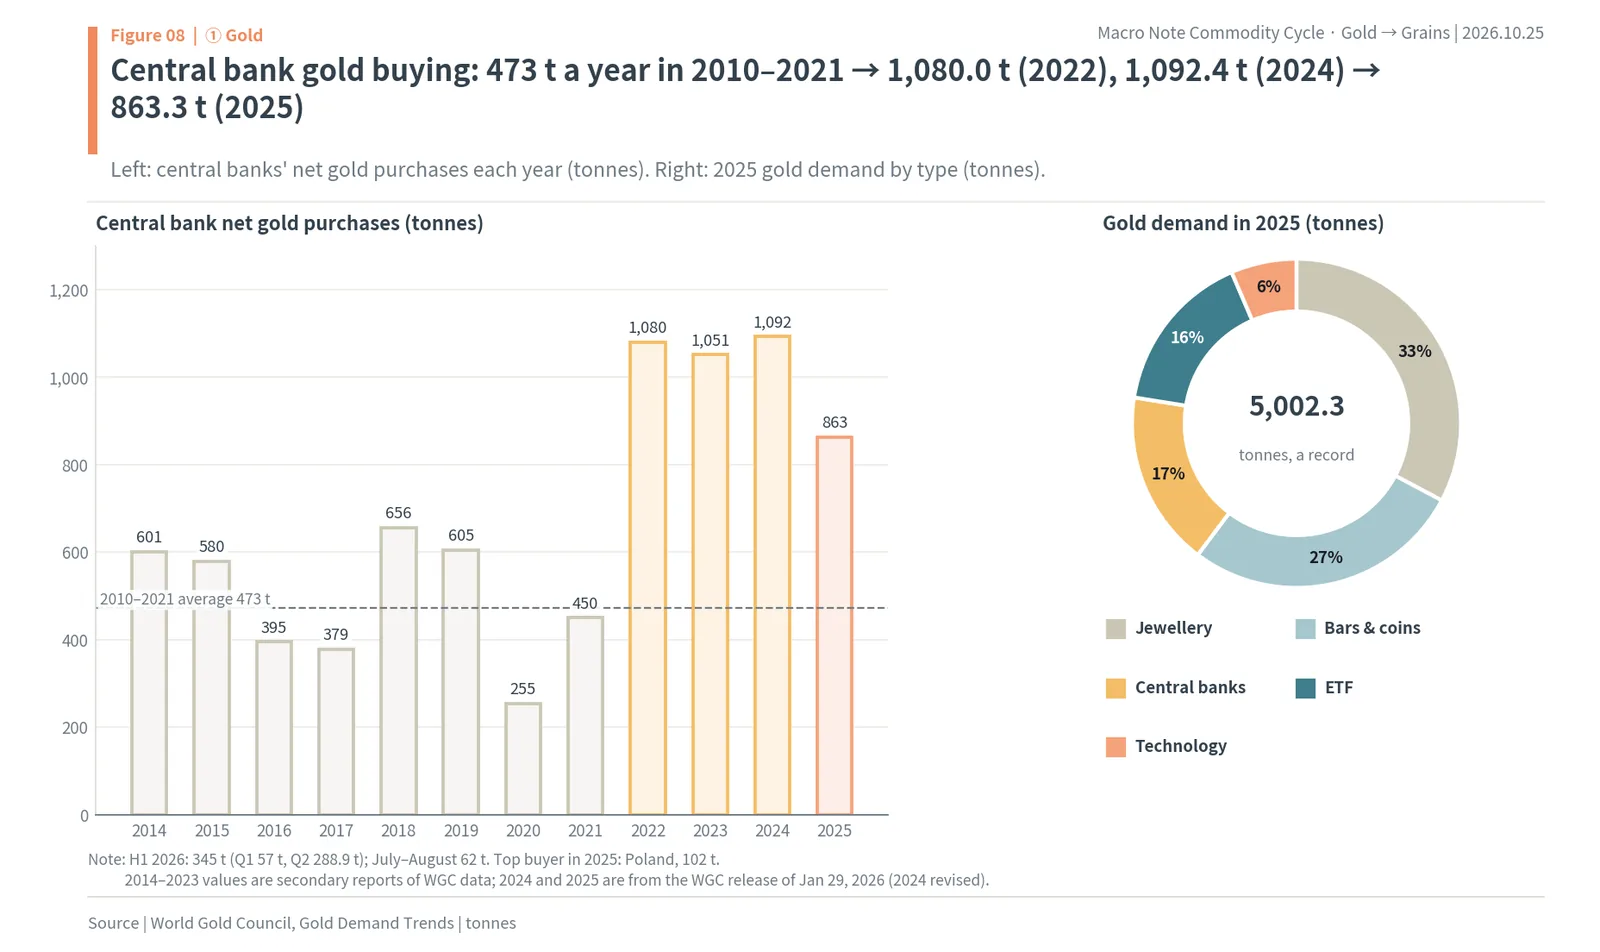
Gold demand in 2025 was a record 5,002.3 tonnes: jewellery fabrication 1,638.0 tonnes, bars and coins 1,374.1 tonnes, ETFs 801.2 tonnes, central banks 863.3 tonnes and technology 322.8 tonnes. Supply was 3,671.6 tonnes from mines and 1,404.3 tonnes from recycling. Mine output was a record, but it grows only a little each year, so when investment and central bank demand rise, the price has to move first.
So gold’s link with real rates was masked for four years
An analysis by RBC Wealth Management found that the share of the gold price explained by real interest rates (R squared) was 84% in 2005 to 2021, but fell to 3% in 2022 and 2023 and to 7% from 2024 on. Rates went up, but central banks kept buying, so gold did not follow rates. 2026 was different. Central bank buying slowed to 57 tonnes in the first quarter, and as inflation rose after the Iran war and the U.S. 10-year real yield climbed to 2.74% on October 16, gold began to follow rates again.

Gold in 2025 and 2026: events and prices
Gold futures first closed above $4,000 on October 7, 2025 and peaked at $5,318.4 on January 29, 2026. That day the London afternoon price (LBMA PM) was $5,405.00 and the intraday spot high was $5,595.47. The next day, January 30, President Trump nominated Kevin Warsh as the next Fed chair, and gold futures fell 10.8% in a single day (author’s calculation, futures closes). Gold did not rise even after the United States and Israel struck Iran on February 28, and as inflation and interest rates rose together it fell to $3,992.1 (futures close) on July 16. On September 16 the Fed raised its policy rate by 0.25 percentage point to a range of 3.75% to 4.00%. The WGC cited profit-taking, a hawkish Fed, central bank selling in the first quarter and India’s higher gold import duty as reasons for the fall.
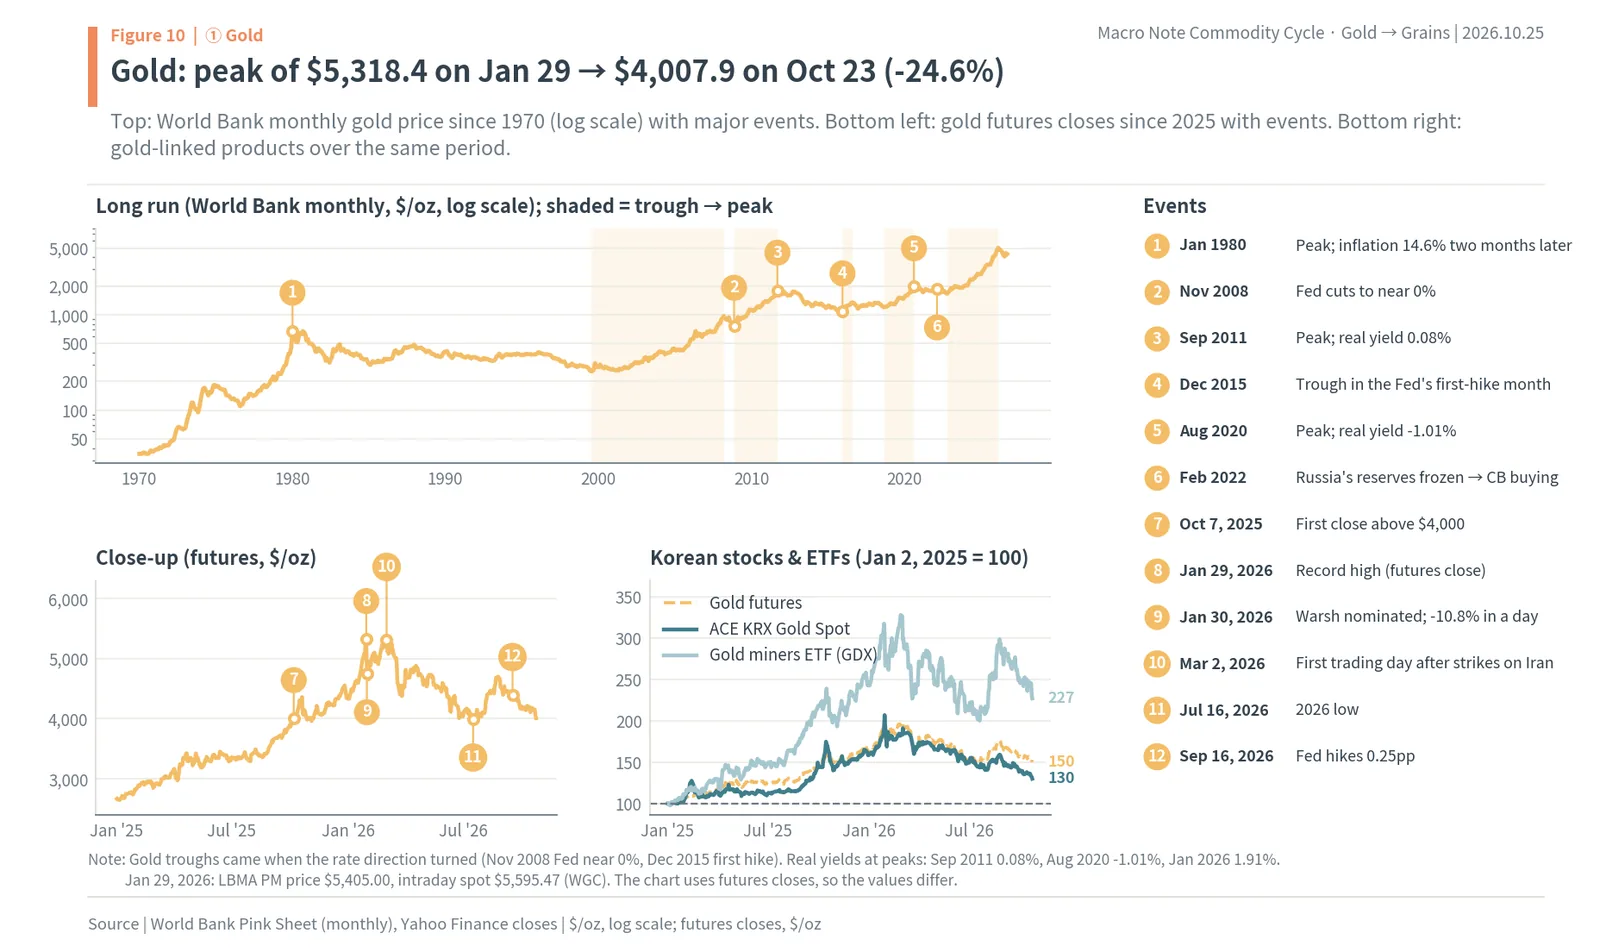
Over the same period Korea’s ACE KRX Gold Spot ETF swung harder than gold futures. While gold rose, from October 31, 2022 to January 28, 2026, ACE KRX Gold Spot gained 225.5% and gold futures 223.3%, and from the peak to October 23 they returned -32.6% and -24.4%. The won and the local premium on Korean gold moved along with the gold price. The gold miners ETF (GDX) has moved 1.83 times as much as gold in monthly returns since 2000 (author’s calculation).
The meaning of the gold link is clear. Gold reacts first to signs that rates will fall, and that monetary heat then spreads to silver, a smaller market. At the last link, when rates rise, gold is the first to turn down.
② Later and twice as hard: silver is half a factory material and seven-tenths a by-product, so it doubles the heat in gold
The conclusion of this chapter is that silver is the second link, the one that amplifies the heat in gold. The silver market is small and more than half of its use is as a factory material, so when gold rises silver rises a little later and nearly twice as much, and when gold turns down silver falls nearly twice as hard. Silver futures peaked at $115.08 on January 26, 2026 and fell to $53.95 on October 23, a move of -53.1%.
Silver rose more than gold in all five upswings
In all five upswings silver rose more than gold. From trough to peak, silver and gold gained 371% against 278% in the 2000s, 331% against 133% in 2009 to 2011, 42% against 25% in 2016 to 2018, 92% against 64% in 2020 to 2022, and 387% against 202% in this 2022 to 2026 cycle (World Bank monthly averages, author’s calculation). In monthly returns since 2000, silver moved 1.43% on average for every 1% move in gold, and its volatility was 1.88 times gold’s. It fell harder too: from the April 2011 peak to December 2015, silver dropped 67.0% while gold dropped 39.3%.
Seven-tenths of silver is a by-product, so higher prices do not easily bring more supply
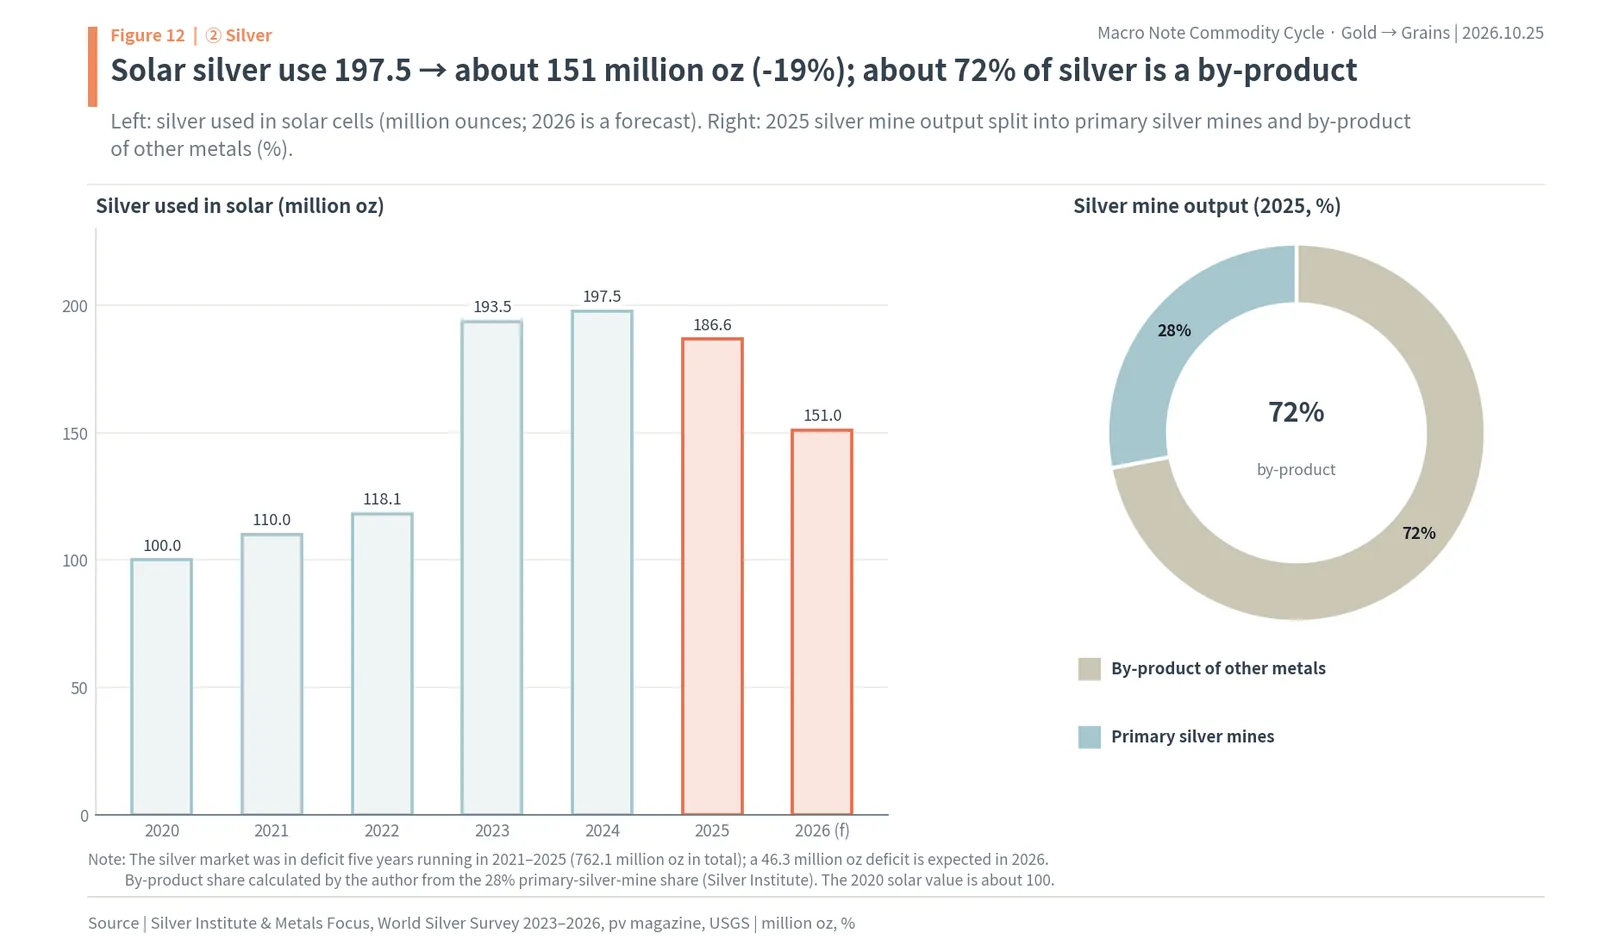
The U.S. Geological Survey (USGS) explains that silver comes mainly as a by-product of lead-zinc, copper and gold mines. Primary silver mines, which mine mainly for silver, produced only 28% of 2025 output, so about 72% came as a by-product of mining other metals (author’s calculation). Even if the silver price doubles, a zinc mine will not double its output for the sake of silver. That makes silver one of the metals whose supply responds least to price.
According to the Silver Institute’s World Silver Survey 2026, the silver market was in deficit five years running from 2021 to 2025. In 2025 supply was 1,090.4 million ounces and demand 1,130.6 million ounces, a shortfall of 40.3 million ounces, and over the five years a total of 762.1 million ounces was drawn from above-ground stocks. The survey expects a sixth deficit year in 2026, of 46.3 million ounces. Industrial uses account for 58% of demand. In October 2025 silver available to borrow in London ran so short that the one-month lease rate topped 30%, against a usual level of around 0.35%.
The cure for expensive silver was expensive silver: solar started using less
The fastest-growing use of silver was solar power, because the electrodes on solar cells are printed with silver paste. Silver used in solar doubled from about 100 million ounces in 2020 to 193.5 million ounces in 2023 and 197.5 million ounces in 2024. But when silver prices jumped, cell makers switched to designs that use less silver and to copper paste. Use fell to 186.6 million ounces in 2025 and is expected to drop to about 151 million ounces in 2026 (-19%), the biggest fall on record.

This response, high prices cutting demand, was also a signal that the silver link was turning. Because silver is a by-product, its shortages are hard to fix through supply, but they do get fixed through substitution on the demand side.
The gold/silver ratio tells you whether silver is cheap or dear
The gold/silver ratio, the number of ounces of silver that one ounce of gold can buy, is the simplest yardstick for timing silver. Using month-end prices since September 2000, buying silver in a month when the ratio was above 90 (15 months in all) was followed by a median one-year gain of 65.9%, far more than gold’s 24.7%. Buying in a month when the ratio was 50 or below (21 months) was followed by -0.5% for silver, worse than gold’s 16.0% (author’s calculation). A high ratio means silver is cheap relative to gold, and a low ratio means it is dear.
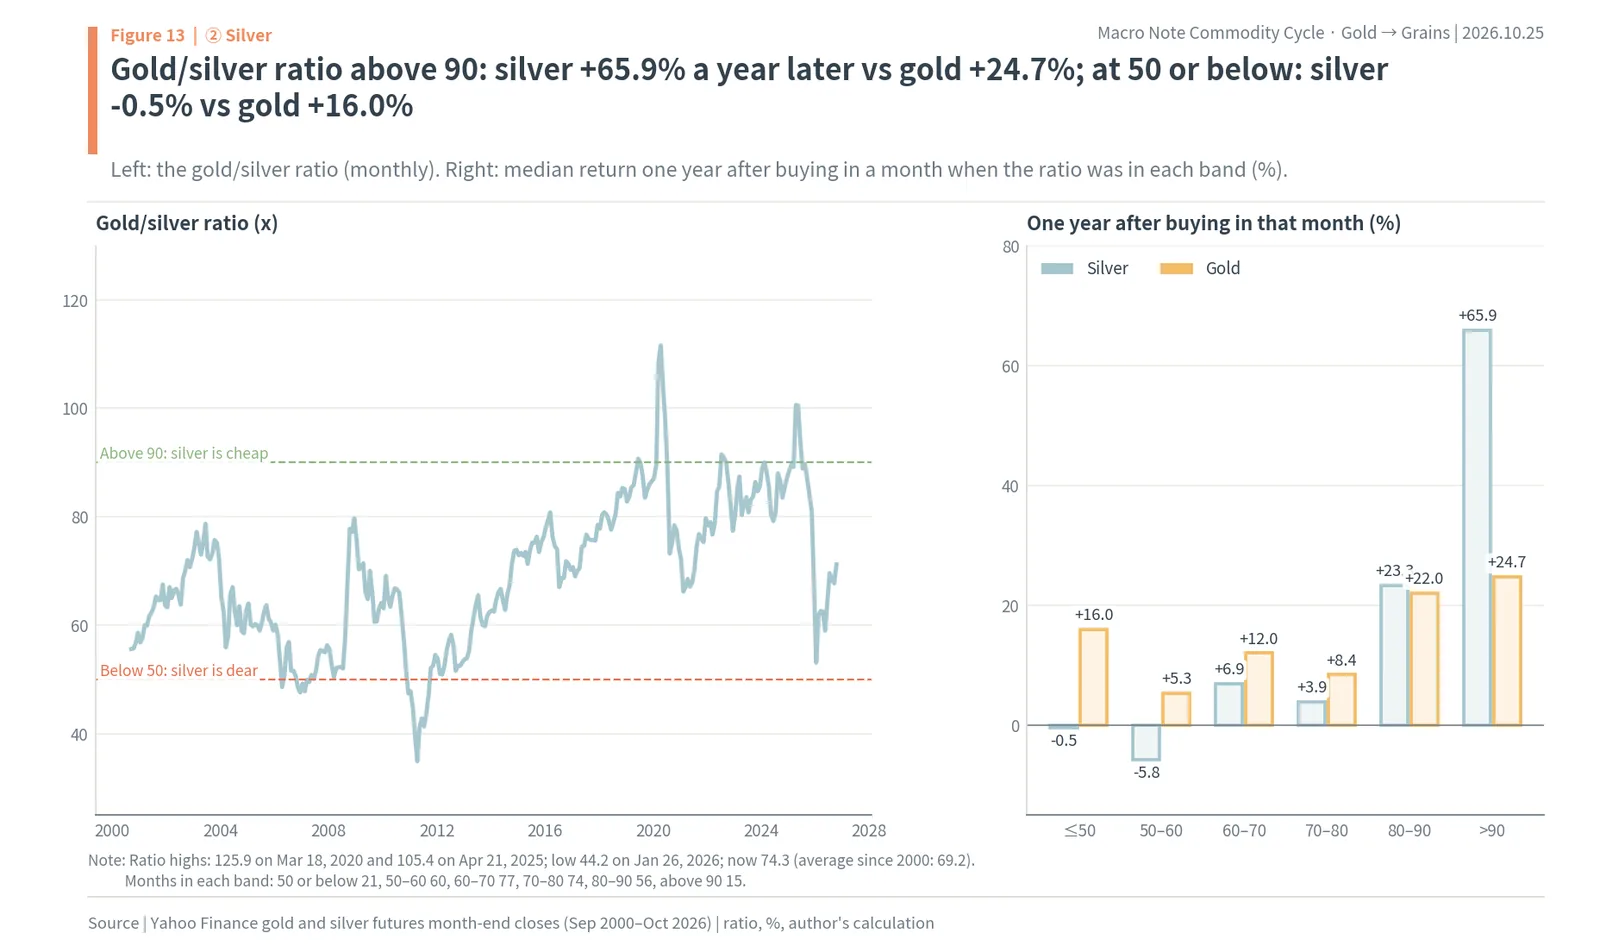
This cycle followed the pattern. The ratio was near its record at 125.9 on March 18, 2020, and silver was still very cheap at 105.4 on April 21, 2025. From that day to the January 26, 2026 peak, silver rose 254.1%. On the peak day the ratio was 44.2, the lowest since 2011 (it had been 32.0 on April 25, 2011). Silver turned down just as it became most expensive relative to gold. The ratio is now 74.3, against an average of 69.2 since 2000.
Silver in 2025 and 2026: events and prices
Spot silver rose above $50 on October 9, 2025 for the first time since 1980, and futures first closed above $50 on October 13. That was when London lease rates spiked. Silver futures peaked at a close of $115.08 on January 26, 2026, and spot reached $121.67 intraday on January 29. On January 30, the day of the Warsh nomination, silver futures fell 31.3% in a single day (author’s calculation). The speed recalled January 1980, when the Hunt brothers had cornered about 195 million ounces of silver and pushed the price above $50, only to see it collapse to $10.80 on March 27, “Silver Thursday” (it had been $29.75 on March 10).
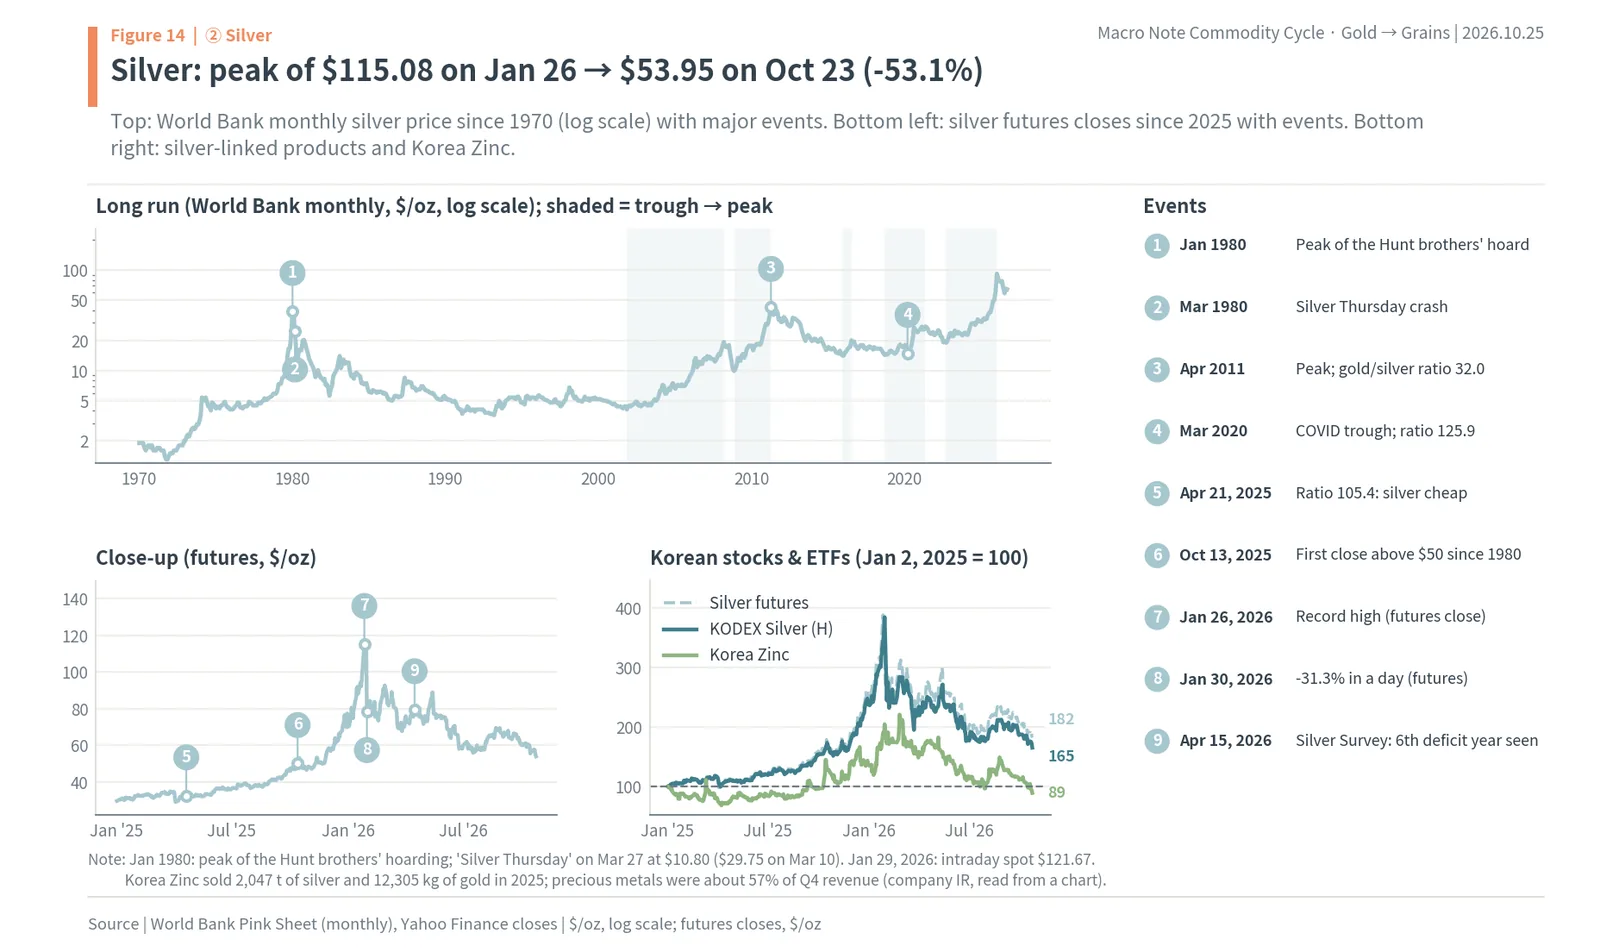
In Korea, Korea Zinc (010130.KS) shows the silver link best. Korea Zinc sold 2,047 tonnes of silver and 12,305 kg of gold in 2025, and precious metals made up about 57% of its fourth-quarter revenue (silver 37%, gold 20%, read from a chart in the company’s IR presentation). While gold and silver rose, from October 31, 2022 to January 28, 2026, Korea Zinc gained 181.4%, and from the peak to October 23 it fell 52.6%, almost in step with silver (-52.3%). Korea Zinc’s share price also reflects company events such as its fight over management control and its share issue, which should be kept in mind. KODEX Silver Futures (H) returned 407.2% and -54.8% over the same two windows.
The meaning of the silver link is that it doubles the heat in gold. And the fact that more than half of silver demand is a factory material passes the chain on to the next link, the industrial metal copper.
③ Electricity calls for copper: what is short is ore, not copper metal, so copper hit records even after gold turned down
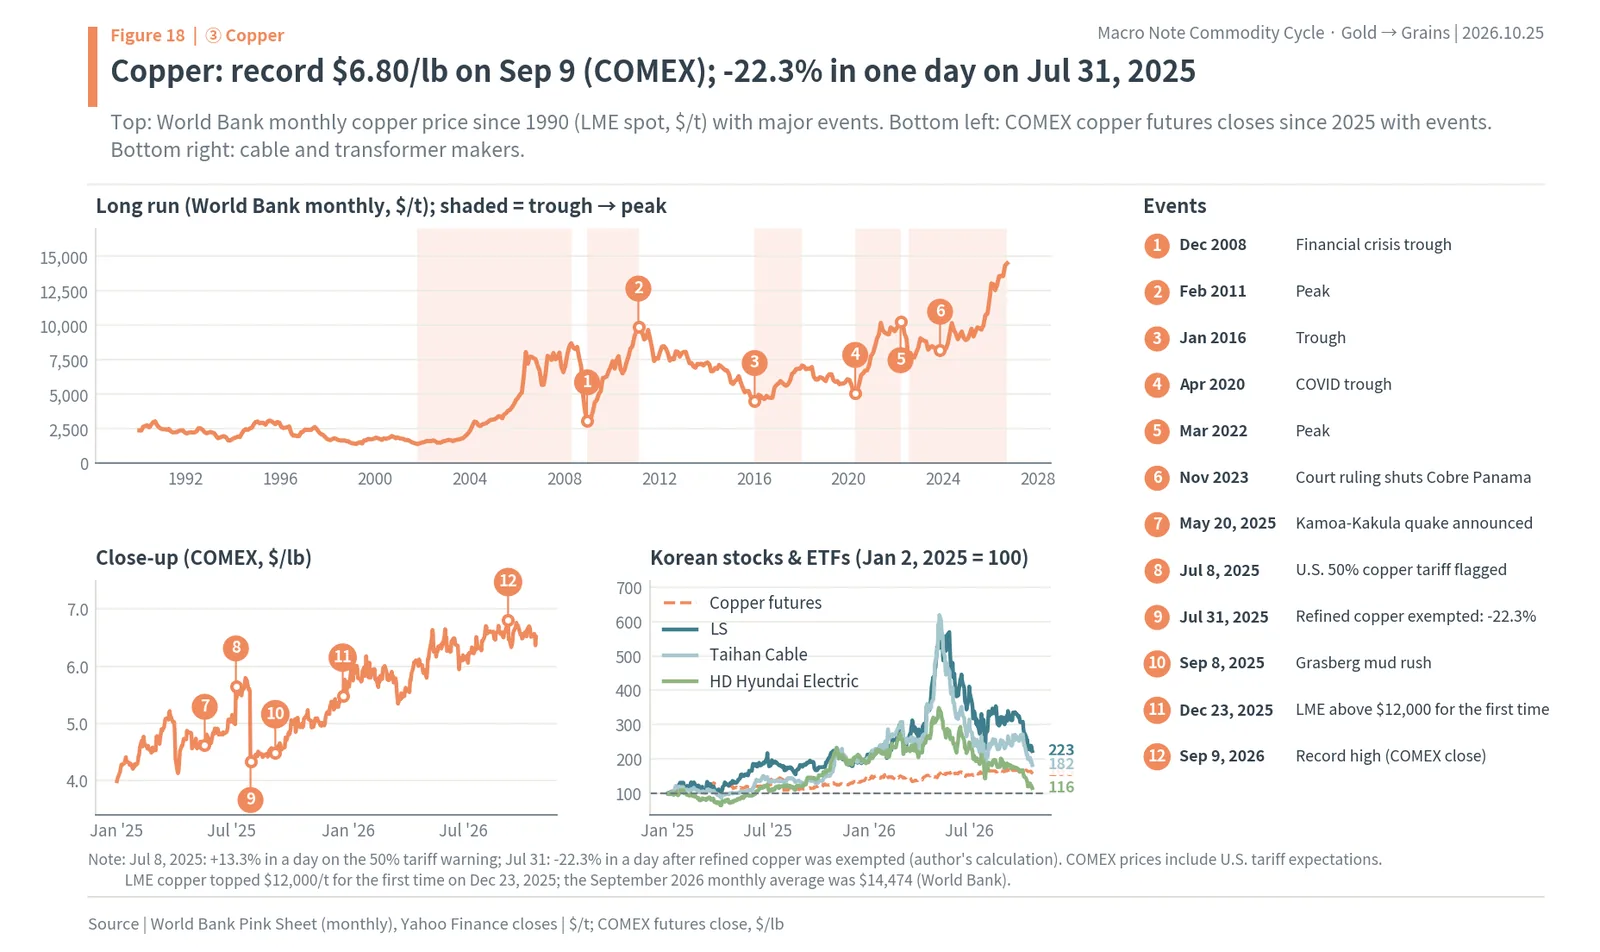
The conclusion of this chapter is that copper is the link in the middle of the chain that holds out longest. Copper is the metal that must grow when AI data centres, power grids and electric cars use more electricity, yet accidents at mines and falling ore grades have left ore short, and U.S. tariffs have locked inventories inside the United States. So copper kept rising after gold turned down, and COMEX futures closed at a record $6.80 per pound on September 9, 2026.
More electricity means more copper
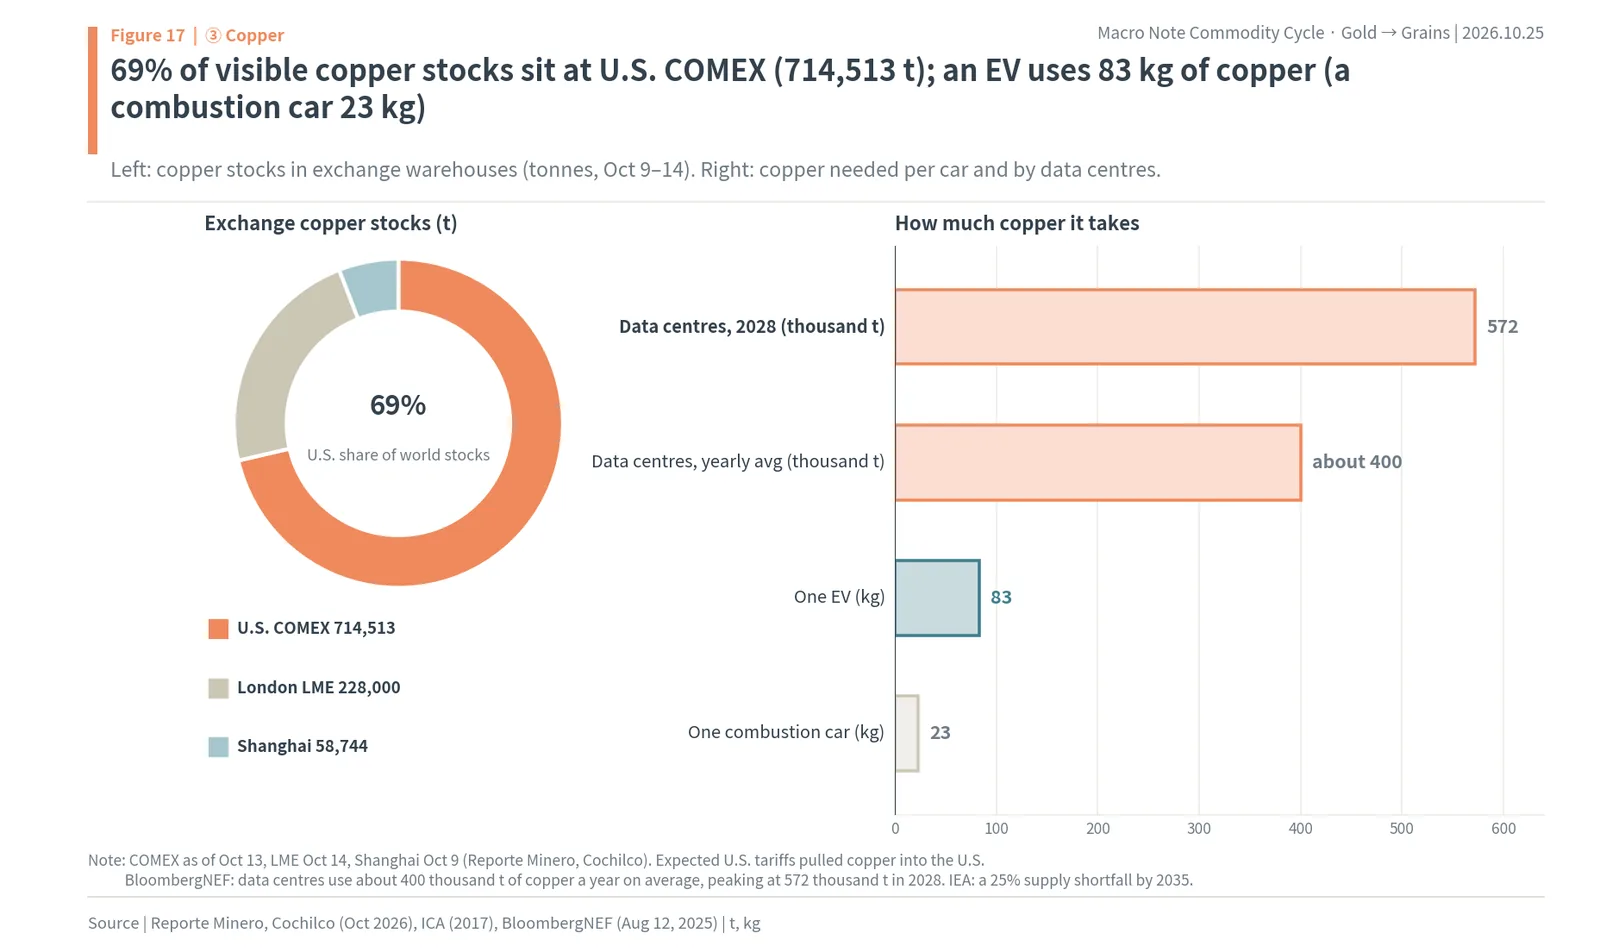
Copper conducts electricity second only to silver and is far cheaper, so it is essential in power lines, transformers, motors and battery connections. International Copper Association data show that an electric car contains about 83 kg of copper, 3.6 times as much as a combustion-engine car (about 23 kg). BloombergNEF expects data centres to use about 400,000 tonnes of copper a year on average over the next ten years, peaking at 572,000 tonnes in 2028. The International Energy Agency (IEA) expects copper supply to fall 25% short of what is needed by 2035. Copper makes up about 10% to 15% of the value of transformers and power cables.
But what is short is ore
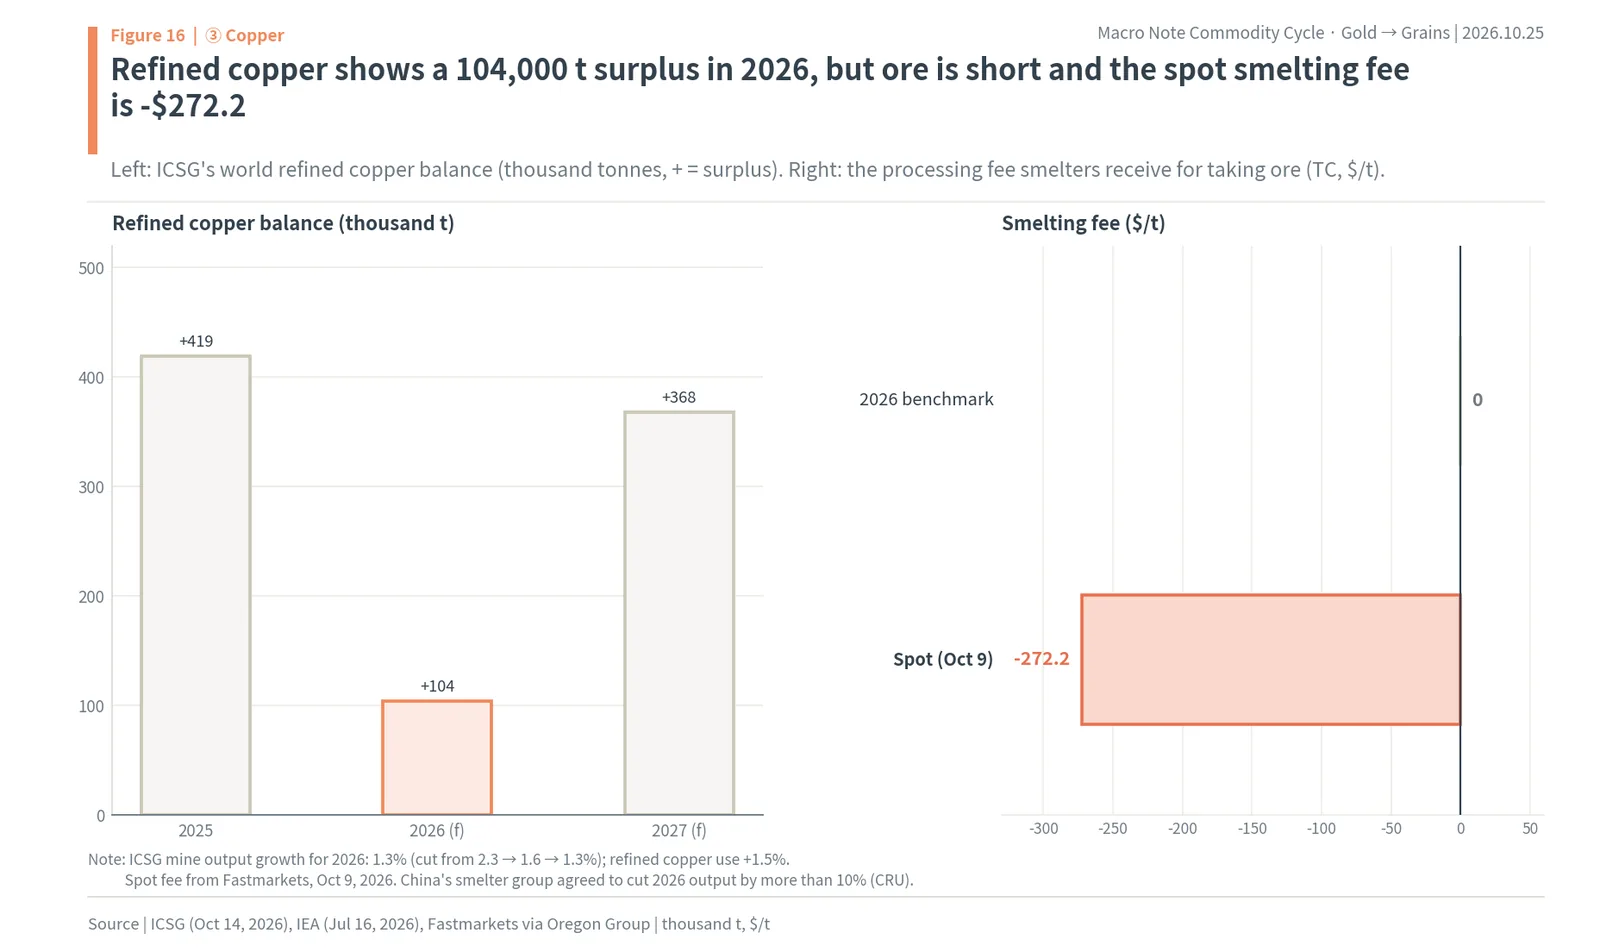
Here the chain needs a precise look. In its October 14 forecast, the International Copper Study Group (ICSG) expects a surplus of refined copper, the metal that comes out of smelters, of 419,000 tonnes in 2025, 104,000 tonnes in 2026 and 368,000 tonnes in 2027. Refined copper alone is not in deficit. What is short is the ore concentrate that feeds the smelters. The ICSG cut its 2026 forecast for mine output growth from 2.3% to 1.6% and then to 1.3%, while expecting refined copper use to rise 1.5% in the same year. China accounts for 59% of refined copper use.
As ore ran short, the processing fees that smelters receive (TC/RC) collapsed. The 2026 benchmark fee was set at $0 per tonne, and the spot fee was -$272.20 per tonne on October 9. That means smelters now pay to get ore. Chinese smelters agreed to cut 2026 output by more than 10%. Refined copper is in surplus today, but if the ore shortage lasts, refined copper output will shrink in a few years too.
Ore is short because, on top of the 15.7-year development time seen earlier, a string of accidents hit big mines. Cobre Panama in Panama, which supplied about 1.5% of world output, stopped after a Supreme Court ruling in November 2023. Kamoa-Kakula in the Democratic Republic of Congo sharply cut its output forecast after an earthquake in May 2025, and Grasberg in Indonesia was still processing only about 67% of normal volumes in the third quarter of 2026 after a mud rush in September 2025. Chile’s El Teniente suffered a collapse in July 2025 and a landslide in October 2026. Chile’s output fell 5.8% in the first quarter of 2026 as the copper content of its ore declined.
U.S. tariffs locked inventories inside the United States
When President Trump announced a planned 50% tariff on copper on July 8, 2025, COMEX copper jumped 13.3% in a day (author’s calculation). Traders rushed copper into the United States before the tariff took effect. But the proclamation issued on July 30 put the 50% tariff, from August 1, only on semi-finished and derivative products, exempting refined copper and ore, and COMEX copper moved -22.3% in a single day on July 31. A plan to tax refined copper at 15% in 2027 and 30% in 2028 still awaits a decision. Meanwhile the copper shipped to the United States stayed there: COMEX inventories were 714,513 tonnes on October 13, about 69% of the world’s visible stocks, against 228,000 tonnes at the London Metal Exchange (LME) and 58,744 tonnes in Shanghai. Copper available outside the United States got that much tighter.
Copper in 2025 and 2026: events and prices
LME copper rose about 42% in 2025, its biggest annual gain since 2009, and first topped $12,000 a tonne on December 23. In 2026 it kept rising after gold turned in January, and COMEX futures set a record of $6.80 a pound on September 9; on October 23 they were $6.51. The World Bank’s September monthly average was $14,474 a tonne. From gold’s peak on January 28 to October 23, gold fell 24.4% while copper rose 10.4%.
Who wins and who loses: those who can pass on the price
When copper prices rise, companies that can raise their selling prices in line with the copper they use come out ahead. Korean cable makers use contracts that tie selling prices to the LME copper price, and press reports say copper is about 65% of their raw material costs. In this cycle, though, the companies that gained more than copper were not those selling copper but those selling more of the things made from it. From copper’s trough on July 15, 2022 to October 23, copper futures rose 101.2%, while LS Corp (006260.KS) rose 318.0%, HD Hyundai Electric (267260.KS) 1,952.4% and Hyosung Heavy Industries (298040.KS) 3,551.8%. Demand from power grids and data centres created volumes far larger than the move in the copper price.
Smelters, which turn ore into metal, earn less even when copper rises because their fees are below zero, and appliance, car and air-conditioning makers that buy copper bear higher costs. When copper gets too expensive, switching begins. In China the copper-to-aluminium price ratio reached 4.43 in June 2026, above the switching threshold of about 4.0, and 45% of State Grid’s cable tenders in 2025 were for aluminium alloy. The copper miners ETF (COPX) has moved 1.45 times as much as copper in monthly returns since it listed in 2010.
The meaning of the copper link is that copper passes through the middle of the business cycle, when factories and electricity get busy. And once factories and mines are busy, they need energy to run them.
④ When factories run, and when war comes: oil is used more once the economy is actually running, and 2026 added the largest supply shock on record
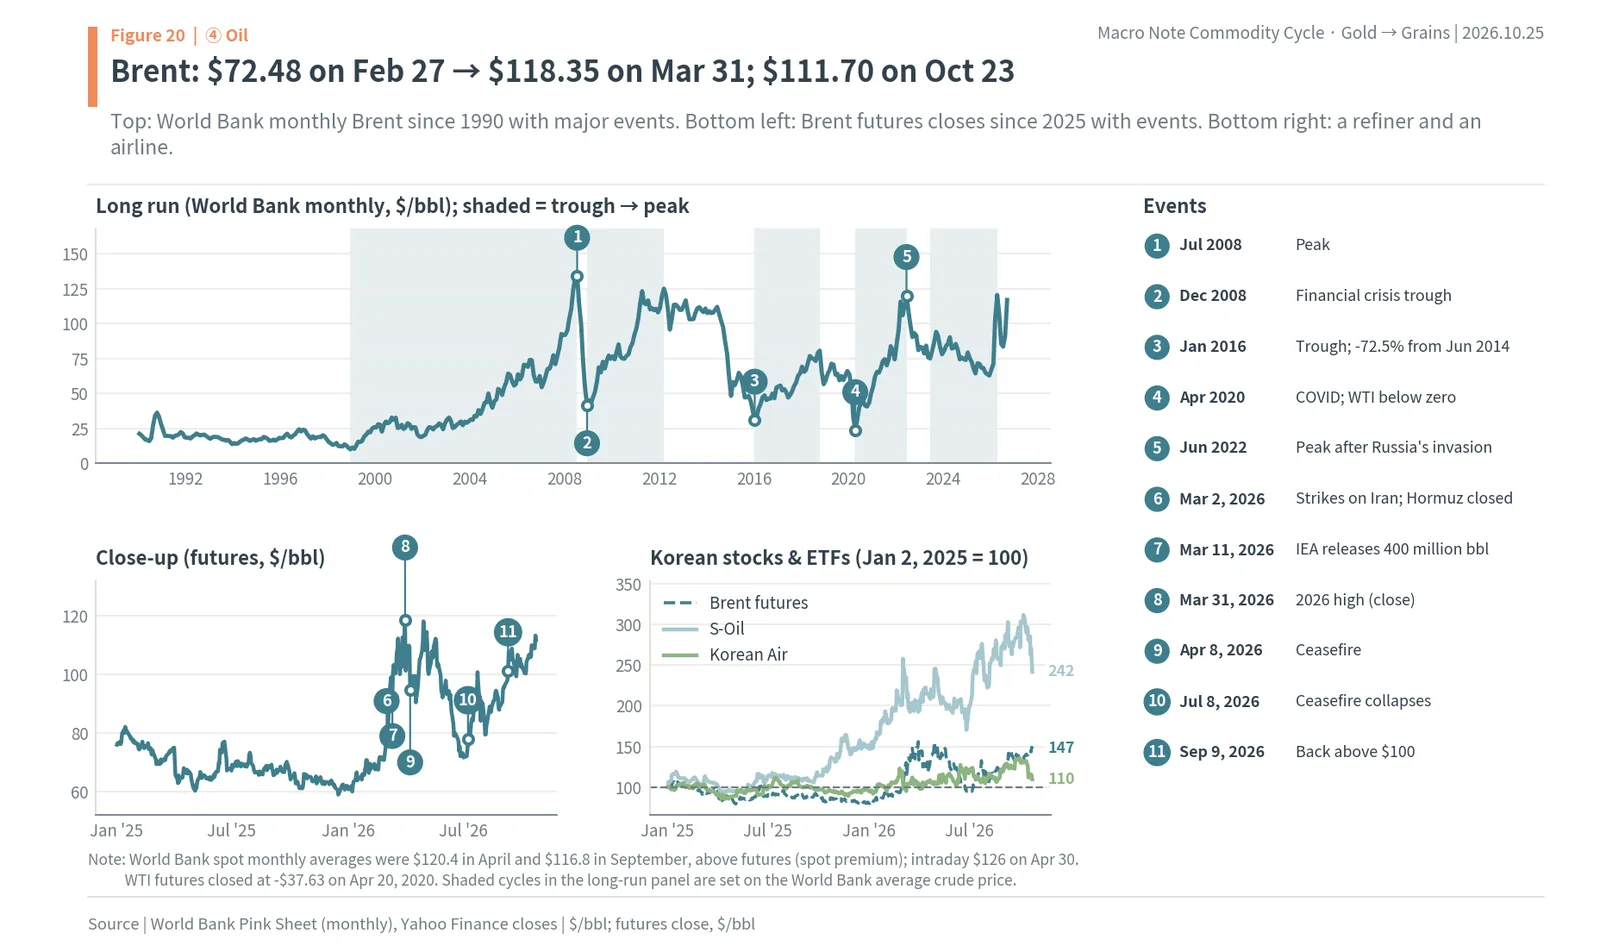
The conclusion of this chapter is that oil is a link in the back half of the cycle. After rate expectations and investment move first, oil use rises when factories, trucks and ships actually get busy, and mines and smelters also burn a lot of energy. In 2026 the Iran war and the closure of the Strait of Hormuz came on top of that: Brent futures rose from $72.48 on February 27 to $118.35 on March 31, and after the ceasefire collapsed they were still at $111.70 on October 23.
Oil peaked after gold in all five cycles
As seen earlier, oil peaked after gold in all five cycles, with a median lag of 6 months. The July 2008 Brent monthly peak of $133.9 came 4 months after gold’s (March 2008), and the June 2022 peak of $120.1 came 22 months after gold’s (August 2020). Oil’s big falls also came after supply caught up. Brent fell 72.5% from June 2014 to January 2016, a period when U.S. shale output was growing. On April 20, 2020, when storage space ran out during COVID, WTI futures even closed at -$37.63.
2026: Hormuz was closed
On February 28, 2026, the United States and Israel struck Iran, and Iran closed the Strait of Hormuz. In normal times about 35% of seaborne crude, about 20% of oil products and 20% of LNG pass through it. The World Bank said about 10 million barrels a day of supply was lost at first and called it the largest oil supply shock on record. On March 11 the IEA agreed a joint release of 400 million barrels from member countries’ stocks, the sixth such release in its history and the largest.
After a ceasefire on April 8, the strait was announced as reopened on April 17 and oil prices came down. But after the ceasefire was declared broken on July 8, attacks on tankers followed, and Brent climbed back above $100 on September 9. On World Bank spot monthly averages Brent went from $66.8 in January to $120.4 in April and $116.8 in September, and it touched $126 intraday on April 30. Spot monthly averages are higher than futures closes because of the premium paid on physical cargoes. The daily charts in this report use Brent futures closes.
Oil prices passed straight into inflation
U.S. consumer prices in September were 3.7% higher than a year earlier, with gasoline up 34.2%. Core inflation, which leaves out food and energy, was 2.6%. Korea’s September consumer price inflation was 2.9%, and petroleum products rose 14.8%, less than June’s 24.7% but still pushing inflation up. Korea imports 93.7% of its energy, and 69.1% of its crude imports come from the Middle East (2025 monthly average). The Bank of Korea raised its policy rate in July and again in August, to 3.00%, and held it on October 22.
Who wins and who loses
When oil prices rise, refiners gain as the crude they hold in stock becomes more valuable and they charge more for their products. From February 27 to October 23, S-Oil (010950.KS) rose 20.4% and KODEX WTI Crude Oil Futures (H) (261220.KS) rose 94.2%. Airlines, which buy fuel, take the hit. Korean Air (003490.KS) posted record standalone revenue of KRW 5.02 trillion (about $3.79 billion) in the second quarter, but its operating profit fell 34.4% from a year earlier to KRW 261.8 billion (about $197 million), and the company blamed fuel costs. Singapore jet fuel averaged $214.71 a barrel from March 16 to April 15. Over the same February to October window, Korean Air’s share price fell 8.2%. Petrochemicals and shipping also bear higher feedstock and fuel costs.
The meaning of the oil link is that the heat in the economy has moved into actual operations. And when oil rises, natural gas, which moves with it, rises too, and gas is the raw material of the next link, nitrogen fertilizer.
⑤ From gas to the dinner table: gas is 80% to 90% of the cost of nitrogen fertilizer, so urea doubled in three months and grains rose last
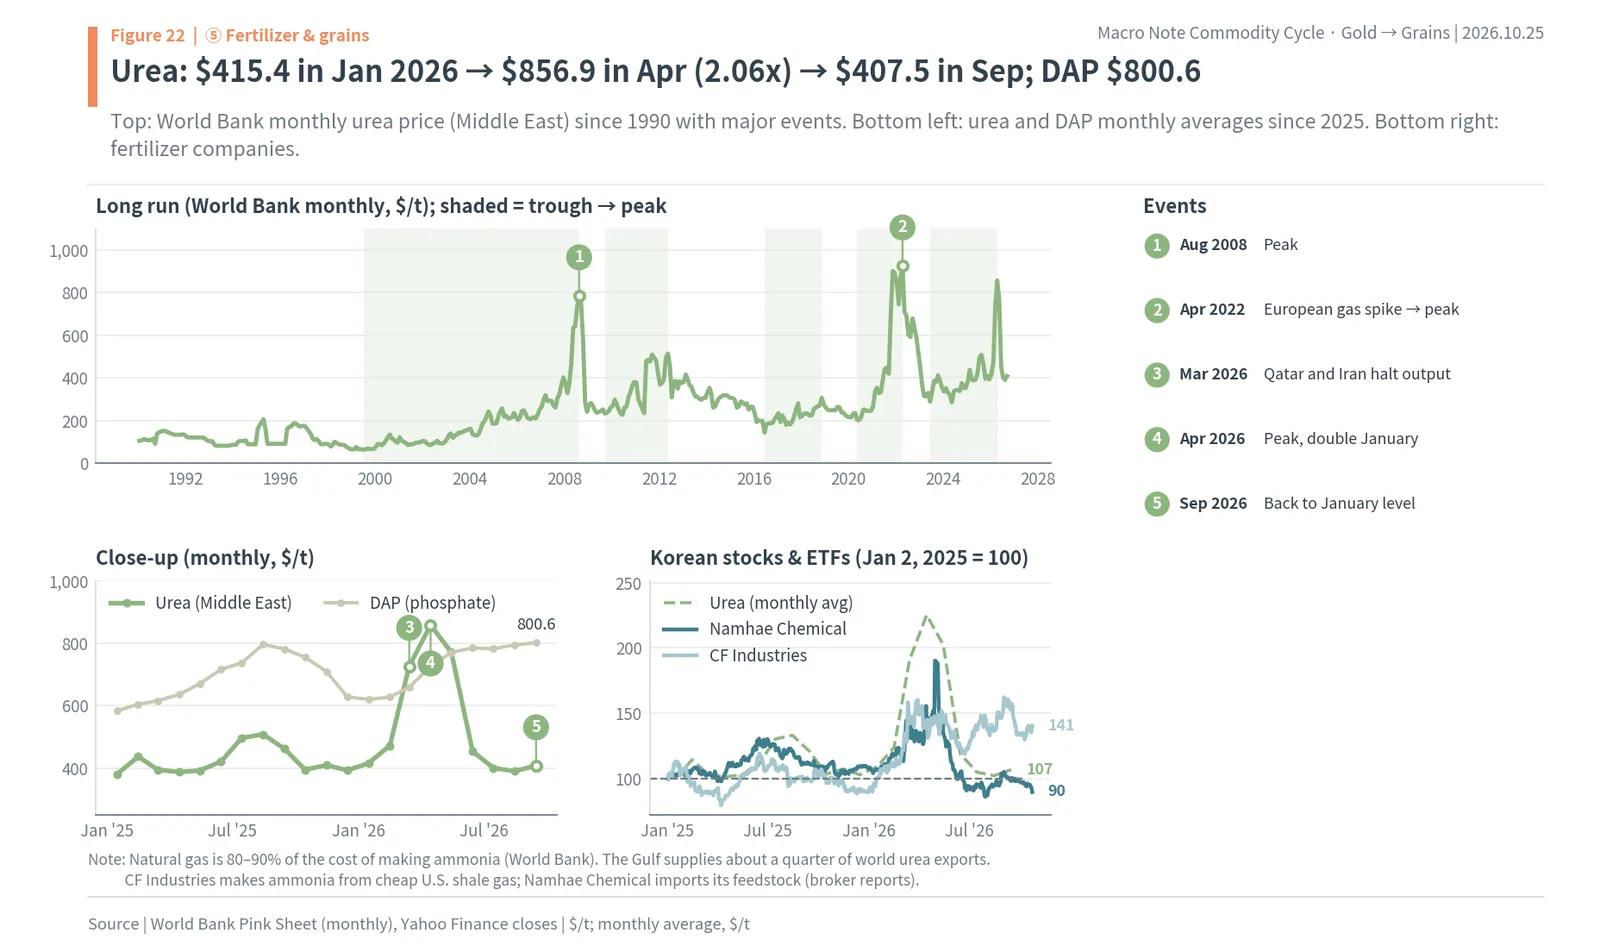
The conclusion of this chapter is that fertilizer and grains are the last commodity links in the chain. Ammonia, the base of nitrogen fertilizer, is made from natural gas, and gas makes up 80% to 90% of its cost. When fertilizer plants in the Gulf stopped in 2026, the price of urea (Middle East) went from $415.4 a tonne in January to $856.9 in April, 2.06 times, and as fertilizer and fuel costs passed into farming costs, wheat and corn peaked in August and September.
From gas to fertilizer: most of the cost is gas
Nitrogen fertilizer starts with ammonia, made from nitrogen in the air and hydrogen taken from natural gas, and that ammonia is then turned into urea. The World Bank says gas is 80% to 90% of the cost of producing ammonia. So when gas prices rise, fertilizer plants raise prices or shut down. When European gas prices soared in 2022, urea rose to $925 a tonne in April. In 2026 supply was cut directly. The Gulf accounts for about a quarter of world urea exports; Iran halted ammonia production, Qatar stopped making urea and ammonia after damage to its facilities, and China restricted fertilizer exports in March.
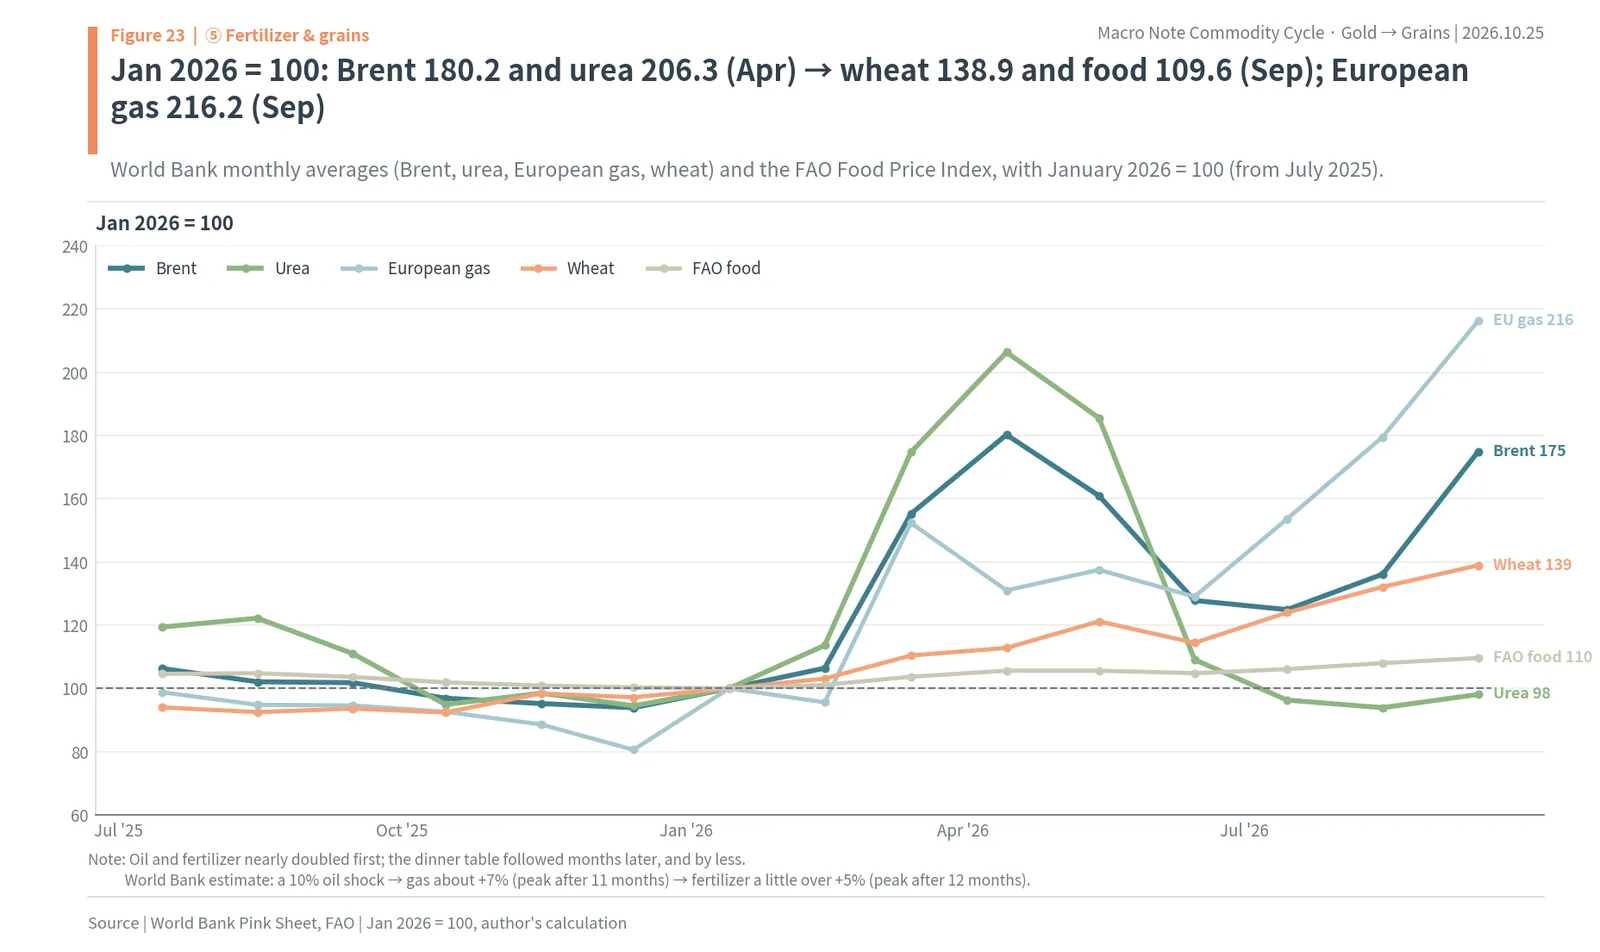
On World Bank monthly averages, urea went from $415.4 in January to $725.6 in March and $856.9 in April, then fell back after the ceasefire to $407.5 in September, the January level. DAP, a phosphate fertilizer, instead rose to $800.6 in September, its highest since May 2022. The World Bank estimates that when a geopolitical oil shock lifts oil prices 10%, gas rises about 7% (peaking after 11 months) and fertilizer a little over 5% (peaking after 12 months), and fertilizer stays high for more than two years.
The 2026 chain on one page
The next chart starts in July 2025 and sets World Bank monthly averages at January 2026 = 100. Brent peaked at 180.2 and urea at 206.3, both in April. European gas rose again, to 216.2 in September. Wheat reached 138.9 in September and the FAO Food Price Index 109.6 in September, rising last and least. Oil and fertilizer nearly doubled first, and the dinner table followed months later and by less. In the group index cross-correlation seen earlier, too, energy led fertilizer by 2 months.
From fertilizer to grains: farming costs and biofuels
When fertilizer and diesel prices rise, farming costs rise, and farmers spread less of the expensive fertilizer or plant less. The result shows up in the next harvest, so grain prices rise late. Biofuels also tie oil to grains. Corn is made into ethanol and palm and soybean oil into biodiesel, so they rise when oil does. The World Bank said its food sub-index in March 2026 was the highest in 22 months and that energy prices had boosted demand for palm and soybean oil. On World Bank monthly averages, wheat (U.S. hard red winter) rose 38.9% from January to September.
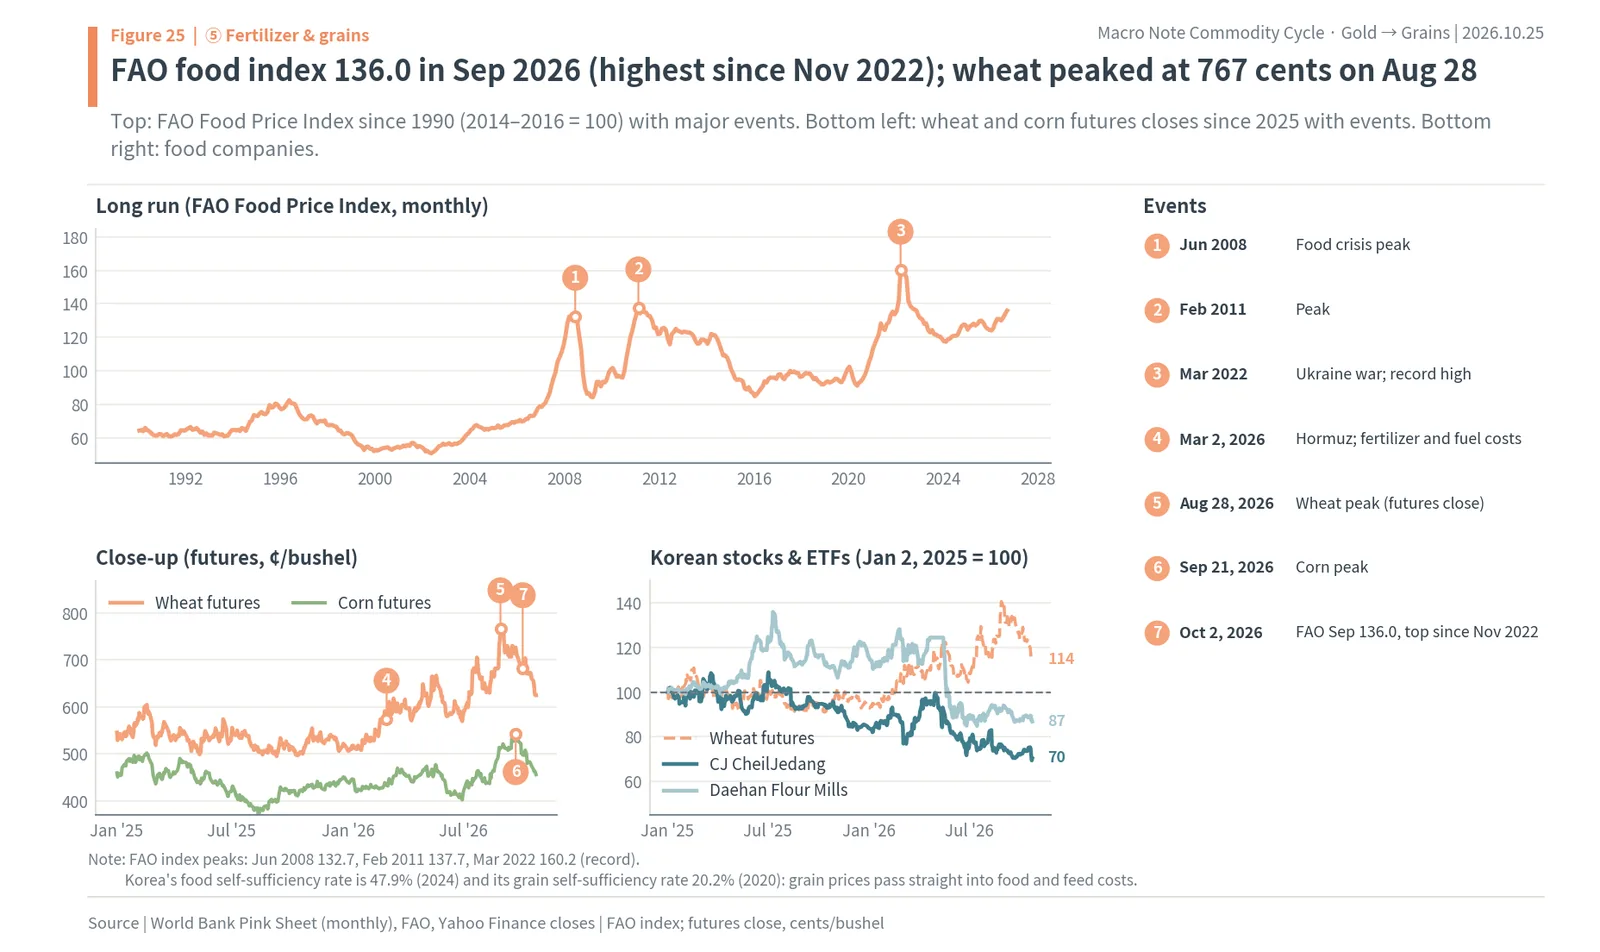
Wheat futures peaked at 767 cents a bushel on August 28 and corn futures at 543 cents a bushel on September 21. The FAO Food Price Index was 136.0 in September 2026, the highest since November 2022 and 5.8% above a year earlier (128.6). The record was 160.2 in March 2022, right after the war in Ukraine began, and 132.7 in June 2008 and 137.7 in February 2011 were also food crisis peaks. The FAO cited worries about fuel, fertilizer and freight costs from Hormuz, demand for biofuel feedstocks and Black Sea logistics as reasons for the latest rise.
Who wins and who loses: only those who own the feedstock
The same rise in fertilizer prices split results. CF Industries (CF), which makes ammonia directly from cheap U.S. shale gas, rose 21.2% from February 27 to October 23, while Korea’s Namhae Chemical (025860.KS), which buys in feedstock such as ammonia and phosphate rock, fell 24.7%. When raw materials get dearer, companies that own them gain, and companies that buy and process them cannot pass all of the cost on. Grains work the same way. Korea’s food self-sufficiency rate was 47.9% in 2024, and its grain self-sufficiency rate including feed was 20.2% in 2020, so grain prices pass almost directly into the costs of food and feed companies. Over the same window CJ CheilJedang (097950.KS) fell 18.7% and Daehan Flour Mills (001130.KS) 29.8%.
The meaning of the fertilizer and grain links is that the commodity heat has finally reached the dinner table. When fuel and food prices rise together, the inflation people feel every day heats up, and the chain moves on to its last link, inflation and interest rates.
⑥ Prices fall in the order they rose: inflation peaked in the same month as oil or the month after, and then interest rates turned the chain back
The conclusion of this chapter is that the commodity cycle starts with gold and ends with interest rates. When fuel and food prices rise together, inflation peaks, and when central banks raise rates, the cost of holding commodities that pay no interest goes up, so gold and silver, the first to rise, are the first to come down. In the four past cases, one year after oil peaked, oil, wheat and copper had all fallen, and only gold had risen every time, becoming the first link of the next cycle. The World Bank also expects energy, fertilizer, metals and precious metals prices to fall in 2027.
Inflation peaked in the same month as oil, or the month after
Put U.S. consumer price inflation peaks next to Brent monthly peaks. In 2008 both came in July (inflation 5.5%, Brent $133.9), and in 2022 both came in June (inflation 8.98%, Brent $120.1). In 2026 Brent peaked in April ($120.4) and inflation in May (4.17%). 2011 was a little different: Brent peaked twice, in April 2011 and March 2012 ($124.9), and inflation peaked in between, in September 2011 (3.81%). Oil prices pass into inflation directly through gasoline and transport costs, while grains pass into food prices a few months later.
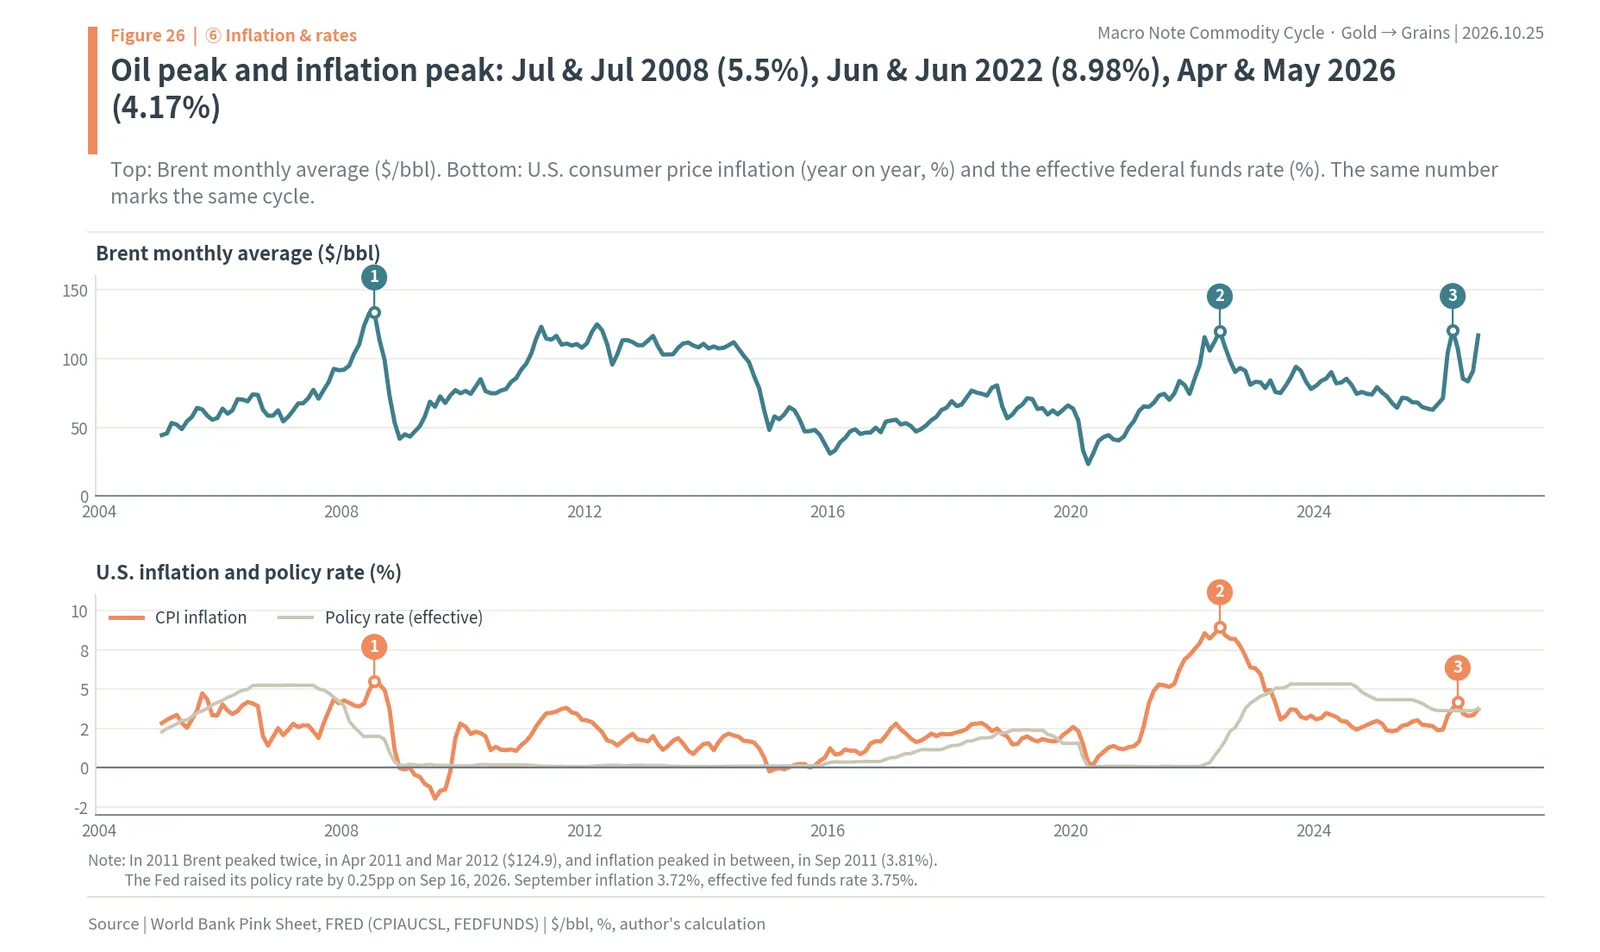
When inflation rises, central banks act. In 2022 the Fed raised rates at its fastest pace around the inflation peak, and in 2026, after the May inflation peak, it raised its policy rate by 0.25 percentage point on September 16. U.S. consumer price inflation is still high at 3.7% in September, and the effective federal funds rate was 3.75% that month. Higher rates raise the cost of holding commodities, and a cooling economy uses fewer of them. So the chain runs in reverse.
One year after an oil peak, only gold rose all four times
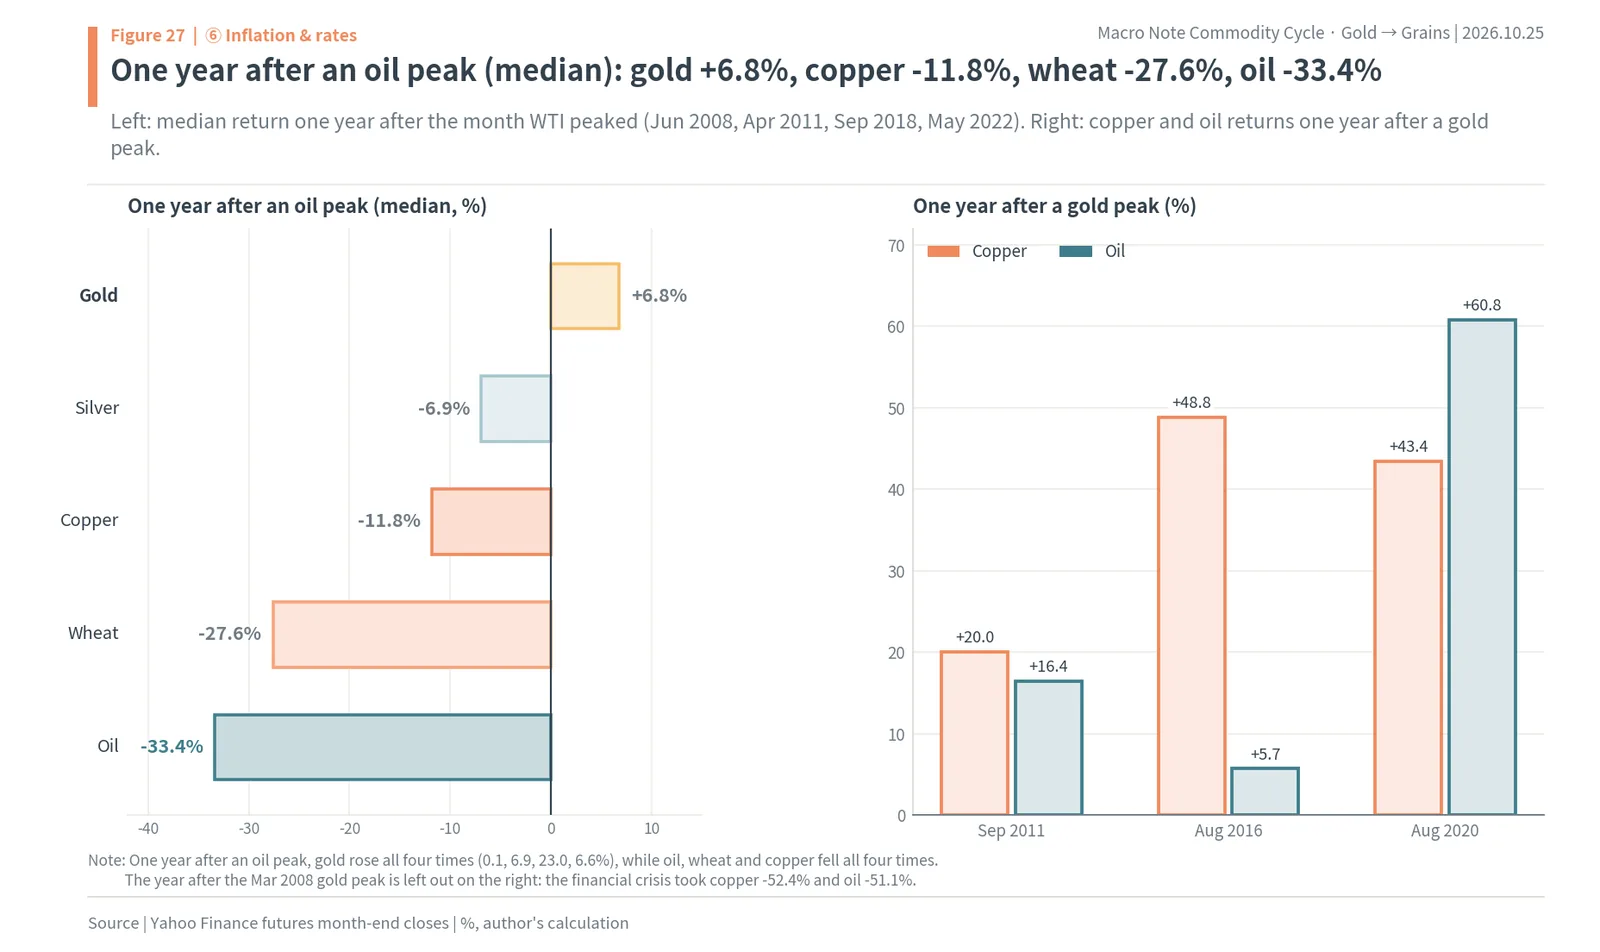
Look at the year after each month in which oil (WTI) peaked: June 2008, April 2011, September 2018 and May 2022. Oil fell all four times (median -33.4%), and wheat (-27.6%) and copper (-11.8%) also fell all four times. Gold rose all four times (0.1%, 6.9%, 23.0% and 6.6%, a median of 6.8%). Silver was mixed, with a median of -6.9%. The oil peak arrives with the inflation peak, and when rates then look unlikely to rise further, gold moves first. An oil peak is both the end of the current cycle and the first signal of the next one.
Conversely, the chain keeps going for a while after gold peaks. One year after gold’s peaks, copper rose 20.0% in 2011, 48.8% in 2016 and 43.4% in 2020, and oil rose 16.4%, 5.7% and 60.8%. Only in 2008 did every commodity collapse together, in the financial crisis. Six months after gold’s January 2026 peak, copper was still up 9.1%, oil 29.8% and wheat 18.8%, while silver was down 26.4%. Gold turning down does not mean the whole chain is over; it means the links at the back are still running.
The World Bank also expects everything to fall in 2027
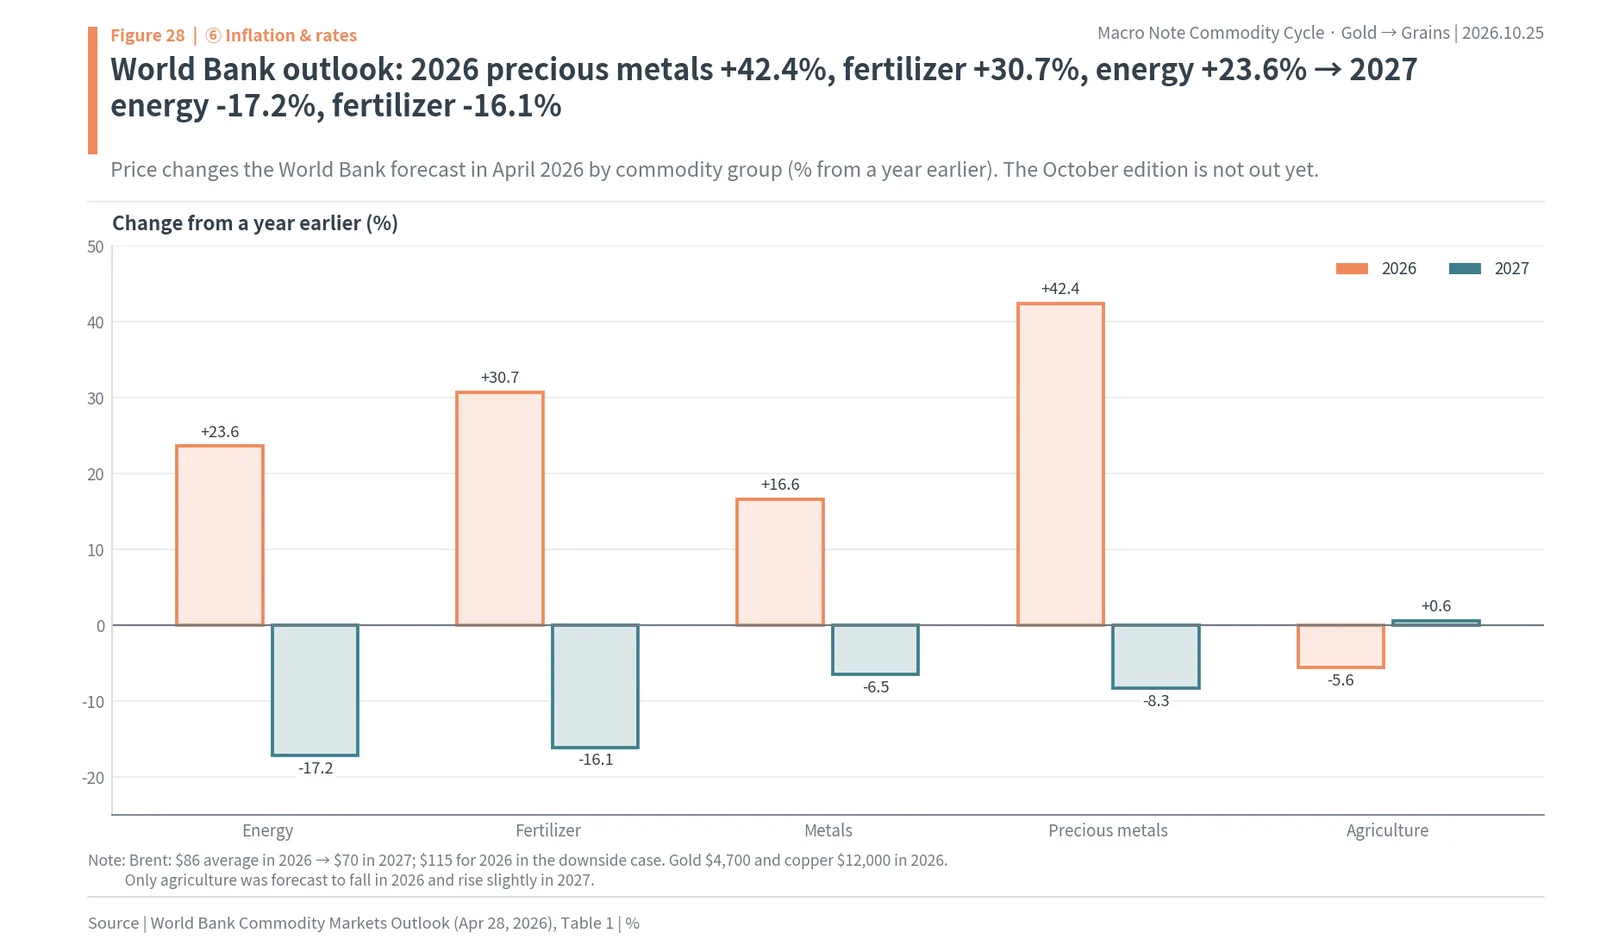
In its April 2026 commodity outlook, the World Bank expected precious metals to rise 42.4%, fertilizer 30.7%, energy 23.6% and metals 16.6% in 2026, followed in 2027 by changes of -17.2% for energy, -16.1% for fertilizer, -8.3% for precious metals and -6.5% for metals. Only agriculture was expected to fall in 2026, by 5.6%, and to rise 0.6% in 2027. It expected Brent to average $86 in 2026 and $70 in 2027, with a downside case of $115 for the 2026 average. The October edition has not been published yet.
High prices bring supply, and when supply catches up, prices collapse
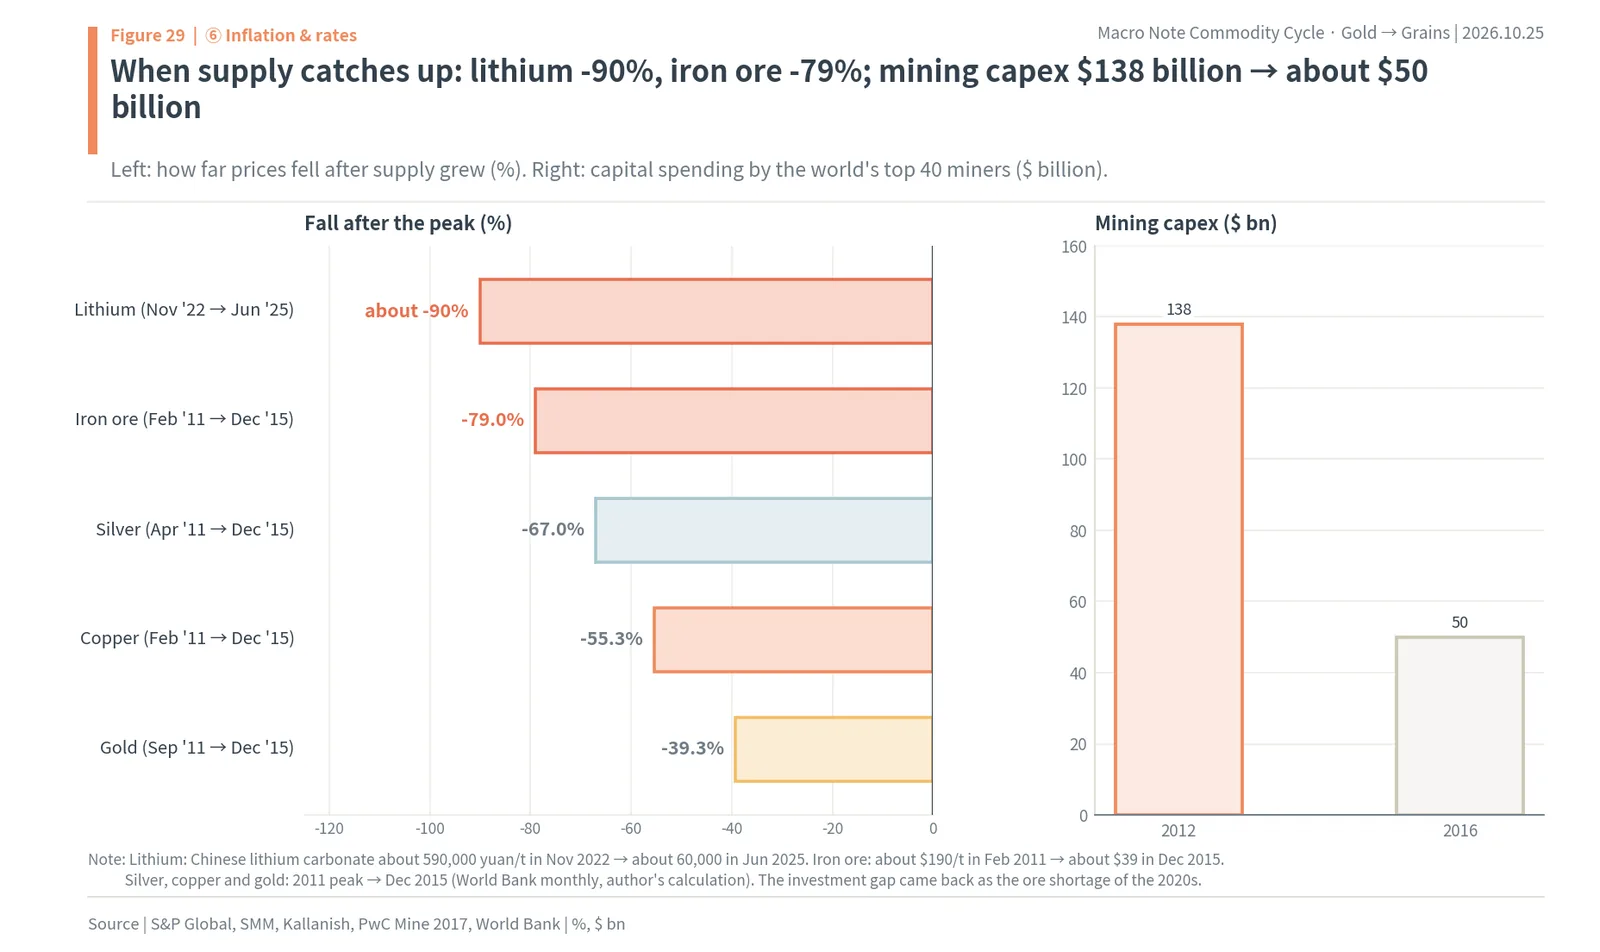
How far prices fall back depends on how much supply catches up. From the 2011 peaks to the end of 2015, silver fell 67.0%, copper 55.3% and gold 39.3%. Over the same years iron ore went from about $190 a tonne in February 2011 to about $39 in December 2015, a change of -79%, as the big miners raised output. Lithium did the same more recently: Chinese lithium carbonate went from about 590,000 yuan a tonne in November 2022 to about 60,000 yuan in June 2025, a change of about -90%, and nickel prices collapsed as Indonesia’s share of supply grew from under 5% to about 60%.
When prices collapse, mining investment shrinks, and that gap becomes the seed of the next shortage. Capital spending by the world’s top 40 miners fell from $138 billion in 2012 to about $50 billion in 2016. That cut in investment came back, after a development time of 15 years or so, as the ore shortage of the 2020s. The cycle starts with gold and ends with interest rates, and when rates look set to fall again, it starts again with gold.
Each link had different winners: only those who owned the feedstock or could pass on prices made money
The conclusion of this chapter is that rising commodity prices are not good for every related company. Even when the same commodity rose, only those who owned it, or who could pass higher costs into their selling prices, made money, while those who bought raw materials to process them lost. The winners also changed each time the chain moved to a new link. From gold’s peak on January 28, 2026 to October 23, S-Oil rose 31.7% and CF Industries 29.5%, while Korea Zinc returned -52.6% and HD Hyundai Electric -47.9%.
While gold, silver and copper rose: precious metals and power equipment won
From gold’s trough on October 31, 2022 to around its peak on January 28, 2026, precious metals and power equipment won. ACE KRX Gold Spot rose 225.5%, Korea Zinc 181.4%, LS Corp 229.3% and Taihan Cable & Solution (001440.KS) 98.3%, while the KOSPI index rose 125.4% over the same period. Transformer maker HD Hyundai Electric rose 2,525.9% and Hyosung Heavy Industries 4,286.8%, beyond any comparison with copper’s 72.6%. Companies that buy in raw materials fell: Namhae Chemical returned -26.9% and CJ CheilJedang -48.6%. S-Oil gained only 16.3% and Korean Air 3.0%.
After the gold peak: energy won, and precious metals and power equipment fell hardest
After gold turned, the winners changed. From January 28 to October 23, KODEX Silver Futures (H) returned -54.8%, Korea Zinc -52.6%, HD Hyundai Electric -47.9%, ACE KRX Gold Spot -32.6%, Hyosung Heavy Industries -25.5% and Taihan Cable & Solution -21.1%. Instead, those who own oil and fertilizer rose: S-Oil 31.7%, CF Industries 29.5% and SK Innovation (096770.KS) 27.6%. Namhae Chemical (-16.8%), CJ CheilJedang (-18.3%) and Daehan Flour Mills (-23.6%), which buy in raw materials, kept falling. The KOSPI rose 7.3% over the same period.
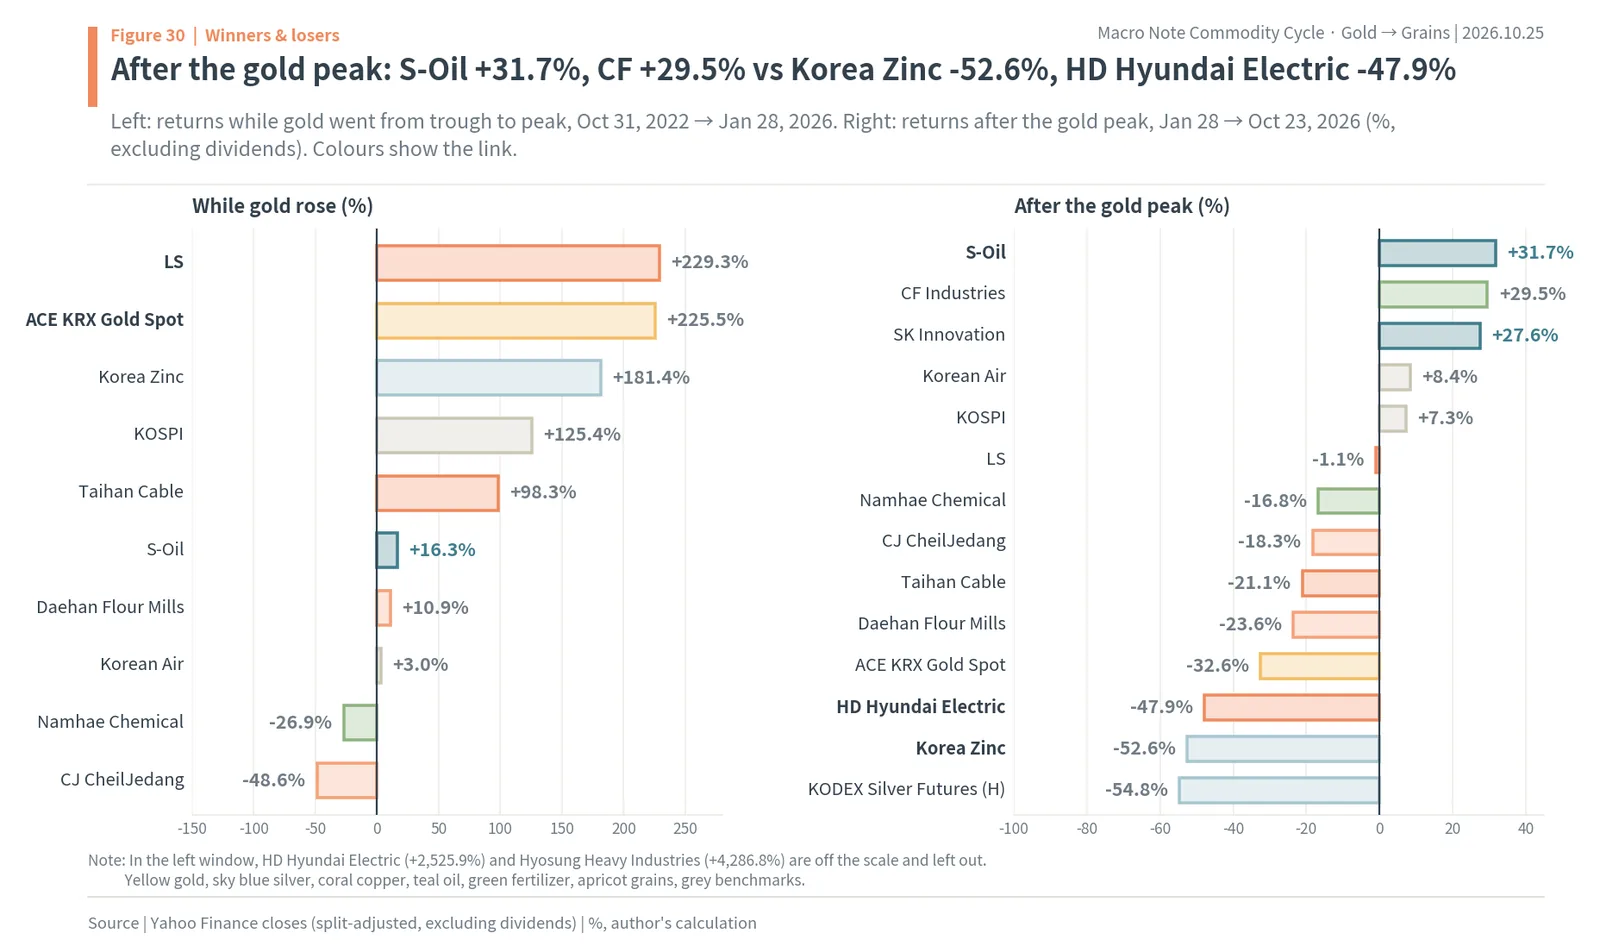
There is a reason power equipment fell hardest at the last link, when rates rise. Growth stocks that have already priced in long-lasting future demand lose value when rates rise, because those distant profits are discounted more heavily. Over the February 27 to October 23 window, when oil prices rose, HD Hyundai Electric fell 55.2% and Taihan Cable & Solution 40.8%.
A map of industries by link
Put together, each link draws this industry map. In the gold link, physical gold, gold miners and smelters that recover a lot of precious metals win. In the silver link, silver spot and futures and smelters with a lot of by-product silver win, while solar cell makers that use a lot of silver bear higher costs. In the copper link, copper miners and the cable and transformer makers that tie selling prices to copper and ride power demand win, while smelters that cannot earn fees because ore is short, and appliance and car makers that buy copper, lose. In the oil link, refiners and oil-producing countries win, and airlines, petrochemicals and shipping lose. In the fertilizer and grain links, fertilizer makers with cheap feedstock and grain-exporting countries win, and fertilizer makers that import feedstock and food and feed companies lose. At the last link, inflation and interest rates, the commodities and growth stocks that rose most earlier are the first to fall.
What you buy it with changes the return: KRX gold is tax-free on trading gains, while futures ETFs carry a 15.4% dividend tax and roll costs
The conclusion of this chapter is that even for the same commodity, tax, hidden costs and volatility differ greatly by product. Investors in Korea have four main routes: physical gold through the KRX Gold Market, commodity futures ETFs listed in Korea, overseas mining ETFs, and Korean stocks at each link of the chain.
How it works in Korea: the KRX Gold Market, futures ETFs, (H) funds and .KS tickers
Some Korea-specific background helps here. The Korea Exchange (KRX) runs a spot gold market where individuals buy and sell gold through an ordinary brokerage account, just like shares, and the tax treatment of that market is unusually favourable. Korean-listed commodity ETFs, by contrast, mostly hold futures, and their gains are taxed as dividend income at 15.4%. Fund names ending in (H) are currency-hedged, so they track the dollar price of the commodity without the won/dollar exchange rate, while funds without it carry currency exposure. Korean stocks trade under six-digit codes, written in this report in Yahoo Finance style: .KS for the KOSPI main board and .KQ for the KOSDAQ growth board. Korea also taxes interest and dividend income above KRW 20 million a year (about $15,100) together with other income under comprehensive financial income taxation, and futures ETF gains count toward that threshold while KRX gold gains do not.
KRX Gold Market: spot gold, tax-free
The KRX Gold Market trades spot gold in 1-gram units, like shares. Individuals pay no capital gains tax or dividend income tax on trading gains, and the gains are left out of comprehensive financial income taxation. Withdrawing the gold as physical bars incurs 10% value-added tax. With no futures to roll, it tracks the gold price directly. In this cycle ACE KRX Gold Spot (411060.KS), which follows the KRX gold price, rose more and fell more than international gold, because the won and the local premium moved along with it.
Korean commodity futures ETFs: roll costs and tax
Most Korean-listed commodity ETFs hold futures and roll them at each expiry. As in the hypothetical example in the first chapter, if contango persists the ETF slowly loses even when the spot price is flat, and backwardation does the opposite. Tax is 15.4% dividend income tax on the smaller of the trading gain and the rise in the tax base price, and that income counts toward the KRW 20 million annual threshold for comprehensive financial income taxation. KODEX Silver Futures (H) (144600.KS) rose 407.2% over this cycle’s gold window and fell 54.8% after the gold peak. In monthly returns since 2000, silver has moved 1.43 times as much as gold, the gold miners ETF (GDX) 1.83 times as much as gold, and the copper miners ETF (COPX) 1.45 times as much as copper.

Korean related stocks: look at the link and the business model together
With related stocks, look beyond the commodity price at whether the company owns its raw materials, whether it can pass on prices, and whether its volumes are growing. As the previous chapter showed, within the same copper link a transformer maker gained dozens of times what copper did, and within the same fertilizer link a company that imports its feedstock lost money. And as with Korea Zinc, company-specific events such as a control fight or a share issue can move the share price alongside commodity prices.
Six principles
Turned into principles, the numbers in this report give six. First, look at the order to see which link is running now: gold, then copper and oil about half a year later, then fertilizer and grains about a year later, repeated five times. Second, watch interest rates and the dollar, because the moment rates look unlikely to rise further is the signal for the first link. Third, watch inventories and the futures curve: backwardation, with near months dearer than later ones, and shrinking inventories mean goods are short right now. Fourth, watch price ratios between commodities: a gold/silver ratio above 90 means silver is cheap, and below 50 means it is dear. Fifth, treat a surge in mining investment and a flood of news about new mines as a sign of the top. Sixth, weigh the different taxes and hidden costs of each product.
The author’s view: we are at the last link, the next step is an unwinding in the order prices rose, and copper will be last
The conclusion of this chapter is the author’s view. The author sees the present as the last link of the chain, the stage where oil and grains push up inflation and interest rates rise. Next comes the unwinding in the order prices rose: gold and silver have already come down, and oil, grains and copper are left. The first signal of the next cycle will be when an oil peak is confirmed and rates look set to fall again, and the author expects gold to move first at that point.
Three reasons
First, the order. Silver (January) and gold (February) peaked first, oil and urea (April) followed, and copper, wheat and corn (September) peaked last. U.S. inflation peaked at 4.17% in May and was still high at 3.7% in September, and the Fed raised rates in September. This is how the last link looked in the five past cycles. Second, the experience after oil peaks: in all four cases, one year later oil, wheat and copper were down and gold was up. Third, the World Bank also expects energy, fertilizer, metals and precious metals prices to fall in 2027.
The author sees copper as the last link because of its structural part. Refined copper is in surplus, but ore is short and smelting fees are below zero, and demand from data centres and power grids will continue for years regardless of interest rates. The copper held in the United States is also unlikely to be released before the tariff decision. So the author expects copper’s unwinding to come later and to be smaller than the other links’.
Indicators and dates to watch
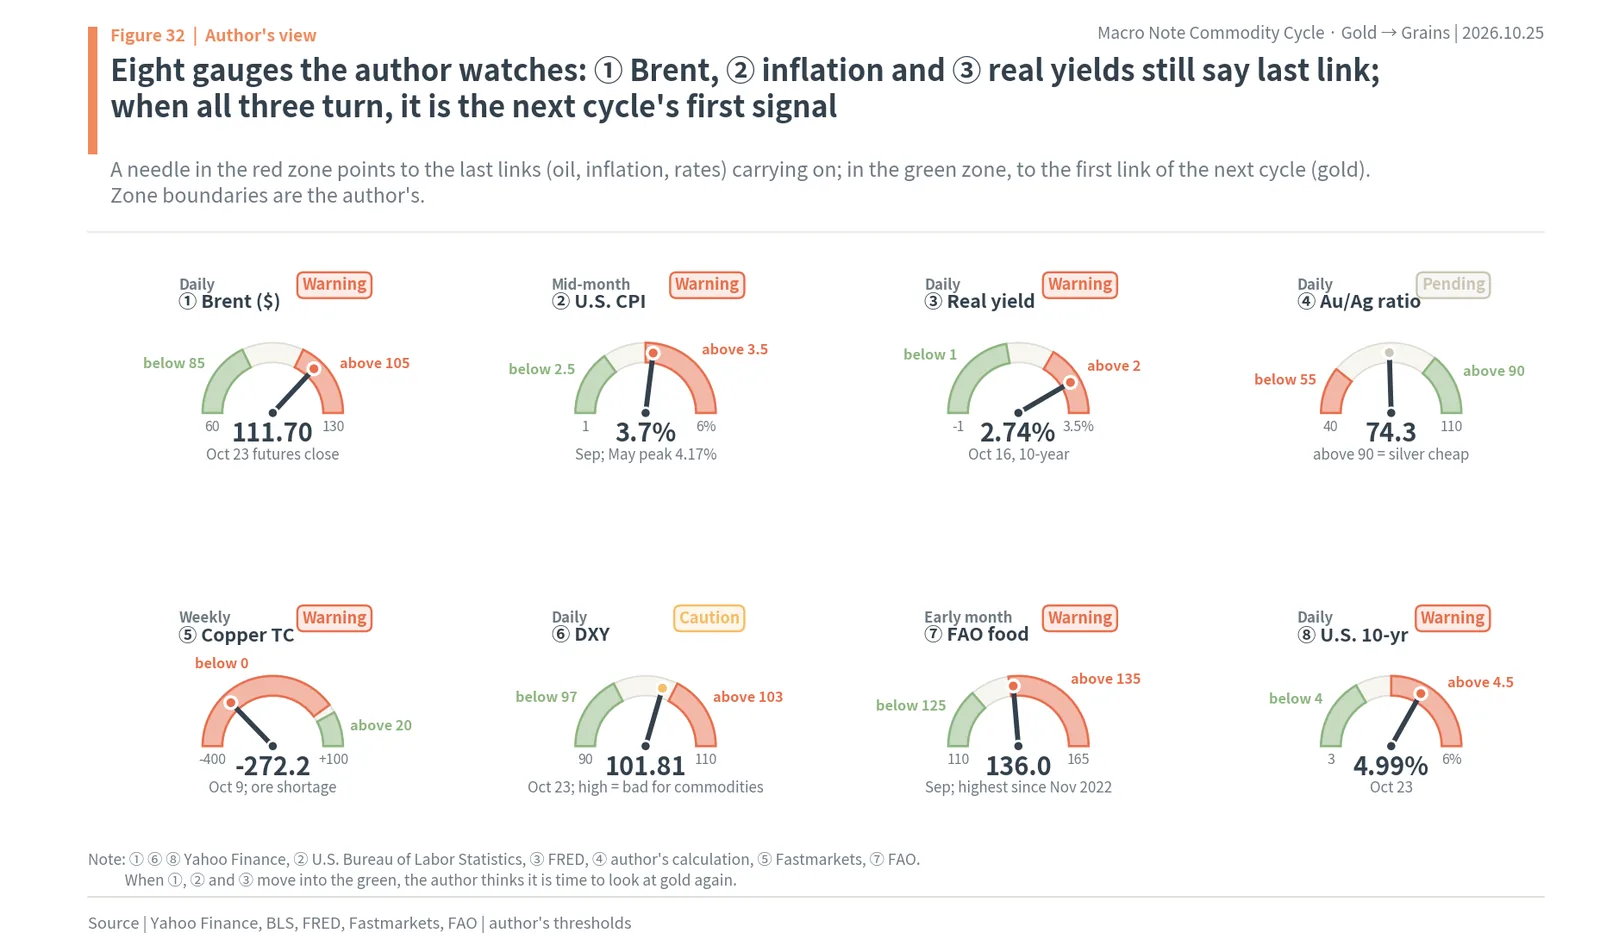
The author watches eight indicators: whether Brent falls and stays below its April peak; whether U.S. inflation falls below 3%; whether the U.S. real yield (2.74% on October 16) turns down; the gold/silver ratio (now 74.3); the copper smelting fee (-$272.20 on October 9); the dollar index (101.81 on October 23); the FAO Food Price Index (136.0 in September); and the U.S. 10-year Treasury yield (4.99% on October 23). If Brent and the food index come down and real yields start to turn down, the author will read it as the chain passing through the unwinding and moving on to the first link of the next cycle.
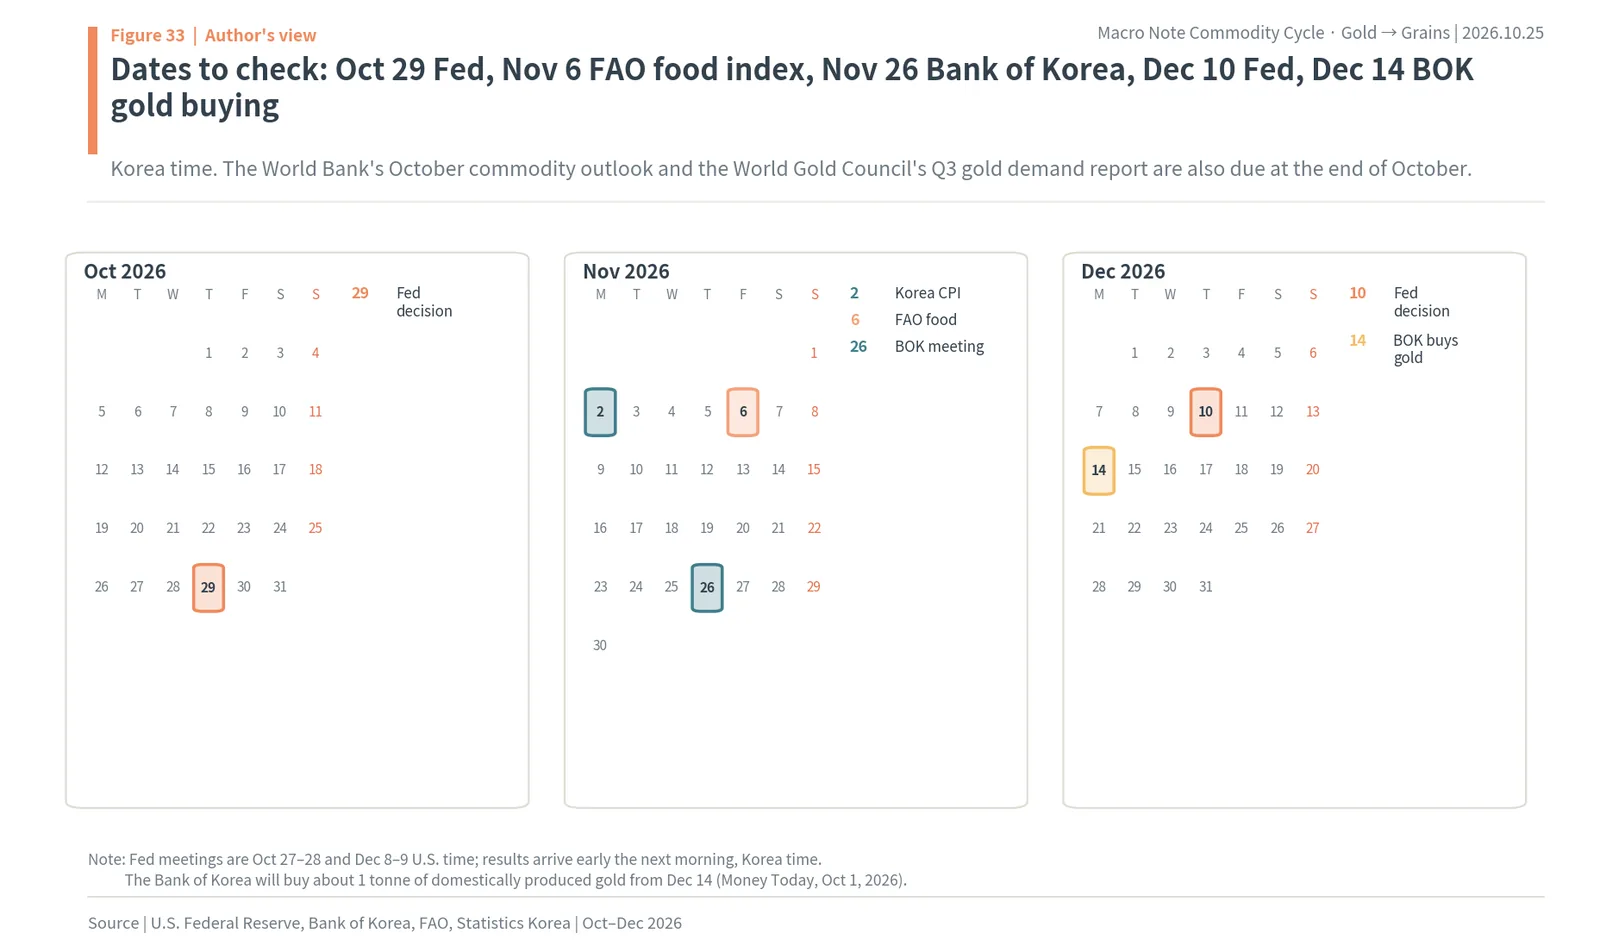
The dates to check are the Fed decision early on October 29 (Korea time), Korea’s October consumer prices on November 2, the FAO Food Price Index on November 6, the Bank of Korea’s Monetary Policy Board meeting on November 26, the Fed decision early on December 10, and December 14, when the Bank of Korea starts buying about 1 tonne of domestically produced gold. The World Bank’s October commodity outlook and the World Gold Council’s third-quarter gold demand report are also due at the end of October.
Frequently asked questions: five things that confuse first-time commodity investors
This chapter restates the report as questions and answers. In one line: gold rises first, the dinner table last. The five questions below come up most often when turning that order into actual investment decisions.
Gold has already come down from its peak. Is now the time to buy it cheaply?
By the order, gold is the first to turn down at the last link of the chain and the first to bottom in the next cycle. But its troughs came when rates looked unlikely to rise any further. Right now the U.S. real yield is high at 2.74% and inflation is 3.7%, so a sign that rates are turning is needed first. Given that gold rose one year after all four past oil peaks, whether an oil peak is confirmed is the first clue for gold.
Copper is still strong. Is it too late to buy?
Copper is the link that runs longest in this cycle. Ore is short and power demand continues, a structural part that the author expects to make its unwinding later and smaller than the other links’. But at the last link of the chain, copper too is eventually hit by rates and the economy: one year after an oil peak, copper fell all four times. It is also worth noting that in this cycle the volumes of the power equipment makers that use copper moved far more than the copper price itself.
If silver moves twice as much as gold, isn’t silver the better buy?
Silver rises about twice as much on the way up, but it also falls about twice as much on the way down. Silver futures falling 31.3% in a single day on January 30, 2026 is one example. The gold/silver ratio is the easiest yardstick for when to buy silver. Buying in months when the ratio was above 90 was followed by silver rising far more than gold over the next year, while buying below 50 left silver behind gold. The ratio is now 74.3, in the middle.
Which is better, commodity ETFs or related stocks?
ETFs track commodity prices but carry roll costs and dividend income tax, while related stocks ride the company’s feedstock, pricing and volumes more than the commodity price. For gold, the KRX Gold Market is tax-free, which is an advantage. With related stocks, results were opposite even within the same link, depending on whether the company owned its raw materials and could pass on prices.
Can the chain’s order be trusted to repeat?
The order arises because each link reacts to something different: gold to rate expectations, copper to investment, oil to operations and grains to the farming cycle. As long as that structure stays the same, the author expects the order to continue in much the same way. But the order is a matter of earlier and later, and the number of months in between has differed from cycle to cycle. So it is better to use the order as a map for guessing the next link and to confirm actual decisions with indicators such as rates, inventories and price ratios.
Basis of calculation and data
This chapter explains where the numbers in this report come from and how they were calculated. All of the author’s calculations were done in a single calculation script, and the charts and text use only its results.
Cycle troughs and peaks were taken from monthly average nominal dollar prices in the World Bank commodity price data (the Pink Sheet). Gold is the London gold price, silver the London silver price, copper LME spot, oil the average of Brent, Dubai and WTI (Brent for the inflation peak comparison and the oil charts), urea Middle East, wheat U.S. hard red winter and corn U.S. No. 2 yellow. For each cycle a trough search window and a peak search window were set: the 2000s (June 1998 to December 2002, and June 2005 to December 2008), 2009 to 2011 (July 2008 to December 2009, and June 2010 to December 2012), 2016 to 2018 (June 2015 to December 2016, and March 2016 to December 2018), 2020 to 2022 (June 2018 to December 2020, and June 2020 to December 2022) and 2022 to 2026 (June 2022 to December 2023, and January 2024 to September 2026). Within each, the lowest month and then the highest month after it were chosen. The number of months each commodity lagged gold was counted, and the median of the five cycles taken. For copper, wheat and corn in 2022 to 2026, September is the latest data point, so their peaks may still change.
The group index cross-correlations use 12-month log changes of World Bank indices (2010 = 100) from 2000, shift one series by -6 to +24 months, and pick the lag with the highest correlation. Real prices were converted into September 2026 dollars with the U.S. consumer price index (FRED CPIAUCSL). The inflation peak is the 12-month change in the same index.
The long-run panels of the event and price charts use World Bank monthly averages, and the close-ups of this cycle use Yahoo Finance futures closes (gold GC=F, silver SI=F, COMEX copper HG=F, Brent BZ=F, wheat ZW=F, corn ZC=F). Futures closes can differ from intraday spot highs or London prices, which the text notes separately. Stock returns were calculated from Yahoo Finance closes (adjusted for stock splits, excluding dividends). Returns by gold/silver ratio band sort each month from September 2000 into a band using month-end futures closes and take the median of the following 12-month returns. The year after oil peaks and the year after gold peaks were calculated from the same month-end prices. Beta is the covariance of monthly returns divided by the variance of the benchmark asset.
The futures ETF example is a hypothetical calculation that assumes spot stays at 100 all year with 1% monthly contango (or backwardation), that is 100 ÷ 1.01^12 (or 100 × 1.01^12). It differs from the roll costs of real products.
Sourced numbers come from the World Gold Council (central bank buying, gold demand, mine costs), the Silver Institute (silver supply and demand, solar), the ICSG, IEA and S&P Global (copper supply and demand, mine lead times, inventories), the World Bank (commodity outlook, cycle lengths, fertilizer), the FAO (Food Price Index), the U.S. Federal Reserve, the BLS and the Bank of Korea (rates and inflation), Korea Zinc’s IR presentation (sales by metal) and the KRX and KB Securities (tax). Won amounts are converted at KRW 1,326.0 per dollar, the October 23, 2026 rate.
Maochaedung’s take. Gold rises first, the dinner table last, and prices come back down in the order they rose. In the five upswings since 1999, peaks came after gold’s by a median 6 months for oil, 7 for copper, 8 for fertilizer, 10 for corn and 14 for wheat, and the 2025 to 2026 chain kept to that order: silver and gold in January and February, oil and urea in April, copper, wheat and corn in September. With U.S. inflation at 3.7% and the Fed hiking in September, the author reads the present as the last link. One year after past oil peaks, oil, wheat and copper fell every time and gold rose every time, so the author expects the unwinding to run in the same order, with copper last because of its ore shortage and power demand, and the next cycle to start with gold once an oil peak is confirmed and rate cuts come into view.
The commodity cycle order: quick answers
Q. In what order do commodities usually peak in a cycle?
In the five upswings since 1999, gold and silver peaked first. Using World Bank monthly averages, the median peak came after gold’s by 6 months for oil, 7 for copper, 8 for fertilizer (urea), 10 for corn and 14 for wheat. In 2025 and 2026 silver peaked in January, gold in February, oil and urea in April, and copper, wheat and corn in September.
Q. Why does gold move first?
Gold pays no interest, so it reacts first to expected changes in interest rates and the dollar. Its troughs came around turns in rates, such as November 2008 and December 2015. Copper needs real investment in factories and grids, oil needs factories and transport to run, and grains need a farming cycle, so they follow later.
Q. Where is the commodity cycle in late 2026?
The author reads it as the last link. U.S. inflation peaked at 4.17% in May and was 3.7% in September, and the Fed raised rates by 0.25 percentage point on September 16. In four past cases, one year after oil peaked, oil, wheat and copper fell and gold rose every time.
Q. Why does the author expect copper to fall last?
Refined copper is in surplus, but ore is short: the spot smelting fee was -$272.20 a tonne on October 9, and COMEX held 714,513 tonnes, about 69% of visible stocks, because of U.S. tariff expectations. Demand from data centres and power grids continues regardless of rates.
Q. Is the gold/silver ratio useful for timing silver?
Since 2000, buying silver in months when the ratio was above 90 was followed by a median one-year gain of 65.9%, against 24.7% for gold. At 50 or below, silver returned -0.5% against 16.0% for gold. The ratio was 74.3 in October 2026.
Q. How are commodity investments taxed in Korea?
Individuals pay no tax on trading gains in the KRX Gold Market, though withdrawing physical gold incurs 10% VAT. Korean-listed commodity futures ETFs are taxed at 15.4% as dividend income, and those gains count toward the KRW 20 million (about $15,100) annual threshold for comprehensive financial income taxation.
Sources
- Simon-Ehrlich wager (link), Wikipedia, accessed Oct 25, 2026; Kiel, Matheson and Golembiewski, “Luck or skill? An examination of the Ehrlich-Simon bet”, Ecological Economics 69(7), 2010; Paul Sabin, The Bet, 2013; Barry Popik, “The cure for high prices is high prices” (link)
- World Bank, Commodity Price Data (Pink Sheet) monthly prices and indices (link), Oct 2, 2026; World Bank, Commodity Markets Outlook April 2026 (link), Apr 28, 2026, and full report (link); Commodity Markets Outlook April 2025 special focus (link)
- World Gold Council, Gold Demand Trends Full Year 2025 (link), Jan 29, 2026; Gold Demand Trends Q2 2026, central banks (link), Jul 30, 2026; Gold Mid-Year Outlook 2026 (link), Jul 1, 2026; central bank gold statistics (link), Oct 6, 2026; mining costs Q1 2026 (link), Aug 24, 2026
- RBC Wealth Management, gold and real rates (link), Jun 26, 2025; Axios, Kevin Warsh nomination and gold and silver prices (link), Jan 30, 2026
- Silver Institute and Metals Focus, World Silver Survey 2026 (link), Apr 15, 2026; Silver Institute, lease rates and record prices in 2025 (link); pv magazine, silver demand in solar (link), Apr 15, 2026; USGS Mineral Commodity Summaries 2026, silver (link) and copper (link); Silver Thursday (link), Wikipedia
- ICSG press releases (link), Oct 14, 2026; Capital.com, ICSG refined copper surplus (link); IEA, Global Critical Minerals Outlook 2026 (link), Jul 16, 2026; S&P Global Market Intelligence, discovery to production (link) and permitting delays (link), Jul 2026; Reporte Minero, copper inventories (link), Oct 2026; The Oregon Group, copper treatment charges (link); Freeport-McMoRan 8-K, Oct 2, 2026
- IEA, collective action of March 11, 2026 (link); U.S. Federal Reserve FOMC statement (link), Sep 16, 2026; FAO Food Price Index (link), Oct 2, 2026; FRED (U.S. consumer prices, federal funds rate, real yields)
- Korea Zinc, 4Q25 IR presentation (link), Feb 2026; KRX Gold Market leaflet (link); KB Securities, ETF tax guide (link); Korea Ministry of Agriculture, Food and Rural Affairs, food and grain self-sufficiency rates; Newsis, Korean Air second-quarter results, Jul 13, 2026; Money Today, Bank of Korea gold purchases, Oct 1, 2026; Yahoo Finance futures and share closes (Jan 2, 2025 to Oct 23, 2026)
- Photos: Diego Delso (CC BY-SA 4.0), Andrzej Barabasz (CC BY-SA 4.0), DiamondIIIXX (CC BY-SA 4.0), Novoklimov (CC0), Clusteringcoefficient (CC BY-SA 4.0), Mar11 (CC BY-SA 4.0), unknown author (public domain), via Wikimedia Commons
Was this note useful?
Thanks. Your answer helps decide what to cover next.
Korea market snapshot · Oct 23, 2026
New to Korean stocks? Start here for the basics.
Most read
1France Protests 2026: Why Students Are Blocking Schools and Which Stocks Benefit (Munich Re, SCOR)
Get the Saturday note on Korean stocks
One email every Saturday with the week’s new research on Korean listed companies and links to the updated data pages. Built from DART filings and KRX data. Free; unsubscribe in one click. See past issues