China’s Lewis Turning Point: Cheap Labour Is Over, Cheap Goods Are Not, and What It Means for Korean Stocks (2026)
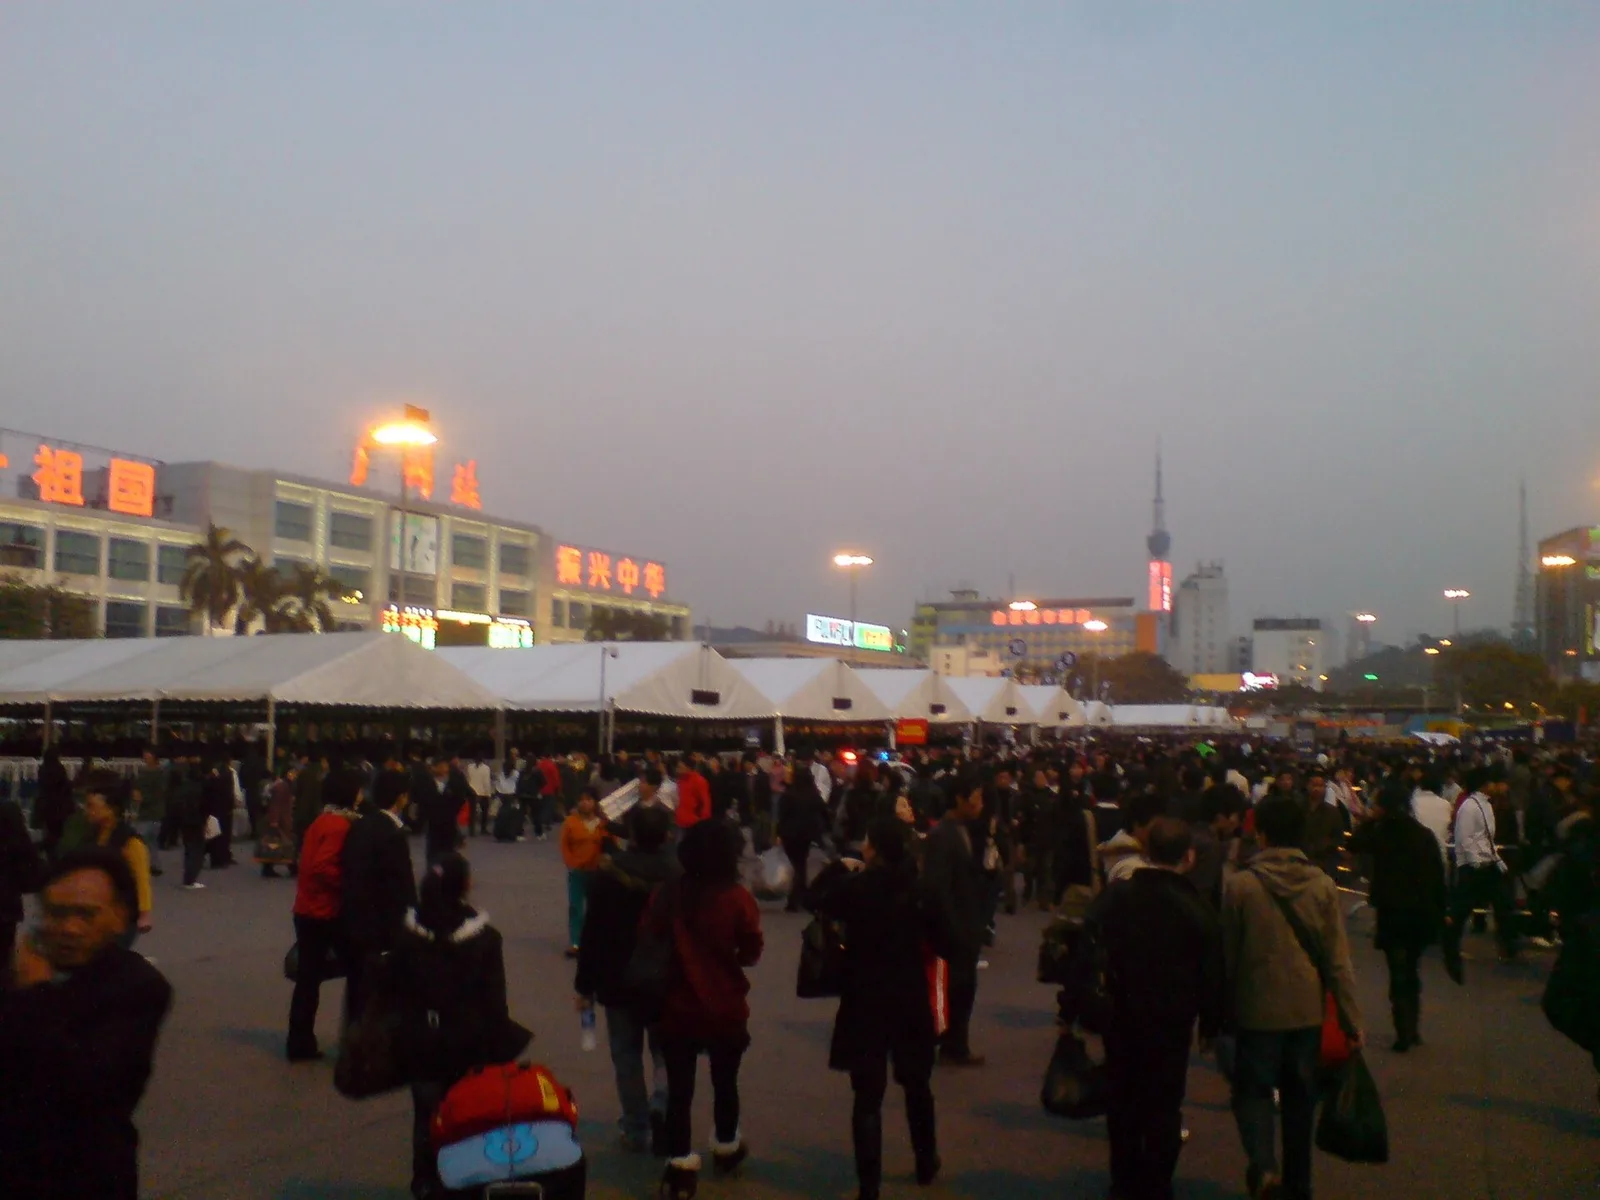
In July 2012 the Chinese population economist Cai Fang wrote that the labour shortage symbolised by the “mingonghuang”, the shortage of migrant workers, first appeared in 2004, had never let up since, and kept pushing up the wages of ordinary workers. Then he drew the line: “因此,按照二元经济理论的定义,我们把2004年看作是刘易斯转折点到来的年份” (“so, by the definition of dual-economy theory, we regard 2004 as the year the Lewis turning point arrived”). Every year around the Lunar New Year, the crowds of migrant workers going home that packed the squares in front of big stations such as Guangzhou’s were the image of the endless supply of labour China had enjoyed for 30 years. Cai Fang’s sentence was a declaration that the end of that supply had come into view.
The term Lewis turning point comes from a 1954 paper by the economist W. Arthur Lewis. The idea is that the countryside of a poor country holds surplus labour, people whose work adds almost nothing to output, and that city factories can grow by bringing that labour in at the same low wage. Lewis wrote that this cannot last forever: “The process must stop when capital accumulation has caught up with population, so that there is no longer surplus labour.” From that point on, wages are set not by what it takes to live in the village but by factories competing for workers.
So this time the question is: now that there is no one left to come from China’s villages, what happens to China’s economy, and what arrives on the Korean stock market? This report follows, in order, the 40 years of movement from village to city, the numbers showing that migrant workers have stopped growing and are getting older, the wage rise that followed, the investment, property and debt that filled in for growth, the way factory output was pushed into exports after property turned down, and the marks all of this has left on Korean sectors and share prices.
As of: October 24, 2026 (share prices are closes on October 23, 2026; Chinese statistics are those released up to October 20). Won amounts are converted at KRW 1,323.7 per dollar, the closing USD/KRW rate on October 23, 2026. Korean amounts in “eok won” (100 million won) are shown here as KRW billion, and numbers the author calculated are marked as such.
Topics covered: what the Lewis turning point means; urbanisation and the rural population; the growth and age of migrant workers; the IMF’s estimate of surplus labour; the population peak; manufacturing wages and Asian wage comparisons; Korean companies’ investment in China; growth and the investment and consumption shares; property and house prices; debt; the trade surplus and steel exports; producer prices; China’s share of world manufacturing; the turning points Japan and Korea went through first; Korea’s trade with China and Korean sectors; share prices; the author’s view and the signals to watch; and the basis of calculation.
The Lewis turning point is when surplus labour runs out and wages start to rise
To start with the conclusion: the Lewis turning point is the moment a factory can no longer bring in people at the same wage. Until then a factory does not need to raise pay to hire more. The village has many people whose work barely adds to the harvest, so offering them a little more than it takes to live in the village is enough to bring them to the city. The factory owner puts the profit back into the factory, and the new factory again brings people in from the village. The growth Lewis described is this loop.
The loop has an end. When there are fewer people to bring from the village, factories have to take workers from one another, and from then on wages are set by competition between factories rather than by the village’s subsistence level. When wages rise, factories that relied on cheap labour earn less, and to make the same money they must use more machines instead of people, make more expensive goods, or move to a country where labour is cheaper.
In a picture, a flat wage line suddenly bends upward
The next figure is a simple, hypothetical drawing of the idea. The horizontal axis is the amount of labour the factory brings in, in steps 1-12, and the vertical axis is the wage it must pay, with the starting wage set at 1. While there is surplus labour the wage line is flat: the factory can double its workforce and the wage stays the same. Past the point where surplus labour runs out, the factory has to raise the wage more and more to bring in each additional worker, so the line bends upward. That kink is the Lewis turning point.
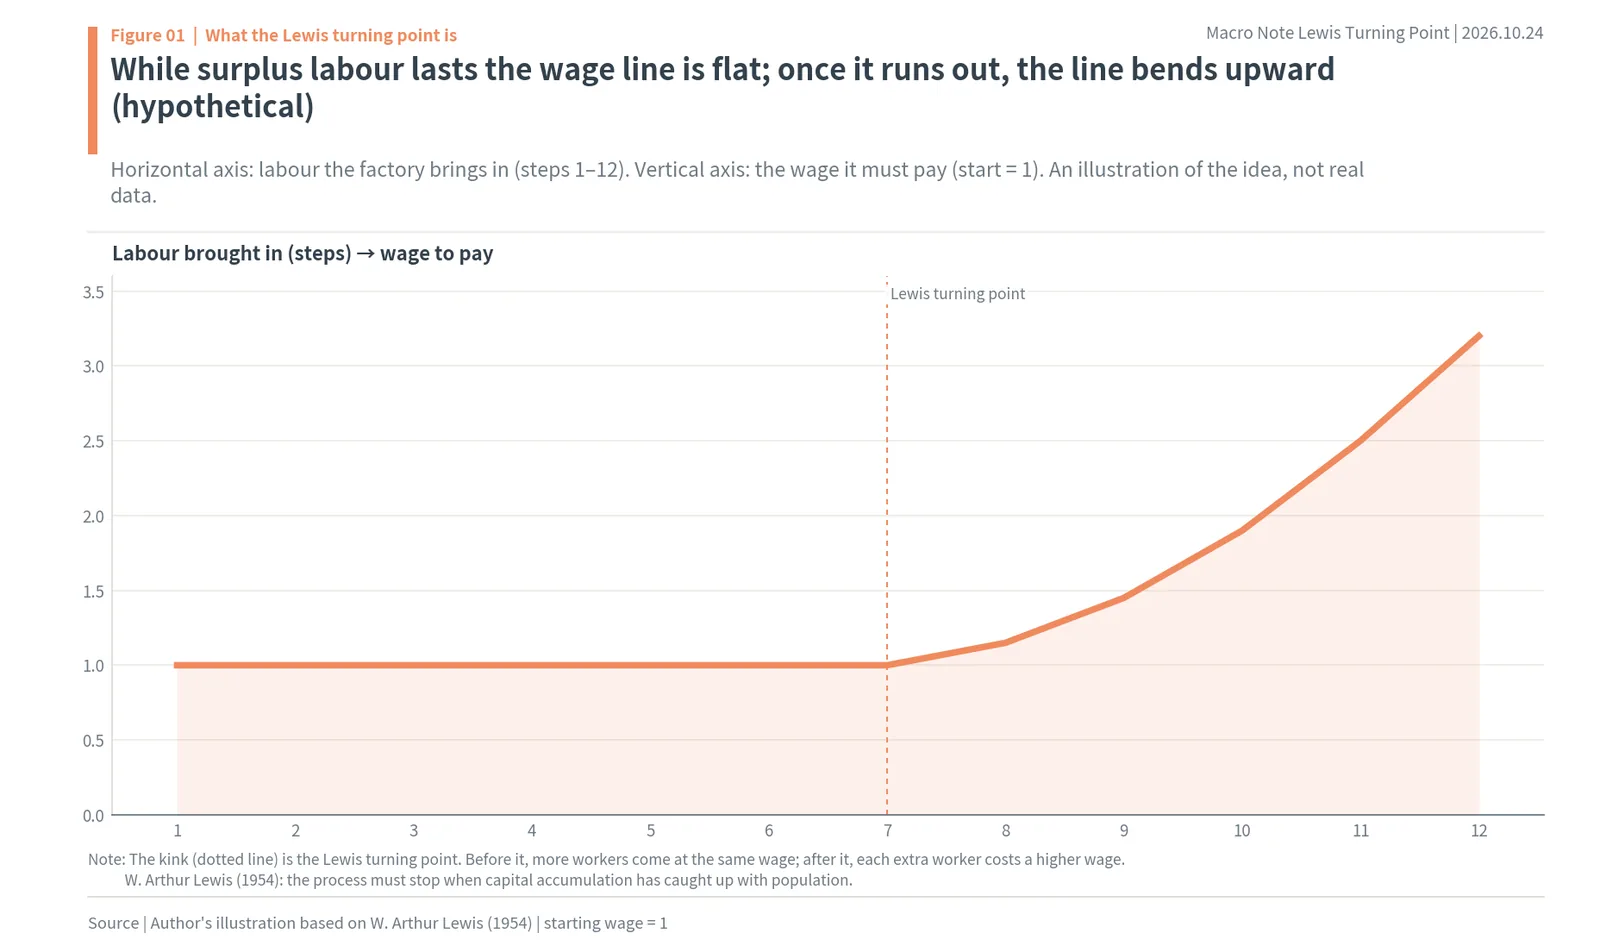
What matters in this picture is that the world after the kink works differently from the world before it. Before the kink, adding workers alone raises output and keeps export prices low. After it, raising output takes more money, that is, capital. So a country that has passed the turning point usually invests more, funds that investment with debt, and where the debt goes decides what the next decade looks like. China’s last 20 years followed exactly this path.
China passed this point somewhere between 2004 and the 2020s
Cai Fang put the turning point in 2004, when the migrant worker shortage first appeared. Two IMF researchers, in a 2013 paper, calculated that China’s surplus labour would shrink from about 151 million in 2010 to 57 million in 2015 and 33 million in 2020, and fall to minus 27 million in 2025 in their baseline scenario. They concluded that the turning point would emerge between 2020 and 2025. The dates differ by researcher, but the direction is the same. Signs that labour was getting scarce appeared around 2004, and by the 2020s surplus labour had all but disappeared.
Key terms and a hypothetical example: one factory makes the turning point visible
The conclusion of this chapter is that only a few terms are needed to understand the Lewis turning point. Five terms, migrant workers, hukou, producer prices, the investment share and non-financial debt, plus a one-factory hypothetical example, are enough to follow the rest of this report.
Five terms
Migrant workers (nongmingong) are people whose household registration is in the countryside but who work in factories, construction sites or shops, in cities or near home. China’s National Bureau of Statistics (NBS) counts both out-migrant workers, who have left their home area to work elsewhere for more than six months, and local migrant workers, who do non-farm work within their home area. In 2025 there were 180.06 million out-migrant workers and 121.09 million local migrant workers.
Hukou is the household registration system that decides where a person belongs. Even someone living in the same city does not get full access to its schools, health insurance and public housing without a hukou from that city. That is why Chinese statistics have two urbanisation rates: one counting the people actually living in cities (the resident urbanisation rate) and one counting those with an urban hukou.
The producer price index (PPI) shows how much factory-gate prices have changed from a year earlier. It moves ahead of consumer prices and reflects both raw material prices and price competition between factories. A PPI that stays negative for a long time means factories are selling goods even if they have to cut prices to do so.
The investment share is the part of a year’s national income (GDP) spent on building new factories, machines, roads and buildings; in the statistics it is called gross capital formation. The household consumption share is the part of the same GDP that households spend on food, clothing and other daily needs.
Non-financial debt is the combined debt of households, companies and the government, leaving out financial firms such as banks and insurers. The Bank for International Settlements (BIS) compiles it on the same basis for each country as a ratio to GDP. The bigger the number, the more debt there is to repay relative to what the economy earns in a year.
Hypothetical example: a village with surplus labour and one factory
Take a hypothetical example. Suppose a farming village has 100 people who can work, but 60 are enough to work the fields. The other 40 add almost nothing to the harvest even if they go out to the fields. A factory opens next to the village and offers a monthly wage a little higher than what it takes to live in the village. Even as the 40 go into the factory one by one, the village harvest barely falls, so the factory can keep bringing people in without raising pay. This is the flat stretch of the line in Figure 1.
From the 41st person on, things change. Anyone who comes to the factory now is someone who was actually working the fields, so when that person leaves, the village harvest shrinks. To bring that person in, the factory has to pay more than what they lose by leaving the fields. And if two or three factories open in the same village, they raise pay further to take workers from one another. The point where the line in Figure 1 bends upward is exactly this 41st person.
Moved to China, the village is the whole Chinese countryside and the factory is the export factories of the coastal regions. The migrant worker shortage that Cai Fang said first appeared in 2004 was the sign that the 41st person had started to show up, and the 151 million surplus workers the IMF counted for 2010 were the size of the 40 who had not yet come to the factories. That those 40 had almost all left by the 2020s is what this report sets out to show in numbers.
Over 40 years, the countryside’s surplus labour moved to city factories
The conclusion of this chapter is simple. Over the past 40 years, most of the people in China’s countryside who could move to the cities have moved. The rural population peaked in 1995 and began to fall, and the share of people farming went from half of all workers to just over a fifth.
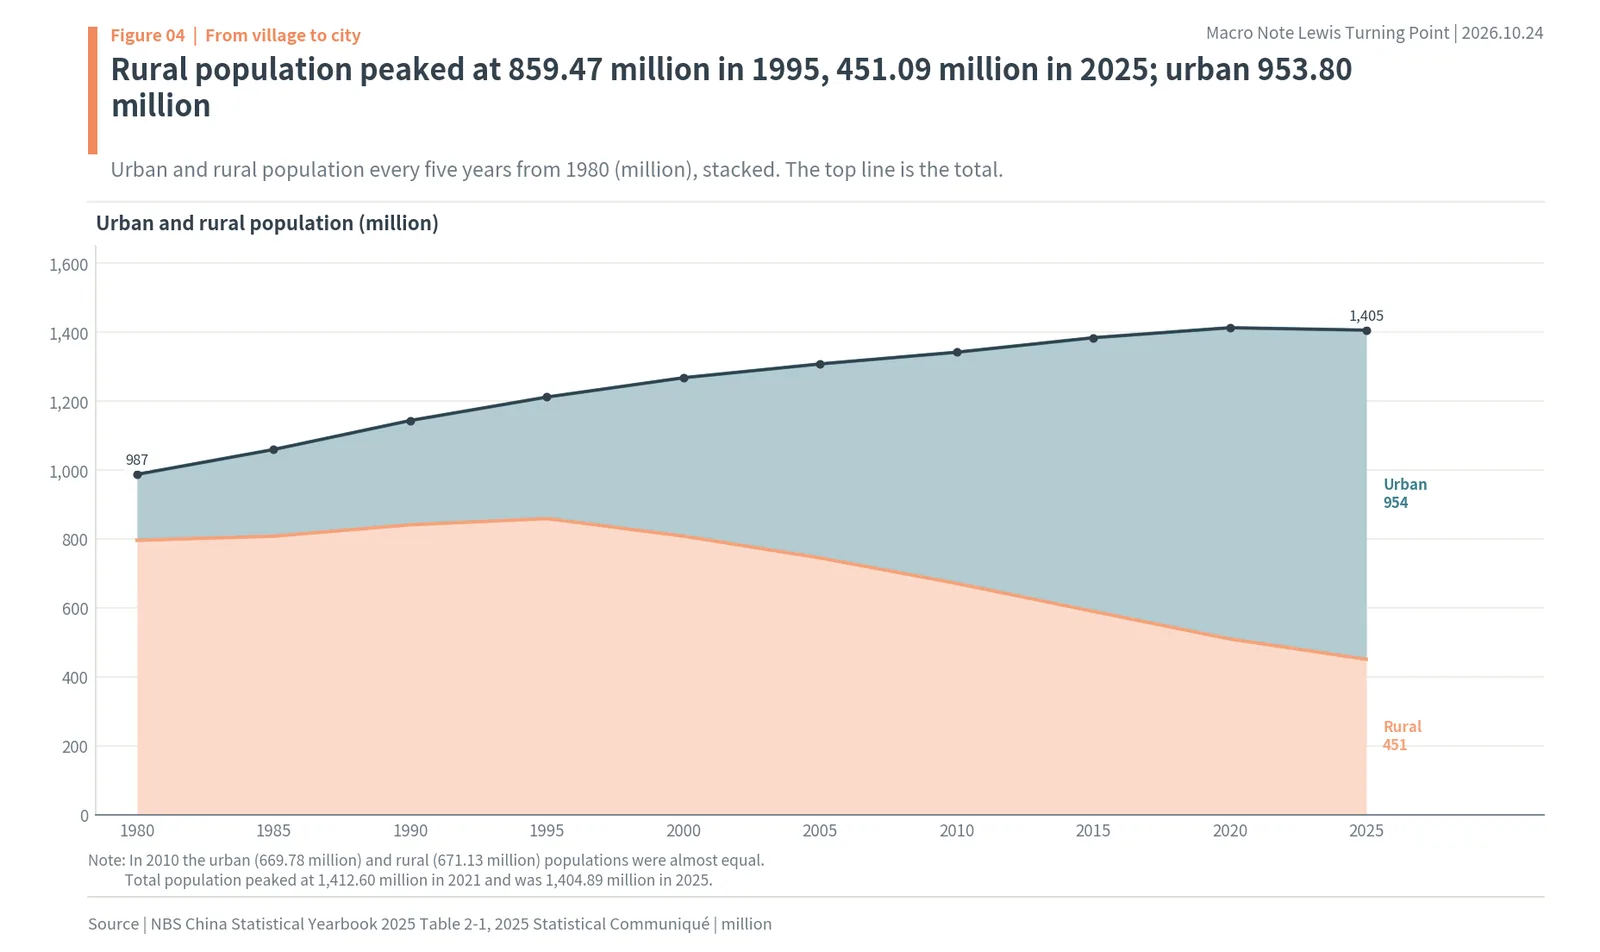
According to the NBS statistical yearbook, China’s rural population was largest in 1995 at 859.47 million. It then fell every year, to 671.13 million in 2010, 509.92 million in 2020 and 451.09 million in 2025. In 30 years about 400 million people left the rural population. The mountain villages and rice terraces are still there, but the number of people working in the primary sector fell from 355.30 million in 1995 to 162.98 million in 2024, less than half.

The same is true of who does the work. The share of all employed people working in the primary sector, that is, farming, forestry and fishing, was 70.5% in 1978. It fell to 60.1% in 1990, 50.0% in 2000 and 36.7% in 2010, then to 23.6% in 2020 and 22.2% in 2024. A country where three in five workers farmed became one where only about one in five does.
Urbanisation went from 17.92% in 1978 to 67.89% in 2025
The share of people living in cities, the resident urbanisation rate, was 17.92% in 1978. It passed 26.41% in 1990 and 36.22% in 2000, and in 2011 it crossed half for the first time at 51.83%. It was 63.89% in 2020 and 67.89% in 2025. In the next figure the left panel is the urbanisation rate and the right panel is the primary sector’s share of jobs, which fell from 70.5% to 22.2%. The two lines move almost like mirror images: as urbanisation rose, the share of people farming fell.
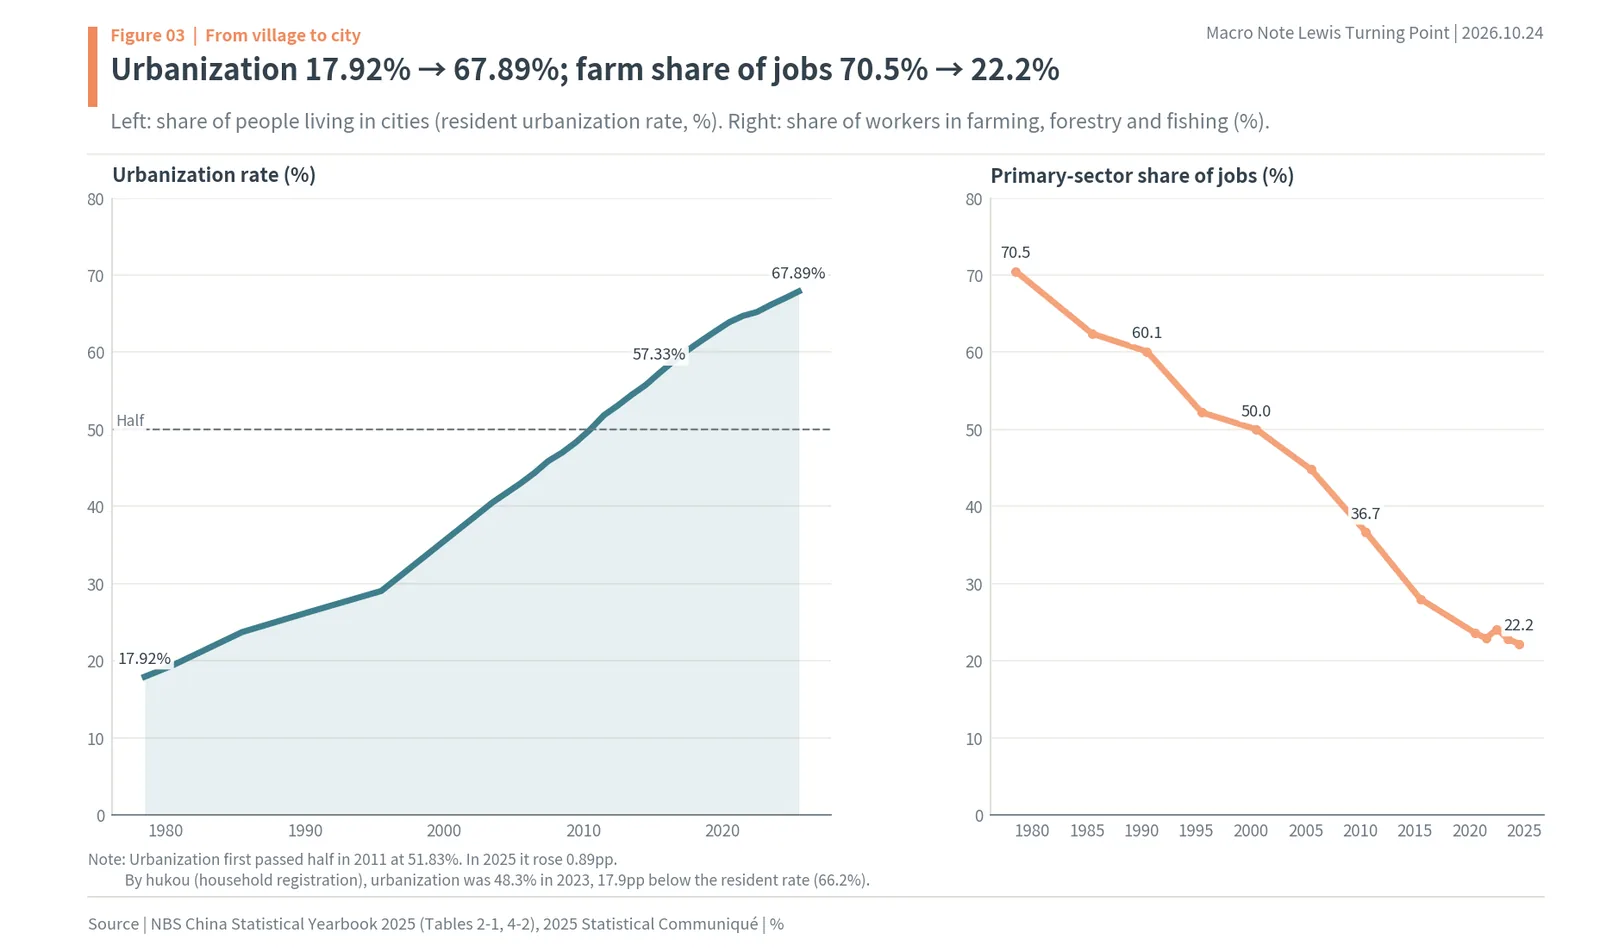
Cut into decades, the trend is even clearer. In the 1980s (1980-1990) urbanisation rose 7.02pp, from 19.39% to 26.41%. It rose 9.81pp in the 1990s and 13.73pp in the 2000s, the fastest pace. The 2010s (2010-2020) were similar at 13.94pp, and in the five years from 2020 to 2025 it rose 4.00pp (author’s calculation). The 2000s and 2010s, when the most people moved from village to city, were also when China grew into the world’s factory.
The pace of urbanisation is also slowing. In the 2000s there were many years when the rate rose by more than 1pp, but in 2025 it rose 0.89pp. The flow of people into the cities has not stopped, but the first great wave has passed.
Put rural and urban populations side by side and they cross
In absolute numbers the change is even plainer. In 1978 the urban population was 172.45 million and the rural population 790.14 million. Around 2010 the two were almost equal, and in 2025 the urban population was 953.80 million against 451.09 million in the countryside, down from the 1995 peak of 859.47 million. The next figure stacks the two. The total population peaked at 1,412.60 million in 2021, and over time the urban part widens while the rural part narrows.
Living in a city does not mean being treated as a city resident, though. Because of the hukou system, people living in a city with a rural hukou do not get the full education, health care and housing benefits of that city. In 2023 the resident urbanisation rate was 66.2%, but the hukou-based rate was 48.3%. A deputy head of China’s National Development and Reform Commission said more than 250 million people have lived in cities for a long time without being able to move their hukou, 170 million of them migrant workers and the families who came with them. These people work in the cities but do not spend freely there. This point comes up again later, when the report looks at why China’s household consumption is low.
Migrant workers have almost stopped growing, and their average age has reached 43.3
The conclusion of this chapter is that the flow of people from village to city has in effect stopped. The numbers say the same thing three ways: the yearly increase in migrant workers has shrunk to less than a tenth of what it was, migrant workers are ageing quickly, and both the working-age and the total population have passed their peaks.
12.45 million were added in 2010, and 1.42 million in 2025
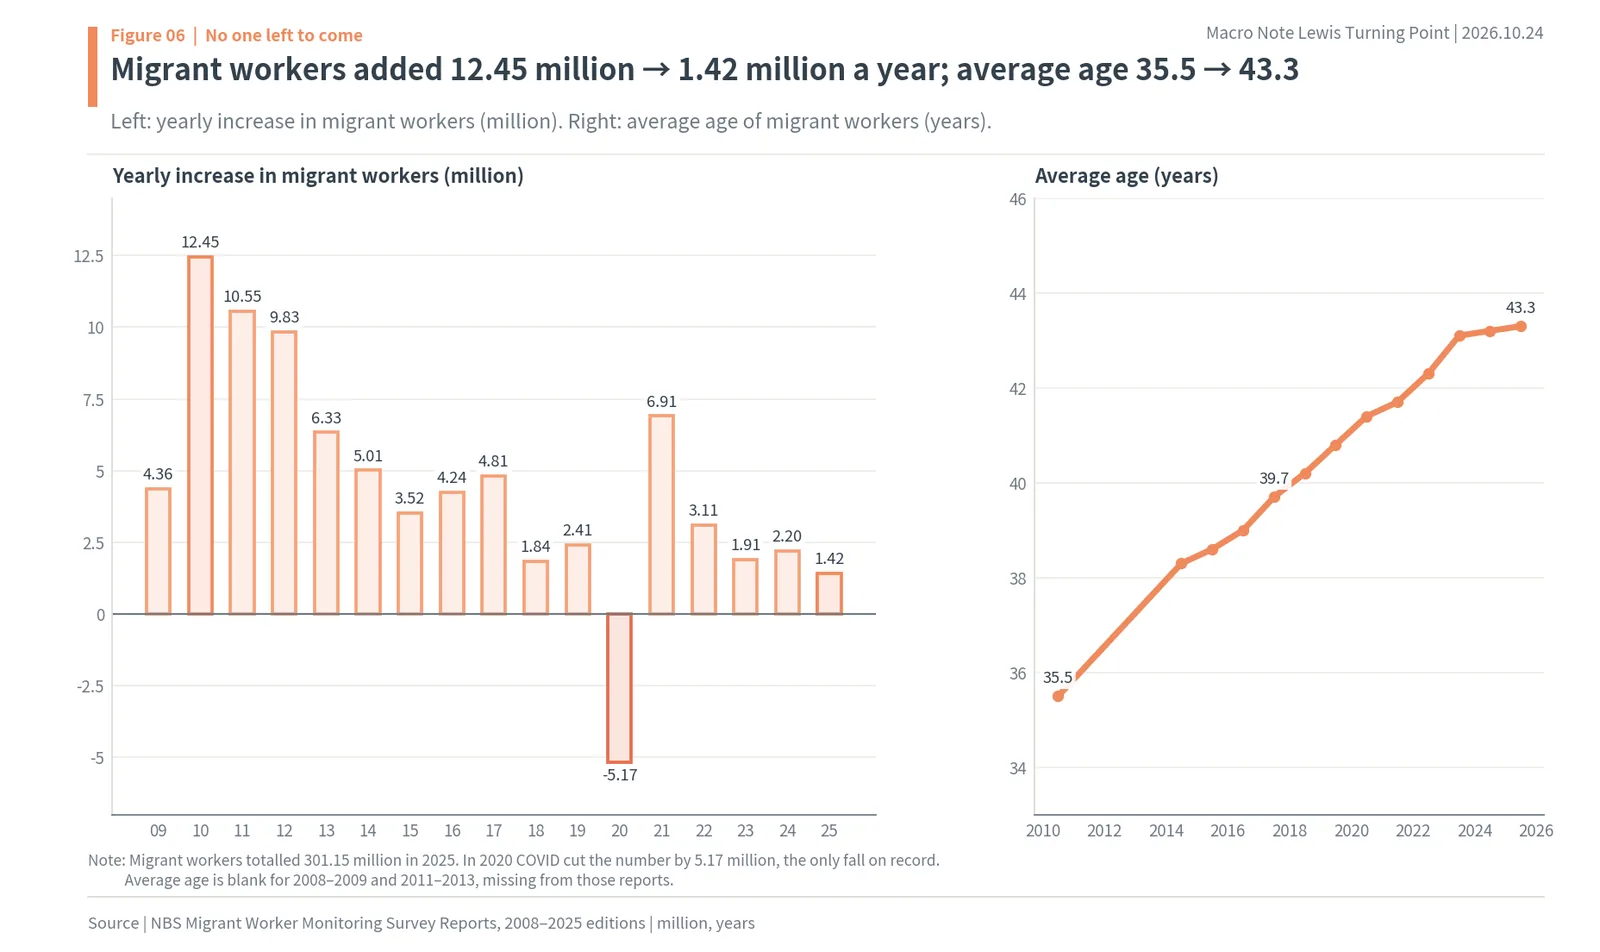
Migrant workers keep their hukou in the countryside and work in factories, construction sites and shops in cities or near home. Every year at the end of April, the NBS publishes its migrant worker monitoring survey report. The 2025 edition, released on April 30, 2026, put the number of migrant workers at 301.15 million, up 1.42 million or 0.5% from a year earlier. In 2010 the number rose by 12.45 million in a single year, so the yearly increase has shrunk to about one 8.8th (author’s calculation). In 2020 COVID cut the number by 5.17 million, the first and only fall since the survey began.
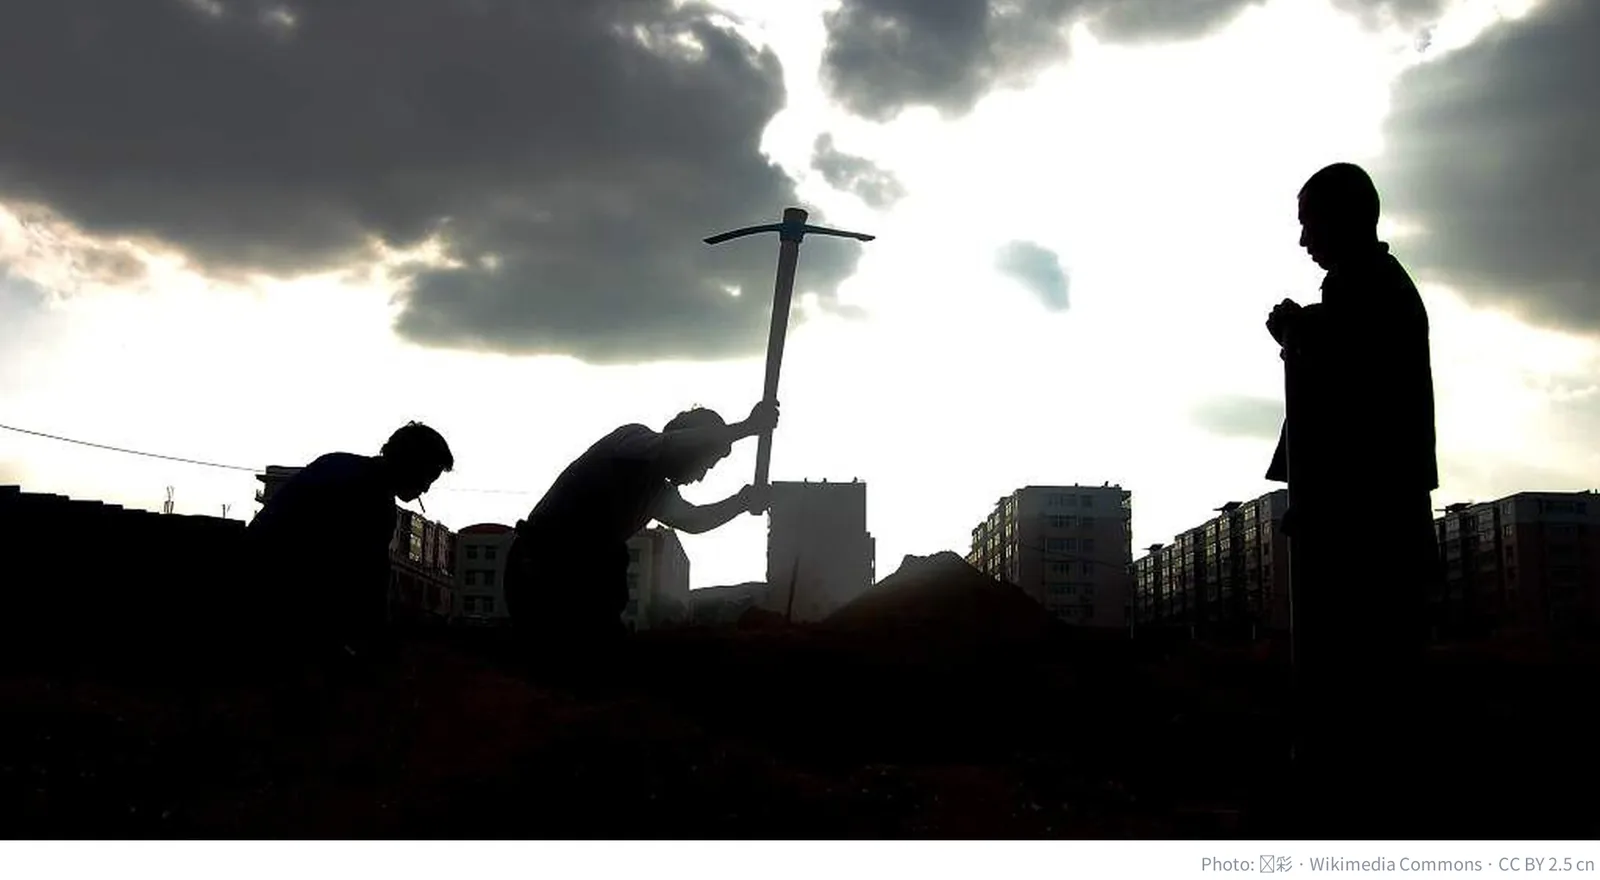
Over the same period the average age of migrant workers rose from 35.5 in 2010 to 43.3 in 2025. It was 39.7 in 2017 and crossed into the forties at 40.2 in 2018. In the next figure the left panel is the yearly increase in migrant workers and the right panel is their average age. While the bars on the left were longest around 2010 and then got shorter, the line on the right rose almost without a pause.
Migrant workers over 50 went from 11.4% to 32.0%
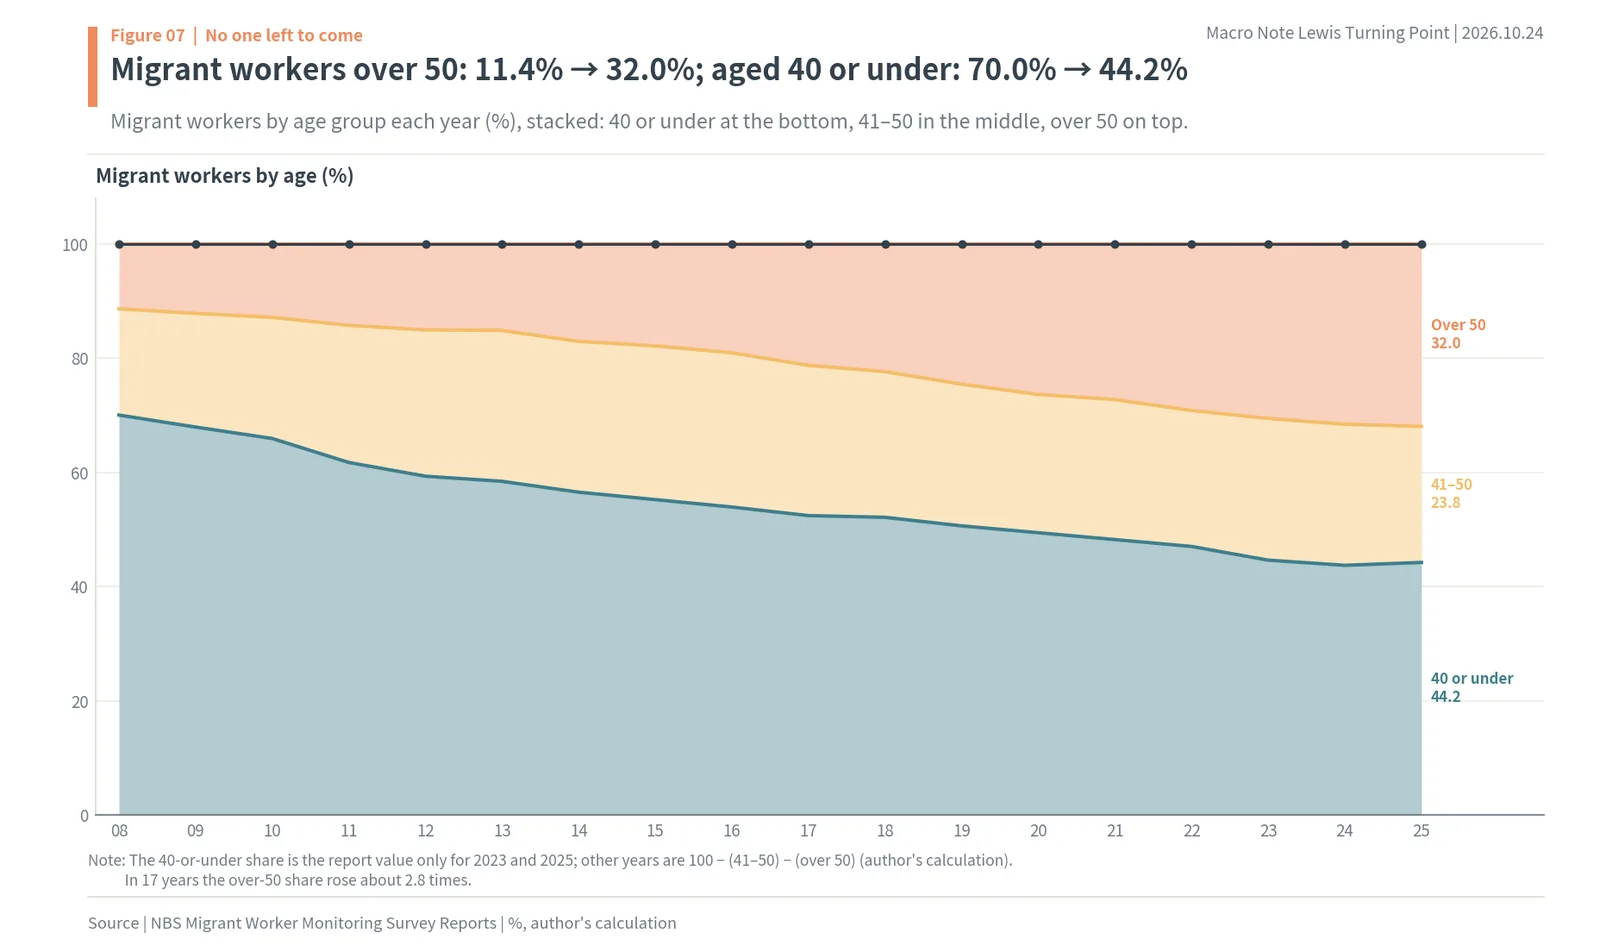
The age mix shows how fast this workforce is ageing. In 2008, 70.0% were 40 or under and 11.4% were over 50. In 2025, 44.2% were 40 or under, 23.8% were 41-50 and 32.0% were over 50. In 17 years the share over 50 rose about 2.8 times (author’s calculation). Along the way, the over-50 share was 17.9% in 2015, 24.6% in 2019 and 29.2% in 2022, rising by 1-2pp a year, and the average age was 38.6 in 2015, 40.8 in 2019 and 42.3 in 2022. It never once moved backwards. With few young people newly arriving in the cities, those already there simply grow older.
The kind of work has changed too. In the 2025 report, 54.7% of migrant workers were in the tertiary sector, meaning services, and 28.2% in manufacturing. Those who leave their home province to work elsewhere numbered 67.65 million, 0.75 million fewer than a year earlier, while those moving around within their own province rose by 2.10 million. Fewer are going far, and more are working closer to home.
Income is no longer rising as fast as before. In 2025 the average monthly income of migrant workers was 5,075 yuan, up 114 yuan or 2.3% from a year earlier; for out-migrant workers it was 5,774 yuan. In 2008 out-migrant workers earned 1,340 yuan a month, so incomes have risen a lot over 17 years, but recent gains have slowed. At year-end, 130.92 million migrant workers were living in cities. The force that pushed wages up as labour grew scarce is now working alongside another force: more older migrant workers, and a shift toward lower-paid jobs such as services.
The IMF calculated that surplus labour would run out between 2020 and 2025
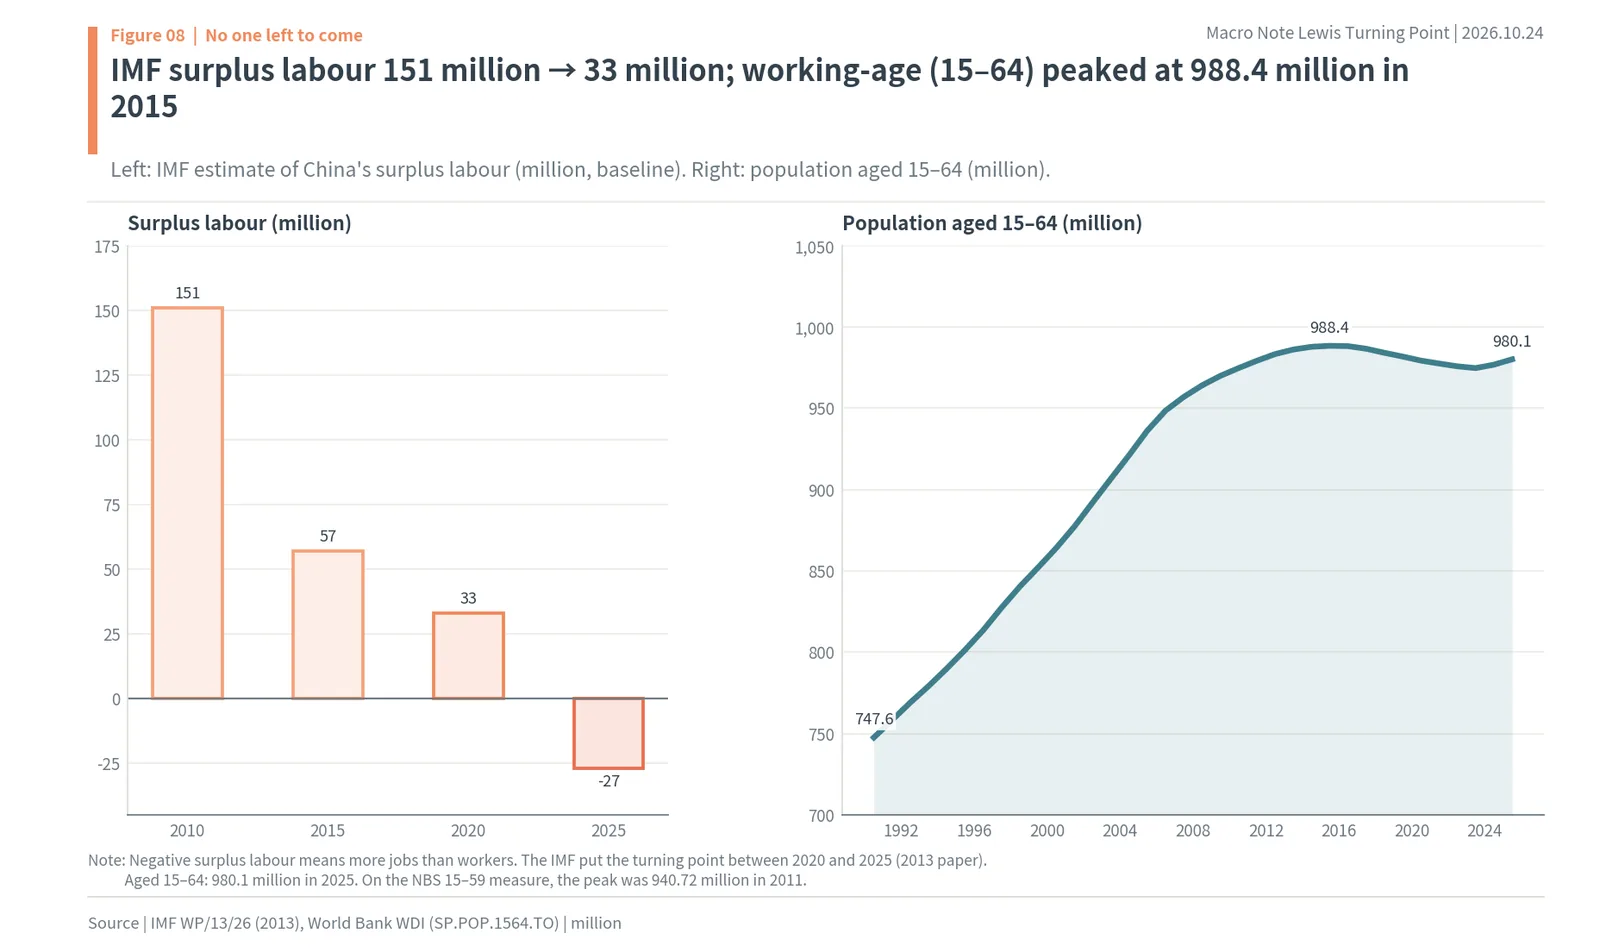
In their 2013 paper, the IMF’s Mitali Das and Papa N’Diaye estimated China’s surplus labour, the number of people able to work in excess of available jobs. In their baseline scenario this number was 151 million in 2010, 57 million in 2015 and 33 million in 2020, and minus 27 million in 2025. Negative surplus labour means there are more jobs than people. The paper concluded that the Lewis turning point would emerge between 2020 and 2025, driven mainly by demographics.
The right side of the next figure is China’s population aged 15-64 as compiled by the World Bank. It peaked at 988.4 million in 2015 and stood at 980.1 million in 2025. The size difference is still small, but what matters is that the number of working-age people, which used to grow, no longer does. On the NBS measure of people aged 15-59, the peak came even earlier, at 940.72 million in 2011, followed by a fall of 3.45 million in 2012.
Total population peaked in 2021; in 2025 there were 7.92 million births and 11.31 million deaths
The total population has started to shrink as well. China’s year-end population was highest at 1,412.60 million in 2021 and stood at 1,404.89 million in 2025. In 2025 there were 7.92 million births and 11.31 million deaths, a natural decrease of 3.39 million. The next figure sets births and deaths side by side for each year from 2022. In 2022 the gap was small, with 9.56 million births and 10.41 million deaths, but by 2025 it had widened sharply.
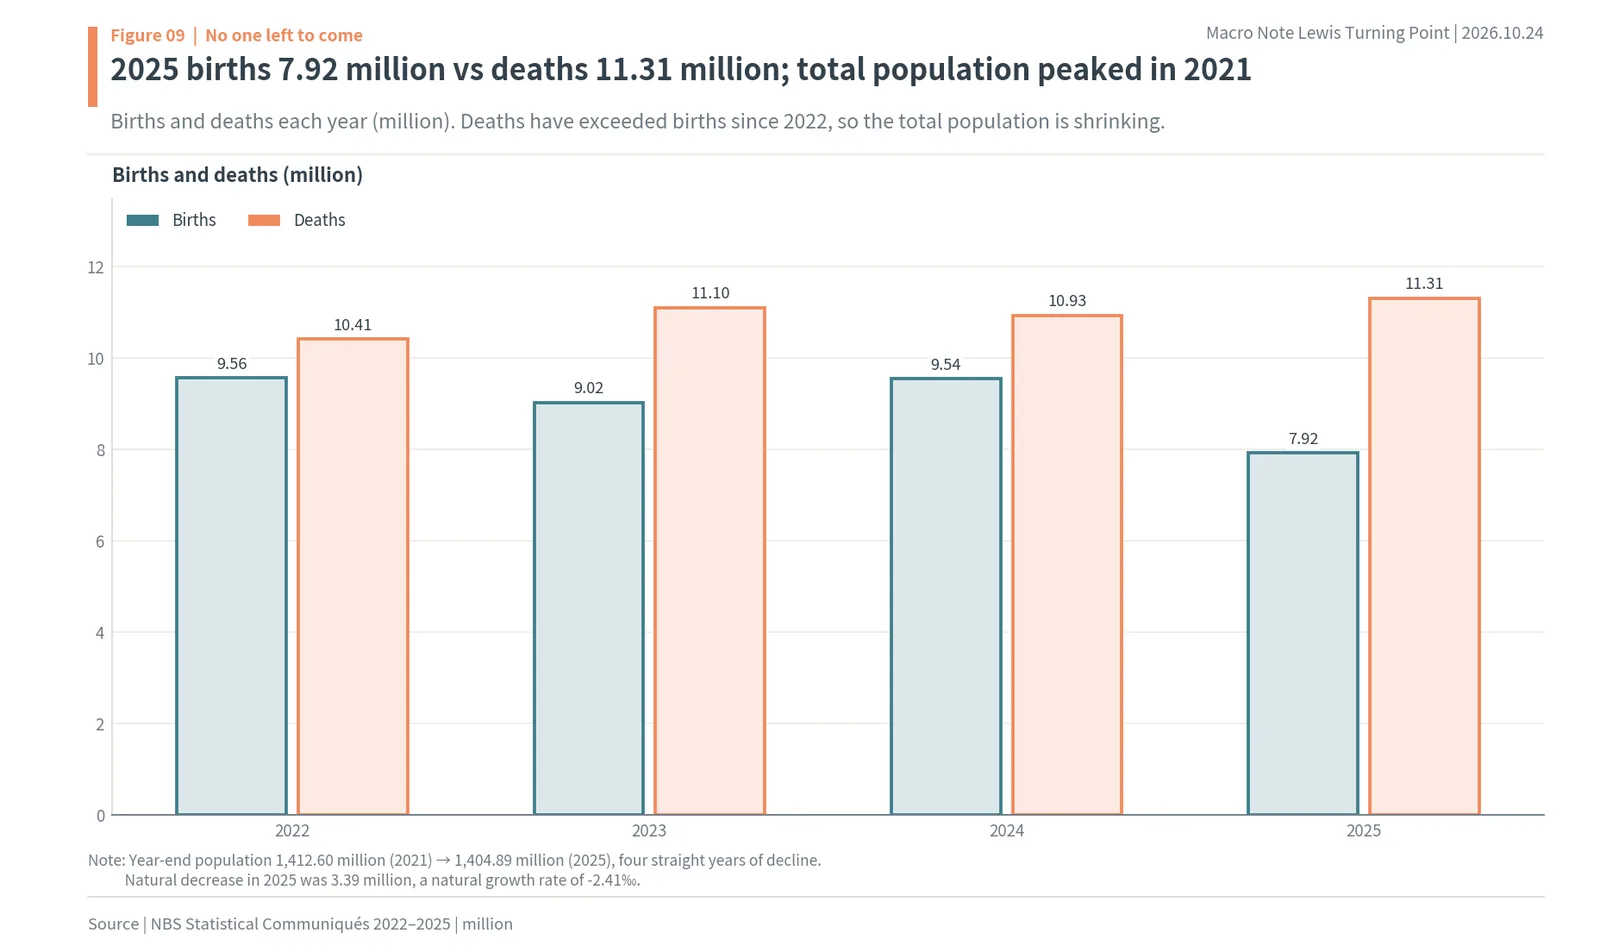
Year by year from 2022, births were 9.56 million, 9.02 million, 9.54 million and 7.92 million, and deaths were 10.41 million, 11.10 million, 10.93 million and 11.31 million. The 7.92 million births in 2025 were the fewest of the four years and the 11.31 million deaths the most. In 2025 there were 323.38 million people aged 60 or over, 23.0% of the population, and 223.65 million aged 65 or over, 15.9%. The population aged 16-59 was 851.36 million, 60.6% of the total, 24.20 million fewer than in 2022 (875.56 million) (author’s calculation). With more people leaving working age than entering it, the working-age group is shrinking by millions a year.
Put these numbers together and there is one conclusion. The young labour that could be brought to the cities is shrinking both in the countryside and in the population as a whole. Most of the surplus labour Lewis talked about has already been used up in China.
As labour became scarce, wages rose 6.8 times and cheap factories left
The conclusion of this chapter is that wages rose just as Lewis predicted, and that factories relying on cheap labour left China as a result. The average annual pay in China’s urban manufacturing rose 6.8 times in 19 years, and the base pay of a Chinese factory worker is now 2.1 times that of a Vietnamese worker. The number of new subsidiaries Korean companies set up in China has fallen to less than a tenth of the peak.
Average manufacturing pay rose from 15,934 yuan in 2005 to 107,987 yuan in 2024
In China’s statistical yearbook, average annual manufacturing pay in urban non-private units, meaning state-owned, collective, joint-stock and other workplaces that are not private firms, was 15,934 yuan in 2005. It passed 30,916 yuan in 2010, 55,324 yuan in 2015 and 82,783 yuan in 2020, and reached 107,987 yuan in 2024. That is about 6.8 times in 19 years (author’s calculation). Over a similar period Shanghai’s monthly minimum wage rose about 4.3 times, from 635 yuan in July 2004 to 1,120 yuan in April 2010, 2,020 yuan in April 2015 and 2,740 yuan in July 2025. Year by year, manufacturing pay was 59,470 yuan in 2016, 72,088 yuan in 2018, 82,783 yuan in 2020, 97,528 yuan in 2022 and 103,932 yuan in 2023, never falling. Even in 2020, when COVID hit, it rose from 78,147 yuan a year earlier. In a country short of labour, wages do not come down easily even when the economy is weak. On the right of the next figure, the base pay of a factory worker in 2023 was $576 in China against $273 in Vietnam.
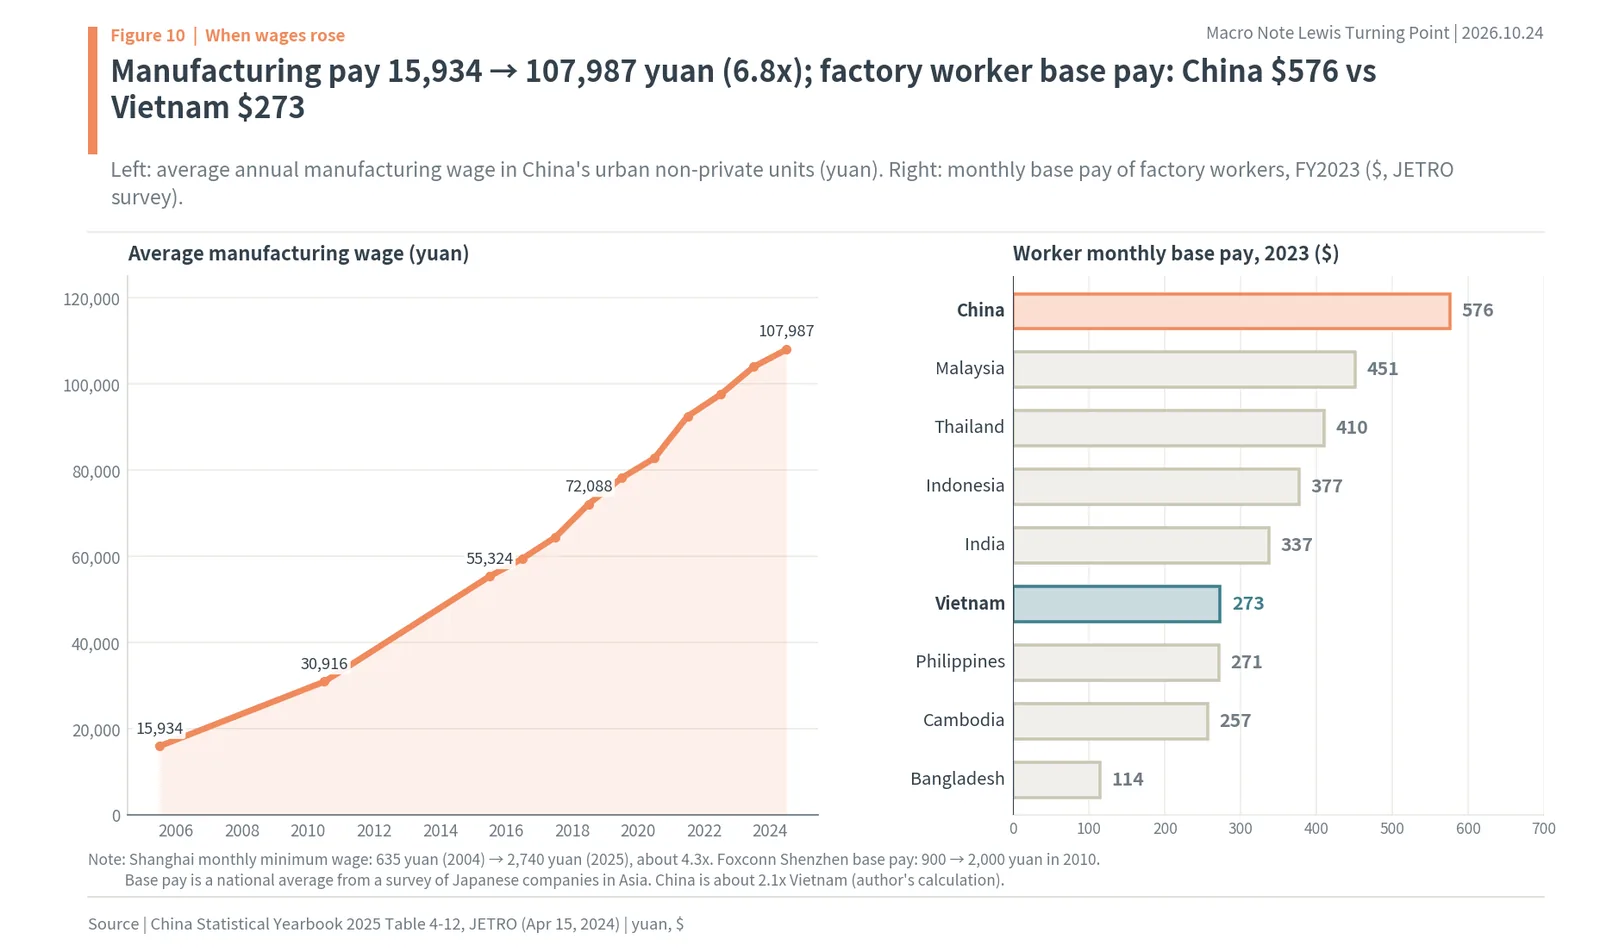
The events that best mark when wages began to bend upward cluster in 2010. In May that year, workers stopped the lines at Honda’s transmission parts plant in Foshan, Guangdong, and the company restarted production after offering 1,900 workers a raise of 366 yuan a month, or 24%. In the same year Foxconn raised base pay at its Shenzhen plant by 30% in June, from 900 yuan to 1,200 yuan, and from October said it would pay 2,000 yuan to assembly line workers who passed a performance review. Base pay rose 2.2 times in four months (author’s calculation).
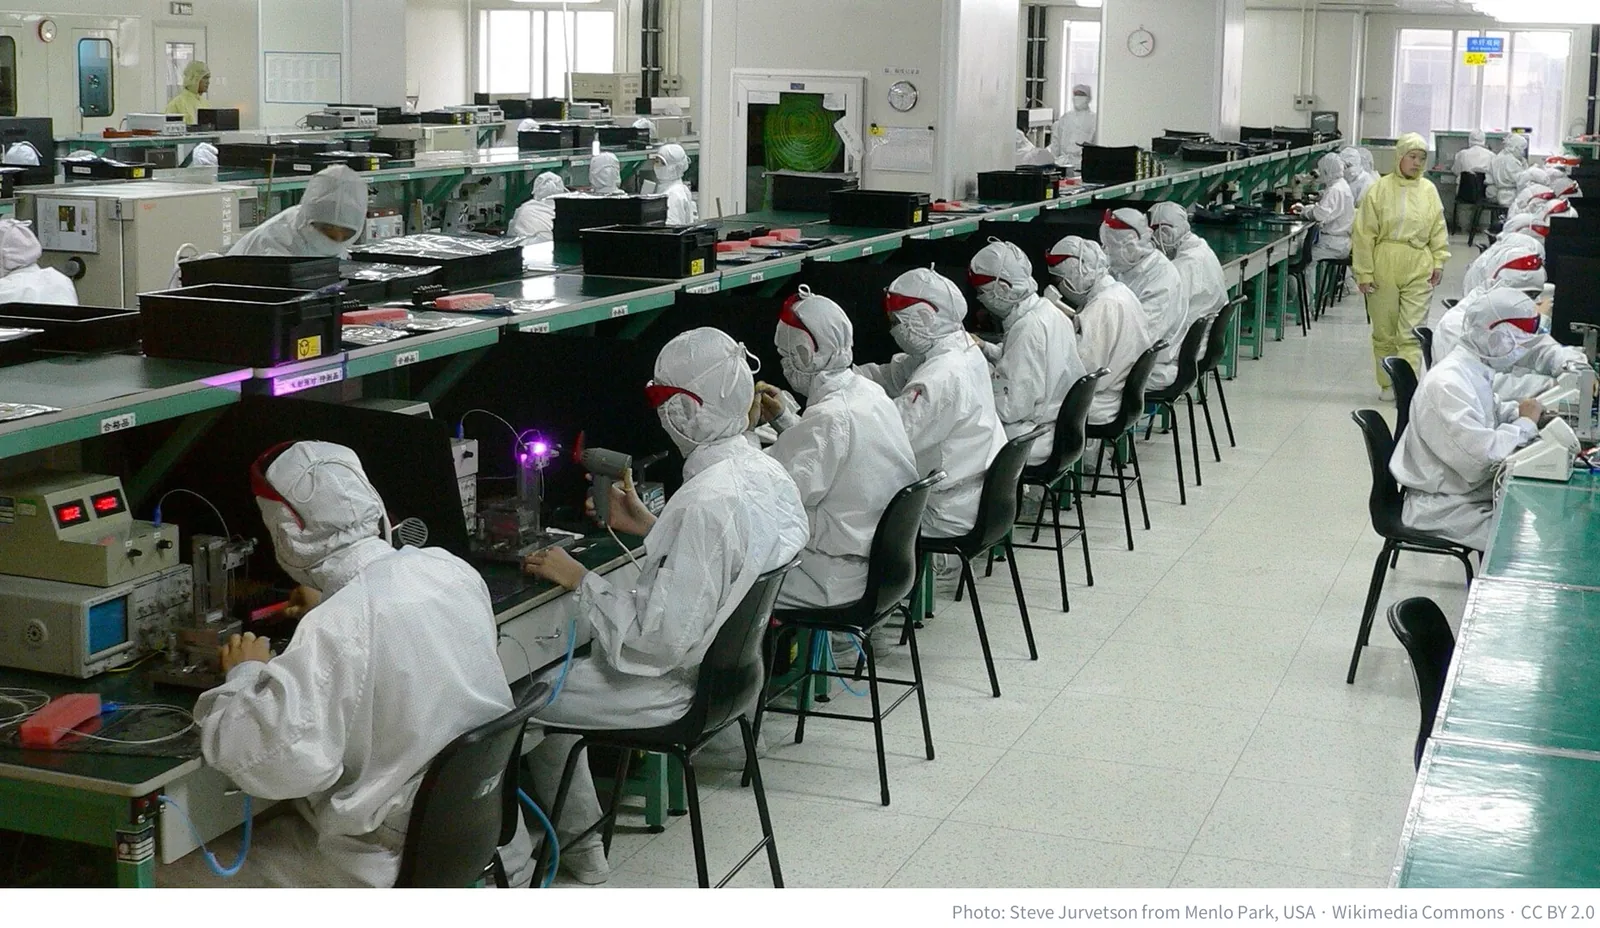
A factory like the electronics plant in Shenzhen in the photo, with rows of people assembling by hand, only makes money when labour is cheap. When wages double, the same product cannot earn the same profit. So factories like this brought in more machines, made more expensive goods, or moved to countries where labour is cheaper.
In 2023 a factory worker’s base pay was $576 in China and $273 in Vietnam
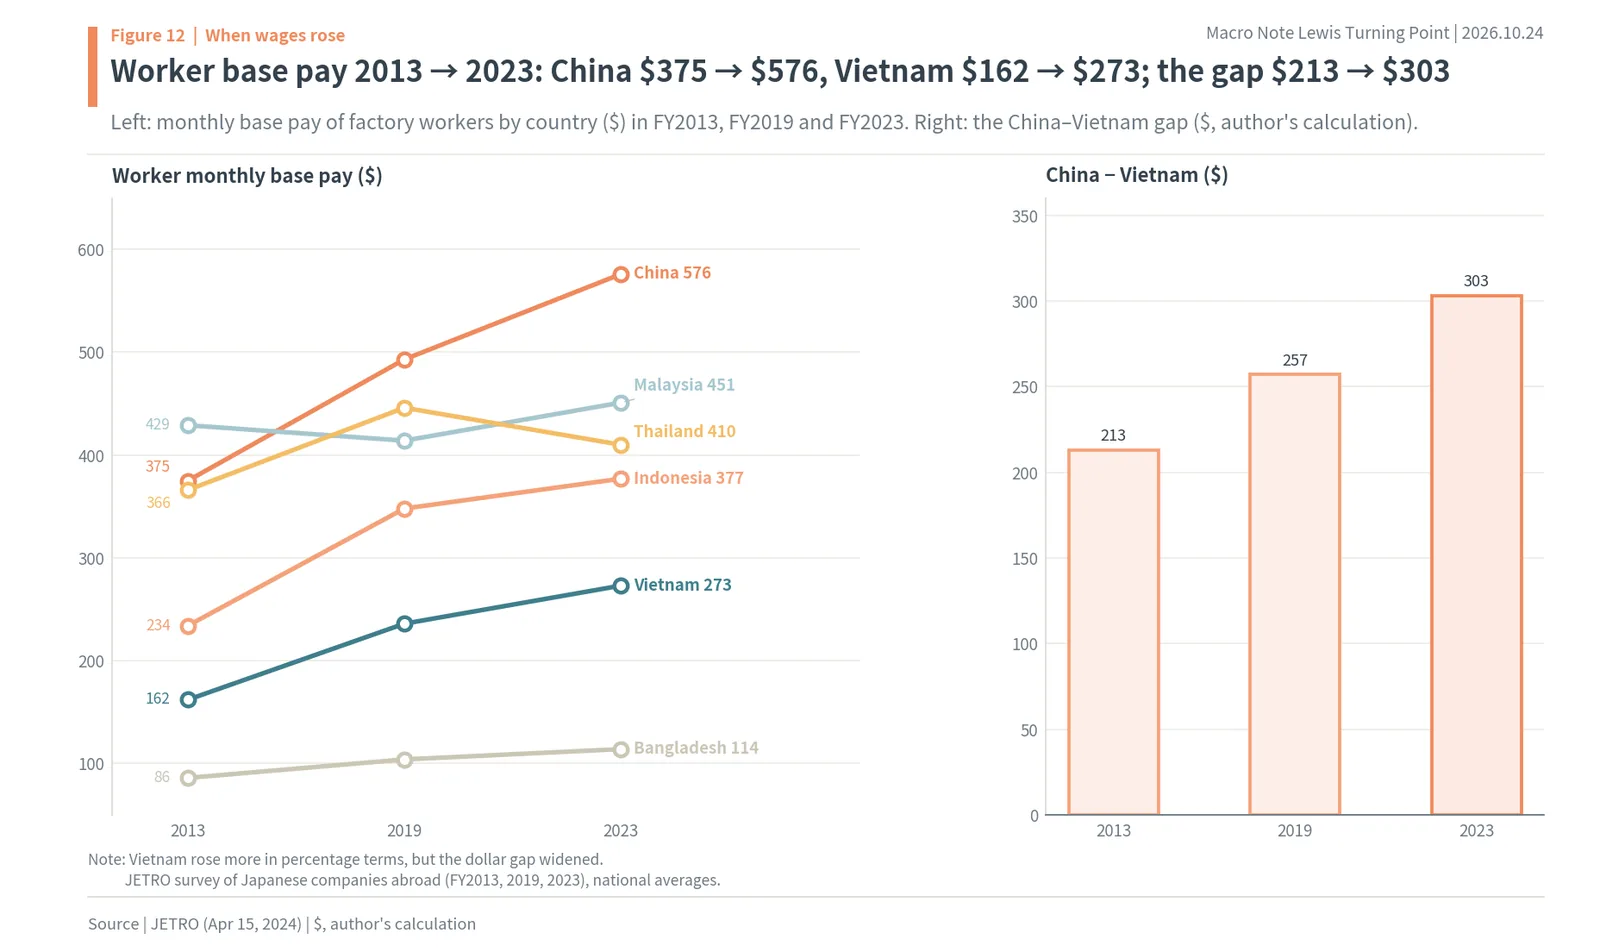
The Japan External Trade Organization (JETRO) surveys the monthly base pay of factory workers at Japanese companies operating in Asia. In its FY2023 survey China, at $576, was above Malaysia ($451), Thailand ($410), Indonesia ($377), India ($337), Vietnam ($273), the Philippines ($271), Cambodia ($257) and Bangladesh ($114). China is about 2.1 times Vietnam (author’s calculation). Ten years earlier, in FY2013, it was $375 in China and $162 in Vietnam.
Over those 10 years China rose $201 and Vietnam $111 (author’s calculation). Vietnam rose more in percentage terms, but the dollar gap actually widened, from $213 to $303. For work where wages are a large part of costs, such as clothing, shoes and electronics assembly, that gap alone is reason enough to move a factory.
Narrow it down to cities and the gap is bigger still. In the same JETRO survey for FY2022-2023, a factory worker’s monthly base pay was $832 in Shanghai, $721 in Guangzhou, $689 in Chengdu and $589 in Suzhou. It was $291 in Hanoi, $296 in Ho Chi Minh City and $506 in Bangkok. Shanghai is about 2.9 times Hanoi (author’s calculation). Even within China, the inland city of Chengdu has caught up to roughly Guangzhou’s level, which means the option of saving on wages by moving inland has also narrowed.
New Korean subsidiaries in China fell from 2,393 in 2006 to 188 in 2022
Korean companies took the same path. In the Export-Import Bank of Korea’s overseas direct investment statistics, the number of new subsidiaries Korean companies set up in China peaked at 2,393 in 2006. It fell to 834 in 2013 and 696 in 2016, and in 2022 it was 188, 92% below the peak (author’s calculation). New subsidiaries in Vietnam first overtook China in 2017, at 695 against 539, and have outnumbered China every year since. By amount, too, Vietnam ($2.66 billion) has exceeded China ($1.90 billion) since 2023. Investment in China was large in 2022, at $8.54 billion, because of a big semiconductor investment ($5.67 billion); when that semiconductor investment fell to $11 million in 2023, the total came down to $1.90 billion (Korea Institute for International Economic Policy).
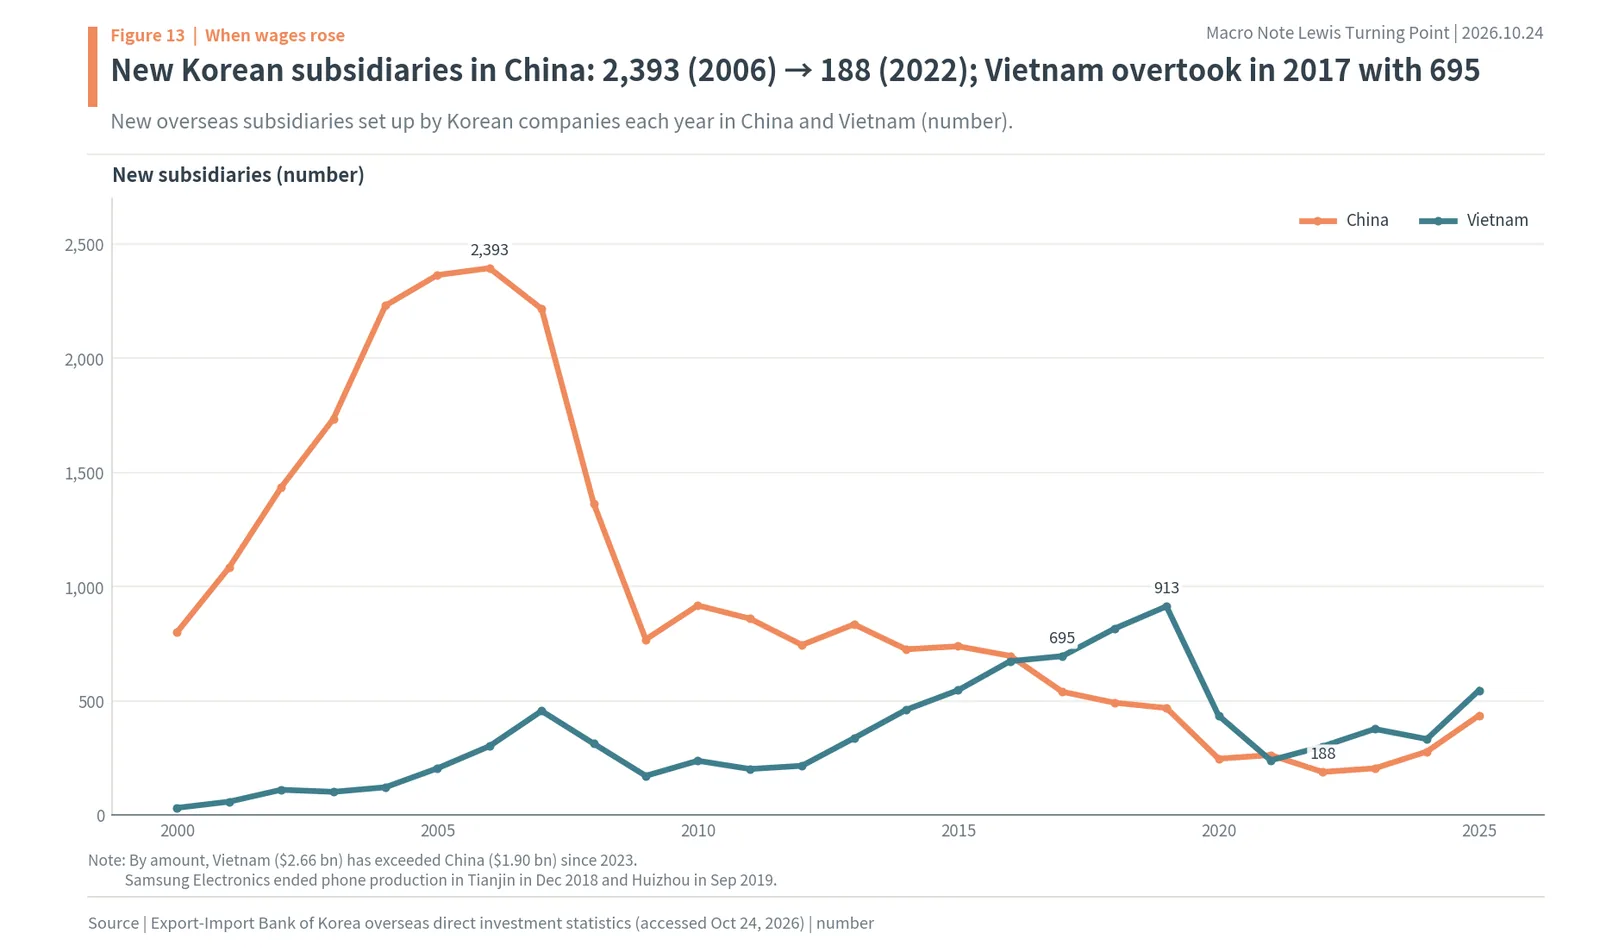
Samsung Electronics‘ phone factories are the best-known example. Samsung ended phone production at its Tianjin plant in December 2018 and its Huizhou plant in September 2019, and no longer makes phones in China. Reports at the time said production was moving to Vietnam and India, where labour costs were lower. In a China past its Lewis turning point, the factories that only pay when labour is cheap left one by one.
Money filled in for people, and the money went into property and debt
The conclusion of this chapter is that China replaced labour-driven growth with investment, that the investment piled into property and debt, and that this began to collapse after 2021. Growth has come down, the investment share rose to one of the highest levels in the world, and debt has grown by 172pp of GDP since 2008.
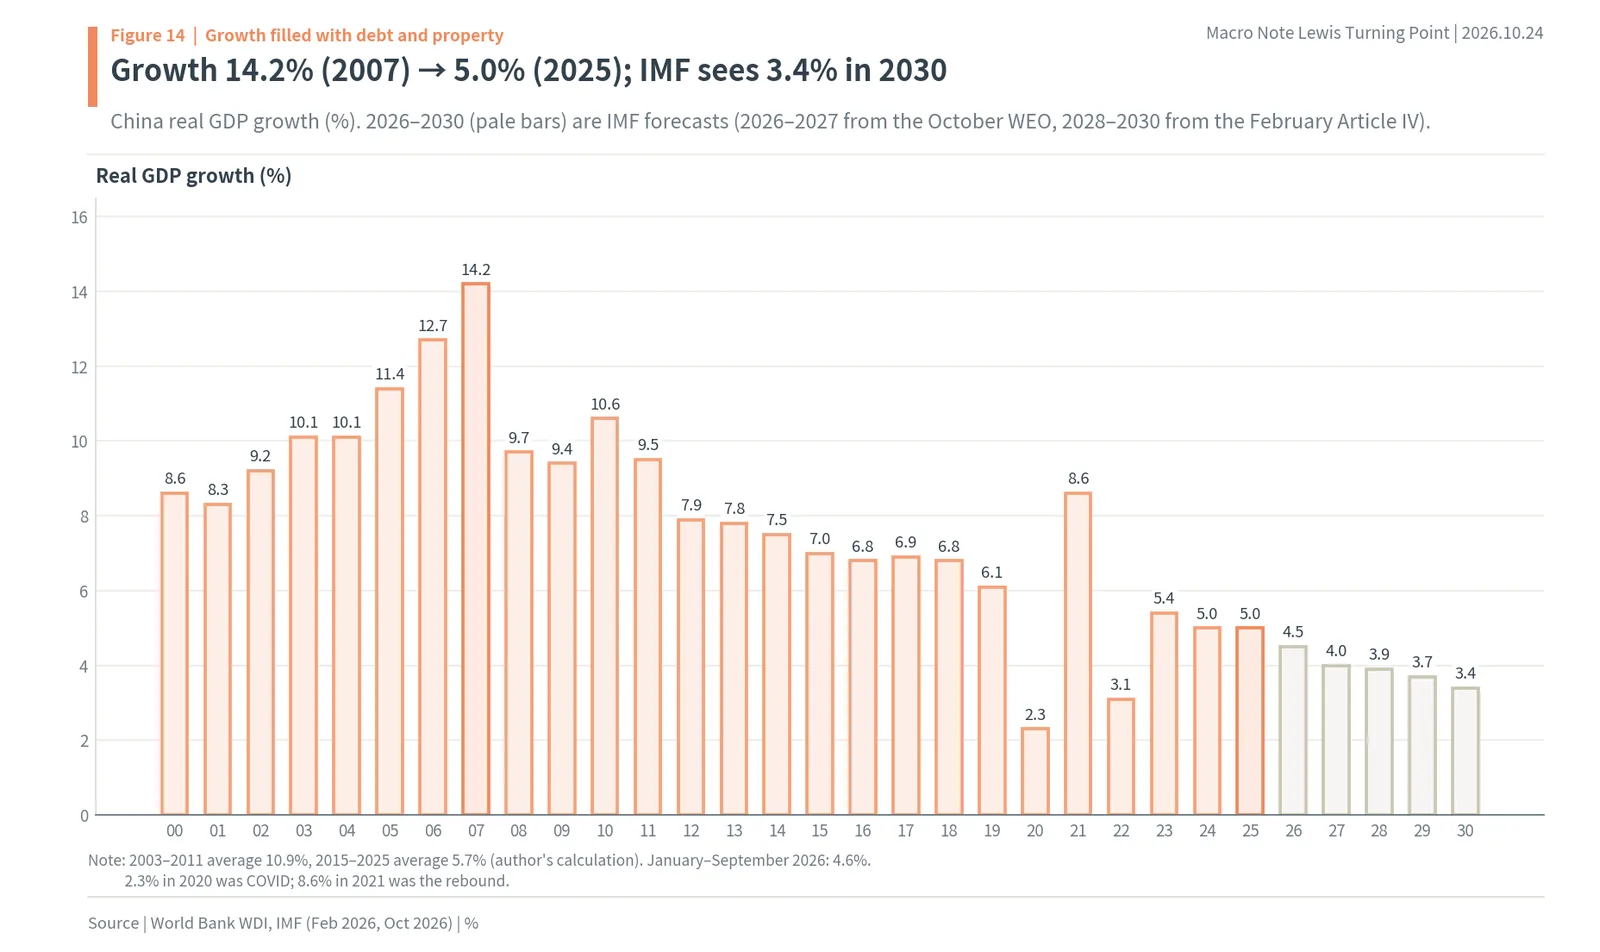
Growth fell from 14.2% in 2007 to 5.0% in 2025, and the IMF sees 3.4% in 2030
According to World Bank data, China’s real GDP growth was highest in 2007 at 14.2%. It averaged 10.9% in 2003-2011 and 5.7% in 2015-2025 (author’s calculation). Growth was 5.0% in 2025, and in 2026 it was 5.0% in the first quarter, 4.3% in the second and 4.5% in the third, or 4.6% for January-September. In its October 2026 World Economic Outlook the IMF forecast 4.5% for 2026 and 4.0% for 2027, and in its February Article IV consultation report it saw growth slowing to 3.4% by 2030.
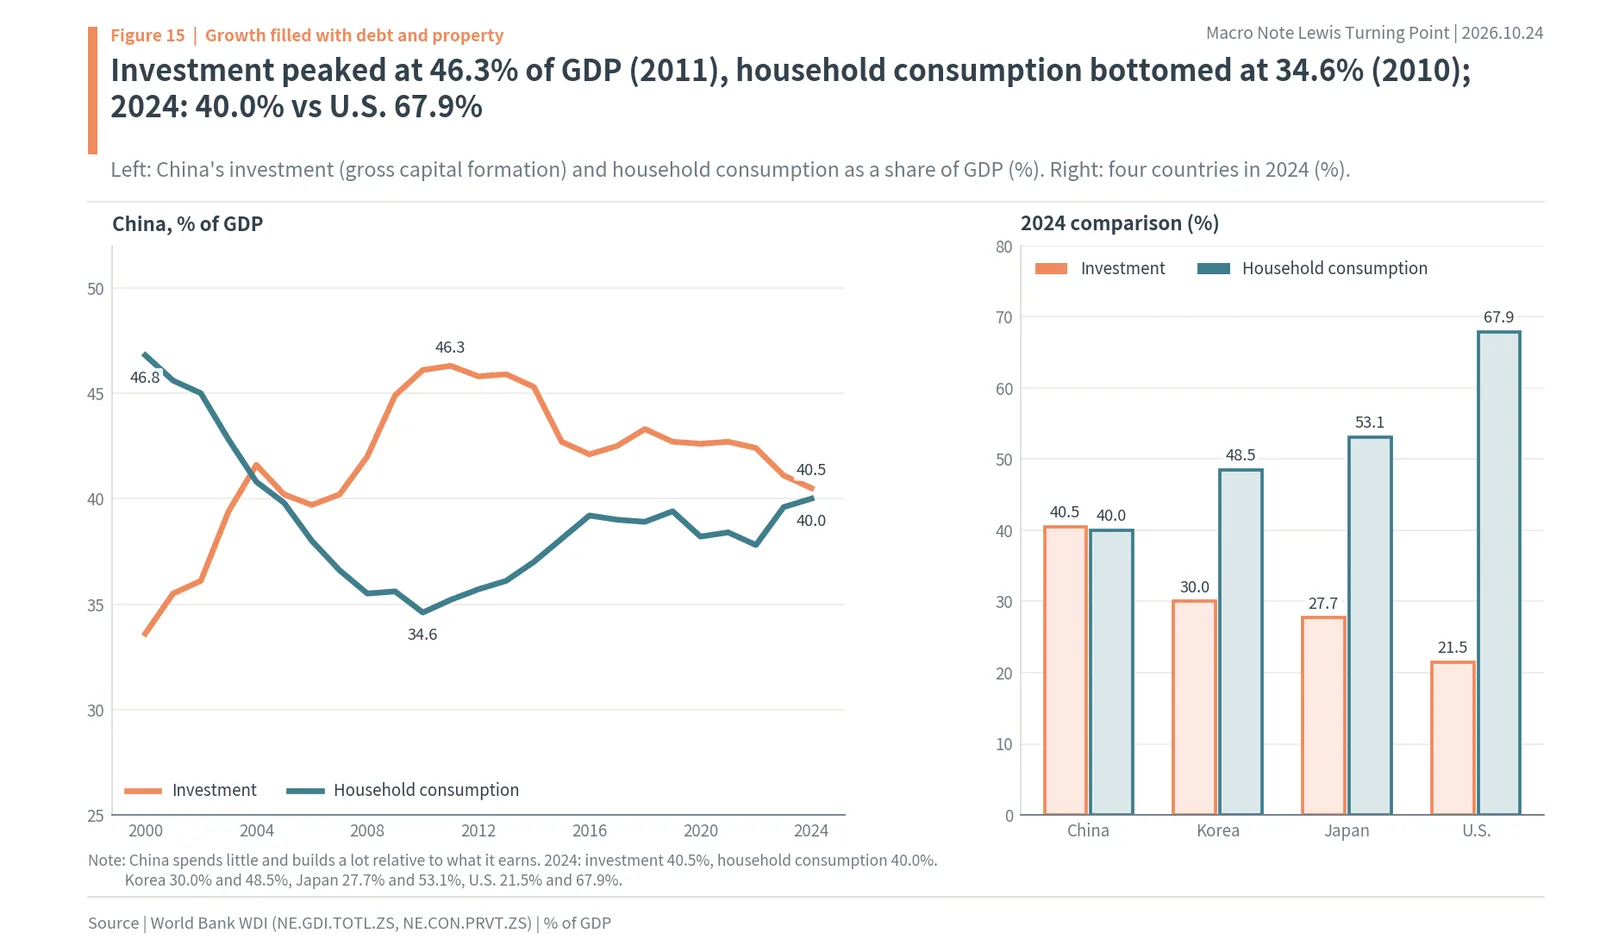
Investment rose to 46.3% of GDP, and household consumption fell to 34.6%
If labour is no longer growing and you still want to protect growth, you have to raise investment, money instead of people, building factories, roads and apartments. China’s gross capital formation, its investment share of GDP, rose from 33.6% in 2000 to 46.3% in 2011. Over the same period the household consumption share fell from 46.8% in 2000 to 34.6% in 2010. In 2024 investment was 40.5% and household consumption 40.0%. In the same year the U.S. figures were 21.5% and 67.9%, Japan’s 27.7% and 53.1%, and Korea’s 30.0% and 48.5%. China is a country that spends little and builds a lot relative to what it earns.
The author sees the hukou problem from the previous chapter as one reason household consumption is low. The 250 million people who live in cities without an urban hukou lack education, health and housing benefits, so they have strong reasons to save rather than spend what they earn. Even when labour shortages push wages up, that money does not turn into much consumption.
Signs of weak domestic demand show up in jobs too. In September 2026 the urban unemployment rate for 16-24-year-olds, excluding students, was 18.0%. Fixed-asset investment in January-September 2026 fell 7.2% from a year earlier, and 4.2% even excluding property. In its third-quarter GDP release, the NBS wrote that the problem of insufficient domestic demand remains prominent.
Property took the largest share of that money, and 2021 was the peak
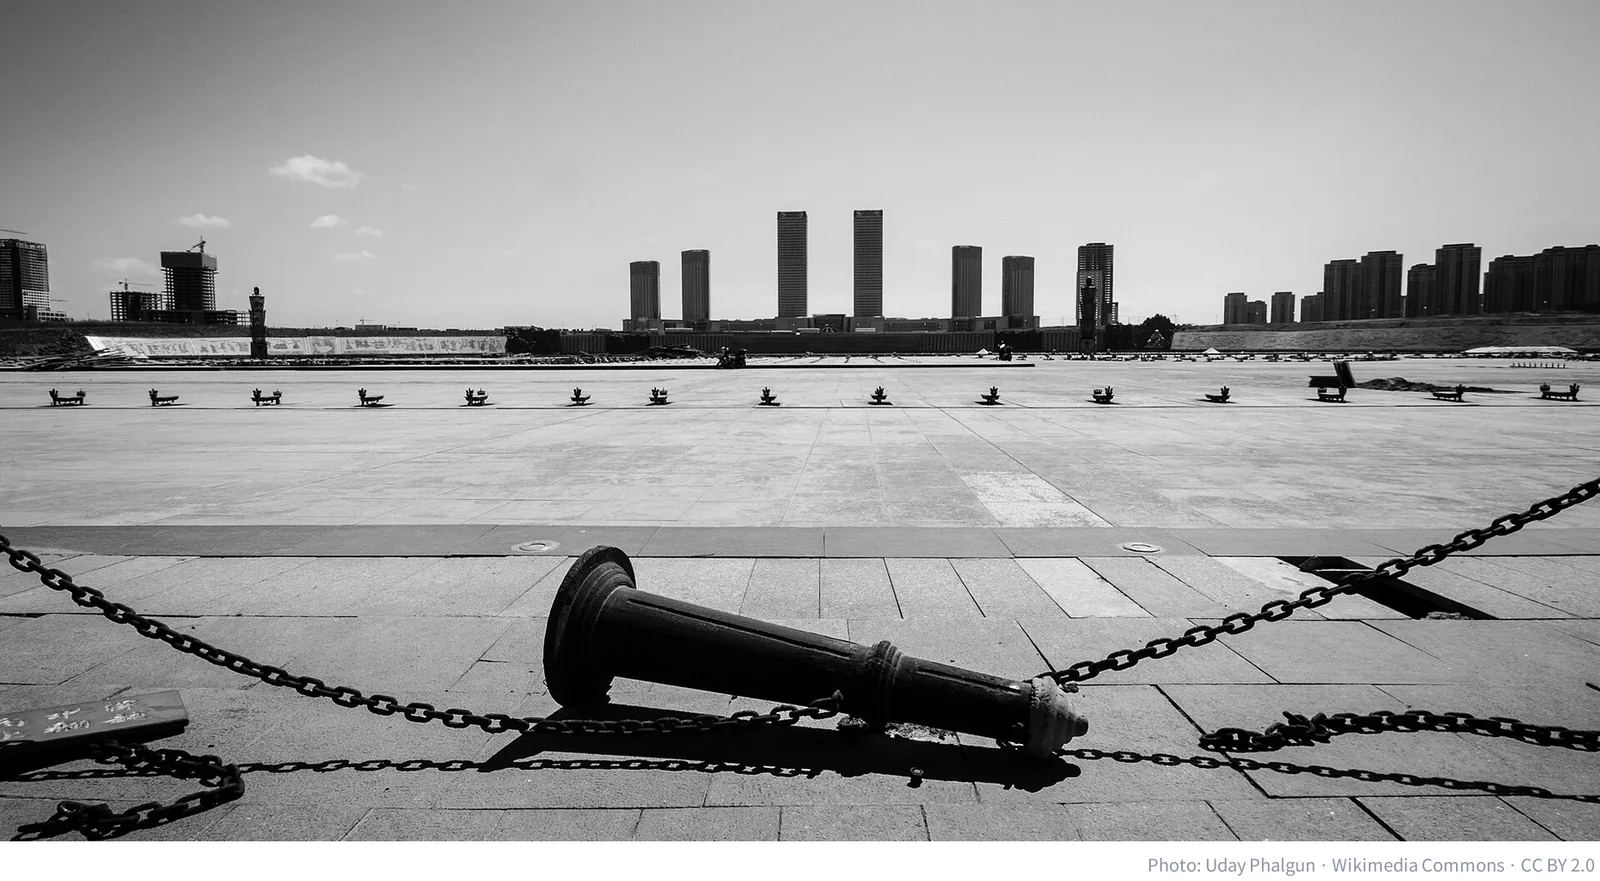
A large share of the investment went into property. In the 2010s new towns sprang up across China, such as Ordos in Inner Mongolia, where new apartments and buildings rose fast. Local governments raised money by selling land, developers borrowed to build apartments, and households put their savings into apartments.
This cycle peaked in 2021. Comparing 2021 with 2025 in NBS data, property development investment fell 43.9%, from 14.7602 trillion yuan to 8.2788 trillion yuan; floor space of new commercial buildings sold fell 50.9%, from 1,794.33 million m² to 881.01 million m²; sales value fell 53.9%; and new construction starts fell 70.5%, from 1,988.95 million m² to 587.70 million m². In January-September 2026 investment fell a further 20.6% and starts 24.9%. Prices fell too. The BIS house price index for China (2010 = 100) dropped 21.9% from 145.9 in the third quarter of 2021 to 114.0 in the first quarter of 2026 (author’s calculation).
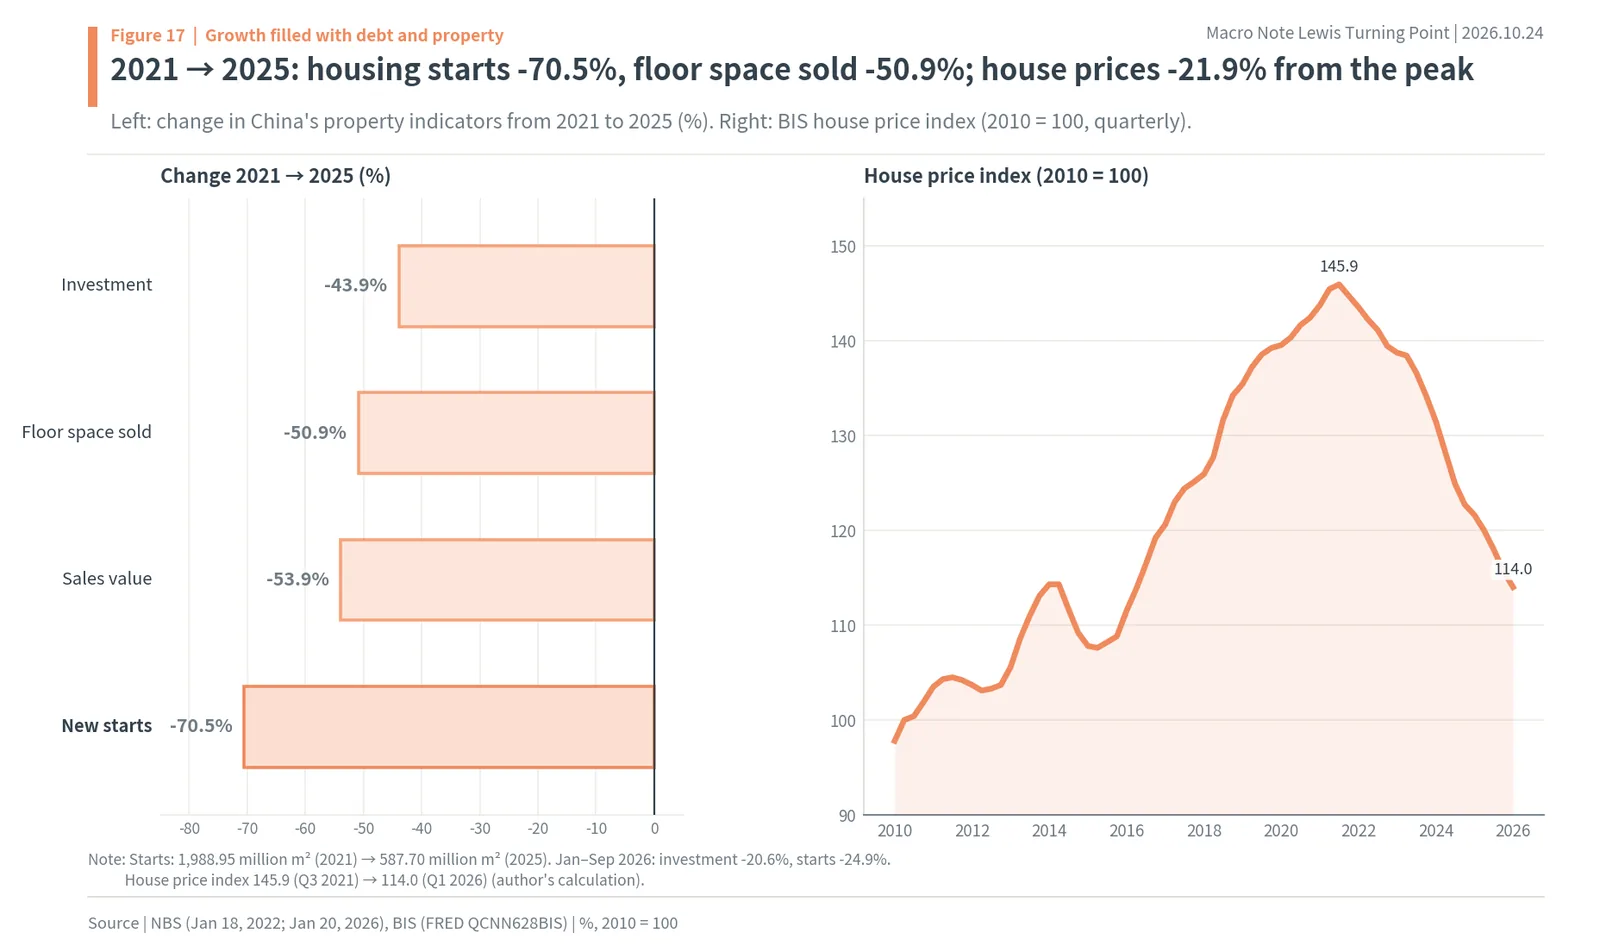
The decline did not end in one year; it went on year after year. Property development investment went from 11.0913 trillion yuan in 2023 to 10.0280 trillion yuan in 2024 and 8.2788 trillion yuan in 2025. Construction starts fell every year, from 953.76 million m² in 2023 to 738.93 million m² in 2024 and 587.70 million m² in 2025. Floor space sold was 1,117.35 million m² in 2023, 973.85 million m² in 2024 and 881.01 million m² in 2025. Starts falling faster than sales means developers are focused on selling what they have already built rather than building new apartments. Domestic demand for the things used to build new apartments, such as rebar, cement, glass and home appliances, shrank by as much.
Debt grew from 133.0% to 305.2% of GDP
The money behind the investment was debt. According to BIS statistics, China’s non-financial debt, the combined debt of households, companies and government, was 133.0% of GDP at the end of 2008. It passed 227.6% at the end of 2015 and 254.7% at the end of 2021, and reached 305.2% in the first quarter of 2026. That is an increase of 172.2pp of GDP in 18 years (author’s calculation). In the first quarter of 2026, corporate debt was 146.6%, government 101.1% and household 57.5%. At the same time Japan was at 349.4%, the U.S. 250.5%, the euro area 239.1% and Korea 236.4%. China is second only to Japan and above the U.S. and the euro area.
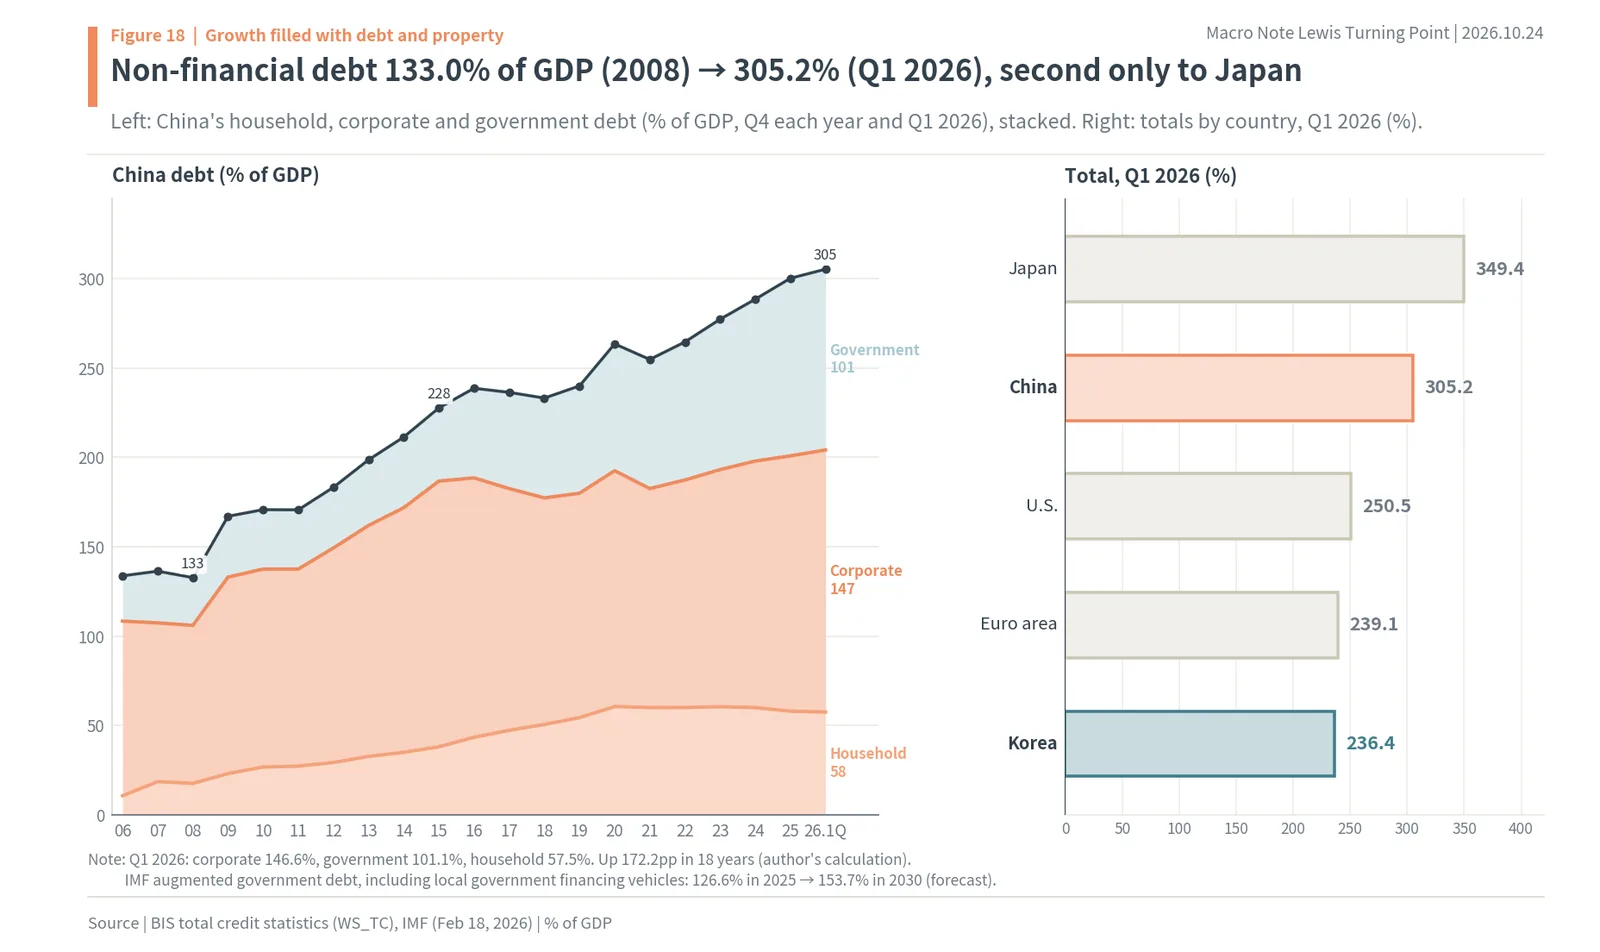
Government debt is bigger than the official figure. The IMF’s augmented government debt, which adds the debt of local government financing vehicles (LGFVs), the investment companies set up by local governments, was 126.6% of GDP in 2025, and the IMF expects it to rise to 153.7% by 2030. As property turned down, the route by which local governments repaid debt by selling land also narrowed. On this augmented basis, the IMF put the government deficit at around 14% of GDP in 2025 and 2026, and advised that the unsustainable debts of LGFVs be resolved through insolvency procedures. Unsold floor space of new commercial buildings at the end of 2025 was 766.32 million m², up 1.6% from a year earlier. The money poured in instead of people is now left as debt to repay and buildings no one is buying.
Factory output that could not be sold at home was pushed into exports
The conclusion of this chapter is that when property turned down and domestic demand stayed weak, the output of the factories built over the years poured into exports. The trade surplus rose 2.8 times in six years and topped $1 trillion for the first time, steel exports hit a record, and factory-gate prices were lower than a year earlier for 41 months in a row. Labour got more expensive, yet goods came out cheaper.
The trade surplus went from $423 billion in 2019 to $1,189 billion in 2025
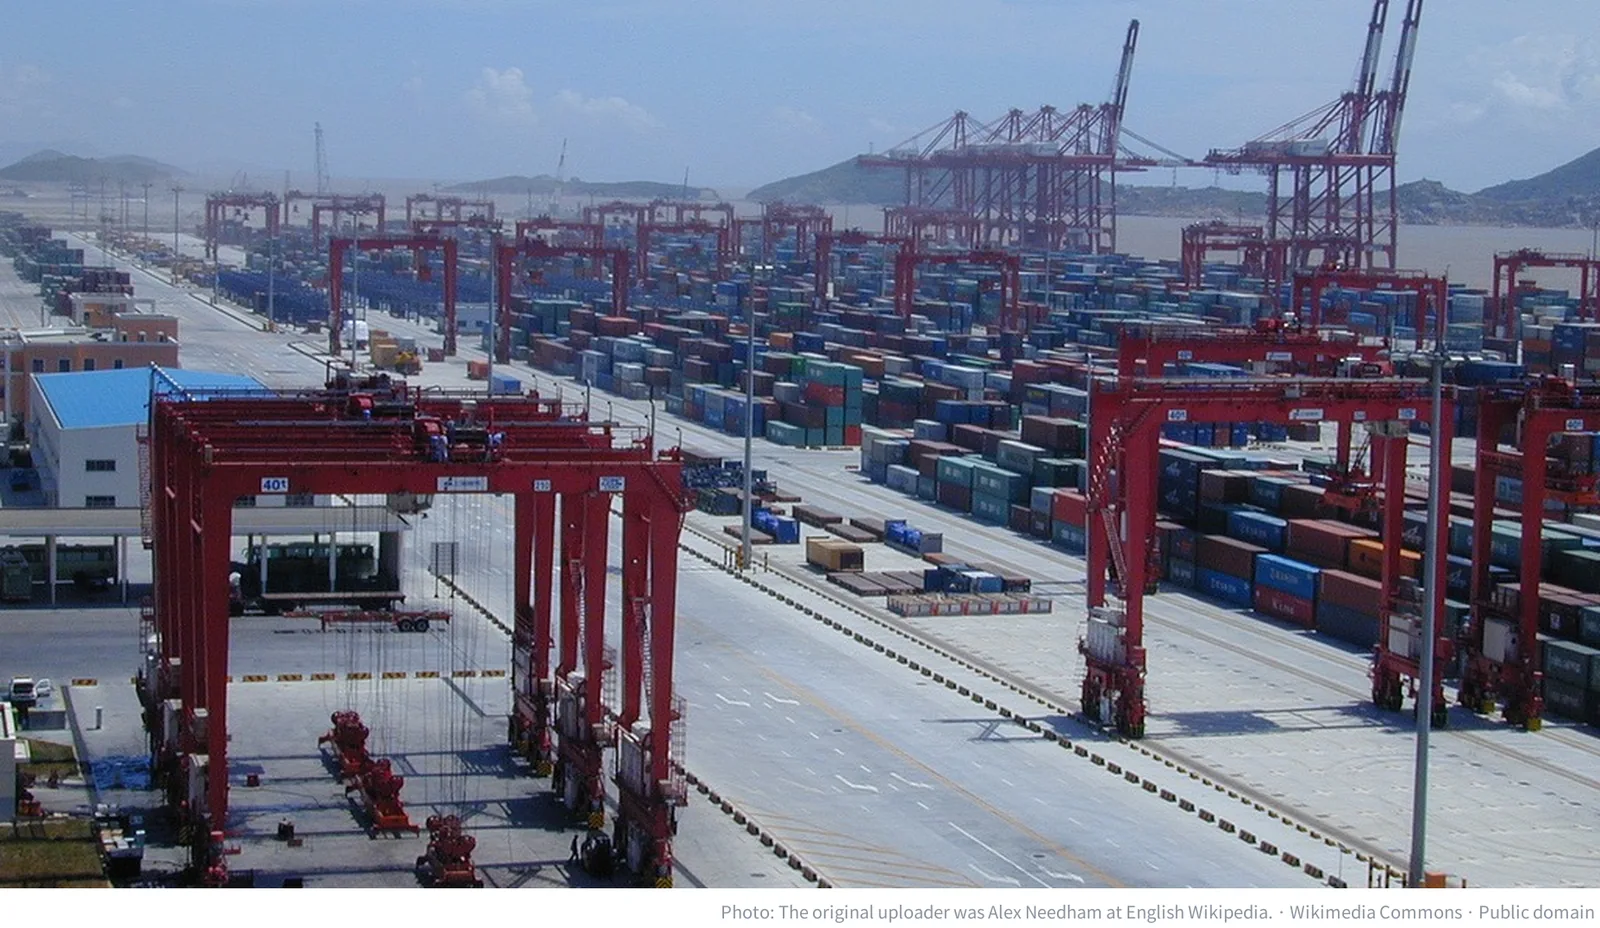
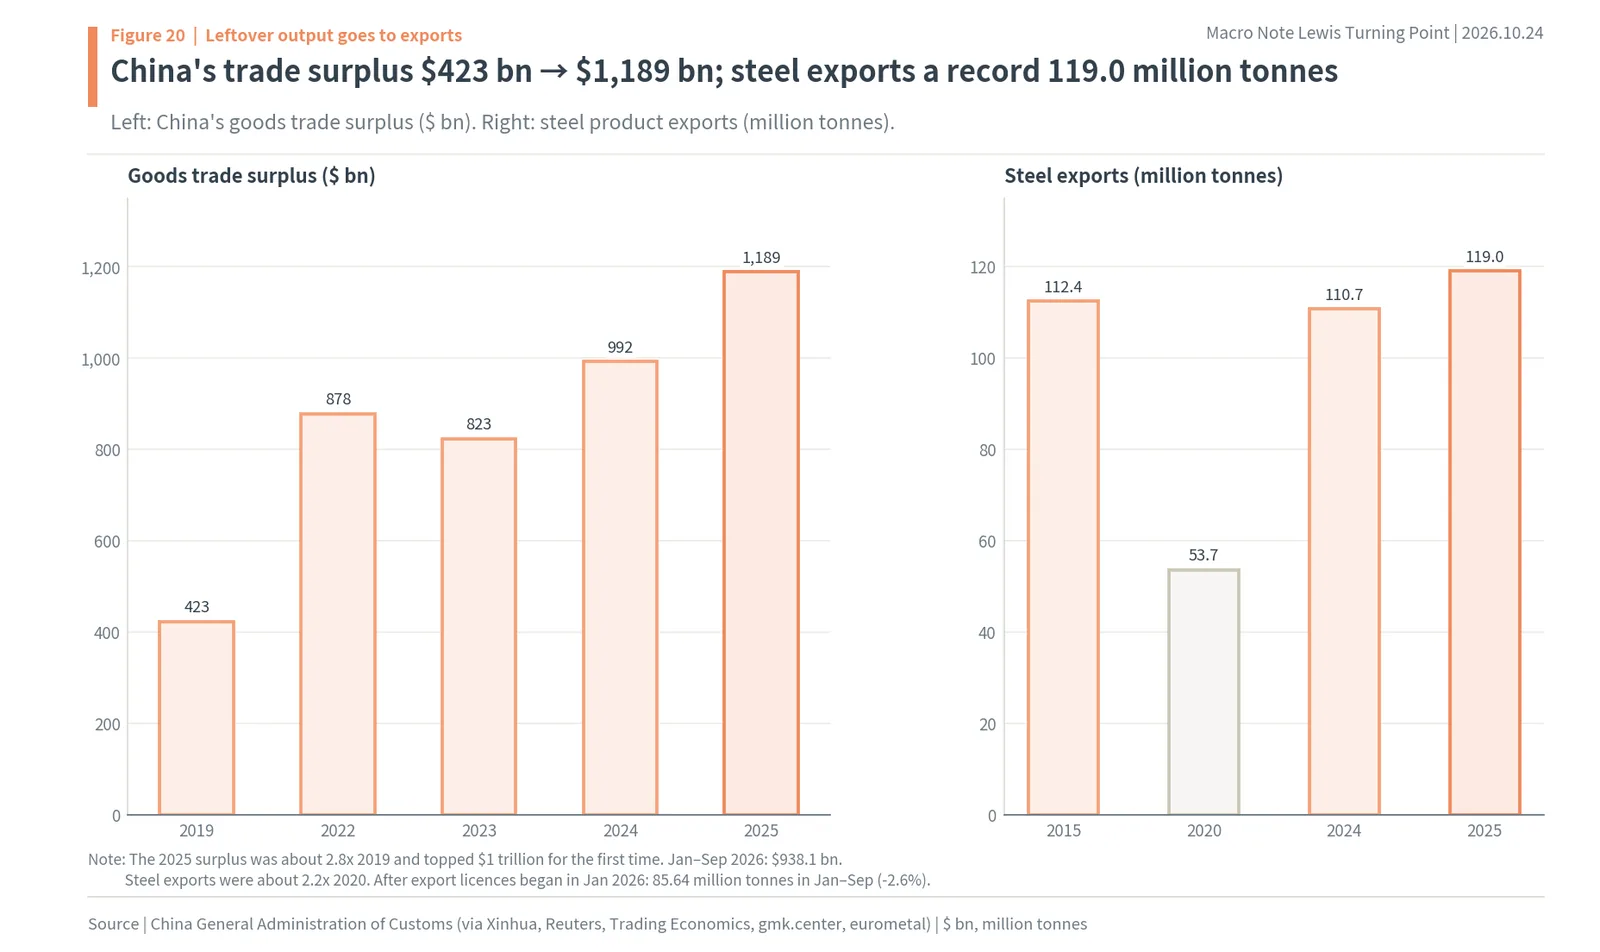
According to China’s General Administration of Customs, China’s goods trade surplus was about $423 billion in 2019. It passed $877.6 billion in 2022, $823.0 billion in 2023 and $992.1 billion in 2024, and in 2025 reached $1,189 billion ($1.189 trillion), topping $1 trillion for the first time. That is about 2.8 times 2019 (author’s calculation). Exports in 2025 were $3.77 trillion, while imports were flat at $2.58 trillion. In 2026 the January-September surplus was $938.1 billion, and the September surplus alone was $133.5 billion. In 2023 exports fell 4.6% to $3.38 trillion, the first fall since 2016, but in 2024 they rose 5.9% to $3.58 trillion and grew again. In 2025 exports to the U.S. fell about 20%, yet the overall surplus was a record, meaning more goods went to other countries instead of the U.S. While containers were stacked and shipped out of big ports such as Shanghai’s Yangshan port, what came in did not grow to match.
Steel is the clearest case. China’s exports of steel products peaked at 112.40 million tonnes in 2015, then fell to 53.67 million tonnes in 2020. After property turned down they rose again, to 110.72 million tonnes in 2024 and a record 119.02 million tonnes (119.0 million) in 2025, about 2.2 times 2020 (author’s calculation). Steel that used to go into homes and bridges lost its market and crossed the sea. Exports in December 2025 alone were 11.30 million tonnes, a monthly record, because shipments were rushed out before an export licence system took effect in January 2026. The licence system covers about 300 tariff lines. With the system in place from 2026, January-September exports were 85.64 million tonnes, down 2.6%.
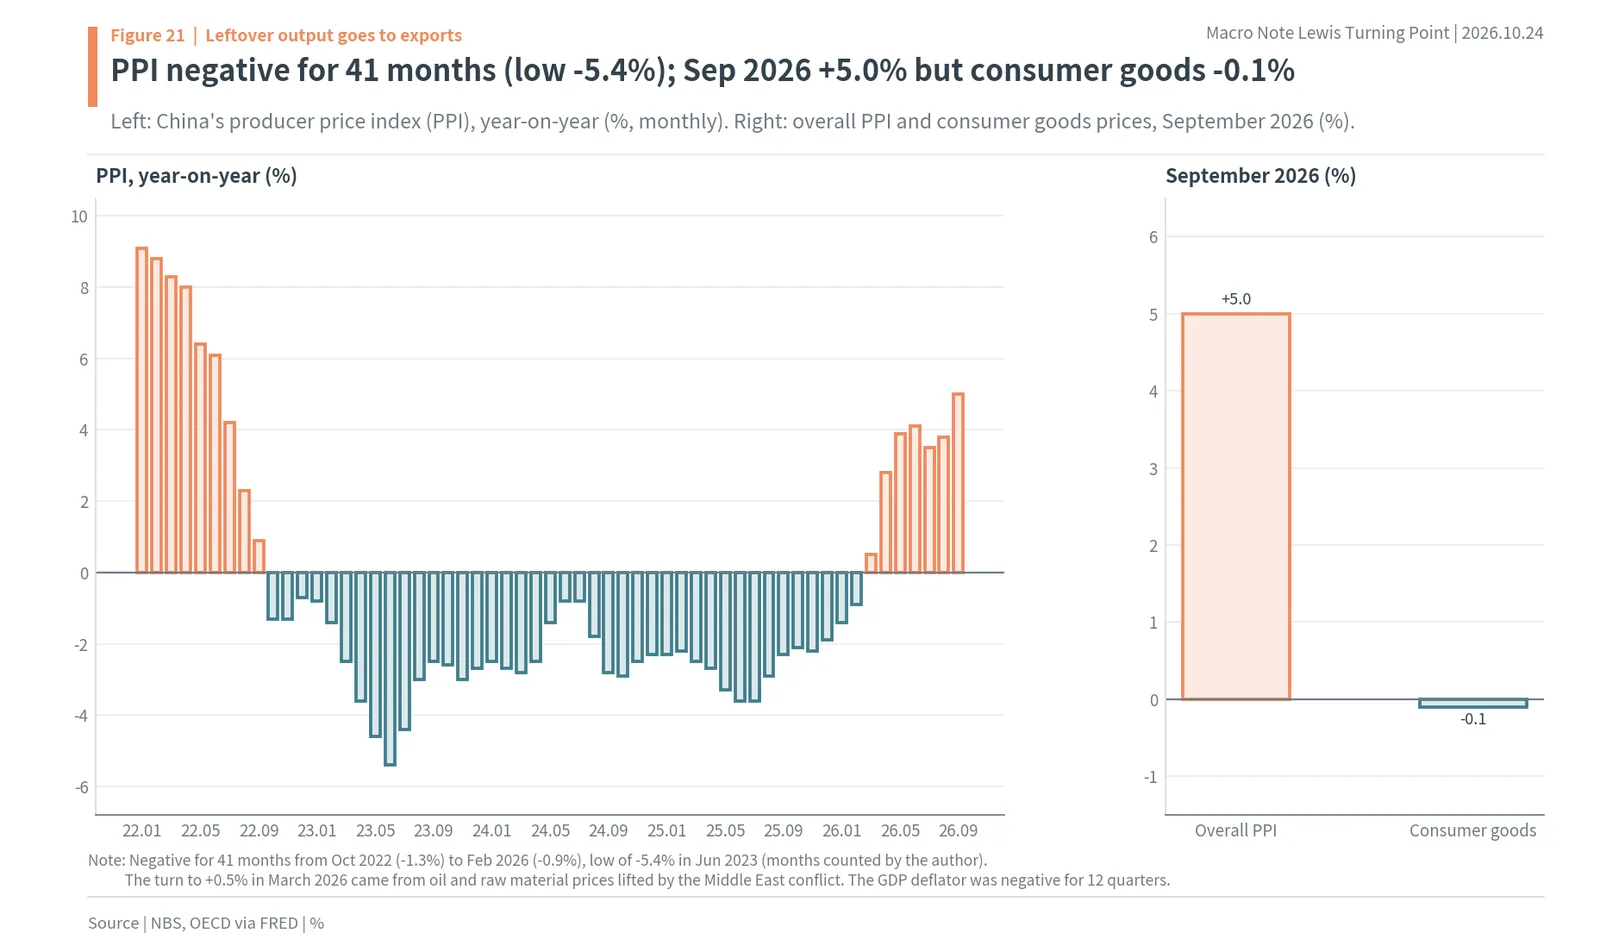
Factory-gate prices were below the year before for 41 months from October 2022
Exporting more did not mean getting a good price. Factory-gate prices, the producer price index (PPI), fell 1.3% from a year earlier in October 2022 and stayed negative for 41 months in a row through February 2026 (author’s calculation). The low point was -5.4% in June 2023. The GDP deflator, which tracks prices across the whole economy, was also negative for 12 quarters in a row from the second quarter of 2023 to the first quarter of 2026. Rhodium Group calculated that China’s export prices fell 5% for machinery, 8% for vehicles and 10% for electrical equipment in 2022-2024.
The numbers look different in 2026. Oil and raw material prices jumped with the Middle East conflict, and the PPI turned positive at +0.5% in March and reached +5.0% in September. But in that same September, consumer goods prices were 0.1% lower than a year earlier. The rise in raw materials such as crude oil and metals simply sat on top; prices of the finished goods factories make are still not rising. The author reads this year’s positive PPI not as a sign that deflation is over but as something that oil prices are hiding.
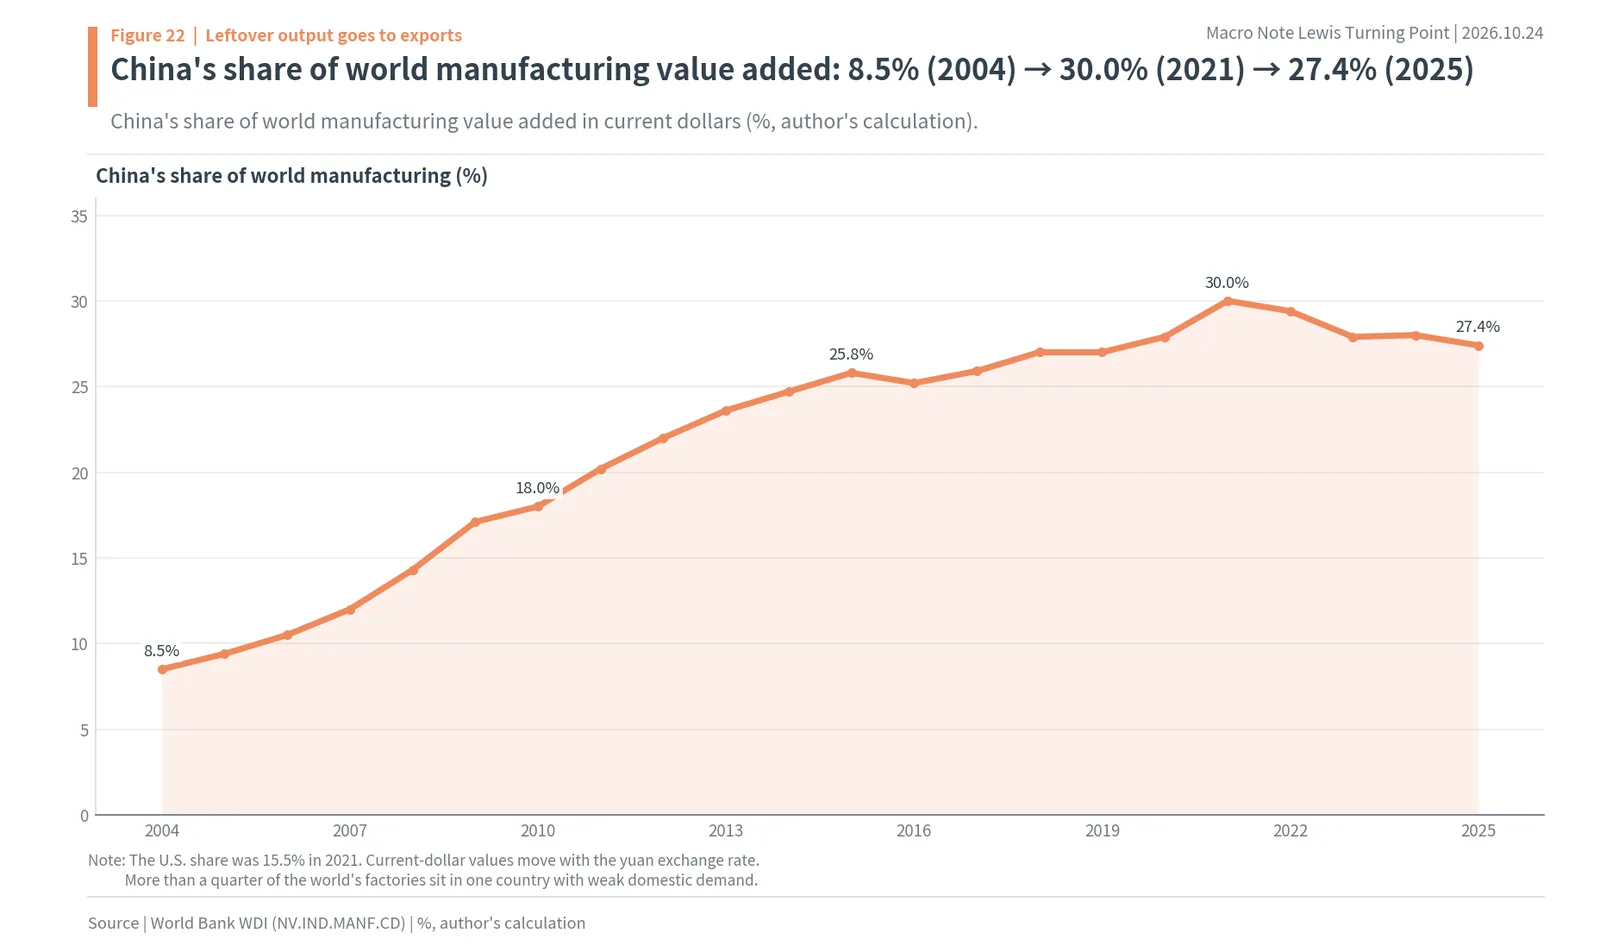
China’s share of world manufacturing value added rose from 8.5% to 30.0%
The factories producing this output are the biggest in the world. In World Bank data, China’s share of world manufacturing value added (in current dollars) rose from 8.5% in 2004 to 18.0% in 2010 and 25.8% in 2015, and peaked at 30.0% in 2021. In 2025 it was 27.4% (author’s calculation). The U.S. share in 2021 was 15.5%. With almost a third of the world’s factories in one country with weak domestic demand, goods that cannot be sold in that country have to go somewhere.
Rhodium Group expects this to continue. Its outlook is that China’s export prices will fall about 5% a year until 2030, that China’s share of world export volumes will rise from 20% in 2025 to 28% in 2030, and that China’s export volumes will grow about 50% from 2025 to 2030. In September 2026, too, China’s exports in dollar terms rose 36.3% from a year earlier.
This is where China’s road after the Lewis turning point has led. Cheap labour is over; cheap goods are not. The equipment and debt piled up in place of people, together with weak domestic demand, keep pushing goods out cheaply.
Japan and Korea walked this road first, and China is walking it with a far bigger body
The conclusion of this chapter is that the Lewis turning point is not unique to China. Japan passed it around 1960 and Korea around 1975. In both countries wages rose after the turning point, labour-intensive industries moved to neighbouring countries, and the gap was filled with more expensive products and more capital.
Japan passed the turning point around 1960, Korea around 1975
The Japanese economist Ryoshin Minami put Japan’s Lewis turning point around 1960. In Korea, Professor Bai Moo-ki concluded in a 1982 paper that the Korean economy passed its turning point around 1975. The same paper noted that Japan and Taiwan had already passed theirs in the 1960s, and that Korea’s share of employment in farming, forestry and fishing fell from 65.9% in 1960 to 35.8% in 1979. For China, the turning point is Cai Fang’s 2004, or the IMF’s 2020-2025.
What comes after the turning point is the peak of the working-age population. In World Bank data, Japan’s population aged 15-64 peaked at 87.46 million in 1995 and was 72.50 million in 2025. Japan took about 35 years to go from its turning point to that peak, and over that time its 15-64 population grew 45.6% from the turning-point level (author’s calculation). Korea took 43 years, from its 1975 turning point to its 2018 peak, and grew 84.0% in between. China took 11 years from its 2004 turning-point signal to the 2015 peak of its 15-64 population, growing only 7.3% in between. The next figure sets the 15-64 population in the turning-point year at 100 and plots it for each year after. The lines for Japan and Korea rise for decades; China’s flattens almost at once.
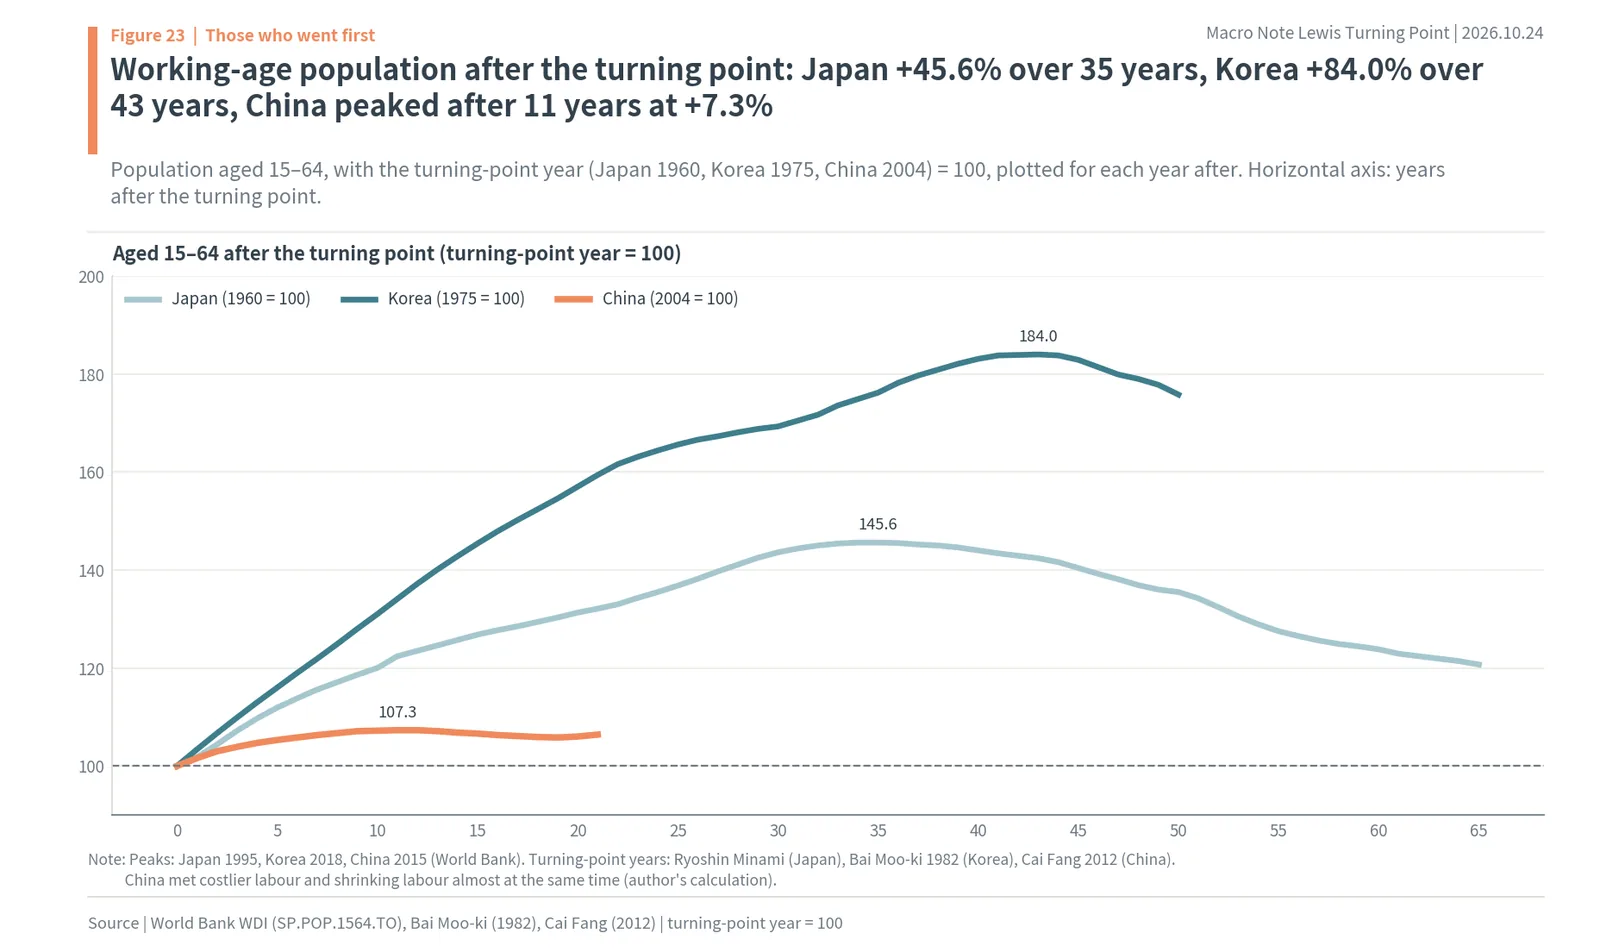
Japan’s 15-64 population fell from 87.46 million to 72.50 million in the 30 years after its peak. Over those 30 years Japan went through a long period in which house prices and share prices were held down, and government debt rose. On the BIS measure, Japan’s government debt rose from 146.7% of GDP at the end of 2008 to 222.0% at the end of 2021, and stood at 175.6% in the first quarter of 2026. In a country where the number of workers is shrinking, protecting growth meant the government had to borrow to support demand.
Japan and Korea, after passing the turning point, still bought themselves decades during which the number of workers kept growing. In that time they could move toward more expensive products to match the rise in wages. China has met the moment when labour becomes expensive and the moment when labour starts to shrink almost at the same time.
The difference is size and debt
When Japan and Korea passed their turning points, their factory output was not large relative to the world market. China is going through this phase while holding more than a quarter of world manufacturing value added. So what happens inside China, property turning down and weak demand pushing output abroad, immediately affects world goods prices and neighbouring countries’ factories.
The size of the debt is also different. As the previous chapter showed, China’s non-financial debt is 305.2% of GDP, second only to Japan’s 349.4%. Japan spent a long time reducing debt after its property market collapsed in the 1990s. China, too, has seen construction starts fall 70.5% since the 2021 property peak, and its local governments’ debt burden is growing. In both countries, growth filled in with investment and debt after the labour story ended has run into the same wall.
Korea moved its factories abroad back then, too
Korean companies also moved factories abroad in search of cheap labour. The peak of 2,393 new Korean subsidiaries in China in 2006, seen in the direct investment statistics earlier, was the result of a wave of companies escaping the higher wages that followed Korea’s own turning point, meeting China’s opening. Now that China has passed the same point, Korean companies are moving again, to Vietnam. The chain of factories following cheap labour has moved one more link south.
In Korea, sectors that overlap with China lose ground and sectors China cannot yet make hold up
The conclusion of this chapter is that China’s Lewis turning point has drawn a line through the Korean stock market by sector. Petrochemicals, steel, cosmetics and finished cars, which make the same things China makes, are pushed back by Chinese output, while memory chips, which China still cannot make in sufficient volume, benefit from Chinese demand. Share prices since the first trading day of 2018 show this line plainly.
How this works in Korea: the market, the data and the units
Korean stocks trade on the Korea Exchange (KRX). The KOSPI is the main board index, home to the large exporters discussed here, such as Samsung Electronics (005930.KS), SK hynix (000660.KS), LG Chem (051910.KS), Lotte Chemical (011170.KS), POSCO Holdings (005490.KS), Hyundai Steel (004020.KS) and Amorepacific (090430.KS); the KOSDAQ is the smaller, growth-oriented market. Korea is one of the few major economies that publishes its export figures on the first day of every month for the month just ended, through the Ministry of Trade, Industry and Resources, with a breakdown by product and by destination, so the effect of Chinese competition on Korean factories shows up in the data within days. Korean company results are usually reported in units of 100 million won (“eok won”); in this report they are shown as KRW billion with dollar equivalents. Because Korean exports to China are mostly parts and materials rather than consumer goods, Korea’s trade with China tells you as much about the state of Chinese factories as about Chinese consumers.
China’s share of Korean exports fell from 26.8% in 2018 to 18.4% in 2025
In Korean customs data published in UN Comtrade, China’s share of Korea’s exports rose from 10.7% in 2000 to a peak of 26.8% in 2018. It then fell to 19.7% in 2023 and 18.4% in 2025. Korea’s trade surplus with China was largest at $62.8 billion in 2013, shrank to $1.2 billion in 2022, and in 2023 turned into a deficit of $18.2 billion, the first deficit since diplomatic ties were established in 1992. The deficit was $7.0 billion in 2024 and $11.2 billion in 2025.
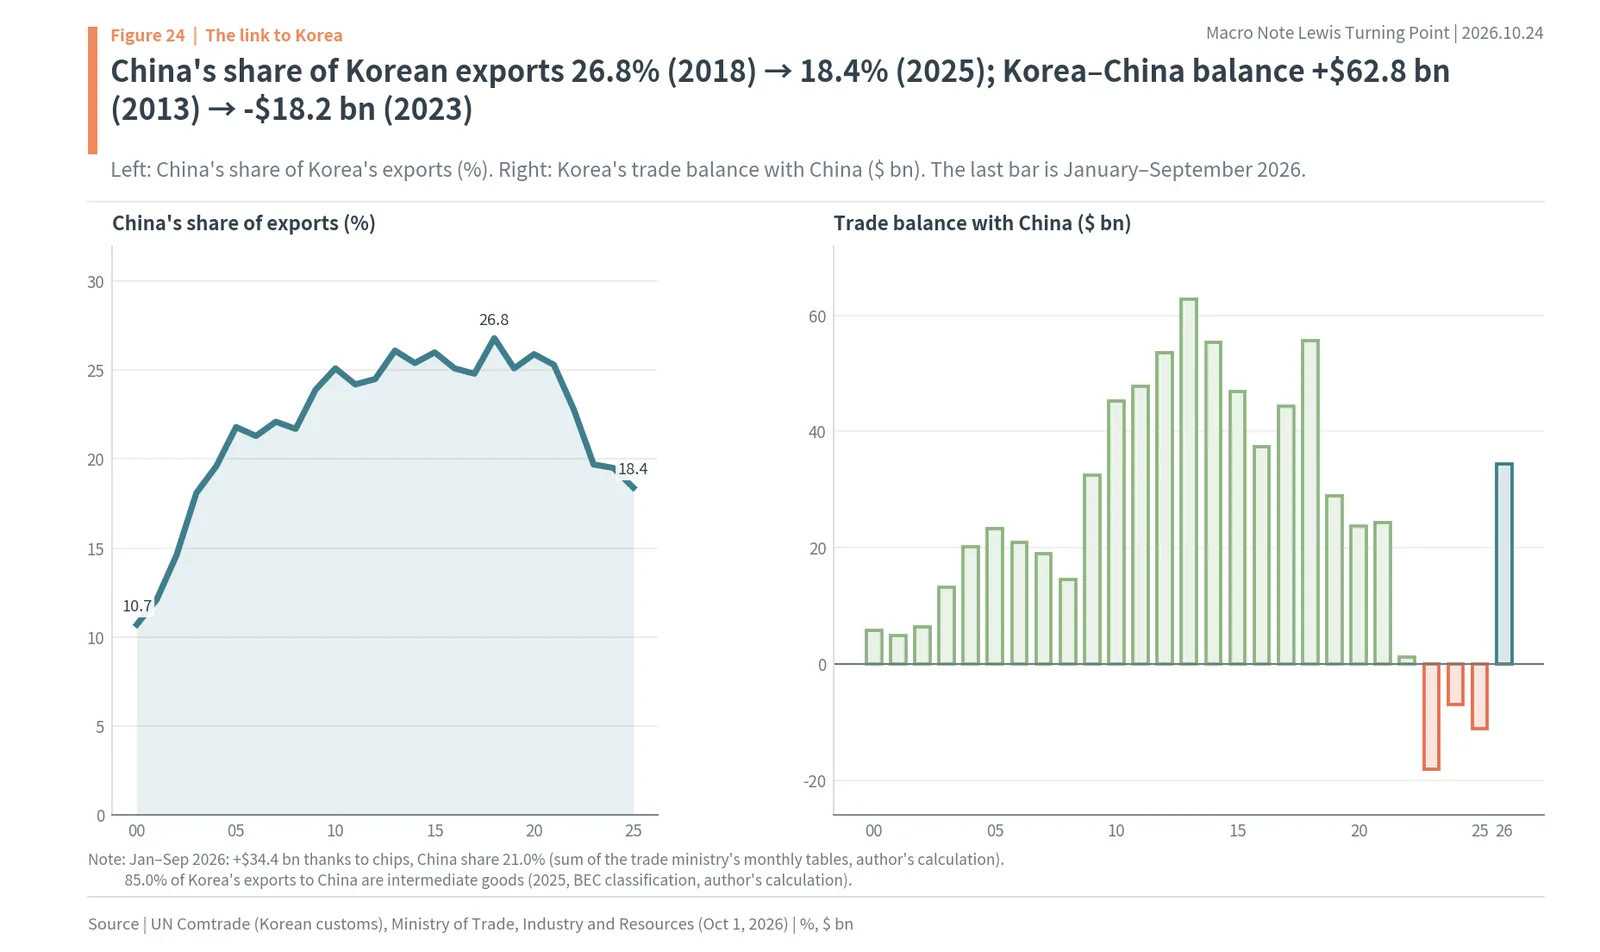
2026 has been different. Adding up the trade ministry’s data, Korea’s January-September exports to China were $171.4 billion, the trade balance with China was a surplus of $34.4 billion, and China’s share of exports rose back to 21.0% (author’s calculation). September exports to China were $26.01 billion, up 122.7% from a year earlier, thanks to a 320.5% rise in chip exports to China over September 1-25. In the same month petrochemical exports fell 19.1% in volume even though unit prices rose 30.0%. Leave out chips, and exports of commodity materials to China are still falling. The trade ministry’s review of 2025 exports and imports also said exports to China fell despite strong chips, because of weak petrochemicals and steel.
Month by month, the speed of the turn to surplus is visible. The balance with China went from a deficit of $0.8 billion in December 2025 to a surplus of $0.3 billion in January 2026, then to surpluses of $2.6 billion in March, $3.8 billion in May, $5.4 billion in July, $8.8 billion in August and $6.7 billion in September. Meanwhile China’s share of Korea’s imports actually rose, from 8.0% in 2000 to 22.5% in 2025 and 24.4% in January-September 2026. Korea is selling China more chips and buying more goods from China.
85.0% of Korea’s exports to China are intermediate goods (2025, author’s calculation using the UN Comtrade BEC classification), up from 67.4% in 2010. That means Korean exports fall right away when Chinese factories run less, or when China starts making parts and materials itself.
Petrochemicals: Chinese ethylene capacity of 60 million tonnes, while Korea cuts 2.7-3.7 million tonnes
ChemOrbis estimated China’s capacity for ethylene, the basic building block of petrochemicals, at close to about 60 million tonnes in 2025, rising to about 86 million tonnes in 2030. Output China could not use at home flowed into Northeast Asian markets. On August 20, 2025, ten Korean petrochemical companies signed a restructuring agreement to cut 2.7-3.7 million tonnes of naphtha cracking (NCC) capacity, and cuts of 1.1 million tonnes at Daesan and 1.39 million tonnes at Yeosu have been confirmed. Lotte Chemical (011170.KS) reported an operating loss of KRW 943.6 billion (about $713 million) and a net loss of KRW 2.49 trillion (about $1.88 billion) for 2025.
Unlike Daesan and Yeosu, the Ulsan petrochemical complex has yet to settle on a cut plan.
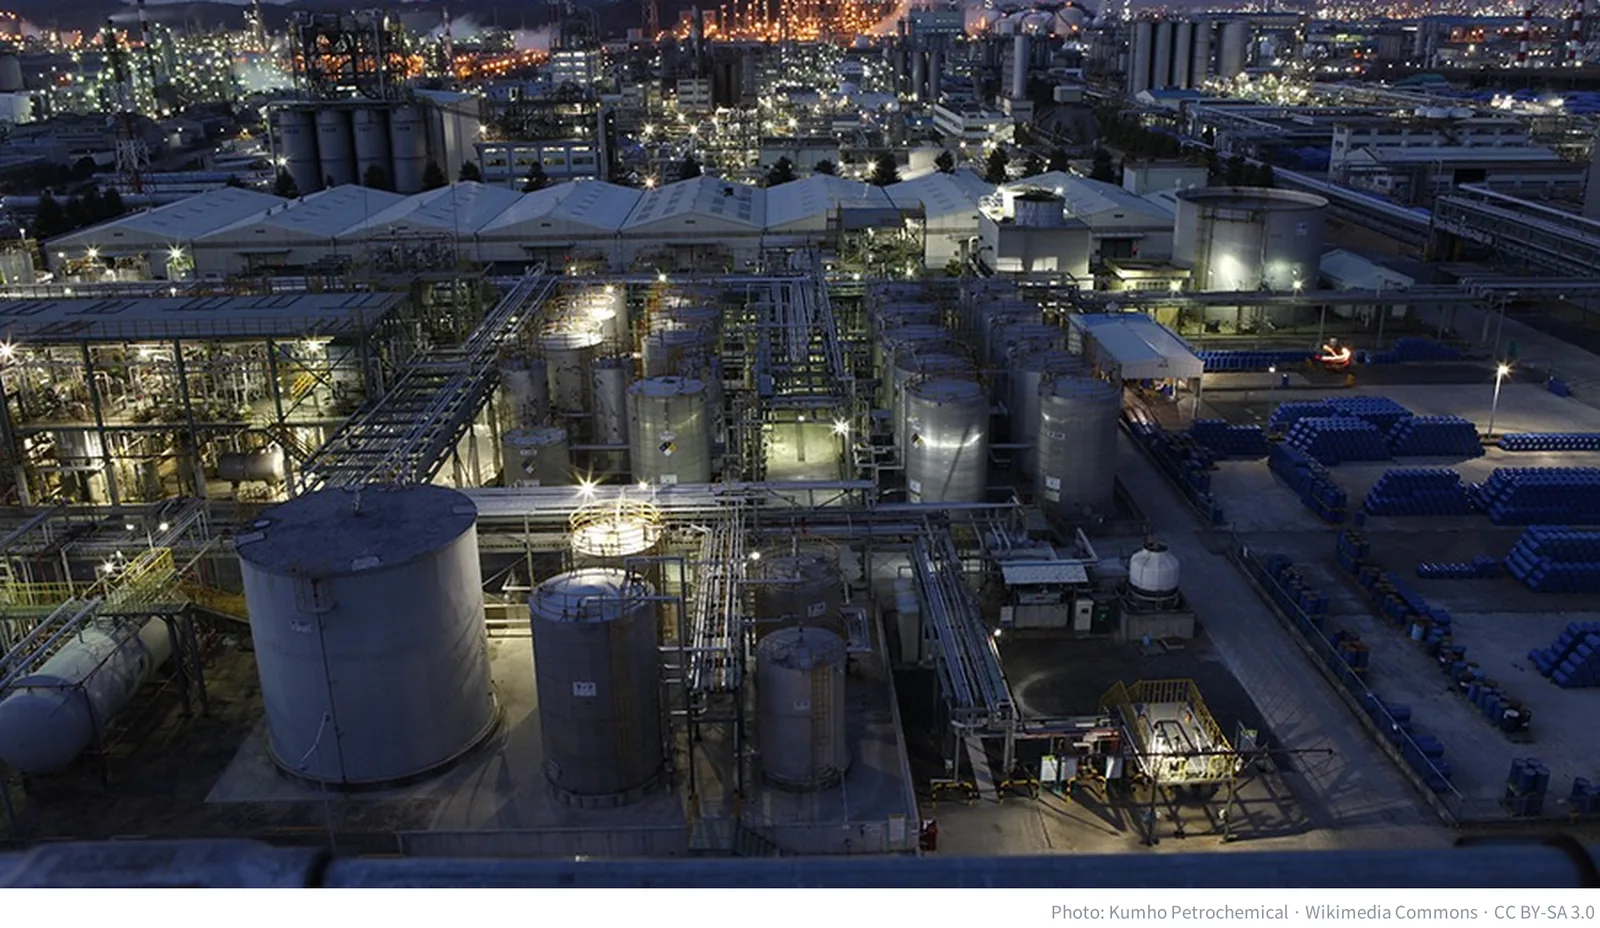
The petrochemical companies’ return to profit in the second quarter of 2026 came from product prices lifted by the Middle East conflict. Second-quarter operating profit in petrochemicals was KRW 427.0 billion (about $323 million) at LG Chem (051910.KS), KRW 87.1 billion (about $66 million) at Hanwha Solutions’ chemical division and KRW 2.3 billion at Lotte Chemical’s basic chemicals division. That is a big reversal from a year earlier, when LG Chem lost KRW 90.0 billion and Lotte Chemical’s basic chemicals lost KRW 216.1 billion. The author reads this not as the result of less Chinese output but as something oil prices are hiding, because petrochemical export volumes fell 19.1% in that same September.
Steel, cosmetics and finished cars face the same pressure
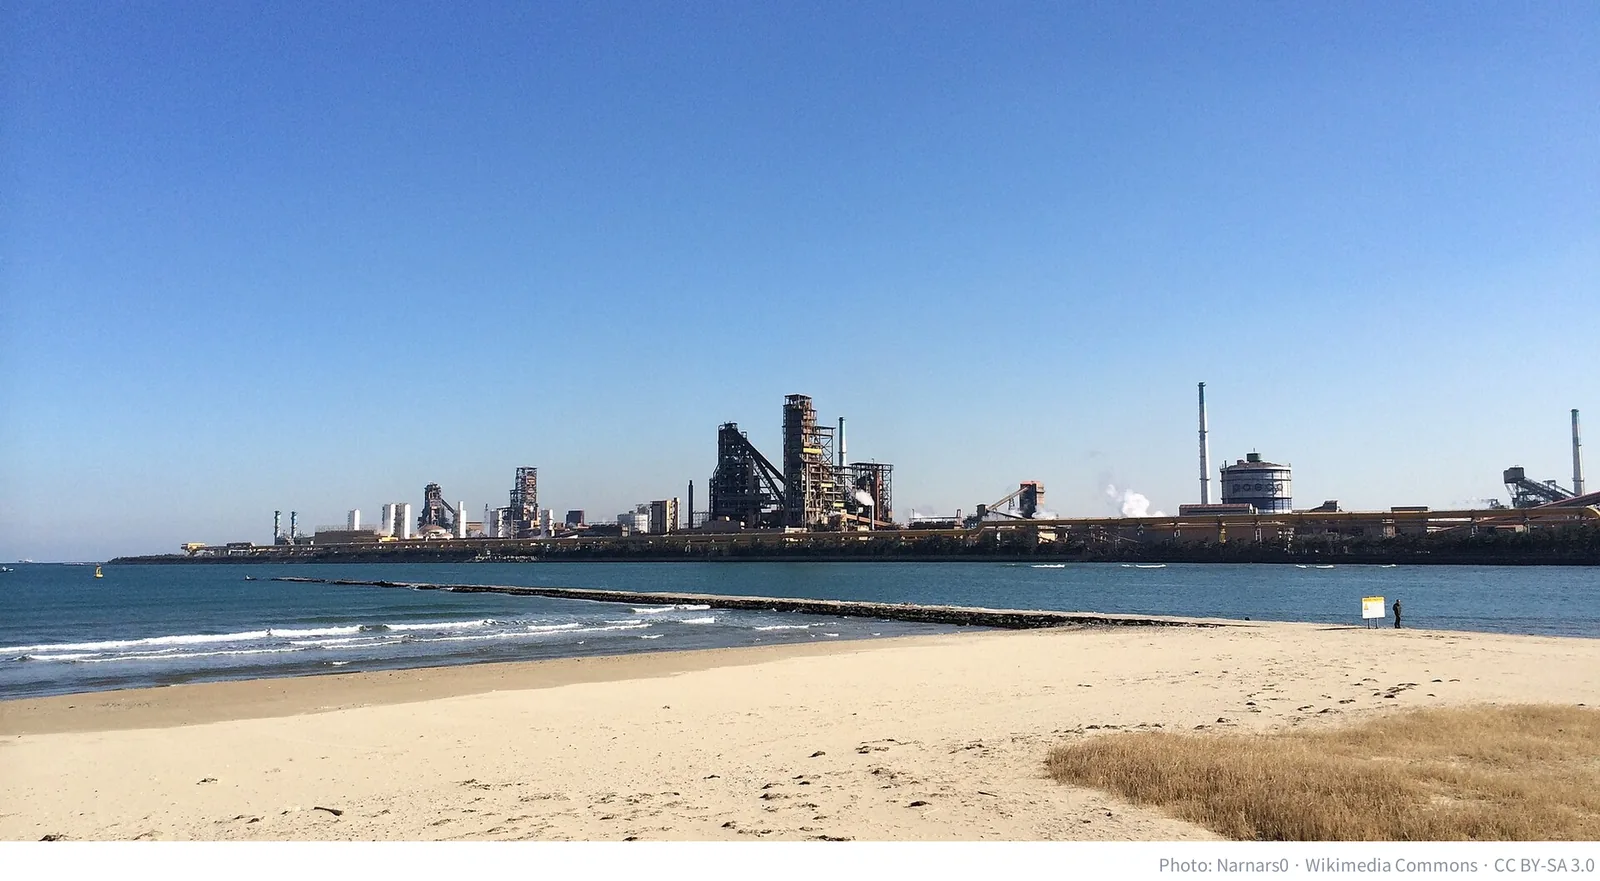
Steel is the sector Chinese export volumes hit most directly. Output at the Pohang steel industrial complex fell about 15%, from KRW 16.32 trillion (about $12.3 billion) in 2023 to KRW 13.87 trillion (about $10.5 billion) in 2025, and its utilisation rate fell from 92.7% in 2024 to 89.3% in 2025. POSCO closed its No. 1 wire rod mill in Pohang (November 2024) and its No. 1 steelmaking plant, and Hyundai Steel’s Pohang No. 2 plant has been idle since June 2025. With plants running less, local taxes also fell: Pohang’s local corporate income tax revenue dropped 61.7%, from KRW 149.1 billion in 2022 to KRW 57.1 billion (about $43 million) in 2025. These are the numbers Korea’s flagship steel city received in the year China’s steel exports hit a record 119.02 million tonnes.
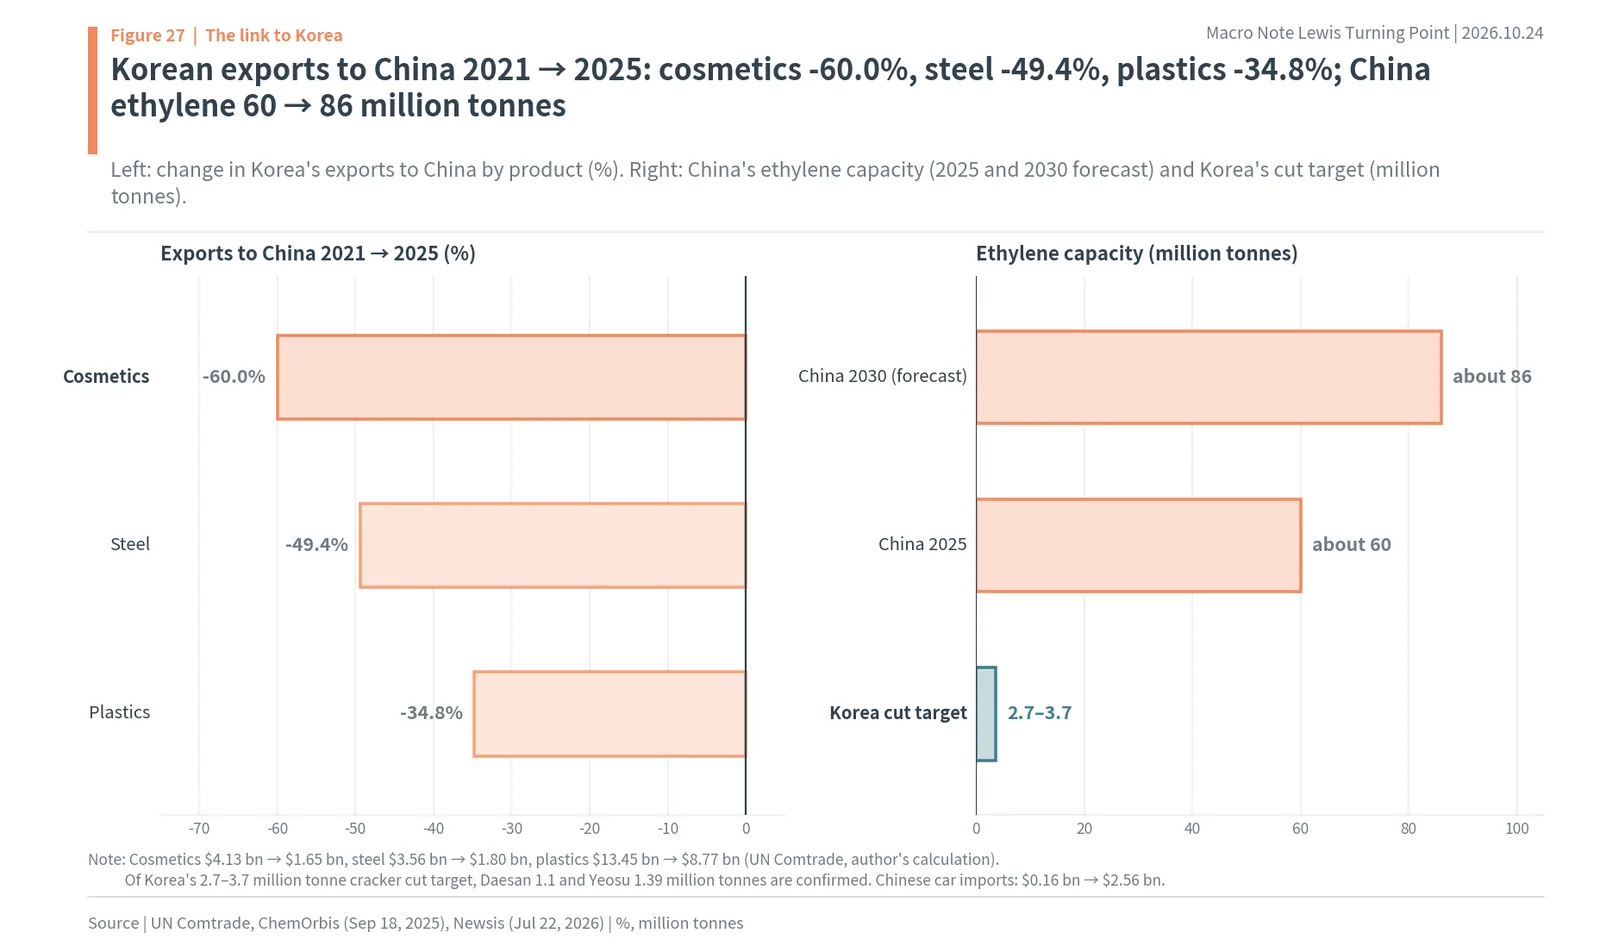
What Korea sells to China has also shrunk. In UN Comtrade data, exports of cosmetics to China fell 60.0%, from $4.13 billion in 2021 to $1.65 billion in 2025; steel fell 49.4%, from $3.56 billion to $1.80 billion; and plastics fell 34.8%, from $13.45 billion to $8.77 billion (author’s calculation). The right side of the next figure sets China’s ethylene capacity of about 60 million tonnes and the 2030 outlook of about 86 million tonnes against Korea’s cut target. Amorepacific’s (090430.KS) Greater China revenue went from KRW 696.2 billion (about $526 million) in 2023 to KRW 510.0 billion (about $385 million) in 2024. In the other direction, imports of Chinese passenger cars rose from $0.16 billion in 2021 to $2.56 billion in 2025, and BYD sold 6,107 cars in Korea in 2025. Imports of Chinese batteries fell from $8.34 billion in 2023 to $4.07 billion in 2025, but China still makes up 75% of Korea’s battery imports.
The government is narrowing the door, too. Korea’s Trade Commission imposed provisional anti-dumping duties of 28.16-33.10% on Chinese hot-rolled steel and 27.91-38.02% on heavy plate. In a 2024 survey by the Korea Chamber of Commerce and Industry, 27.6% of companies said cheap Chinese exports affected their sales or orders. Chinese tourists are not what they were either. In 2025, 5.48 million Chinese visited Korea, the most of any country, but the Chinese share of foreign visitors fell from 47% in 2016 to 29% in January-November 2025.
Since 2018: Lotte Chemical -86.1%, SK hynix +1,567.1%
The line is written into share prices. Measured from the close on the first trading day of 2018 (January 2), the year China’s share of Korean exports peaked, to the close on October 23, 2026 (excluding dividends, Yahoo Finance closes), Lotte Chemical returned -86.1%, Amorepacific -58.8%, Hyundai Steel (004020.KS) -53.1%, LG Chem -44.3% and POSCO Holdings (005490.KS) -18.7%. Over the same period the KOSPI rose 123.8%, Samsung Electronics (005930.KS) 322.4% and SK hynix (000660.KS) 1,567.1%. China’s Shanghai Composite rose 10.2%.
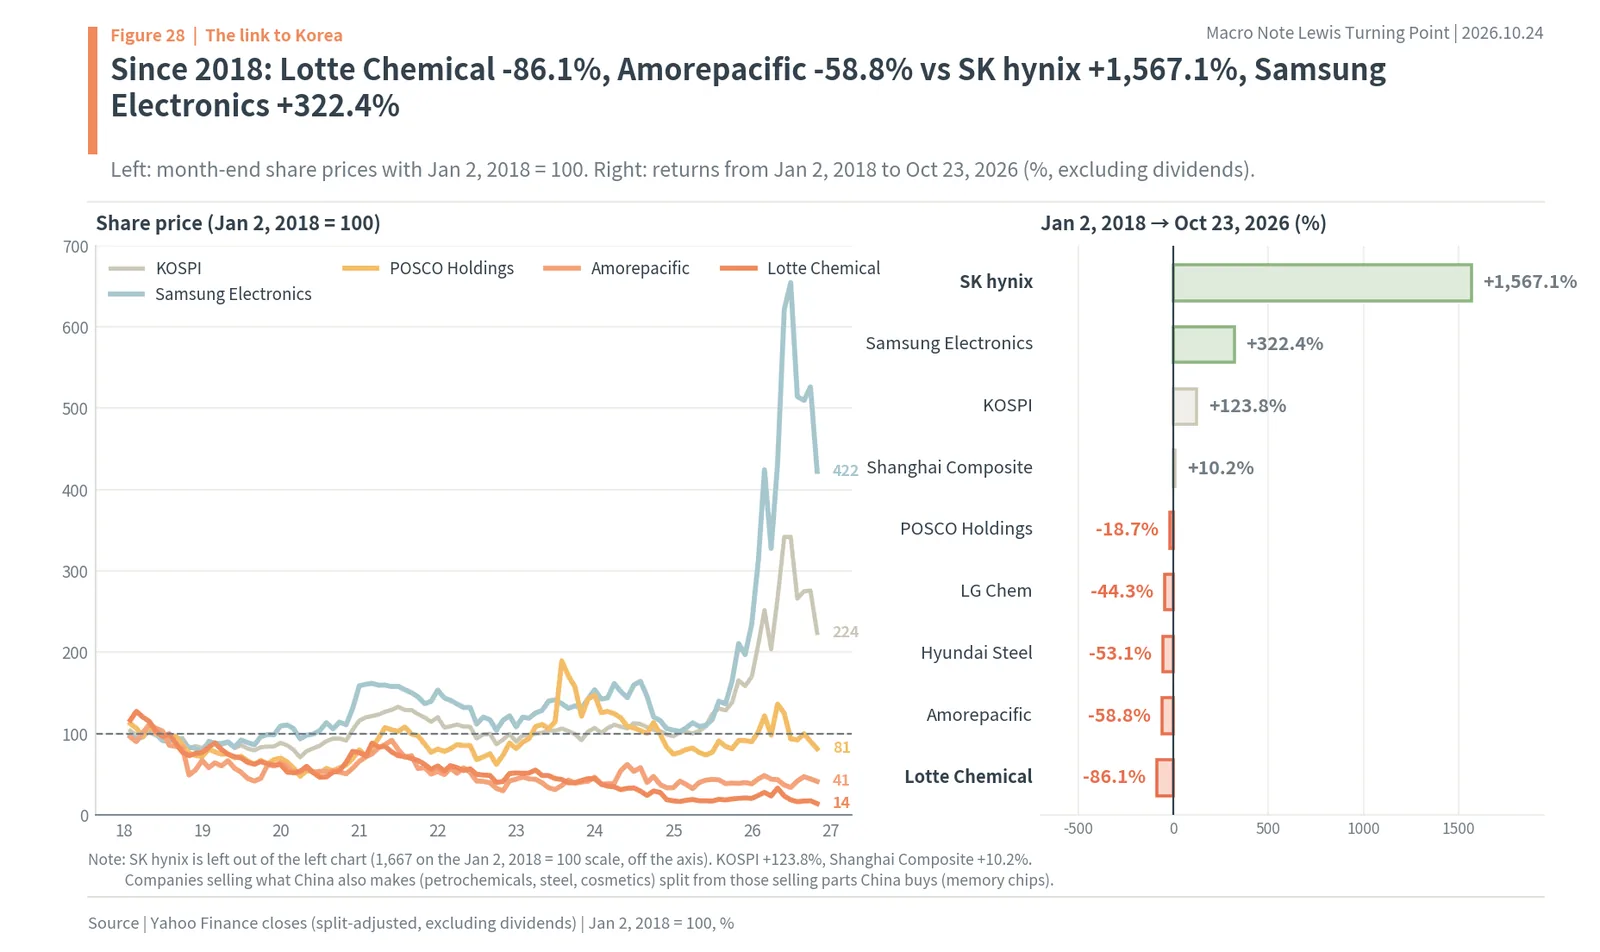
Companies selling the same things as China had to compete on price with Chinese factories, and companies selling memory chips China cannot yet match benefited from the parts Chinese factories buy. As China began running its factories on equipment instead of people after the Lewis turning point, China stopped being a single market for the Korean stock market and became, depending on the sector, both a competitor and a customer.
The author’s view: cheap labour is over, but cheap goods are not
The author believes China’s cheap labour is over, but its cheap goods are not. In one line: cheap labour is over; cheap goods are not. Put the numbers in this report back in order from cause to effect and this view follows.
First, the labour to be brought from the villages has run out. The rural population fell by about 400 million in the 30 years since its 1995 peak, migrant workers grew by only 1.42 million in a year, and their average age reached 43.3. The 15-64 population peaked in 2015 and the total population in 2021. Second, wages rose as a result. Manufacturing pay rose 6.8 times and a factory worker’s base pay is 2.1 times Vietnam’s. Factories that only pay with cheap labour left. Third, China filled the growth that labour could no longer provide with investment. Investment rose to 46.3% of GDP and debt to 305.2% of GDP. Fourth, the property market where that investment piled up has been falling since 2021. Starts fell 70.5% and house prices 21.9%. Fifth, with weak domestic demand, the factory capacity built up stayed in place and pushed output abroad. The trade surplus reached $1,189 billion and steel exports 119.02 million tonnes, both records, and factory-gate prices were below the year before for 41 months in a row.
Goods come out cheap even though labour has become expensive because the force running the factories has shifted from people to equipment and debt. Once equipment is built it has to run to repay the debt, and if it cannot sell at home it has to send goods abroad. As long as factories are run on equipment and debt instead of people, the surplus output will keep coming.
So Korean investors should sort sectors by their relationship with China
Applied to the Korean stock market, this view splits sectors in two. Goods for which Chinese capacity is already large and still growing, petrochemicals, steel, mass-market cosmetics and finished cars, are on the side that loses on price. While China’s ethylene capacity looks set to grow to about 86 million tonnes by 2030, Korea is cutting 2.7-3.7 million tonnes. Goods China still cannot make in sufficient volume, memory chips, are on the side that Chinese factories buy. The return of Korea’s trade with China to a $34.4 billion surplus in January-September 2026 was also thanks to chips.
This year’s two welcome numbers should be read separately. The petrochemical companies’ second-quarter profits and China’s PPI turning positive both come from oil and raw material prices lifted by the Middle East conflict. In that same September, China’s consumer goods prices were -0.1% and Korea’s petrochemical export volumes fell 19.1%. The author believes that when oil prices come down, the pressure from Chinese output will show again.
Three steps to apply this to the stocks in your account
There are three steps to applying this view to a stock you own. First, check whether Chinese factories also make a lot of what the company sells. If it is a product like ethylene in petrochemicals, where Chinese capacity is growing from about 60 million tonnes in 2025 to about 86 million tonnes in 2030, the company is closer to the side that loses on price. Second, check whether China is a customer or a competitor in the company’s sales. Since 85.0% of Korea’s exports to China are intermediate goods, a company selling parts that Chinese factories buy does better the harder those factories run, while a company selling finished goods to Chinese consumers suffers as much as Chinese demand is weak. The fall in cosmetics exports to China from $4.13 billion in 2021 to $1.65 billion in 2025 is an example of the latter. Third, if recent results have improved, check whether that came from volume or price. If, as with petrochemical exports in September 2026, unit prices rose 30.0% while volumes fell 19.1%, the improvement may disappear the moment oil prices come down.
Eight signals to watch
The author watches eight numbers to check this view. In the gauges below, a needle in the red zone means pressure from Chinese output is rising, and in the green zone that it is easing.
The first two come from the migrant worker monitoring survey report published at the end of April each year: the yearly increase and the average age. In 2025 they were 1.42 million and 43.3. The third and fourth are consumer goods prices and the overall PPI, released by the NBS in the middle of each month; in September they were -0.1% and +5.0%. The fifth is property construction starts, released mid-month, at -24.9% for January-September. The sixth is China’s trade surplus from China’s customs, at $938.1 billion for January-September. The seventh and eighth are Korea’s share of exports going to China (21.0% for January-September) and petrochemical export volumes (-19.1% in September), published by Korea’s trade ministry on the first of each month.
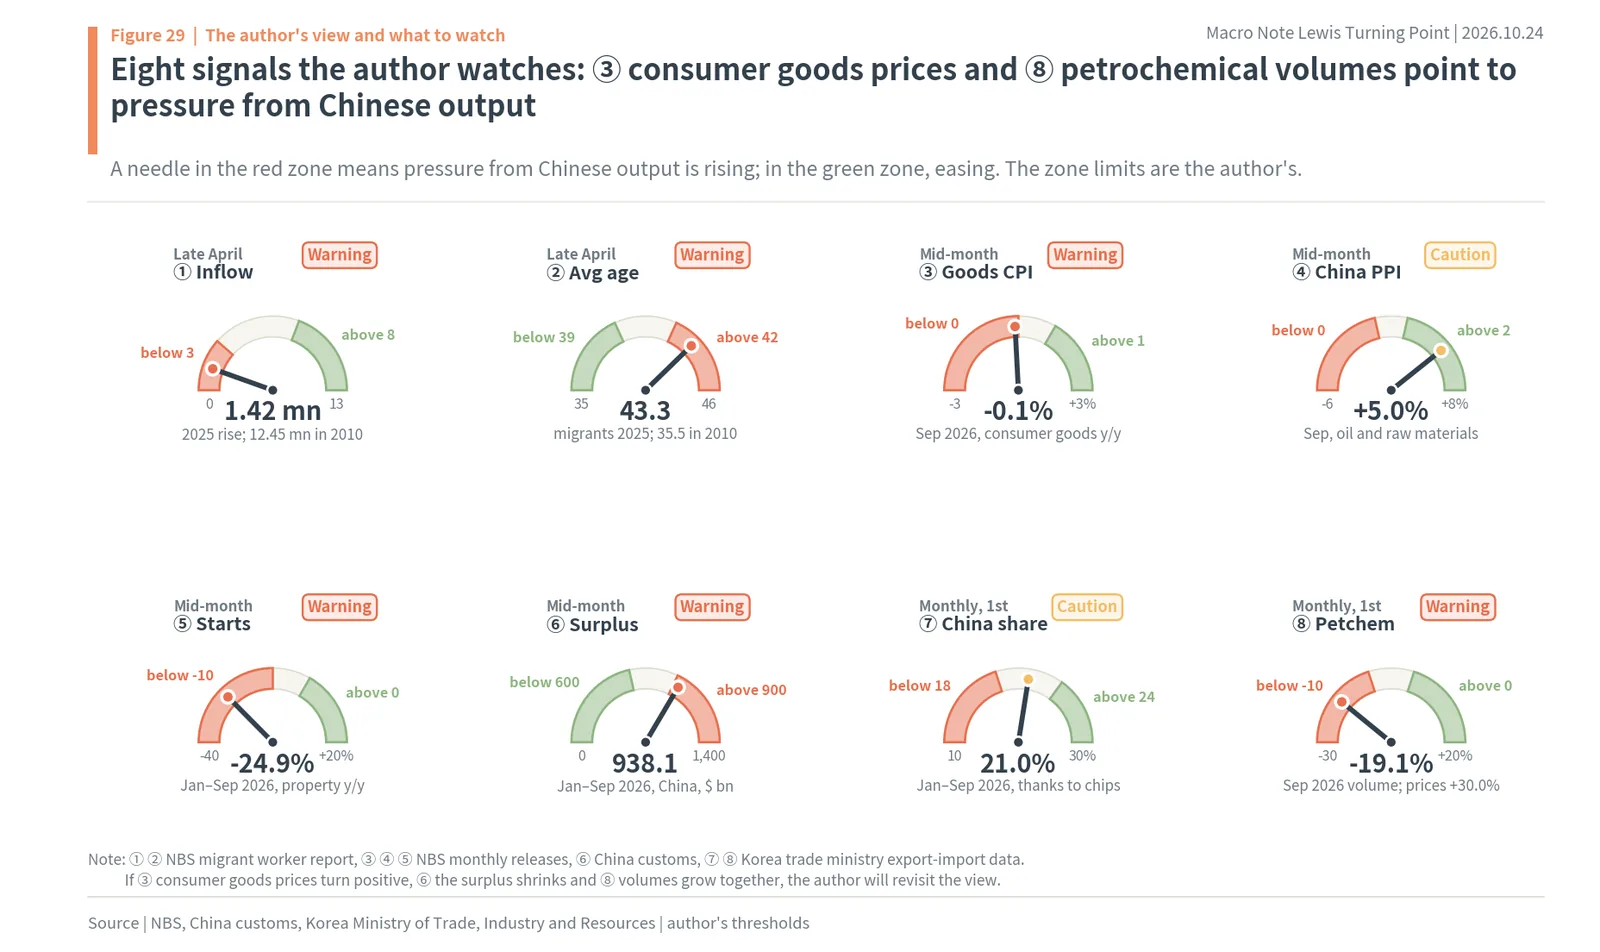
The author will revisit this view if three things happen together among these eight numbers: consumer goods prices turn positive, China’s trade surplus shrinks, and Korea’s petrochemical export volumes grow. Until then, the author reads any rebound in sectors that overlap with China as something made by oil prices.
Common questions: the Lewis turning point and Korean investors
Does passing the Lewis turning point mean China’s economy will stop growing?
No. The Lewis turning point is not where growth stops but where the way of growing changes. China’s growth fell from 14.2% in 2007 to 5.0% in 2025, but it is still positive, and it was 4.6% in January-September 2026. What changed is the force that drives growth. Before, labour brought in from the villages made growth; after the turning point, investment and debt took its place. The IMF’s forecast of 3.4% growth in 2030 also reflects the calculation that, with labour no longer growing, the part that investment can fill is shrinking.
If wages rise, shouldn’t the prices of Chinese goods rise too?
Looking at wages alone, yes. But China’s factory-gate prices were lower than a year earlier for 41 months in a row from October 2022. While wages rose, factories brought in more machines instead of people, and much of that machinery was bought with debt. Once built, equipment has to run so the debt can be repaid, and when property turned down and goods would not sell at home, they had to be sent abroad even at lower prices. That is why a country where labour got expensive ended up selling goods even more cheaply.
China’s producer prices are positive in 2026. Is deflation over?
In September 2026 China’s producer prices were 5.0% higher than a year earlier. But consumer goods prices in the same month were 0.1% lower. What rose this year was raw materials such as crude oil and metals, which jumped with the Middle East conflict, while the prices of the finished goods factories make have not yet risen. The author believes that when oil prices come down, the raw material part will drop out and the weakness in factory goods prices will show again.
Korea’s trade with China is back in surplus. Isn’t there less to worry about?
Korea’s trade with China showed a surplus of $34.4 billion in January-September 2026, and that surplus was made almost entirely by chips. Chip exports to China rose 320.5% over September 1-25, while petrochemical export volumes fell 19.1% in the same September. This matches the conclusion of this report, that the relationship between Korea and China has split by sector. Korea is selling China more memory chips, which China still cannot make in sufficient volume, and less of the commodity materials China already makes in quantity.
Which numbers should Korean investors look at first?
The author looks at three first. One is consumer goods prices, released by the NBS in the middle of each month; whether they turn positive shows whether Chinese domestic demand is recovering. Two is China’s trade surplus from China’s customs; whether the January-September figure of $938.1 billion starts to shrink shows whether the push of goods abroad is easing. Three is petrochemical export volumes from Korea’s trade ministry on the first of each month, the quickest sign of how hard Korean factories are being pushed by Chinese output. Until all three improve together, the author reads rebounds in sectors that overlap with China as something made by oil prices.
Will China, like Japan, become a country where prices do not rise for a long time?
The difference visible in the numbers is speed. Japan, after passing its turning point around 1960, had 35 years in which its working-age population grew 45.6%, whereas China peaked only 11 years after its 2004 turning-point signal, after growing just 7.3%. China has to deal with expensive labour and shrinking labour together, in a much shorter time.
Basis of calculation: how the numbers were gathered and counted
This section sets out, chapter by chapter, where the numbers in this report come from.
Urbanisation, rural population and urban population come from Table 2-1 of the NBS China Statistical Yearbook 2025 (1978-2024) and the 2025 Statistical Communiqué (February 28, 2026). 1982, 1990, 2000, 2010 and 2020 are census estimates, and other years are sample-survey estimates. The primary-sector share of employment is Table 4-2 of the same yearbook, with 2011-2019 revised using the seventh census. The hukou urbanisation rate of 48.3% (2023) and the 250 million urban residents without an urban hukou are from a Yicai article of May 28, 2026, and the remarks of a deputy head of the National Development and Reform Commission reported there.
Migrant worker numbers were checked year by year against the NBS migrant worker monitoring survey reports, 2008-2025 editions. Monthly income for 2008-2012 is for out-migrant workers, and from 2014 for all migrant workers, so the two periods were not compared directly. The share aged 40 or under is the report’s own figure only for 2023 and 2025; for other years it is 100 minus the 41-50 and over-50 shares. Average ages for 2008-2009 and 2011-2013 could not be found in the reports and are left blank in the figure. The ratio of one 8.8th for the yearly increase is 12.45 million divided by 1.42 million.
Surplus labour is the baseline scenario of IMF Working Paper WP/13/26 (January 29, 2013). The 15-64 population is from the World Bank WDI (SP.POP.1564.TO), and the 15-59 peak (2011) is the NBS figure cited in a 2013 People’s Daily Online report. Total population, births and deaths are from the 2022-2025 Statistical Communiqués.
Average manufacturing pay is the urban non-private unit figure in Table 4-12 of the China Statistical Yearbook 2025. Pay at private firms is lower, but this series runs on the same basis for a long time, which is why it was used. Shanghai’s minimum wage was checked against reports of Shanghai government notices (China Law & Practice, China Briefing and Chinese media) for effective dates and amounts. Foxconn’s wages are from Reuters and Xinhua reports of October 2, 2010, and the Honda strike from an AFP report of June 2, 2010. Asian factory worker base pay is from JETRO’s report of April 15, 2024 (survey of Japanese-affiliated companies abroad, FY2013, FY2019 and FY2023). The number and amount of new Korean subsidiaries are from the Export-Import Bank of Korea’s overseas direct investment statistics, accessed October 24, 2026.
Growth, the investment share, the household consumption share and world manufacturing value added are from the World Bank WDI (updated October 8, 2026). The manufacturing value-added share was calculated by the author from current-dollar values, so it is affected by the yuan exchange rate. Quarterly growth in 2026 is from NBS releases, and IMF forecasts are from reports on the October 2026 World Economic Outlook and the February 18, 2026 Article IV press release.
Property figures are levels from NBS releases for 2021 (January 18, 2022), 2025 (January 20, 2026) and January-September 2026 (October 20). Changes were calculated by dividing the levels for the two years. The year-on-year changes published by the NBS use revised bases and may differ slightly from figures calculated this way. House prices are the BIS residential property price index (nominal, 2010 = 100, FRED QCNN628BIS). Debt is from BIS credit to the non-financial sector statistics (as a share of GDP, market value, with government at nominal value), and augmented government debt is from the IMF Article IV press release.
The trade surplus is from Xinhua, Reuters and Trading Economics reports of China customs releases, and the 2019 figure is 2.92 trillion yuan converted to about $423 billion. Steel exports are from steel industry media (gmk.center, eurometal, SteelOrbis) reporting customs figures. Producer and consumer prices are NBS releases (for part of 2022-2025, OECD data via FRED), and the 41 months is the count of negative months from October 2022 to February 2026. The 12 quarters of a negative GDP deflator is from a Caixin report.
Korea’s exports to, imports from and trade balance with China, and China’s share of exports (2000-2025), are Korean customs data published in UN Comtrade and may differ from trade ministry figures by $0.1-0.2 billion. Figures for January-September 2026 add up the monthly tables in the trade ministry’s October 1 press release. The intermediate goods share was calculated by the author using the UN Comtrade BEC classification. Sector exports to China use UN Comtrade HS codes (cosmetics 3304, steel 72, plastics 39). Petrochemical cuts and Pohang steel complex figures are from Newsis (July 22, 2026) and Kyunghyang Shinmun (August 6, 2026) reports. Won amounts were converted at KRW 1,323.7 per dollar (October 23, 2026 close).
Share price returns compare Yahoo Finance closes (excluding dividends, adjusted for stock splits) on January 2, 2018 and October 23, 2026. LG Chem spun off its battery business in 2020, and since then the value of that business has been reflected in its share price only through its stake.
Maochaedung’s take. Cheap labour is over; cheap goods are not. China’s rural population fell by about 400 million from its 1995 peak, migrant workers grew by only 1.42 million in 2025 and their average age reached 43.3, and the working-age population peaked in 2015. Manufacturing pay rose 6.8 times and is now 2.1 times Vietnam’s. China filled the gap with investment and debt, which rose to 305.2% of GDP, and when property turned down after 2021, the factory capacity built with that debt pushed goods abroad: a $1,189 billion trade surplus, record steel exports of 119.02 million tonnes and 41 months of falling factory-gate prices. For Korea the line runs through sectors: petrochemicals, steel and cosmetics, which make what China makes, lost ground, while memory chips, which China buys, gained. The author reads this year’s positive Chinese PPI and the petrochemical rebound as oil prices hiding the pressure, not as the end of it.
China’s Lewis turning point and Korean stocks: quick answers
Q. What is the Lewis turning point?
It is the point, described by W. Arthur Lewis in 1954, when a developing economy runs out of surplus rural labour. Before it, factories can hire more workers without raising wages; after it, they must compete for workers and wages rise. Cai Fang dated China’s turning point to 2004, and an IMF paper put it between 2020 and 2025.
Q. How do we know China has run out of surplus labour?
China’s rural population fell from 859.47 million in 1995 to 451.09 million in 2025. Migrant workers grew by only 1.42 million in 2025 against 12.45 million in 2010, and their average age rose from 35.5 to 43.3. The population aged 15-64 peaked at 988.4 million in 2015 and the total population in 2021.
Q. If Chinese wages rose so much, why are Chinese goods still cheap?
Average manufacturing pay rose 6.8 times between 2005 and 2024, but China replaced labour with investment funded by debt, which reached 305.2% of GDP. When property peaked in 2021 and domestic demand stayed weak, factories pushed output abroad. The trade surplus hit $1,189 billion in 2025 and factory-gate prices fell for 41 months in a row.
Q. Is China’s deflation over now that its PPI is positive?
The PPI turned positive in March 2026 and was +5.0% in September, but consumer goods prices fell 0.1% in the same month. The author reads the rise as oil and raw material prices lifted by the Middle East conflict rather than the end of deflation in factory goods.
Q. Which Korean sectors are hurt and which benefit?
Sectors that make what China makes lost ground: Korean exports of cosmetics to China fell 60.0% and steel 49.4% from 2021 to 2025, and Korea plans to cut 2.7-3.7 million tonnes of naphtha cracking capacity. Memory chips gained: from January 2, 2018 to October 23, 2026, SK hynix rose 1,567.1% while Lotte Chemical fell 86.1%.
Q. What should investors watch next?
The author watches eight signals, starting with three: China’s consumer goods prices (-0.1% in September 2026), China’s trade surplus ($938.1 billion in January-September 2026) and Korea’s petrochemical export volumes (-19.1% in September). If all three improve together, the author will revisit the view.
Sources
- Cai Fang, “China’s demographic dividend will disappear around 2013” (link), Aisixiang, Jul 10, 2012; W. Arthur Lewis, “Economic Development with Unlimited Supplies of Labour”, The Manchester School 22(2), May 1954
- IMF, Mitali Das and Papa N’Diaye, “Chronicle of a Decline Foretold: Has China Reached the Lewis Turning Point?” (link), Jan 29, 2013; IMF, China 2025 Article IV consultation (link), Feb 18, 2026
- National Bureau of Statistics of China, 2025 Migrant Worker Monitoring Survey Report (link), Apr 30, 2026; 2008-2024 editions of the same report; China Statistical Yearbook 2025 (Tables 2-1, 4-2, 4-12); 2025 Statistical Communiqué, Feb 28, 2026
- National Bureau of Statistics of China, property development January-September 2026 (link), Oct 20, 2026; property 2025 (link), Jan 20, 2026; September PPI (link), Oct 15, 2026
- World Bank WDI (growth, investment, consumption, population aged 15-64, manufacturing value added), updated Oct 8, 2026; BIS credit to the non-financial sector and residential property prices, Q1 2026; JETRO, manufacturing wage levels in Asia (link), Apr 15, 2024
- Reuters and Xinhua (via China Digital Times), Foxconn wage rise (link), Oct 2, 2010; Reuters, China’s 2025 trade surplus (link), Jan 14, 2026; gmk.center, China steel exports (link), Jan 2026
- Korea Ministry of Trade, Industry and Resources, September 2026 export-import trends (link), Oct 1, 2026; UN Comtrade (Korean customs, trade with China), accessed Oct 24, 2026; Export-Import Bank of Korea overseas direct investment statistics, accessed Oct 24, 2026
- Newsis, petrochemical restructuring (link), Jul 22, 2026; Kyunghyang Shinmun, Pohang steel industrial complex (link), Aug 6, 2026; Yahoo Finance closing prices (Jan 2, 2018 to Oct 23, 2026)
- Yicai, hukou urbanisation rate (link), May 28, 2026; Bai Moo-ki, “The Turning Point in the Korean Economy”, The Developing Economies 20(2), 1982; Caixin, GDP deflator (link), Apr 16, 2026
- Rhodium Group, “Who loses from China’s export gains” (link), Sep 23, 2026; ChemOrbis, China olefin capacity (link), Sep 18, 2025; Bizwatch, Lotte Chemical 2025 results (link), Feb 4, 2026
- AFP (IndustryWeek), Honda Foshan plant resumes operations (link), Jun 2, 2010; Reuters (via Gulf News), Samsung Electronics ends phone production in China, Oct 2, 2019; Toyo Economy, Amorepacific Greater China revenue (link), Apr 30, 2026
- Photos: mengyeyue (CC BY-SA 3.0), King of Hearts (CC BY-SA 4.0), 枫彩 (CC BY 2.5 CN), Steve Jurvetson (CC BY 2.0), Uday Phalgun (CC BY 2.0), Alex Needham (public domain), Kumho Petrochemical (CC BY-SA 3.0), Narnars0 (CC BY-SA 3.0), via Wikimedia Commons
Was this note useful?
Thanks. Your answer helps decide what to cover next.
Korea market snapshot · Oct 27, 2026
New to Korean stocks? Start here for the basics.
Most read lately
3Balance Sheet Recession: Japan’s Lost Years and Korea’s KRW 2,000 Trillion Household Debt (2026)
4Commodity Cycle Order: Gold Peaks First, Grains Last, Rates Next (2026)
5Hanwha Succession: Who Gained Among the Three Kim Brothers, from One Basket to Three Paths
Get the Saturday note on Korean stocks
One email every Saturday with the week’s new research on Korean listed companies and links to the updated data pages. Built from DART filings and KRX data. Free; unsubscribe in one click. See past issues