KOSPI Plunges 3.65%: Samsung Electronics (005930.KS) and SK hynix (000660.KS) Stock Forecast Hinges on How Many Years Peak Memory Profits Last
Samsung Electronics just earned a record KRW 107.4tn in one quarter, yet the KOSPI fell 3.65%. Only Korea fell: the KOSPI is down 30.0% from its June 22 record while the S&P 500 is up 4.5%, and 69.2% of the lost market value came from Samsung Electronics and SK hynix. This report argues that the market is re-pricing how many years peak memory profits will last, not this year’s profit, and that a 5.24% US 10-year yield cuts the value of each year. Numbers as of October 12, 2026.
- The KOSPI fell 3.65% to 6,384.24 on October 12, 2026, 30.0% below its June 22 record, while the S&P 500 rose 4.5% and the TAIEX 3.3% over the same period.
- 69.2% of the KRW 2,181.7tn (about $1.64tn) the KOSPI lost since June 22 came from Samsung Electronics and SK hynix, which still make up 50.1% of the index.
- Profits are at a record (Samsung Q3 operating profit KRW 107.4tn), yet 2027 P/Es are 3.7x and 3.59x and earnings yields sit more than 21 points above the 5.24% US 10-year.
- On the author’s model, today’s prices credit only about 2.6 years (Samsung Electronics) and 3.2 years (SK hynix) of peak memory profit; the rise in the US 10-year from 4.16% to 5.24% cut the same years’ value by 7.9% and 5.2%.
- Foreigners net sold KRW 198.4tn of KOSPI shares this year; investor deposits fell KRW 21.25tn while MMFs grew KRW 38.57tn. Watch SK hynix results on October 27 for 2027 volume clues and the FOMC on October 27–28.
Key takeaways
- On October 12, 2026 the KOSPI closed down 3.65% at 6,384.24. That is 30.0% below its June 22 record of 9,114.55, while the S&P 500 rose 4.5% and Taiwan’s TAIEX 3.3% over the same period. Only Korea fell, and 69.2% of the KRW 2,181.7tn (about $1.64tn) the KOSPI lost in market value came from just two stocks, Samsung Electronics and SK hynix.
- Four days earlier Samsung Electronics reported a quarterly operating profit of KRW 107.4tn (about $80.5bn). Yet on consensus numbers its 2027 P/E is 3.7x and SK hynix’s is 3.59x, and the KOSPI forward P/E has fallen from 11.30x a year ago to 5.11x. The market is pricing doubt about how many years these profits will last.
- On the author’s model, today’s share prices credit Samsung Electronics with only about 2.6 years of peak memory profit and SK hynix with about 3.2 years. The rise in the US 10-year Treasury yield from 4.16% at the start of the year to 5.24% has also cut the value of the same number of years by 5–8%. The author thinks the next move in the shares will be set not by third-quarter numbers but by 2027 volume and price contracts and by interest rates.
As of: October 12, 2026
Topics covered: the KOSPI and KOSDAQ sell-off, Samsung Electronics and SK hynix earnings and consensus, P/E and earnings yield, how many years peak memory profit lasts (the author’s model), the US 10-year Treasury yield, foreign and retail flows, investor deposits, money market funds and broker-issued notes, the won-dollar rate and Korean buying of US stocks, the 2017–2019 memory peak, US chip stocks, affected sectors and stocks, and dates to watch
Data: share prices, market capitalization and trading by investor type are KRX closes and tallies for October 12, 2026; consensus is WISEfn (retrieved October 12, 2026); overseas share prices and the US 10-year yield are Yahoo Finance closes on October 9 (local time); the KOSPI forward P/E is FnGuide’s (October 8). October 9 was a Korean market holiday (Hangul Day), so October 12 was the first trading day after the long weekend.
Summary: Samsung Electronics and SK hynix shares price the years left, not this year’s profit
This report looks at the KOSPI’s 3.65% fall on October 12, 2026 and the “years left” on peak memory profits at Samsung Electronics and SK hynix, based on public data and the author’s calculations. It asks one question. Four days after Samsung Electronics became the first Korean company to earn more than KRW 100tn in operating profit in a single quarter, why did the KOSPI fall 3.65%? The author’s answer is that the market is re-pricing not the size of this year’s profit but how many years that profit will last. And as the US 10-year Treasury yield went above 5%, the value of each of those years shrank too. Korea counts large sums in units of 100 million won (eok) and one trillion won (jo); this report shows them as KRW bn and KRW tn, and dollar figures are converted at KRW 1,333.7 per dollar, the Oct 12, 2026 rate.
How it works in Korea: the KOSPI, the KOSDAQ and daily flow data. The KOSPI is the main board of the Korea Exchange (KRX) and its benchmark index, weighted by market capitalization; the KOSDAQ is the smaller, tech-heavy second board. Unlike most markets, the KRX publishes net buying and selling by investor type (foreigners, individuals, institutions and “other corporations”) every day, for the whole market and for each stock, so who sold on a given day is a matter of record rather than guesswork. Korean retail investors, who hold a large share of local trading, are often called “ants”, and those who buy US shares “Seohak ants”.
The chain runs as follows. First, this fall is Korea’s alone. From June 22, when the KOSPI hit its record, to October 12 the KOSPI fell 30.0%, while the S&P 500 rose 4.5% and the TAIEX 3.3%. Second, Korea alone fell because the KOSPI is, in effect, memory. On June 22 the market cap of all KOSPI stocks was KRW 7,449.6tn, and 55.7% of it was Samsung Electronics and SK hynix. Of the KRW 2,181.7tn lost by October 12, KRW 1,510.1tn (about $1.13tn), or 69.2%, was these two stocks. Third, the two companies’ profits are at record highs. On WISEfn consensus, Samsung Electronics’ earnings per share (EPS) goes from KRW 6,564 in 2025 to KRW 67,701 in 2027, and SK hynix’s from KRW 58,955 to KRW 446,744. Yet at October 12 prices their 2027 P/E ratios are 3.7x and 3.59x.
Fourth, a P/E in the 3s signals that the market does not believe these profits will last long. The author takes average 2021–2025 EPS as “normal profit” and splits off the part above it as “peak profit”. Setting share price = value of normal profit + value of receiving peak profit for some number of years, and solving backwards from today’s price, Samsung Electronics is credited with about 2.6 years of peak profit and SK hynix with about 3.2. Fifth, rates cut the value of each of those years. The US 10-year yield rose from 4.16% at the end of 2025 to 5.24% on October 9. Holding the years fixed and raising only the rate lowers the model price by 7.9% for Samsung Electronics and 5.2% for SK hynix. Sixth, money has meanwhile moved to fixed rates. Investor deposits fell by KRW 21.25tn, from KRW 121.63tn at the end of June to KRW 100.38tn on October 7, while money market funds (MMFs) grew by KRW 38.57tn. Broker-issued notes pay 5.0% a year for one year.
The author’s view is this. The author sees this sell-off not as a crisis in the Korean economy or a deterioration in earnings, but as the market re-pricing the “years left” on peak memory profits. In 2018, too, Samsung Electronics and SK hynix shares turned down first in the very year they made record profits. Samsung Electronics then fell 34.6% from its November 1, 2017 high to its January 4, 2019 low, and SK hynix fell 39.5%. So what will set the next share price is not the third-quarter numbers already out, but 2027 volume and price contracts, which show how many years peak profit will last, and US interest rates, which set the value of each of those years. The US September consumer price index comes on October 14, SK hynix’s third-quarter results and shareholder return plan on October 27, and the US Federal Open Market Committee (FOMC) meeting on October 27–28. This report works through the chain to that conclusion in order: terms and a hypothetical example, Korea’s solo fall, the weight of the two stocks, profits and P/E, the years left, rates, where the money went, 2018, other explanations, the author’s view, stocks and dates, and how the numbers were calculated.
1. Key terms: memory, HBM, P/E, earnings yield and the years-left model
Terms used in this report
Memory chips store data. There is DRAM, used briefly while a computer works, and NAND, which keeps data after the power is off. Memory plants take years to build while demand changes quickly, so memory prices rise sharply and fall sharply. That is why memory makers’ profits trace peaks and valleys every few years. HBM (high-bandwidth memory) stacks several layers of DRAM and sits next to the chips in AI servers. Its volumes are often contracted with customers a year ahead, so how far those contracts reach is a clue to how long profits will last.
P/E (price-to-earnings ratio) is the share price divided by earnings per share (EPS). A company priced at KRW 100,000 that earns KRW 10,000 a year has a P/E of 10x, which can be read as taking ten years to earn its share price if profit stays where it is. The inverse of P/E is the earnings yield. A P/E of 10x is a 10% earnings yield; 5x is 20%. Because it shows what percentage a share earns per year, it is easy to compare with deposit or government bond rates.
Forward P/E uses expected earnings for the next 12 months. The KOSPI forward P/E compiled by FnGuide was 5.11x on October 8, against 11.30x a year earlier. As an earnings yield, that is a move from 8.8% to 19.6% (author’s calculation). The US 10-year Treasury yield is the interest rate the US government pays to borrow for ten years. Investors worldwide use it as the benchmark for “interest you can earn without risk”, so when it rises, the return they demand from risky assets such as shares rises with it.
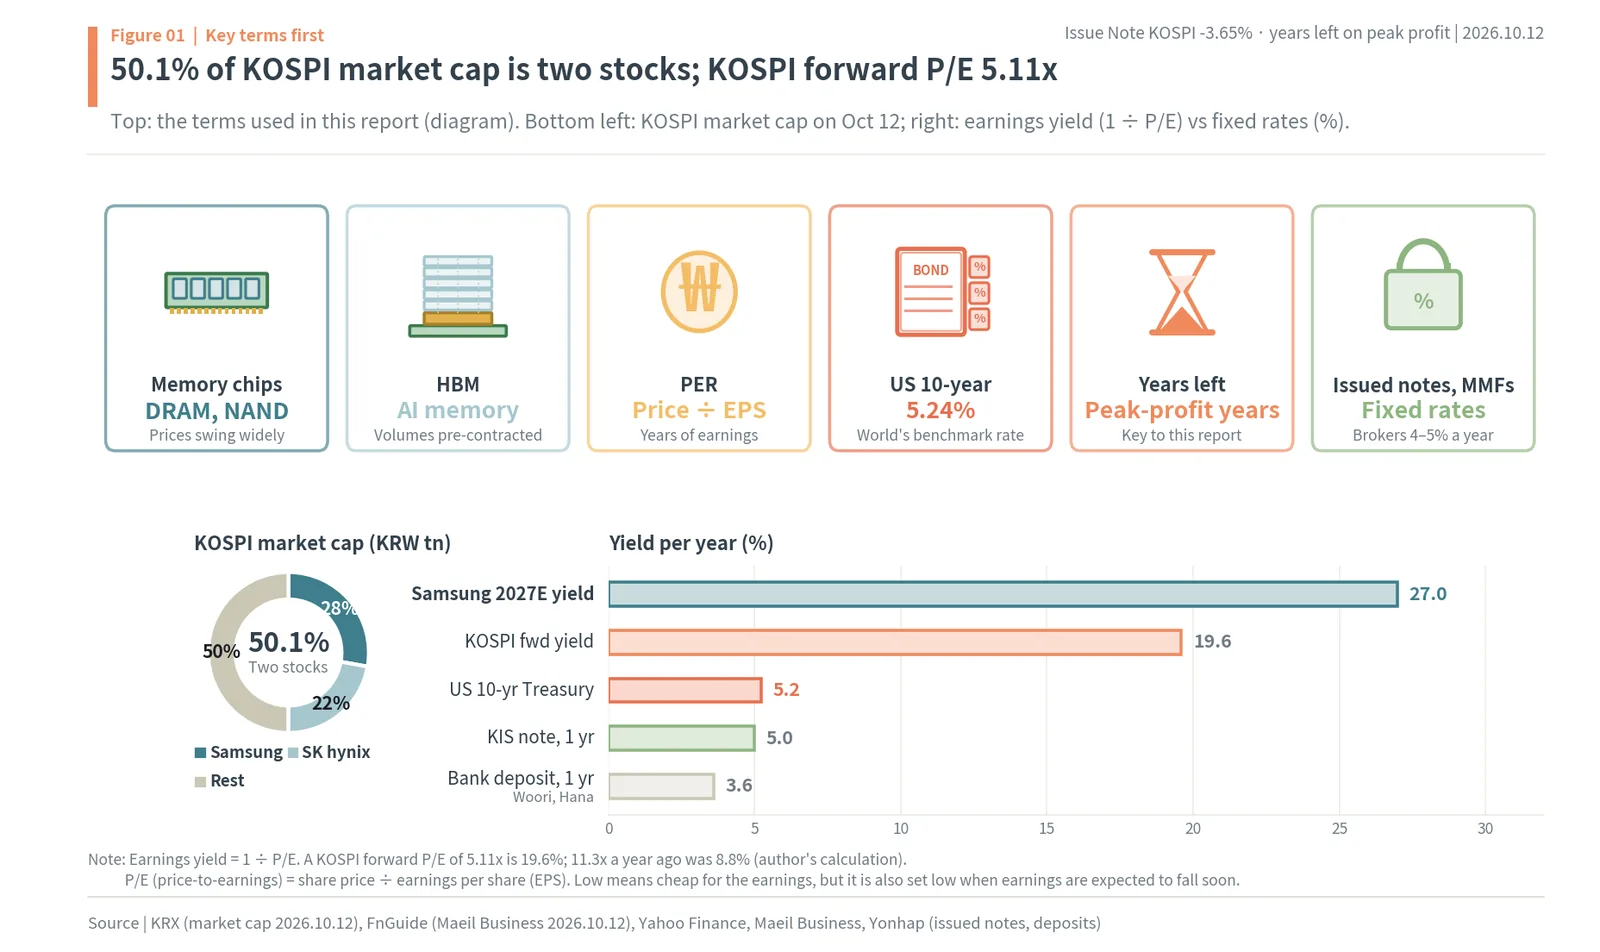
Investor deposits are cash parked in brokerage accounts to buy shares, and an MMF (money market fund) is a fund that holds short-term bonds and bills. Issued notes (balhaeng-eoeum) are short-term notes that Korea’s largest brokers are licensed to issue directly, paying a promised rate. Looking at the three together shows whether money that would go into shares is moving to fixed rates. The top of Figure 1 turns these terms into pictures; the bottom left shows the two stocks’ share of KOSPI market cap on October 12 (50.1%), and the bottom right puts earnings yields next to the fixed rates available now. Samsung Electronics’ expected 2027 earnings yield is 27.0%, far above the US 10-year at 5.24%, Korea Investment & Securities’ one-year issued note at 5.0% and a bank one-year time deposit at 3.6%.
Two terms are this report’s own. “Normal profit” is average EPS over the five years 2021–2025, which went through one good memory year and one bad one. “Peak profit” is the part of current profit that sits above normal profit, and “years left” is the number of years for which the market is pricing in that peak profit, solved backwards from the share price. In addition, the FOMC is the Federal Reserve meeting that sets the US policy rate, foreign ownership is the share of a listed company’s shares held by foreigners, and forced selling (bandae-maemae) is when a broker sells shares bought on credit because the collateral has fallen short.
A hypothetical example: a company that normally earns KRW 1,000 starts earning KRW 5,000
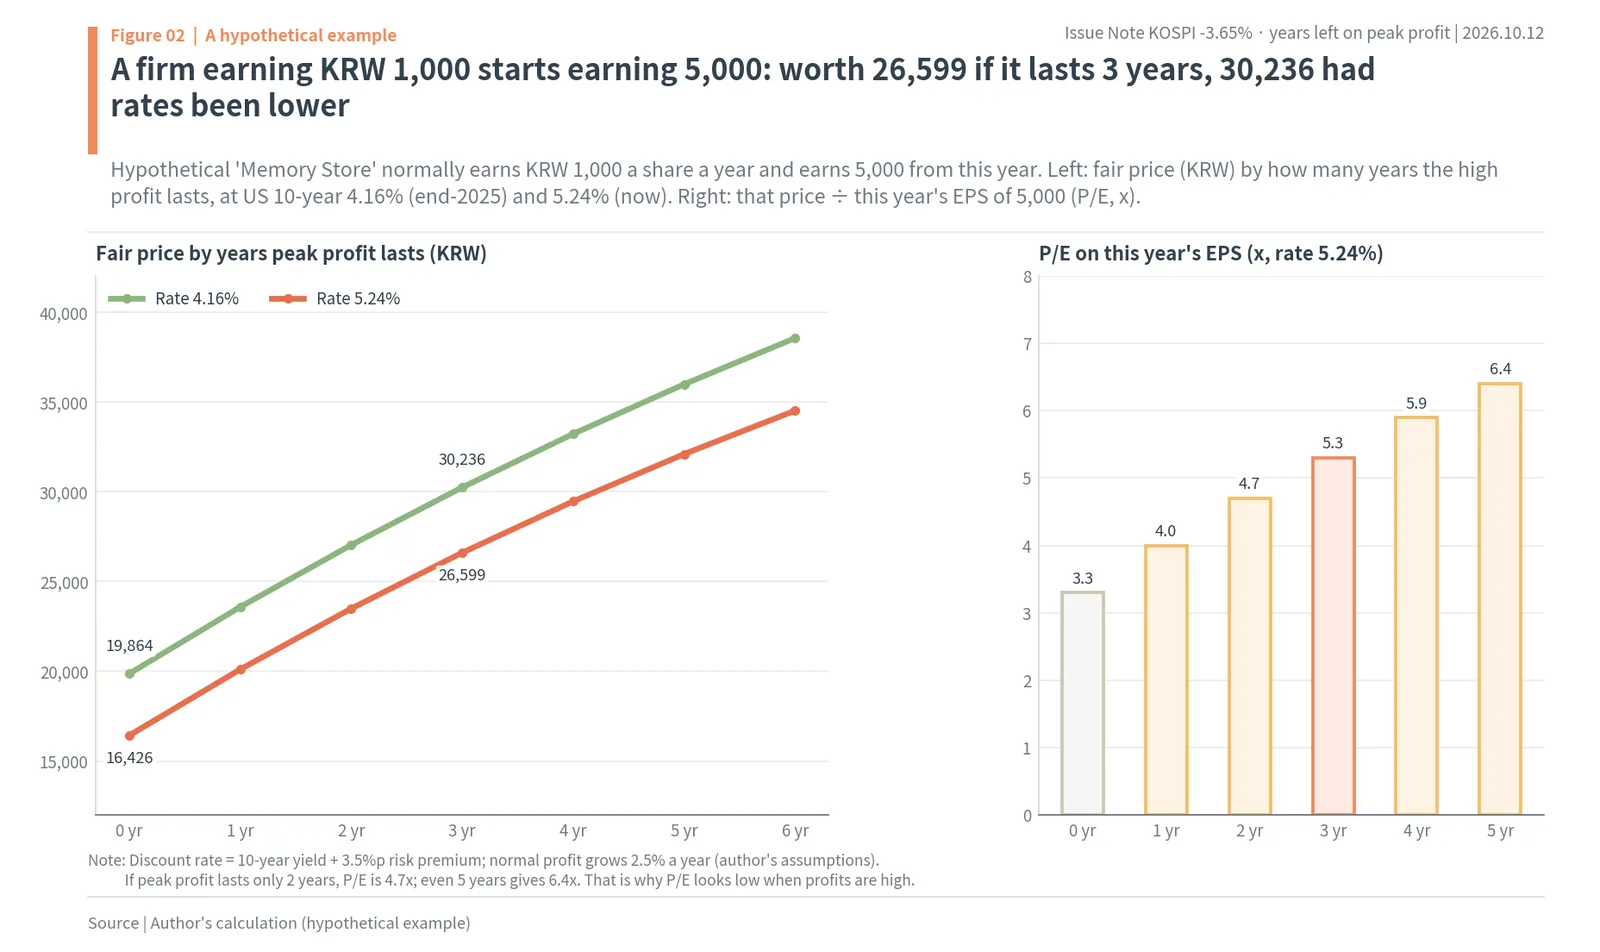
Because this story has many numbers, a hypothetical company shows the principle first. “Memory Store” normally earns KRW 1,000 a share a year. From this year it suddenly starts earning KRW 5,000. Nobody knows how many years the extra KRW 4,000 will last. What should an investor pay for the shares? The author sets the discount rate at the US 10-year yield plus a 3.5 percentage point risk premium and assumes normal profit of KRW 1,000 grows 2.5% a year.
At a 5.24% yield, the discount rate is 8.74%. If the high profit lasts not even one year, that is, only normal profit remains, the fair price is KRW 16,426. If the high profit lasts one year it is KRW 20,105; two years, KRW 23,488; three years, KRW 26,599; five years, KRW 32,090. Doing the same calculation at 4.16% (end-2025), normal profit alone is worth KRW 19,864 and three years of high profit KRW 30,236. For the same three years, the fair price is 12.0% lower just because the rate is 1.08 percentage points higher.
The number that matters here is the P/E. At a 5.24% yield, if the high profit lasts two years, the fair price of KRW 23,488 divided by this year’s profit of KRW 5,000 gives a P/E of 4.7x. Even five years gives only 6.4x. P/E looks low at a profit peak not because the shares are cheap but because investors pay for only a few years of peak profit. The path of this company’s share price follows directly from the calculation. At 5.24%, if the market moves from crediting two years to three, the price rises 13.2%, from KRW 23,488 to KRW 26,599. If it cuts to one year, the price falls 14.4% to KRW 20,105. If the years stay at three and the rate falls to 4.16%, KRW 26,599 becomes KRW 30,236, up 13.7%. Not one earnings figure has changed, yet the share price moves by double digits. The share price of a company at a peak hangs more on the years the market believes in and on interest rates than on this year’s profit. Conversely, from the P/E one can solve for how many years the market is crediting. In Figure 2, the left shows the fair price for each number of years the high profit lasts at two rates, and the right shows that price divided by this year’s profit as a P/E. The rest of this report applies this calculation to the real numbers of Samsung Electronics and SK hynix.
2. KOSPI -3.65% on October 12 and -30.0% since June 22, while the S&P 500 rose
Down 3.65% on the first day back, 30.0% below the June record
To put the conclusion first: October 12 was not a day when world markets fell together but a day when only Korea fell. Reopening after the Hangul Day holiday, the KOSPI opened 0.72% lower and kept falling until the close, ending at 6,384.24, down 241.69 points (3.65%) from the previous session. It was the biggest one-day percentage fall since September 2 (-3.99%) and the first close below 6,400 in two months. The KOSDAQ fell 43.08 points (4.83%) to 849.19. On the KOSPI, 127 stocks rose and 422 fell, and turnover was KRW 21.33tn (about $16.0bn).
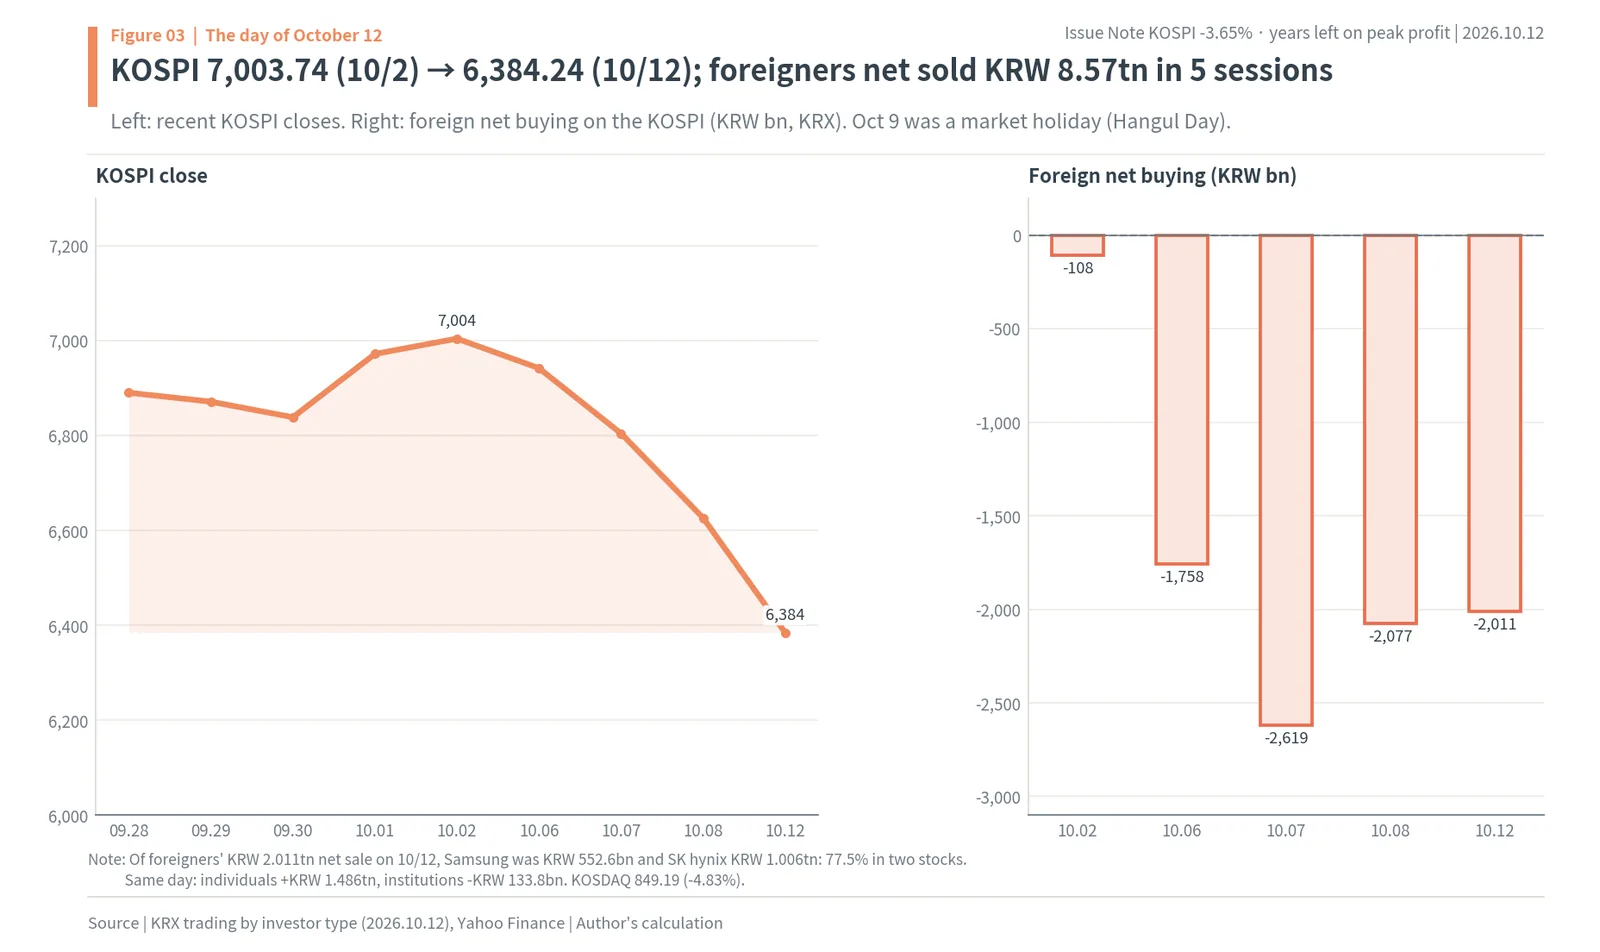
Nor was it just one day. From 7,003.74 on October 2, the KOSPI fell four sessions in a row: 6,941.39 on the 6th, 6,803.90 on the 7th, 6,625.93 on the 8th and 6,384.24 on the 12th. The 8th was the day Samsung Electronics announced third-quarter operating profit of KRW 107.4tn; the KOSPI fell 2.62% that day and foreigners net sold KRW 2.077tn. It was the first day on which a record profit announcement failed to stop the selling. Over the four sessions the index lost 8.85%. Foreigners sold on the KOSPI every day of that stretch. By the KRX tally they net sold KRW 108.0bn on October 2, KRW 1.758tn on the 6th, KRW 2.619tn on the 7th, KRW 2.077tn on the 8th and KRW 2.011tn on the 12th, a total of KRW 8.57tn (about $6.43bn) over five sessions. On the 12th alone, individuals net bought KRW 1.486tn and institutions net sold KRW 133.8bn. In the futures market, foreigners net bought KRW 752.1bn, the opposite of what they did in shares.
In Figure 3, the left shows KOSPI closes from late September to October 12, and the right shows foreign net buying on the KOSPI. The line runs one way down from the October 2 top, and on the same days every foreign bar is below zero. Of the KRW 2.011tn (about $1.51bn) foreigners net sold on October 12, Samsung Electronics accounted for KRW 552.6bn and SK hynix for KRW 1.006tn, 77.5% between the two.
The US and Taiwan rose over the same period
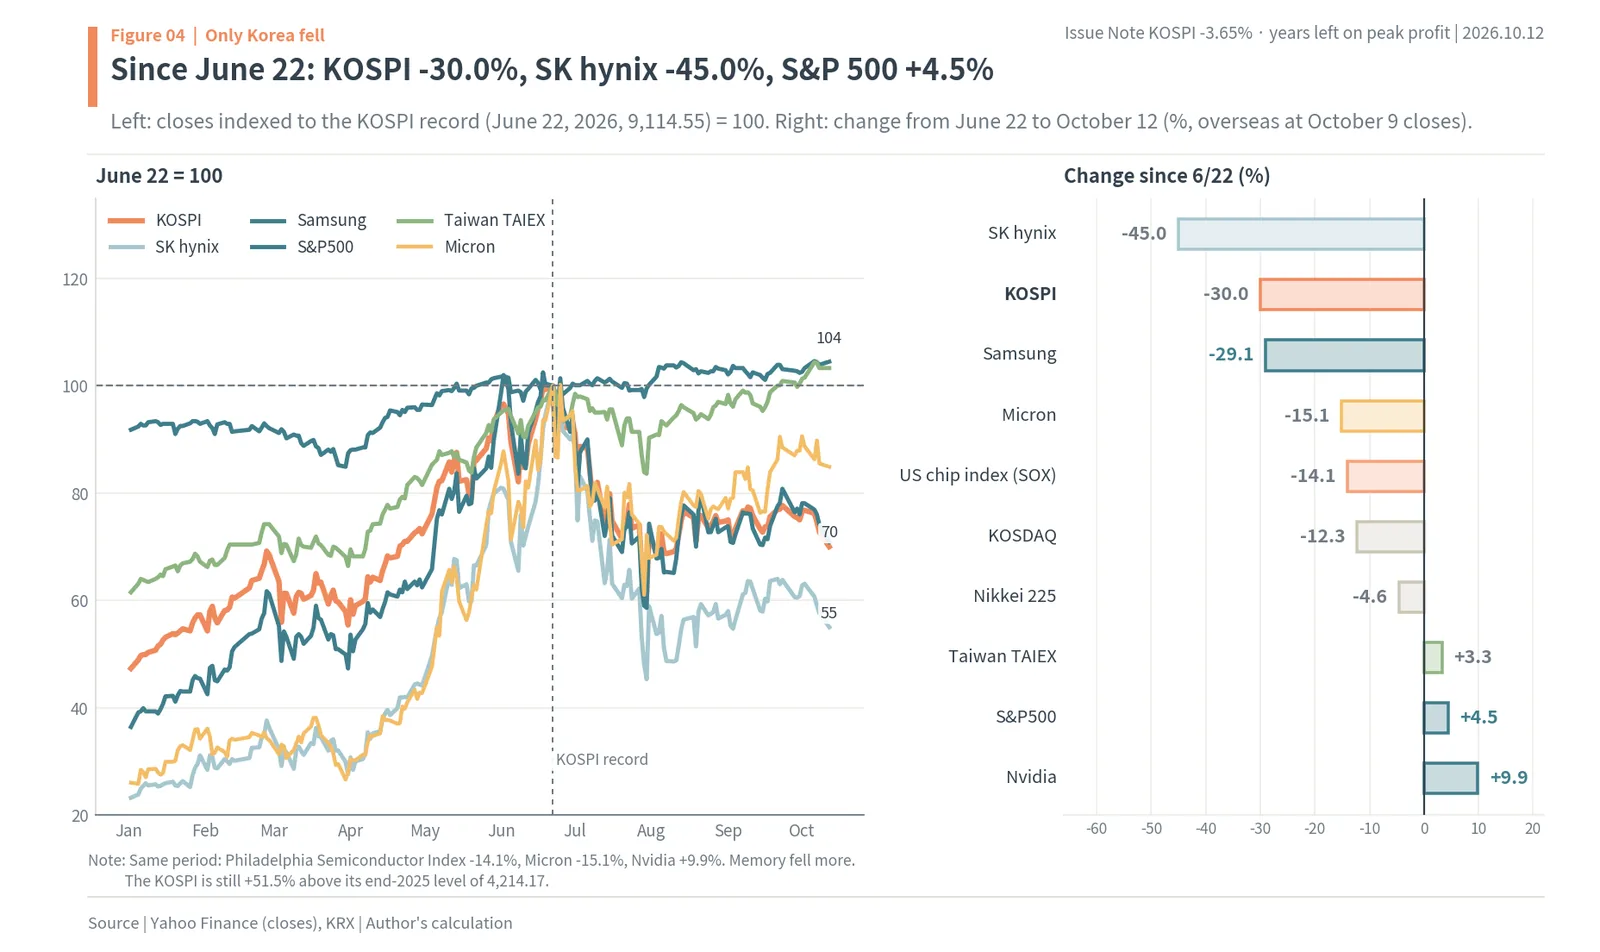
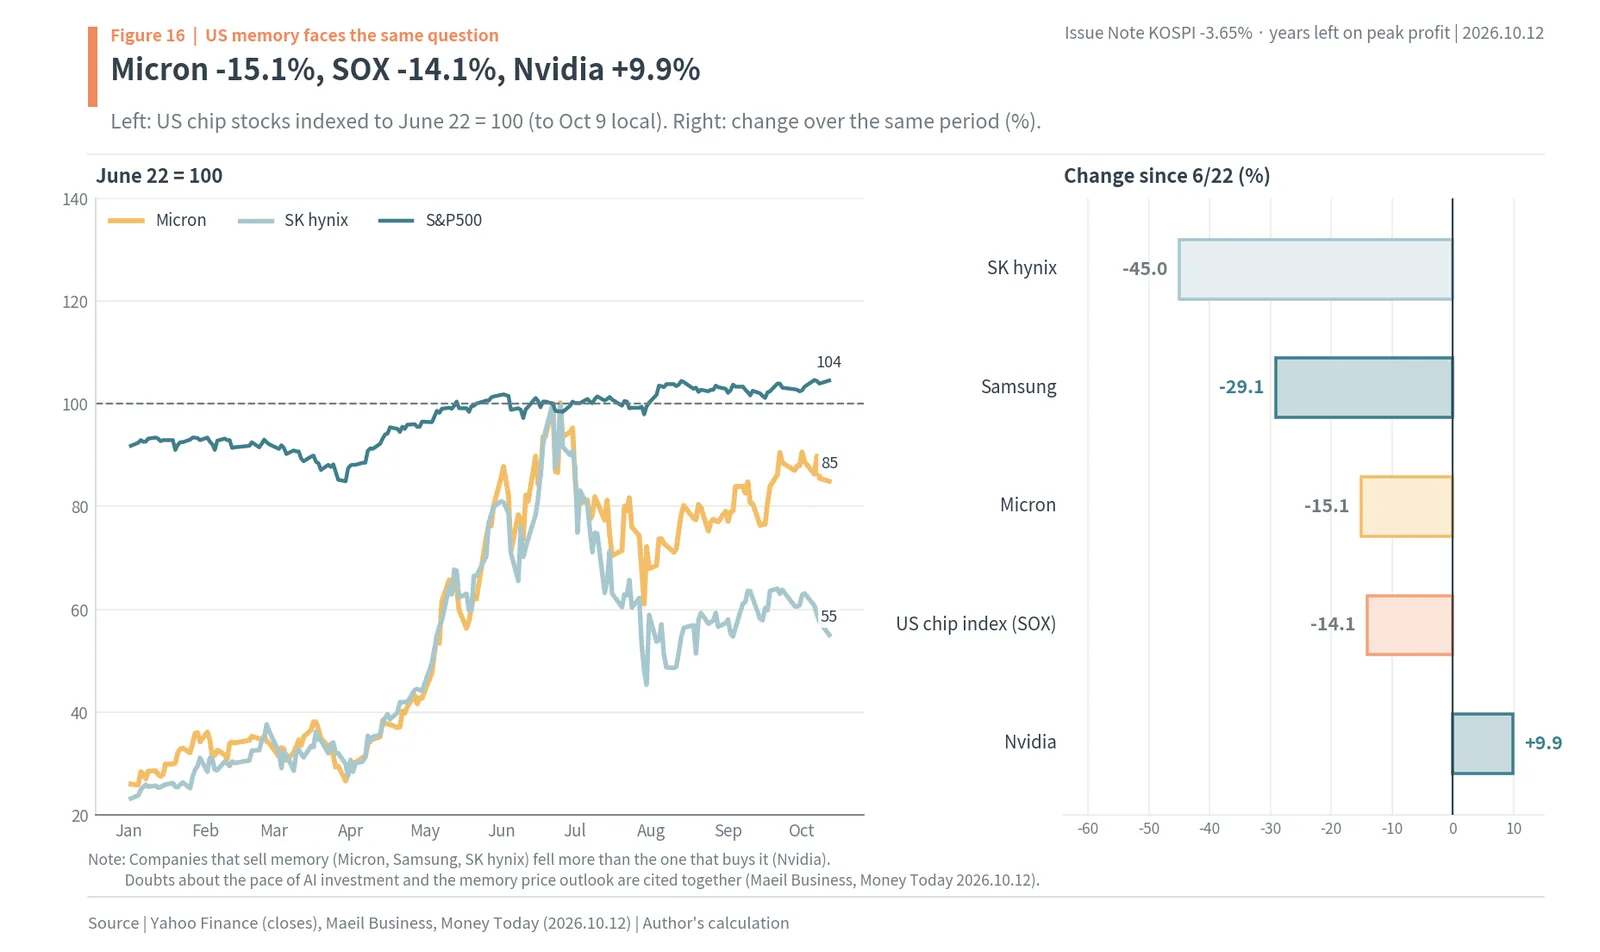
Widen the view and Korea’s solo fall becomes clearer. The KOSPI set an all-time high of 9,114.55 on June 22. From that day to October 12 it fell 30.0%. Over the same period the US S&P 500 rose 4.5%, setting a new record on October 6, and Taiwan’s TAIEX also rose 3.3%, hitting a record on October 6. Japan’s Nikkei 225 fell 4.6%. Within chips the gap was wide too. The Philadelphia Semiconductor Index fell 14.1% and memory maker Micron 15.1%, but Nvidia, which sells AI chips, rose 9.9%. On the Korean side, SK hynix fell 45.0% and Samsung Electronics 29.1%.
The left of Figure 4 shows prices indexed to June 22 = 100. All the lines rise together until June; after the June 22 dotted line the S&P 500 and the TAIEX hold near 100 while the KOSPI, Samsung Electronics and SK hynix split off downward. Micron sits in between. The right lines up the changes over the same period. The companies that sell memory fell the most, and the company that buys memory to make AI chips rose. So it is closer to the facts to read this fall as “doubt about memory profits” rather than “global market risk”. That the KOSPI is still 51.5% above its end-2025 level of 4,214.17 fits this reading. For the year as a whole, the Korean market still reflects a large part of memory profits and is giving back some of it.
The KOSPI has already swung hard this year
In 2026 the KOSPI’s daily moves have been unusually large. It first closed above 5,000 on January 27 and above 6,000 on February 25. On March 4 it fell 12.06% in a single day, the biggest one-day percentage fall on record, then fell 9.99% the day after its June 22 record and 10.84% on July 28. It closed as low as 5,593.56 on July 30 and then rose 17.91% in one day on July 31. Over the three months of the third quarter it fell 17.65%, from 8,303.41 on July 1 to 6,838.04 on September 30. For 38 sessions from August 12 to October 8 it closed between 6,471 and 7,081 (Nocut News), and on October 12 it broke below that range. The Bank of Korea said the KOSPI’s average daily volatility from January to July was 4.1%, the highest among 30 major markets. In a year like this, 3.65% is not a very large number. The KOSPI fell 19.08% in March and 22.19% in July, and the “sidecar”, Korea’s brief halt on program trading after a sharp futures move, was triggered 44 times by July 31. October 12 still drew attention because it came right after record earnings. The next section looks first at how much weight those earnings carry.
3. The KOSPI is memory: Samsung Electronics and SK hynix are half the index
Half the market cap is two stocks
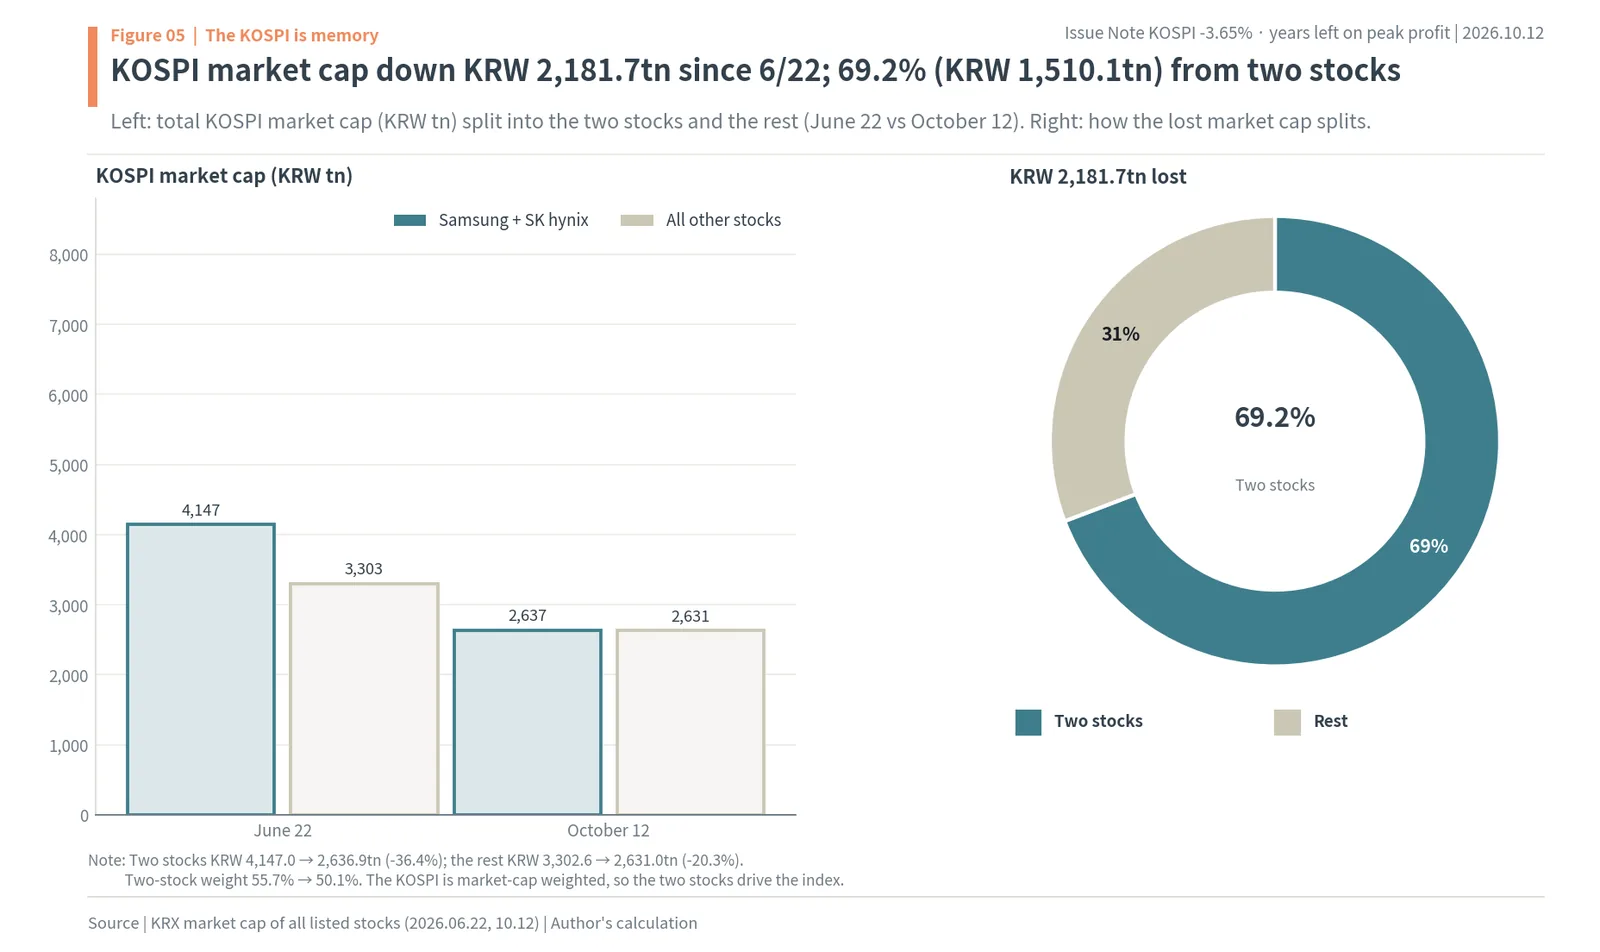
The first link in why only Korea fell is what the KOSPI is made of. The KOSPI is weighted by market capitalization, so big stocks drive the index. Adding up the market cap of every KRX-listed KOSPI stock gives KRW 7,449.6tn on June 22. Of that, Samsung Electronics and SK hynix were KRW 4,147.0tn, or 55.7%. On October 12 the total was KRW 5,267.9tn, and the two stocks KRW 2,636.9tn (about $1.98tn; Samsung Electronics KRW 1,464.5tn, SK hynix KRW 1,172.4tn), or 50.1%. Their weight fell 5.6 percentage points in less than four months, yet it is still half.
The money lost makes the weight even clearer. From June 22 to October 12 the KOSPI’s market cap fell by KRW 2,181.7tn. Of that, the two stocks were KRW 1,510.1tn, or 69.2%. The two stocks’ market cap fell 36.4% and everything else 20.3%. The rest did not fall by little, but more than two-thirds of the force that pulled the index down came from the two stocks. The left of Figure 5 splits market cap on the two dates into the two stocks and the rest, and the doughnut on the right splits the KRW 2,181.7tn that was lost.
Memory prices move both stocks
What moves the two stocks is memory prices and their outlook. Samsung Electronics also sells smartphones and home appliances, but most of its 2026 profit comes from its semiconductor (DS) division, and almost all of SK hynix’s sales are memory. On WISEfn consensus, Samsung Electronics’ 2026 operating margin is 51.97% and SK hynix’s 76.88%. That means more than half of every sale is left as profit, and margins like this only appear when memory prices are very high. So the two companies’ shares are more sensitive to “how long will these prices hold” than to “what is memory worth now”.
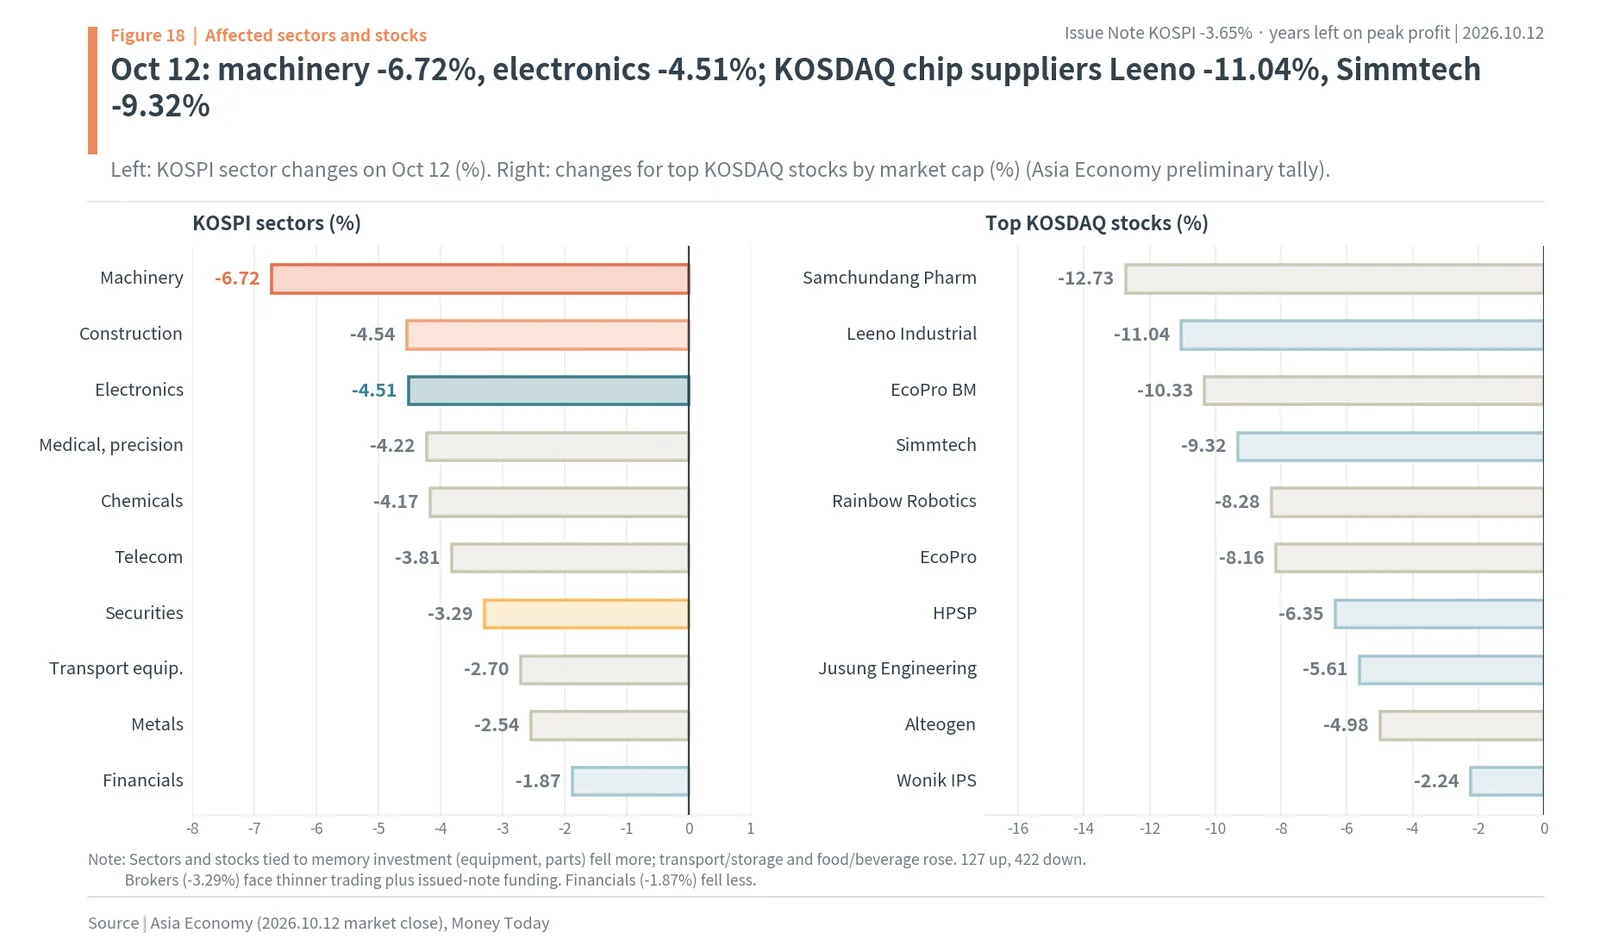
Chip materials, parts and equipment stocks on the KOSDAQ hang on the same thread. When memory makers expand plants, orders for equipment and parts rise, and when they stop expanding, orders fall. On October 12 on the KOSDAQ, Leeno Industrial fell 11.04%, Simmtech 9.32%, HPSP 6.35% and Jusung Engineering 5.61%. Among KOSPI sectors, machinery (6.72%) and electronics (4.51%) also fell sharply, from the same root. When the whole KOSPI leans this heavily on the outlook for one product, memory, growing doubt about how many years memory profits will last shakes the whole index. The next section first looks at how big those profits really are.
Money that came in near the top added to the weight
The two stocks’ weight grew further with money that came in during the first half. On May 27 single-stock leveraged ETFs tracking Samsung Electronics and SK hynix at twice their daily moves were listed, and from listing day to June 19 individuals net bought about KRW 8.2tn of them (Chosun Ilbo). On May 28 the National Pension Service raised its target weight for domestic equities from 14.9% to 20.8%. Individuals net bought KRW 77.49tn (about $58.1bn) on the KOSPI over May and June (KRX). Most of this money came in when the index was around 8,000–9,000, and because half the index weight is the two stocks, most of the buying went into them. When money that bet on a long peak sits near the top, the volume sold back is just as large when doubt about the years grows. The record single-day net sale by individuals on July 31, KRW 10.38tn (including the Nextrade alternative venue, Yonhap; KRW 8.28tn on the KOSPI by KRX count), was another face of the same weight.
4. Record KRW 107.4tn profit, yet 2027 P/E of 3.7x and 3.59x
Samsung Electronics’ quarterly operating profit of KRW 107.4tn
Profits are at a record. On October 8 Samsung Electronics announced preliminary third-quarter results: sales of KRW 195tn and operating profit of KRW 107.4tn (about $80.5bn). It was the first time a Korean company had earned more than KRW 100tn in operating profit in a quarter. Operating profit beat the KRW 106.64tn consensus compiled by FnGuide on October 7 by 0.71%, while sales were 2.81% below the KRW 200.64tn consensus. Yet the shares fell four sessions in a row around the announcement. Samsung Electronics fell 9.2%, from KRW 276,000 on October 2 to KRW 250,500 (about $188) on October 12. SK hynix reports third-quarter results on October 27, and FnGuide’s operating profit consensus is about KRW 77tn. Its shares fell 12.8%, from KRW 1,841,000 on October 2 to KRW 1,605,000 (about $1,203) on the 12th.
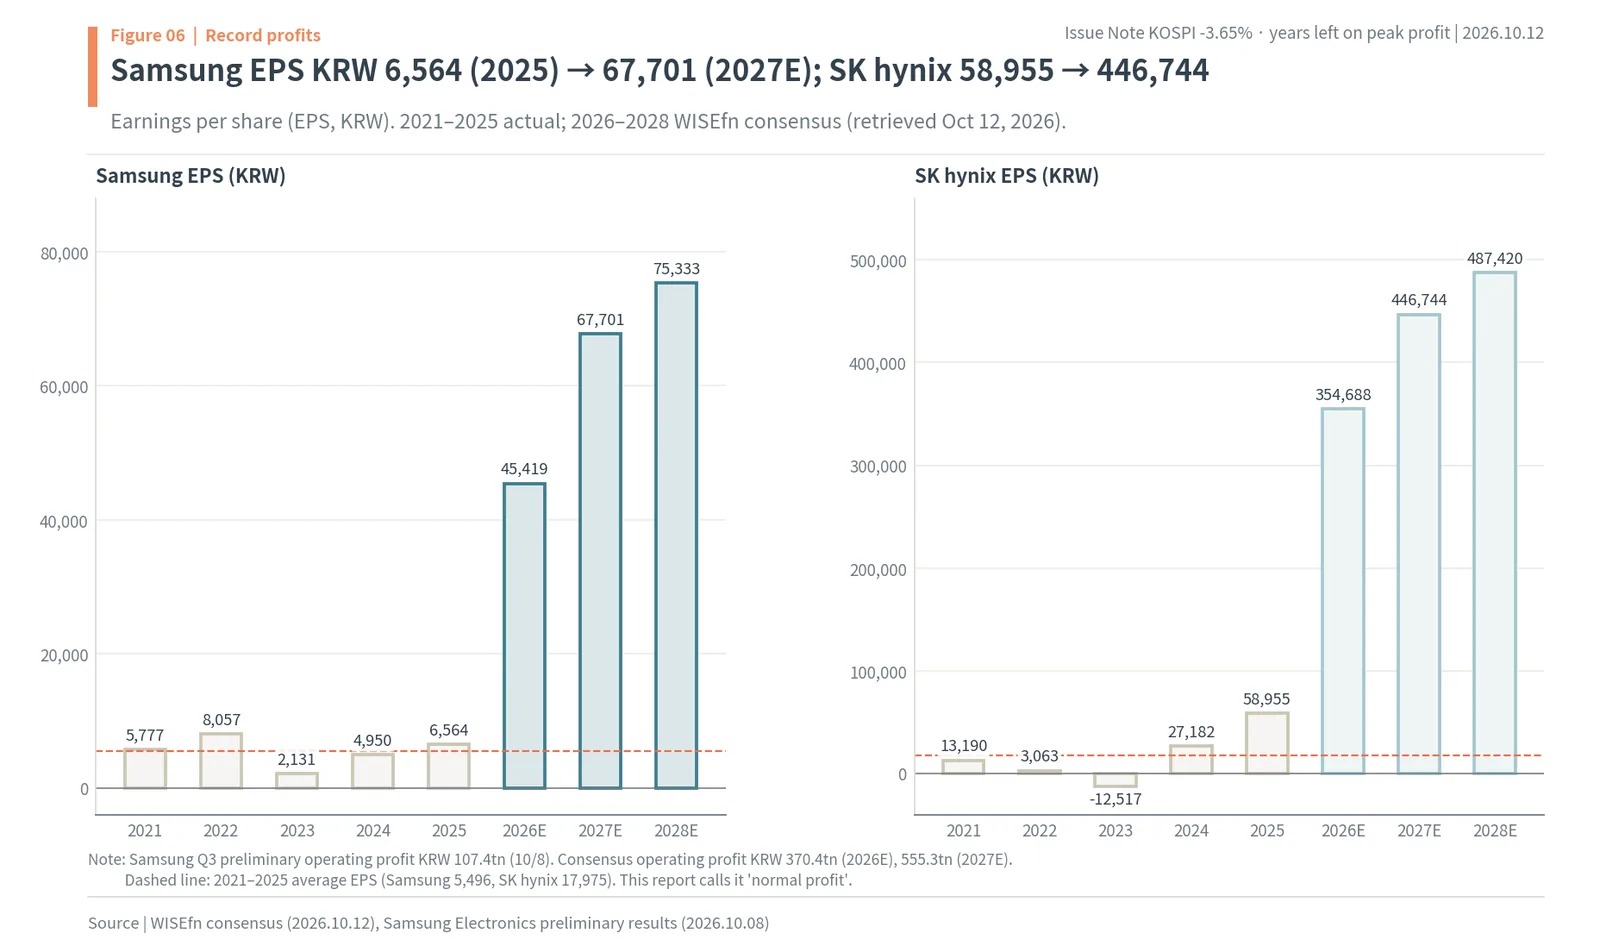
Future profits are larger still. On WISEfn consensus (22 firms), Samsung Electronics’ operating profit goes from KRW 43.6tn in 2025 to KRW 370.4tn in 2026, KRW 555.3tn (about $416bn) in 2027 and KRW 608.2tn in 2028. Its EPS goes from KRW 6,564 in 2025 to KRW 45,419 in 2026, KRW 67,701 in 2027 and KRW 75,333 in 2028. SK hynix’s operating profit goes from KRW 47.2tn in 2025 to KRW 263.3tn in 2026 and KRW 402.0tn in 2027, and its EPS from KRW 58,955 to KRW 354,688, KRW 446,744 and KRW 487,420. Figure 6 draws both companies’ EPS as bars from 2021 to 2028. The 2021–2025 bars are barely visible next to the 2026 bar. The dashed line is the 2021–2025 average EPS: KRW 5,496 for Samsung Electronics and KRW 17,975 for SK hynix. This report treats this average as “normal profit”, because it is the average of five years that went through one good memory year and one bad one.
Quarterly profit climbed like stairs for five quarters
By quarter, the speed of the rise is easier to see. In WISEfn’s quarterly table, Samsung Electronics’ operating profit was KRW 4.7tn in Q2 2025, KRW 12.2tn in Q3, KRW 20.1tn in Q4, KRW 57.2tn in Q1 2026 and KRW 89.5tn in Q2, and the Q3 preliminary figure is KRW 107.4tn. It grew 22.9-fold in five quarters. SK hynix was KRW 9.2tn in Q2 2025, KRW 11.4tn in Q3, KRW 19.2tn in Q4, KRW 37.6tn in Q1 2026 and KRW 60.5tn in Q2, with Q3 consensus at about KRW 77tn. Q4 2026 EPS consensus is KRW 14,612 for Samsung Electronics and KRW 90,327 for SK hynix, higher than Q3. In the quarterly numbers there is no sign of a turn yet. So the market’s doubt is aimed not at the current quarters but at the years after. That the shares came down from their June record while quarterly profit climbed like stairs means the market is asking not how high the steps are but how many steps are left.
2027 P/E of 3.7x and 3.59x
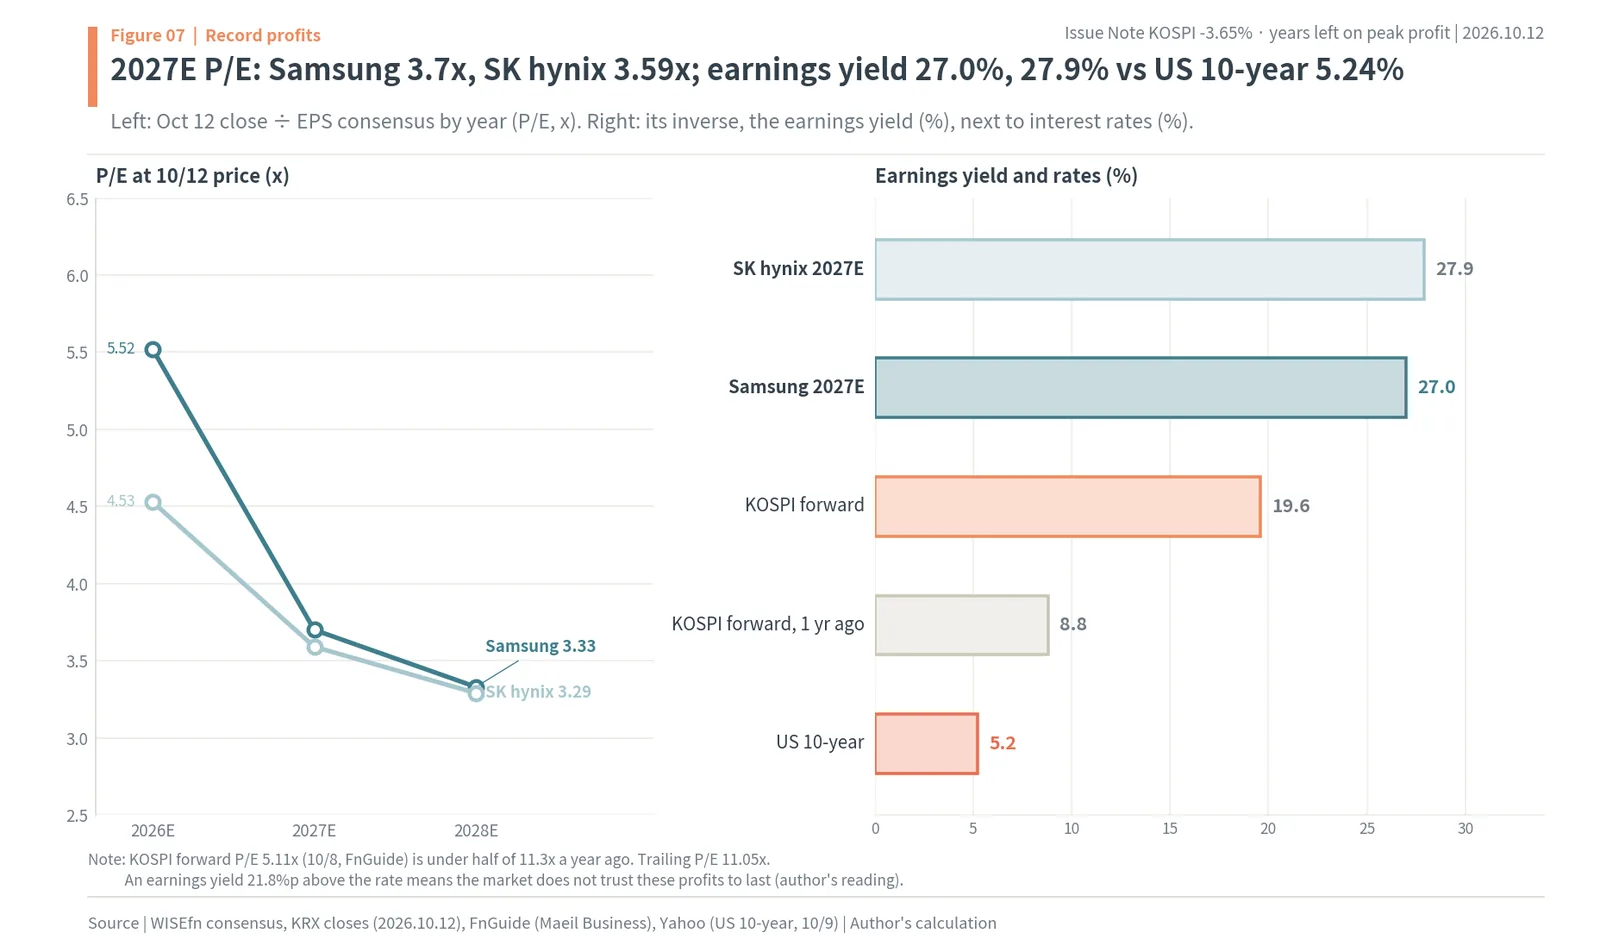
Put profits next to share prices and a strange number appears. Dividing the October 12 close by each year’s EPS consensus gives Samsung Electronics a P/E of 5.52x for 2026, 3.70x for 2027 and 3.33x for 2028. SK hynix is at 4.53x, 3.59x and 3.29x. As earnings yields, on 2027 numbers Samsung Electronics is 27.0% and SK hynix 27.9%. That is more than 21 percentage points above the US 10-year yield of 5.24%. The KOSPI as a whole is the same. The KOSPI 12-month forward P/E compiled by FnGuide was 5.11x on October 8, under half of 11.30x a year earlier. The trailing P/E on the exchange’s basis is 11.05x, the lowest since January 6, 2023.
The left of Figure 7 shows the two companies’ P/E falling year by year, and the right puts earnings yields next to the US 10-year yield. A gap this wide between a 27% earnings yield and a 5% government bond yield means the market does not take consensus profits at face value. If it did, there would be no reason to leave such a high earnings yield on the table. That leaves one of two explanations. Either profit estimates are too high, or profits will be high but not for long. Peak profits are not wrong numbers in themselves, so what the market doubts is mostly the second: how many years these profits will last.
Brokers’ target prices are almost double the share price
Brokers see it differently. The average of 22 Samsung Electronics target prices gathered by WISEfn over the last 92 days is KRW 495,227 (about $371), 1.98 times the October 12 close. The highest is KRW 650,000 and the lowest KRW 270,000. In its report for the first week of October, Daishin Securities put Samsung Electronics’ 2026 operating profit at KRW 367.7tn with EPS of KRW 43,587, and 2027 at KRW 549.2tn with EPS of KRW 62,394. Even on these EPS figures, the October 12 share price gives a P/E of 5.7x for 2026 and 4.0x for 2027 (author’s calculation). Daishin said a KOSPI forward P/E of 6x equates to an index level of 7,600 and set a six-month KOSPI range of 6,300–9,300. Brokers look at the profit numbers; the market looks at how long those profits live. SK hynix is the same. The average of its 22 target prices over the last 92 days is KRW 3,253,182 (about $2,439), 2.03 times the October 12 close, with a high of KRW 4,700,000 and a low of KRW 1,480,000. Of the 22, two raised their target, three cut it and 17 kept it. The gap between the two views shows up as the distance between a P/E in the 3s and target prices at double the share price. The next section turns the life the market is pricing into numbers.
5. How many years of peak profit the shares price in: 2.6 and 3.2
Share price = value of normal profit + years of peak profit
Plug the two companies’ real numbers into the hypothetical company’s calculation from Section 1 and the number of years the market is pricing in falls out. The author’s model works like this. First, assume normal profit (2021–2025 average EPS) grows 2.5% a year forever and find its value. The discount rate is the US 10-year yield plus a 3.5 percentage point risk premium. At a 5.24% yield the discount rate is 8.74%, and normal profit is worth 16.4 times normal EPS. Next, count the part above normal profit separately as peak profit. The Q4 2026 EPS consensus (Samsung Electronics KRW 14,612, SK hynix KRW 90,327) minus a quarter of normal profit, and the 2027 and 2028 EPS consensus minus normal profit, come in one after another, and from 2029 the 2028 amount is assumed to continue. The share price is then calculated for different numbers of years of peak profit (the “years left”), and the number of years that matches today’s share price is found.
Start with Samsung Electronics. Normal EPS of KRW 5,496 is worth KRW 90,276 a share (about $68). That is 36.0% of the October 12 close of KRW 250,500. The other 64.0% is peak profit, and the number of years that fills it is about 2.6. If peak profit lasts one year the model price is KRW 160,445; two years, KRW 219,507; three years, KRW 273,822 (about $205). Today’s price lies between two and three years. The market, in effect, expects Samsung Electronics to earn peak profit for a little over two and a half years after Q4 2026 and then return to normal profit. The left of Figure 8 is a surface of US 10-year yield (across) × years of peak profit (depth) → model price (height), and the translucent plane is today’s price of KRW 250,500. Every point on the thick line where the plane meets the surface is a pair of rate and years that explains today’s price. The right shows the model price by years at two rates.
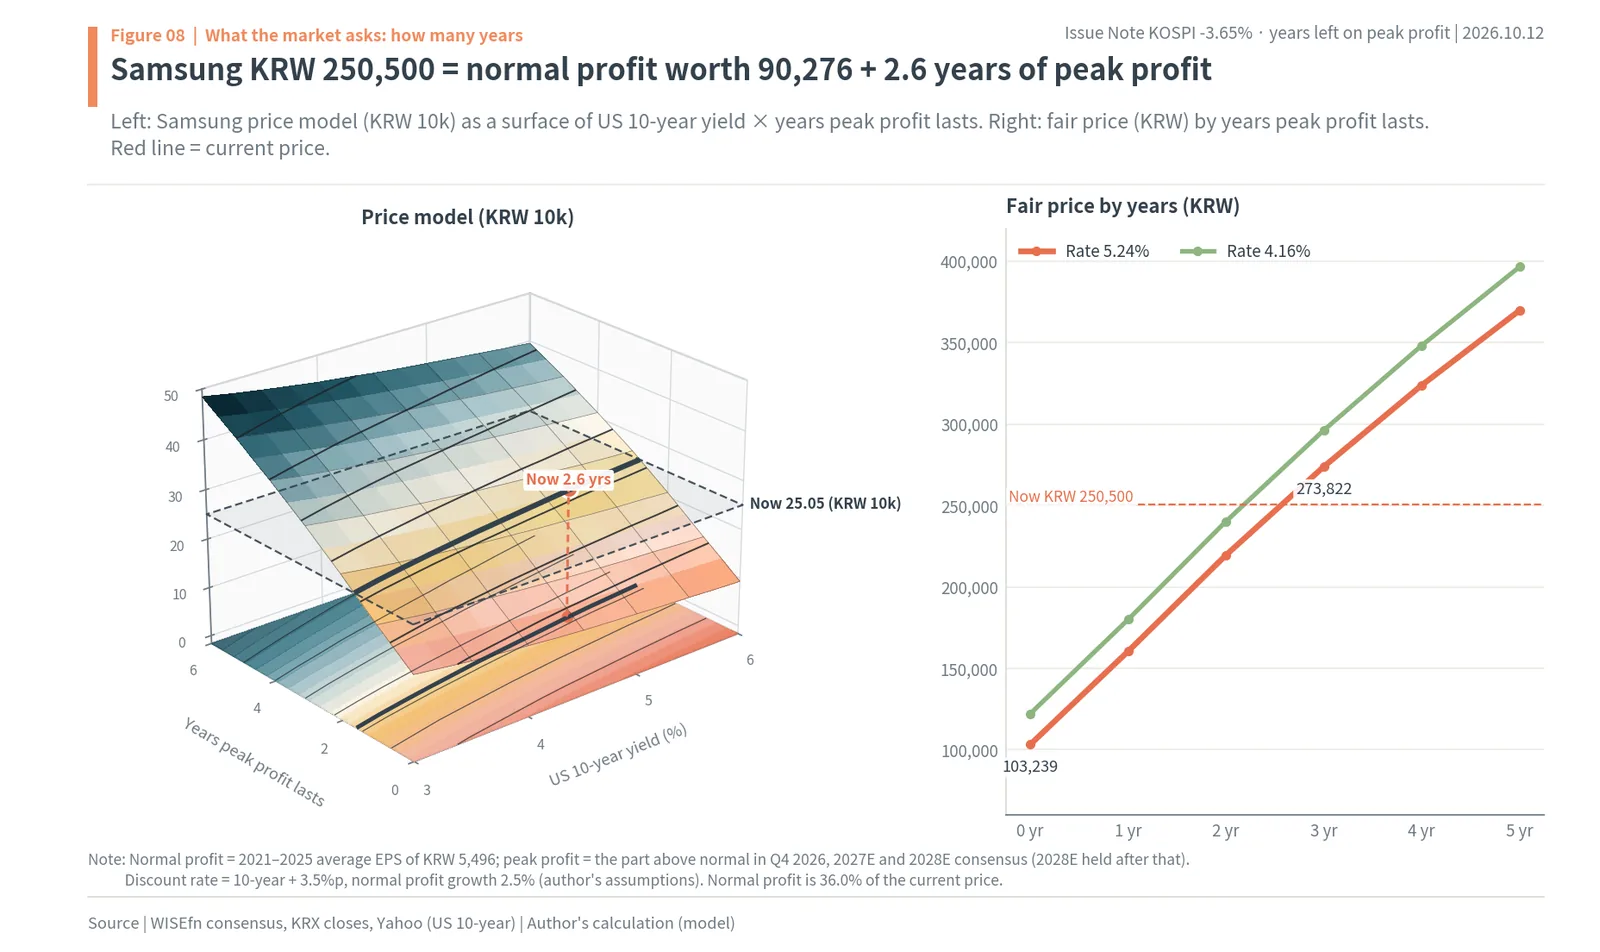
81.6% of SK hynix’s share price is peak profit
At SK hynix, peak profit weighs even more. Normal EPS of KRW 17,975 is worth KRW 295,256 a share (about $221), only 18.4% of the October 12 close of KRW 1,605,000. 81.6% of the share price is peak profit. If peak profit lasts one year the model price is KRW 773,617; two years, KRW 1,170,631; three years, KRW 1,535,736; four years, KRW 1,871,495 (about $1,403). The number of years that fills today’s price is about 3.2. The market credits it with slightly more years than Samsung Electronics. The author reads that as reflecting the high share of volumes contracted in advance, such as HBM.
The left of Figure 9 shows SK hynix’s model price by years, and the right compares the two companies’ years at two rates. Figure 10 draws the same surface for SK hynix and a contour map of Samsung Electronics’ surface seen from above. In the contour map, the lines are packed along the years axis. That means one more year of peak profit changes the share price far more than a 1 percentage point change in rates. In the Samsung Electronics model, keeping the rate at 5.24% and raising the years from two to three lifts the price 24.7%, from KRW 219,507 to KRW 273,822. Keeping the years and raising the rate from 4.16% to 5.24% lowers the price 7.9%.
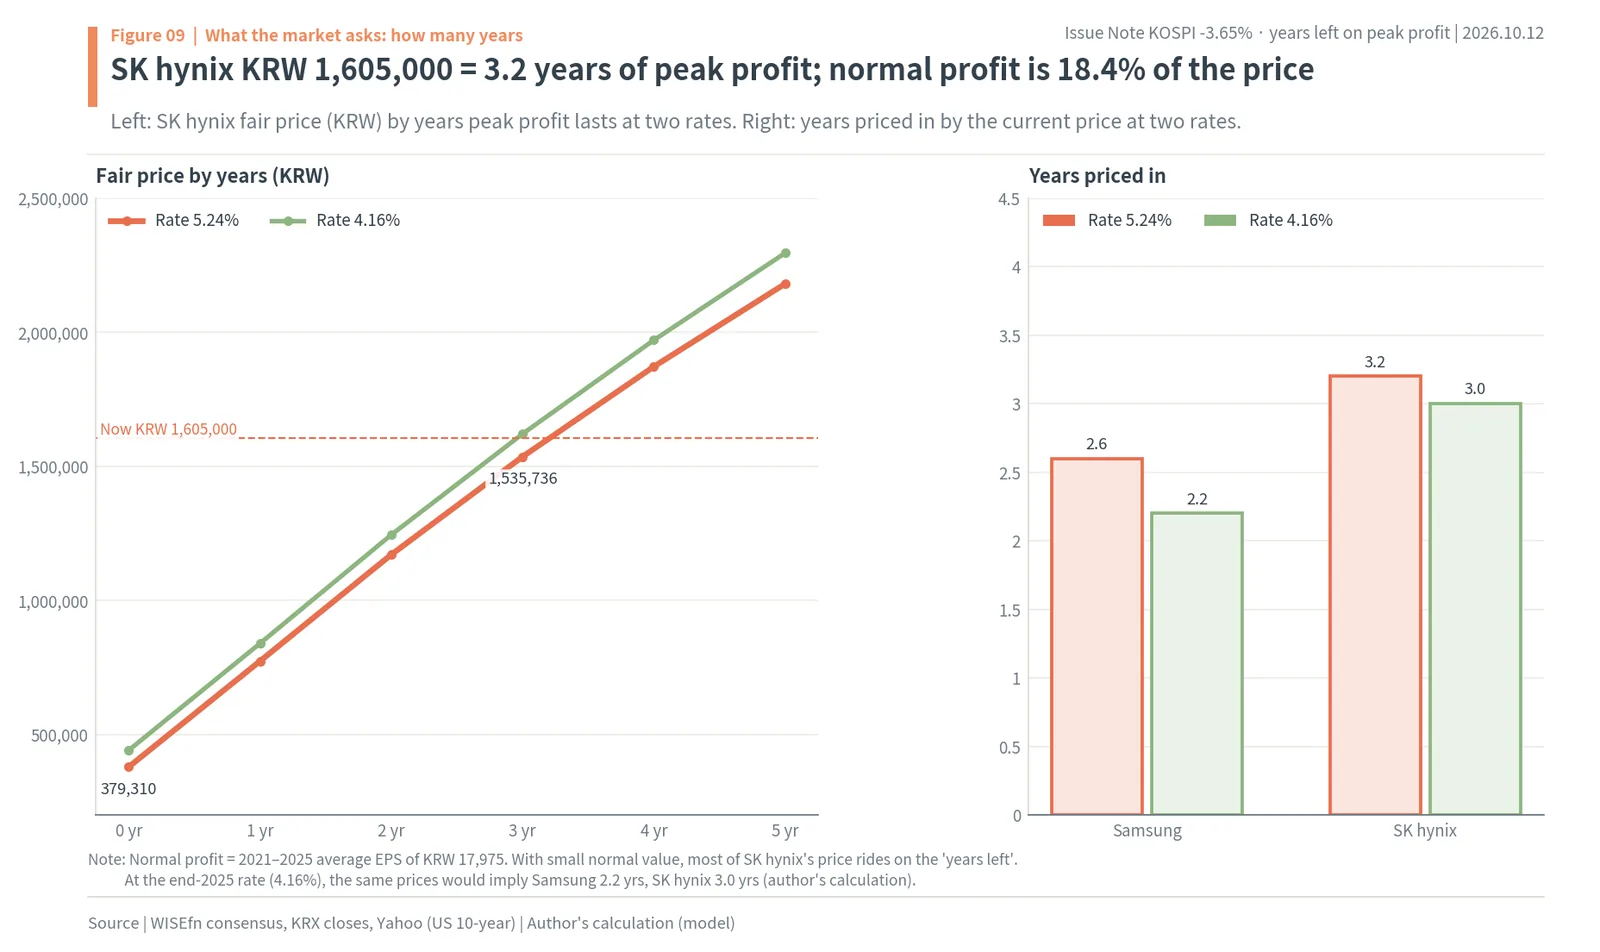
Change the assumptions and the years stay at two to three
The biggest assumption in the model is the 3.5 percentage point risk premium. Lowering it to 3.0 points lowers the discount rate and raises the value of normal profit, so the years needed to explain the same price shorten to 2.4 for Samsung Electronics and 3.1 for SK hynix. Raising it to 4.0 points lengthens them to 2.7 and 3.3. Even swinging the risk premium across a 1 point range, both companies stay at two to three-something years. Taking normal profit as the 2021–2025 average is also an assumption; setting normal profit higher makes its share bigger and the years shorter. Whichever way the assumptions go, the conclusion is the same: the market is not crediting more than three or four years of peak profit.
The years left are the key to today’s price
What this calculation says is simple. What moves the two companies’ shares most now is not the quarterly numbers already out but the market’s belief about how many years peak profit will continue. Third-quarter operating profit of KRW 107.4tn is already in the share price as part of 2026. Beating consensus by 0.71% does not add years. What adds years is evidence that profits like today’s will also come in 2027 and 2028, that is, contracts that fix next year’s volumes in advance, and their prices. What cuts years is the opposite: signs that supply will grow and memory prices could fall. The doubts about the pace of AI investment and the chance of Chinese memory makers gaining share, both cited during the October 12 fall, are stories on the side of fewer years. The left of Figure 10 shows SK hynix’s model price in units of KRW 100k (today’s KRW 1,605,000 is 16.05 on that scale), and the right shows Samsung Electronics’ surface from above in units of KRW 10k.
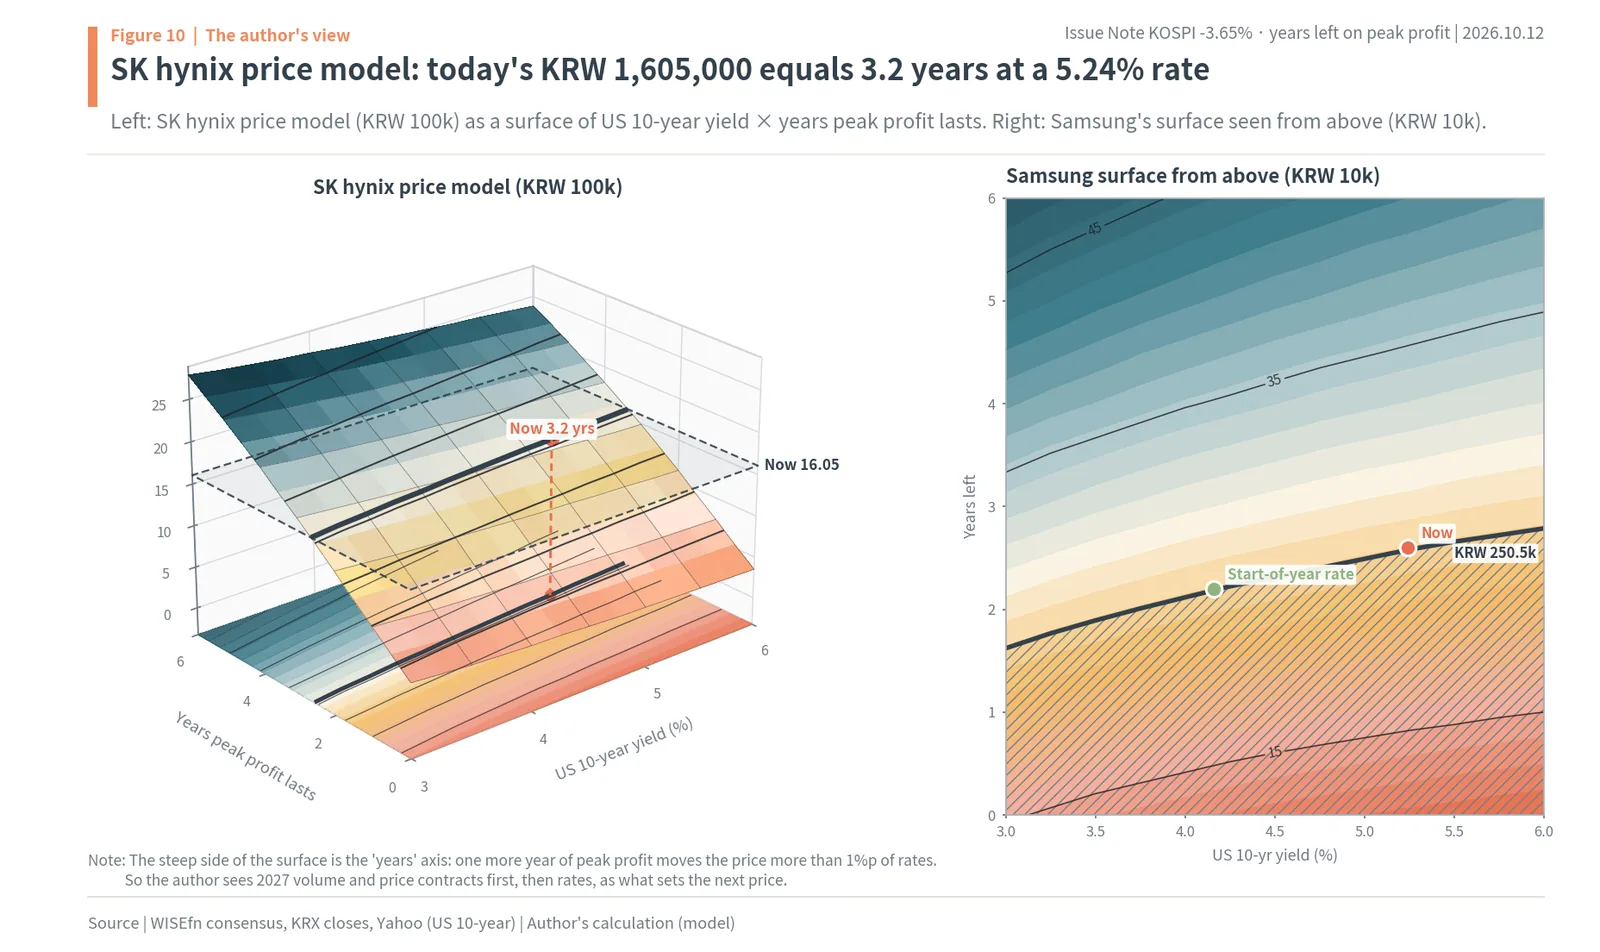
6. The US 10-year at 5.24% cuts the value of each year
The US 10-year went from 4.16% at the start of the year to 5.24%
Even with the same number of years, rates set the value of each one. The US 10-year Treasury yield was 4.16% at the end of 2025, fell as low as 3.97% on February 27 and then rose again. On June 22, when the KOSPI hit its record, it was 4.51%. On US Treasury closing data it first went above 5% on September 15, reached 5.29% on September 30 and a year high of 5.31% on October 5. While Korea was on holiday it closed at 5.22% on October 8 and 5.24% on October 9. Intraday, it was reported to have touched 5.342% on October 1, the highest since 2002.
Behind the rise are inflation and central banks. On September 16 the Federal Reserve raised its policy rate by 0.25 percentage point to 3.75–4.00%. It was the first hike since July 2023, and the vote was unanimous. In the dot plot released with it, members’ median policy rate for the end of 2026 was 4.1%, up from 3.8% in June, and their 2026 personal consumption expenditures (PCE) inflation forecast was 3.7%. Chair Warsh said inflation had been too high and had lasted too long (as reported by Korea Financial Newspaper). On the upper bound of the policy rates, the Korea-US gap is 1.00 percentage point. The Bank of Korea also raised its base rate in both July and August, to 3.00%. Korean government bond yields are high too: on October 8 the three-year was 3.983% and the ten-year 4.395%. Brent crude rose 3.7% in a day to $103.92 a barrel on October 8. Chicago Mercantile Exchange rate futures were reported to put the chance of another hike in October at 17–19% and of a hike by December at 81–86%. The left of Figure 11 shows the US 10-year yield since 2023. There is a peak when it rose to 4.99% on October 19, 2023 and fell back to 3.87% by year-end, and today’s level has passed that peak. The market’s path at that peak also resembles today’s. In 2023 the KOSPI fell 14.6%, from 2,667.07 on August 1 to 2,277.99 on October 31, and the S&P 500 fell 10.3%, from 4,588.96 on July 31 to 4,117.37 on October 27. When the 10-year yield came down to 4.37% at the end of November and 3.88% at year-end, the KOSPI rose 16.6% to 2,655.28 on December 28, and the S&P 500 rose 8.9% in November alone to end the year at 4,769.83. It is a case showing that when rates come down from a peak, the value of the same profits comes back.
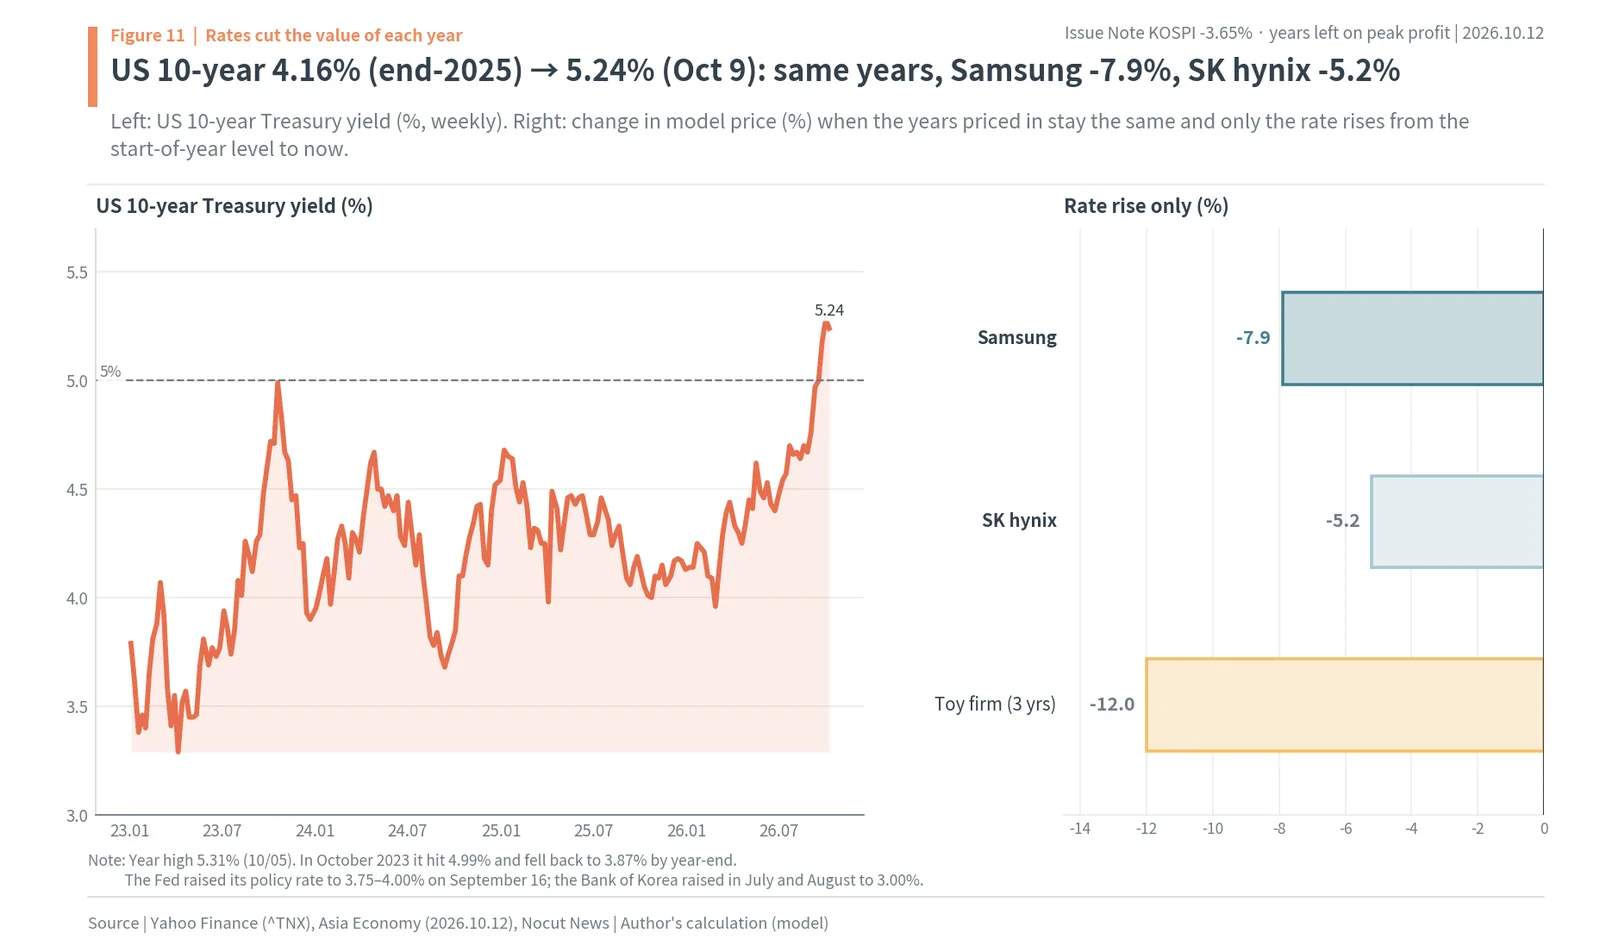
Same years, Samsung -7.9%, SK hynix -5.2%
Rates cut share prices through the discount rate. When the discount rate rises, profits received in later years lose more of their present value. In the author’s model, keeping the years priced in today (Samsung Electronics 2.6, SK hynix 3.2) and raising only the rate from 4.16% to 5.24% lowers Samsung Electronics’ model price by 7.9% and SK hynix’s by 5.2%. Samsung Electronics is cut more because normal profit makes up a larger share of its price (36.0%). Normal profit is assumed to continue forever, so it is the most sensitive to the discount rate. The hypothetical Memory Store also lost 12.0% at three years. The right of Figure 11 shows these three numbers.
It can be read the other way too. Had the rate still been 4.16%, as at the end of 2025, today’s share prices would imply 2.2 years for Samsung Electronics and 3.0 for SK hynix. Because rates are higher, the market now needs peak profit to last a little longer to justify the same price. Rates add one more weight to the doubt about the years. It is worth noting how much the model price moves depending on where rates go. Keeping today’s years and letting the US 10-year fall to 4.5% would raise Samsung Electronics’ model price to KRW 264,514, 5.6% above today, and SK hynix’s to KRW 1,662,504, 3.6% higher. If it rose to 6.0%, Samsung Electronics would be KRW 238,821 (-4.7%) and SK hynix KRW 1,555,116 (-3.1%). A 0.7–0.8 point move in rates makes a 3–6% difference in the share price. Since September 15, when the US 10-year went above 5%, the KOSPI’s highest close was 7,080.92 on September 23; it never got above that and slid to 6,384.24 by October 12.
A 5% fixed rate raises the bar for shares
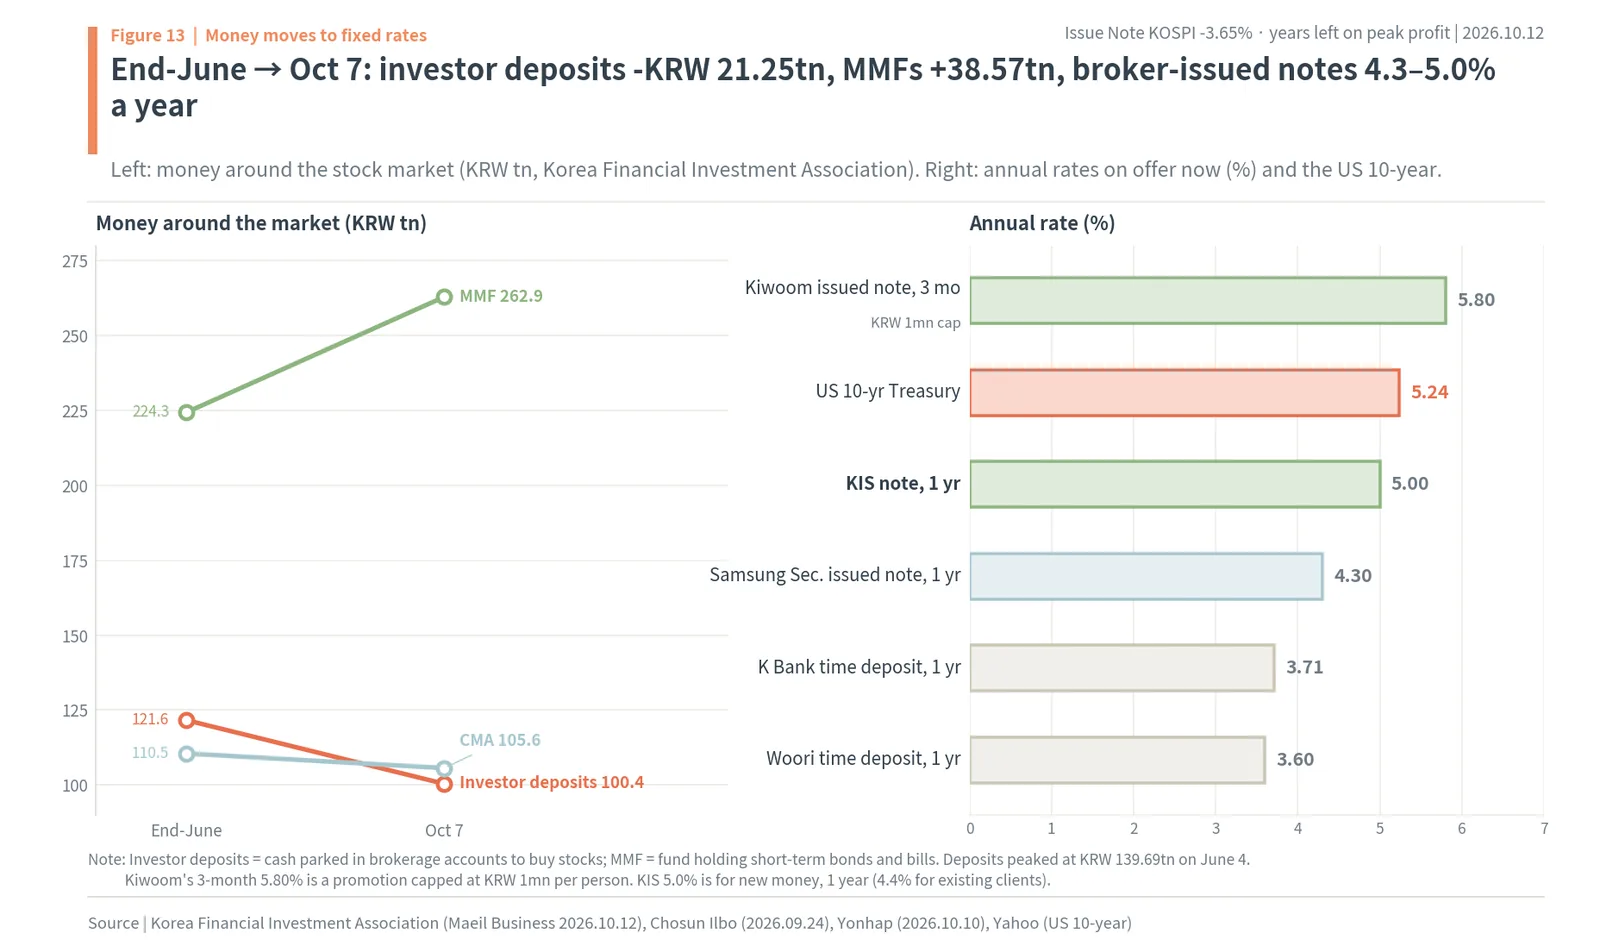
When rates rise, the products that compete with shares get better too. Korea Investment & Securities is running a promotion on issued notes until the end of the month, paying 5.0% a year for one year and 4.7% for six months on new money. Samsung Securities offered a one-year issued note at 4.3% with a KRW 100bn limit, and its first KRW 100bn tranche sold out in two and a half days. Kiwoom Securities sells a three-month note at 5.80% before tax, capped at KRW 1mn per person. Bank one-year time deposits pay 3.60% at Woori and Hana, 3.50% at Shinhan and KB Kookmin, and 3.71% at K Bank. When investors can earn 4–5% a year without risk, they demand a much higher return from shares. The more doubtful a stock’s years of peak profit, the higher that demand. The next section looks at where the money actually went.
7. Foreign selling, MMFs, issued notes and Korean buying of US stocks
Foreigners net sold KRW 198.4tn of KOSPI shares this year
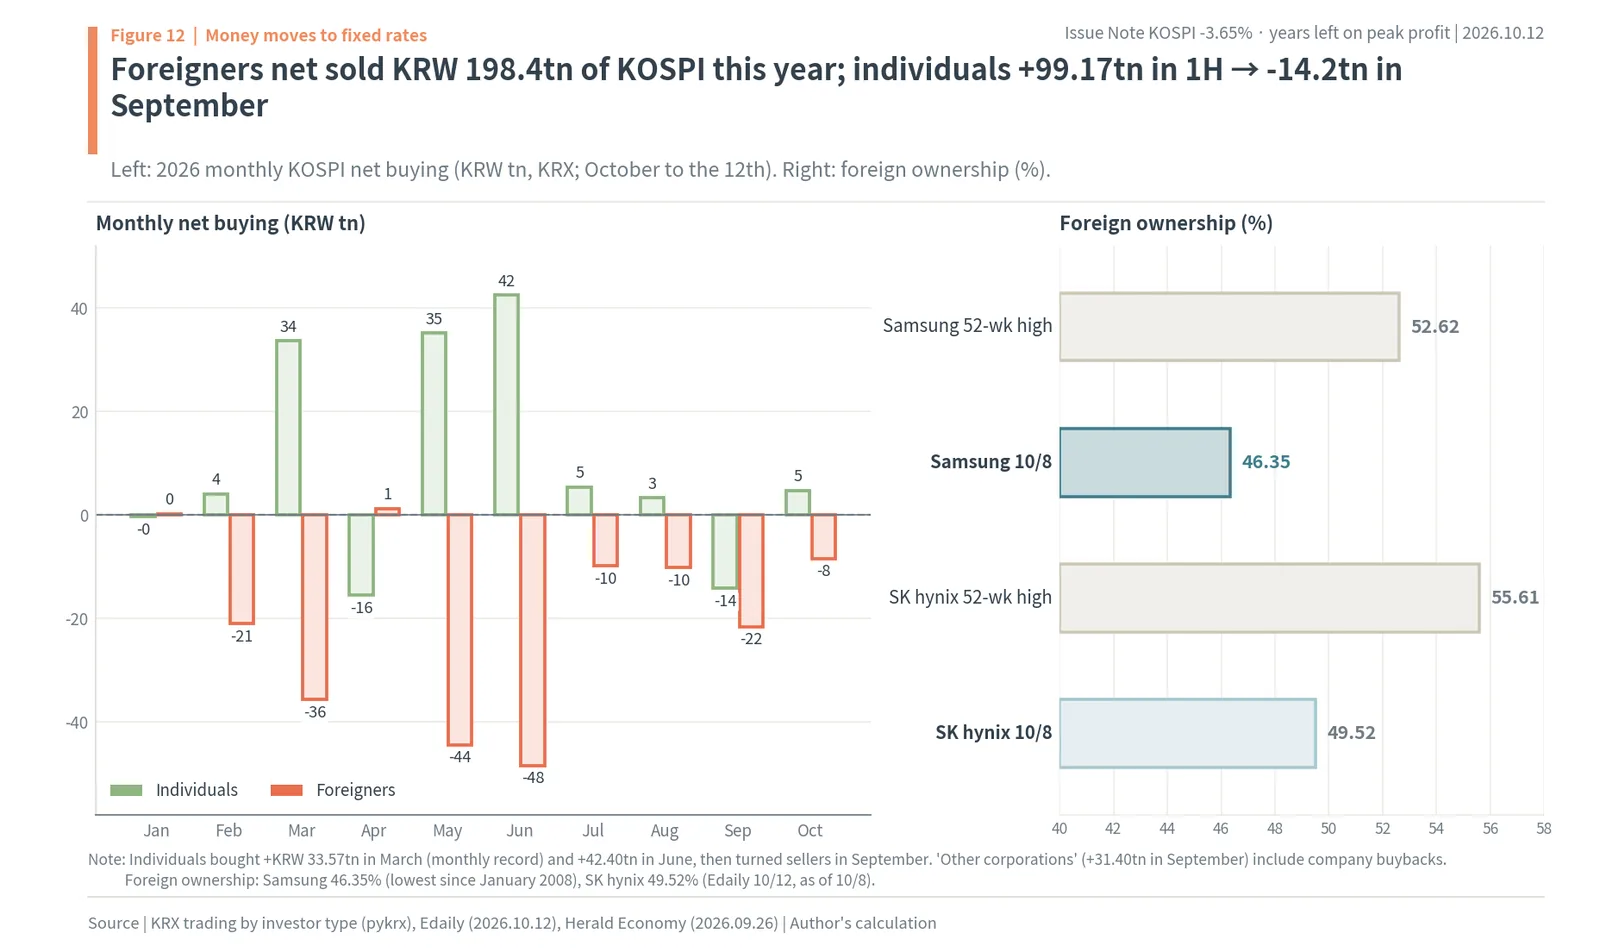
Doubt about the years and high rates showed up in actual money flows. The biggest seller is foreigners. By KRX trading-by-investor data, foreigners net sold KRW 198.4tn (about $149bn) on the KOSPI from January to October 12, 2026. They were net buyers in only two months, January (KRW 0.15tn) and April (KRW 1.23tn). They sold KRW 21.06tn in February, KRW 35.75tn in March, KRW 44.46tn in May and KRW 48.43tn in June, and after the KOSPI came off its record, KRW 9.86tn in July, KRW 10.17tn in August, KRW 21.59tn in September and KRW 8.45tn through October 12. As a result, foreign ownership of Samsung Electronics fell to 46.35% on October 8, the lowest since January 2008 (Edaily). Its 52-week high was 52.62%. SK hynix fell to 49.52% from a 52-week high of 55.61%. On KRX stock data for October 12, ownership was lower still: 46.31% for Samsung Electronics and 49.43% for SK hynix.
In the first half, individuals took that stock. Individuals net bought KRW 99.17tn (about $74.4bn) on the KOSPI from January to June, and March’s KRW 33.57tn was a monthly record. They bought most when the index was highest: KRW 35.09tn in May and KRW 42.40tn in June. Buying shrank to KRW 5.37tn in July and KRW 3.24tn in August and turned into a KRW 14.20tn net sale in September, the first monthly net sale in five months, since April. In October they bought again, KRW 4.65tn through the 12th. Individuals’ trading record has not been good. On figures compiled by the Chosun Ilbo, through September 23 this year the average KOSPI on days individuals were net sellers was 6,366.64, and on days they were net buyers 6,659.58. They bought high and sold low; this gap, annualized as a “trading score”, was -4.41%, the second worst since records began in 1998 after 1999 (-4.65%). On the same calculation foreigners scored +6.14%. On Hana Securities’ tally, individuals’ cumulative net buying while the KOSPI was between 7,000 and 9,000 was about KRW 83.6tn. On May 27, 2x single-stock leveraged ETFs on Samsung Electronics and SK hynix were listed, and from listing day to June 19 individuals net bought about KRW 8.2tn of them. Buying on borrowed money comes back as forced selling in a sharp fall. Daily average forced selling of margin and stock-backed loans at ten brokers rose from KRW 2.947bn in January to KRW 43.868bn in July, 13 times July a year earlier. The left of Figure 12 shows monthly net buying by individuals and foreigners, and the right shows the two stocks’ foreign ownership. “Other corporations” net bought KRW 31.40tn in September because company purchases such as share buybacks fall into this category. SK hynix resolved on August 19 to buy back and cancel KRW 40tn (about $30.0bn) of its shares and is buying from August 20 to November 19.
Deposits fell and MMFs grew
Where the money individuals sold went is shown by the cash around the market. On Korea Financial Investment Association data, investor deposits hit a record KRW 139.69tn on June 4. They were KRW 121.63tn at the end of June and KRW 100.38tn on October 7, down KRW 21.25tn (about $15.9bn) since the end of June alone. Cash management account (CMA) balances also fell by KRW 4.88tn, from KRW 110.50tn to KRW 105.62tn. Over the same period MMF assets rose by KRW 38.57tn (about $28.9bn), from KRW 224.33tn to KRW 262.89tn. Money waiting to buy shares appears to have moved to short-term fixed-rate products. Margin loans, money borrowed to buy shares, peaked at KRW 38.63tn on June 24, fell to KRW 27.40tn on August 4 and rose again to KRW 33.63tn on October 2.
The left of Figure 13 connects the three pools of money at the end of June and on October 7, and the right shows the annual rates on offer now, including brokers’ issued notes at 4.3–5.0% a year. The MMF line going up and the deposit line going down tell the same story as the 5% fixed rates in Section 6, in volumes of money. Brokers rushing out issued-note promotions are trying to catch this flow.
As the won strengthened, individuals went to the US and foreigners took profits
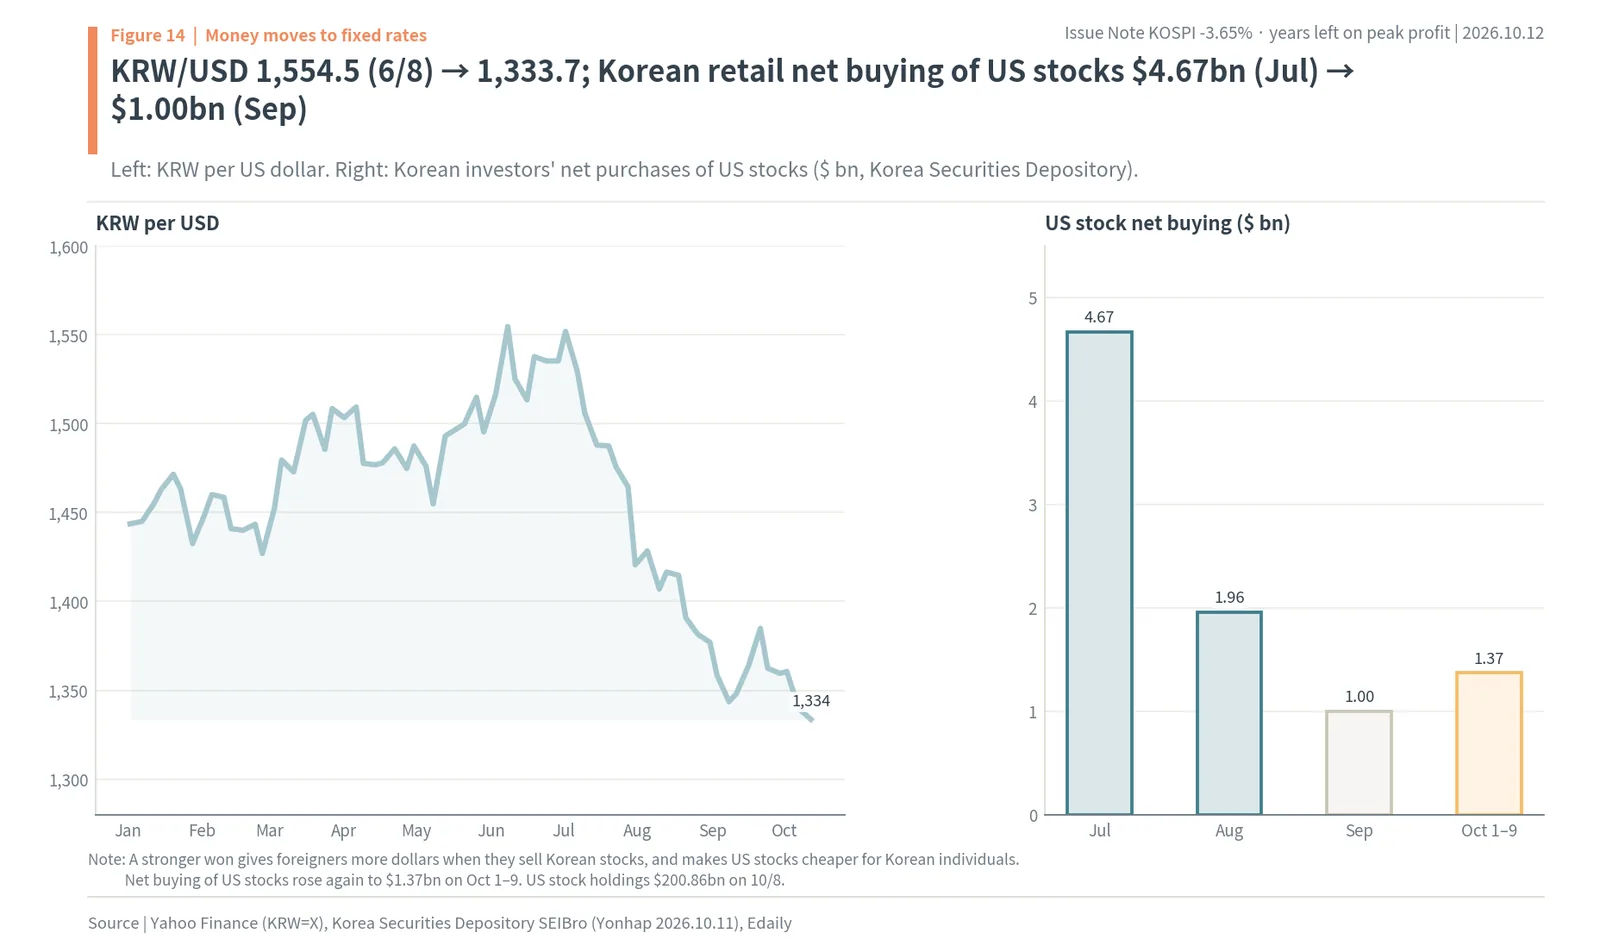
The exchange rate moved the same way. On Yahoo Finance closes, the won-dollar rate peaked for the year at KRW 1,554.5 on June 8 and was KRW 1,333.7 on October 12. The Seoul foreign exchange market’s close on October 12 (3:30 pm) was KRW 1,335.1, and the intraday low of KRW 1,332.0 was the strongest won since October 4, 2024 (Yonhap). When the won strengthens, foreigners get more dollars for selling the same won-priced shares. A foreigner who bought the KOSPI in the first half can sell with a currency gain on top of the price gain. For individuals, US shares become cheaper to buy.
On Korea Securities Depository SEIBro data, individuals’ net purchase settlements of US shares fell from $4.669bn in July to $1.962bn in August and $1.001bn in September, then rose again to $1.373bn on October 1–9. Holdings of US shares were $200.86bn on October 8, back above $200bn for the first time in four months. Holdings peaked at $206.3bn on June 2 and fell to $171.47bn at the end of July before rising again. The largest holding is Tesla and the second Nvidia (depository data, reported October 10). Kim Jong-min, a senior research fellow at Samsung Securities, said money is moving only into the AI value chain, the high-growth industry that can withstand high rates (Maeil Business, October 12). The left of Figure 14 shows the won-dollar rate this year, and the right shows net buying of US shares. Selling memory, whose years of peak profit are in doubt, and moving into fixed rates or US AI companies is a flow that appears in the same direction among both foreigners and individuals.
8. The 2018 memory peak: Samsung -34.6%, SK hynix -39.5%
Samsung Electronics -34.6%, SK hynix -39.5%
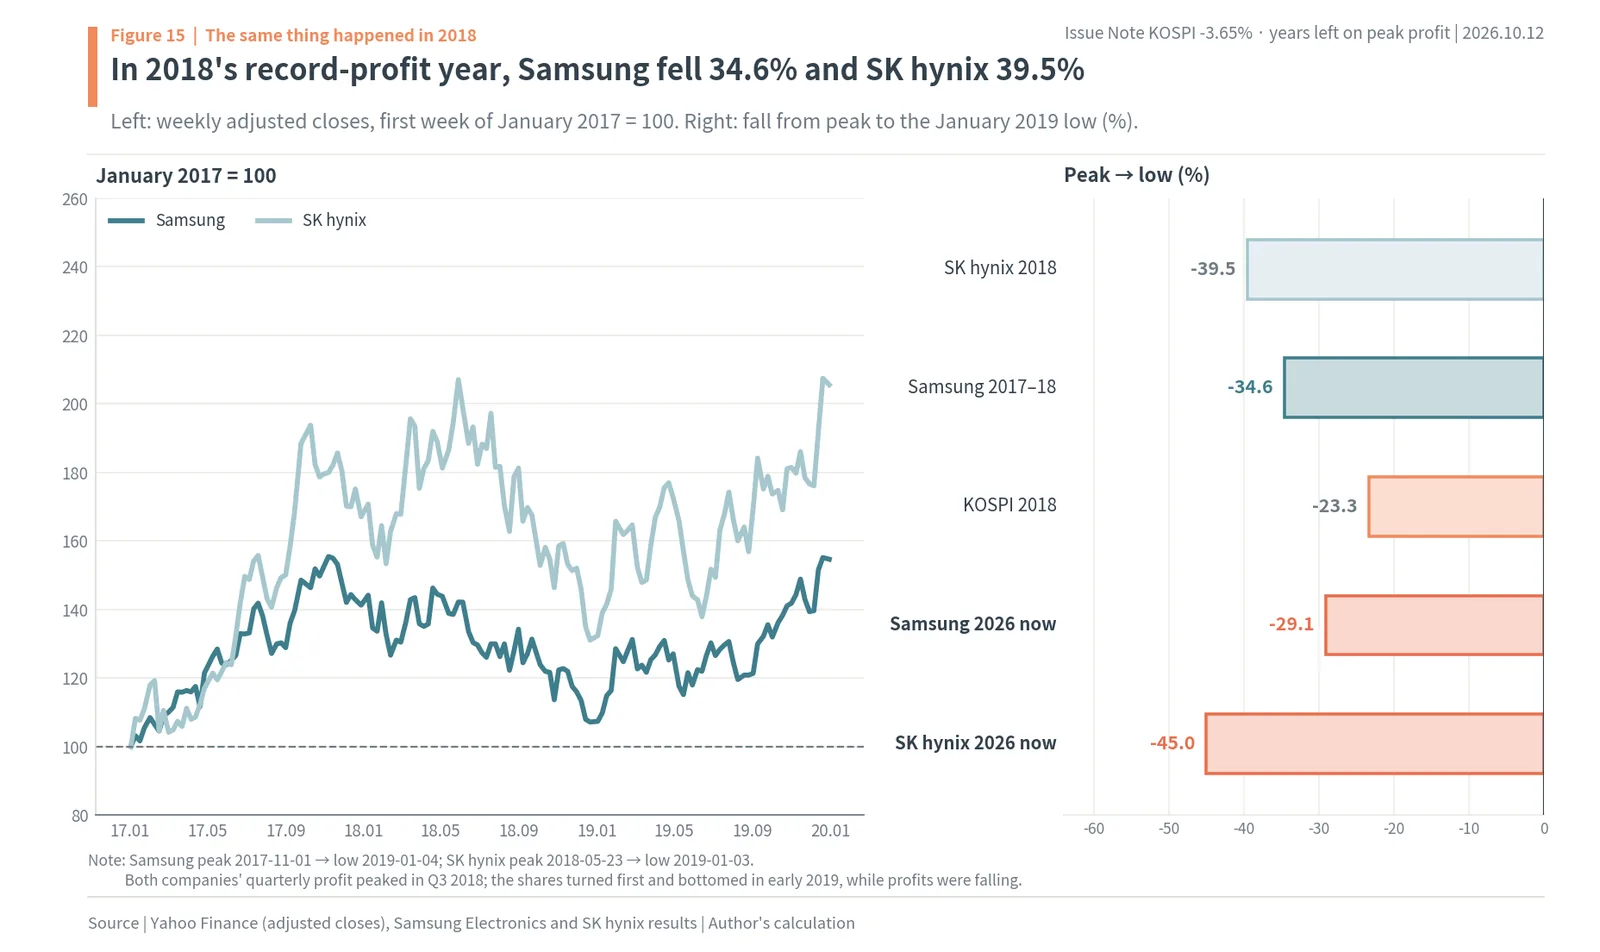
Shares falling ahead of peak profits is nothing new. The 2017–2019 memory cycle followed the same path. Samsung Electronics’ annual operating profit rose from KRW 29.24tn in 2016 to KRW 53.65tn in 2017 and KRW 58.89tn in 2018, making 2018 the record at the time. By quarter, Q3 2018’s KRW 17.57tn was the top. Yet the shares (adjusted closes reflecting the stock split) peaked at KRW 57,220 on November 1, 2017, almost a year earlier, and fell 34.6% to KRW 37,450 on January 4, 2019. In 2019 operating profit was KRW 27.77tn, less than half of 2018’s.
SK hynix was the same. Operating profit rose from KRW 13.72tn in 2017 to KRW 20.84tn in 2018 and then fell to KRW 2.71tn in 2019. The quarterly top was KRW 6.47tn in Q3 2018. The shares peaked at KRW 95,300 on May 23, 2018, four months earlier, and fell 39.5% to KRW 57,700 on January 3, 2019. Over the same period the KOSPI fell 23.3%, from 2,598.19 on January 29, 2018 to 1,993.70 on January 3, 2019.
The left of Figure 15 shows the two companies’ weekly prices indexed to the first week of January 2017 = 100. Both lines were already coming down in mid-2018, when profits were highest, and bottomed in early 2019, while profits were falling, before rising again. The shares moved months ahead of the profit peak and trough. The bars on the right put the 2017–2018 falls next to the falls since June 22, 2026 (Samsung Electronics 29.1%, SK hynix 45.0%). SK hynix’s fall is already bigger than in 2018, and Samsung Electronics is about where it was then. What came after the bottom is worth noting too. Samsung Electronics rose 49.0%, from KRW 37,450 on January 4, 2019 to KRW 55,800 on the last trading day of that year, and SK hynix rose 63.1%, from KRW 57,700 on January 3 to KRW 94,100. In 2019 the two companies’ operating profit fell to under half and one-eighth of 2018’s, yet their shares rose. Once the market had priced in the year of falling profits, it began buying the timing of the next peak. Shares moving ahead of profits held true both on the way down and on the way up.
What differs between then and now is contracts
The difference between 2018 and now is the size of profits and the way memory is sold. Samsung Electronics’ best quarterly operating profit in 2018 was KRW 17.57tn; now it is KRW 107.4tn. Its 2026 consensus operating margin is 51.97%. With memory prices this high, the push to add supply is strong too, and the market weighs when that supply will arrive. On the other hand, sales like HBM, where next year’s volumes and prices are agreed with customers in advance, have grown. These contracts, which did not exist in 2018, are a window that shows the years of peak profit ahead of time. So the author does not stop at the 2018 lesson that “shares turn first when profits peak”, but reads it as “the depth of that turn is set by the years the market credits”. Since there is more evidence on the years than in 2018, today’s share prices will move sharply each time such evidence appears.
US memory faces the same question
The same question is being asked in the US. From June 22 to October 9, Micron fell 15.1% and the Philadelphia Semiconductor Index 14.1%, but Nvidia rose 9.9%. Companies that sell memory fell and the company that buys memory to make AI chips rose. On October 8–9, while Korea was closed, the Philadelphia Semiconductor Index fell 3.8% (Digital Daily). Money Today relayed a Financial Times report that OpenAI’s annualized revenue was $20bn less than previously indicated, and wrote that worries about the AI industry’s growth led to chip selling. The left of Figure 16 shows Micron, SK hynix and the S&P 500 indexed to June 22 = 100, and the right shows the changes over the same period. The author thinks SK hynix fell nearly three times as much as Micron because the two stocks’ weight in the KOSPI, foreign selling and the strong won all piled up on the Korean side.
9. AI doubts, foreign flows and China: other names for the years left
Doubts about the pace of AI investment
Brokers offered several explanations on October 12, but follow each one and they all lead back to the years of peak profit. The first is doubt about the pace of AI investment. Money Today argued that the report that OpenAI’s revenue was lower than believed led to selling of US chip stocks and that the pressure spilled over to Korea. Kim Seok-hwan of Mirae Asset Securities said Samsung Electronics and SK hynix weakened as they digested worries about an “OpenAI bubble”. Lee Young-won of Heungkuk Securities said that with rate pressure mounting, as the US 10-year yield topped 5.2%, doubts about the pace of AI investment and mixed views on the memory chip cycle were weighing on sentiment (Maeil Business). If AI companies’ revenue grows later than expected, data center investment is delayed, and orders for HBM and server DRAM are pushed back with it. That is a path by which the years of peak profit shrink.
Foreign flows and a broken trend
The second is foreign flows. Lee Jae-won of Yuanta Securities said the biggest worry in the Korean market right now is not chip earnings but foreign flows, and Kim Doo-un of Hana Securities said even record earnings could not overcome foreign selling pressure. Kang Jin-hyuk of Shinhan Investment explained that with the KOSPI having broken below the lower end of its uptrend because of the flow effects of the October 8 options expiry and ETF rebalancing, external negatives piled on and selling poured out (Newspim). As Section 7 showed, foreign selling has run all year. Ask what foreigners are looking at when they sell, and the answer comes back to years and rates. 77.5% of the KRW 2.011tn foreigners sold was the two memory stocks. The same day foreigners net bought KRW 752.1bn in the futures market. Selling shares while buying futures is closer to trading that cuts the weight of particular stocks than to a bet against the whole index. The author reads what foreigners want to reduce as the weight of the two memory stocks, not the Korean market as a whole.
Chinese memory catching up, and other events
The third is the chance that Chinese memory makers gain share (Newspim). If supply grows, memory prices fall and the years of peak profit shrink. When brokers cut their target prices for the two stocks in August, they also cited commodity memory passing its peak and Chinese makers catching up. The fourth is a set of separate events. When SpaceX signed a deal to buy US nationwide 800MHz spectrum for about $8bn to connect smartphones directly by satellite, US telecom stocks fell, and on October 12 SK Telecom and KT also fell more than 5% (Digital Daily). The KOSPI telecom sector’s 3.81% fall is tied to this. Brent crude’s rise to $103.92 on October 8 links to Section 6, on the side of pushing rates up.
These explanations do not conflict. AI investment speed and Chinese supply are questions of how many years peak profit lasts; rates and oil are questions of what each year is worth; and foreign selling and the options expiry are the channels through which that judgment reaches share prices. So the author sees this fall not as several explanations piling up separately but as one question (how many years will these profits last?), with rates adding weight and foreigners giving their answer by selling.
10. The author’s view: 2027 contracts and rates, not Q3 numbers
Not a crisis but a re-pricing of the years
The author sees the October 12 sell-off not as a crisis in the Korean economy or a deterioration in earnings, but as the market re-pricing how many years peak memory profits will last. The earlier sections laid out the grounds in turn. The fall was Korea’s alone (KOSPI -30.0% since June 22, S&P 500 +4.5%), and 69.2% of the lost market cap came from the two memory stocks. The two companies’ profits are at a record, and of 22 Samsung Electronics target prices over the last 92 days only one was cut, yet their 2027 P/Es are 3.7x and 3.59x, with earnings yields more than 21 percentage points above the US 10-year. On the author’s model, today’s share prices credit only about 2.6 years of peak profit to Samsung Electronics and about 3.2 to SK hynix. A 5.24% yield has cut the value of the same years by 5–8%. In 2018, too, the shares fell 30–40% first, in the record-profit year.
Seen this way, what will set the next share price becomes clear. The third-quarter numbers are out and were close to consensus. The shares will find a direction only when evidence appears that adds or cuts years. Evidence that adds years is contracts that fix 2027 volumes and prices in advance: HBM supply contracts, long-term server DRAM supply agreements and customer prepayments belong here. Such contracts first show up when a company says on its results call how far next year’s volumes are already set, backed later by customers’ data center investment plans. If word comes that contracts reach into 2028 volumes, the years the market credits gain grounds to stretch beyond today’s two-to-three-something. Evidence that cuts years is falling memory spot and contract prices, capacity additions by Chinese makers and AI companies scaling back investment plans. And the value of each of those years is set by US rates.
Eight signals the author watches
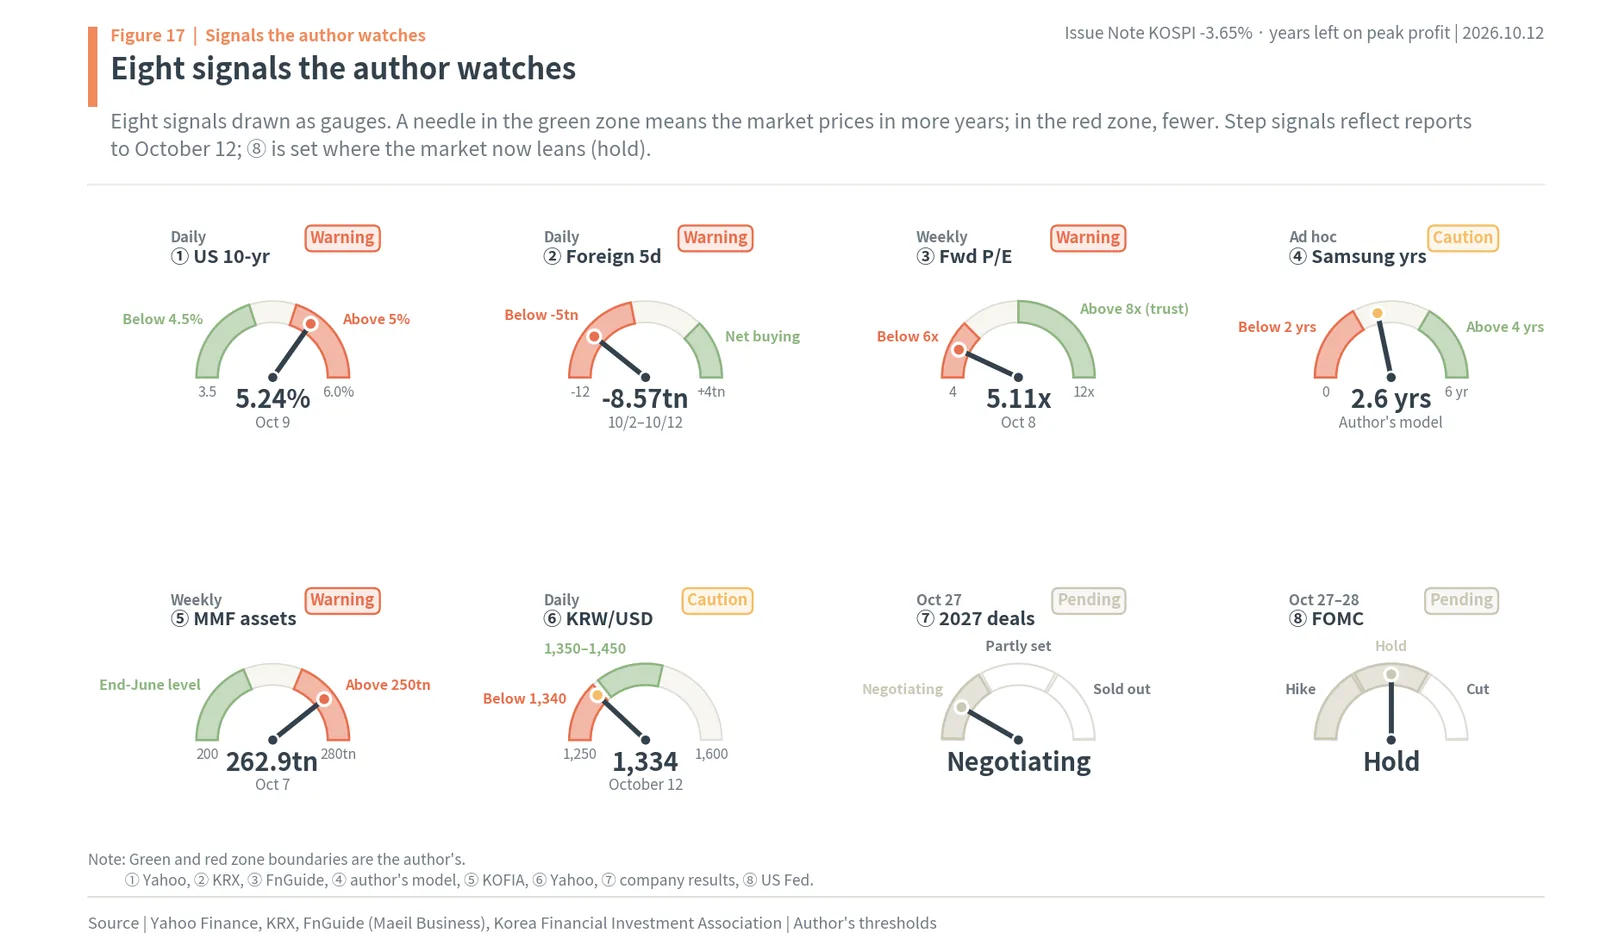
Figure 17 draws as gauges the eight signals the author will watch to track this view. A needle in the green zone means the market is crediting more years; in the red zone, fewer. ① The US 10-year yield is 5.24%, in the red zone above 5%. Below 4.5%, the same years are worth more. ② Foreigners’ five-session net buying on the KOSPI is -KRW 8.57tn. ③ The KOSPI forward P/E is 5.11x; it needs to rise above 8x to signal that the market trusts profits to last. ④ The author’s model gives Samsung Electronics 2.6 years. ⑤ MMF assets of KRW 262.9tn show how much money has moved to fixed rates. ⑥ A won-dollar rate of KRW 1,334 leans toward foreigners selling for currency gains. ⑦ The first clue on 2027 volume contracts comes at SK hynix’s results on October 27. ⑧ The FOMC meets October 27–28, and the market leans more toward a hold.
The fork in numbers
The model puts numbers on the fork in the road. At a 5.24% yield, if Samsung Electronics’ peak profit lasts three years the model price is KRW 273,822; four years, KRW 323,771 (about $243); five years, KRW 369,705. Two years gives KRW 219,507. For SK hynix it is KRW 1,535,736 at three years, KRW 1,871,495 at four, KRW 2,180,267 at five and KRW 1,170,631 at two. If the rate falls to 4.16%, the same three years gives Samsung Electronics KRW 296,165 and SK hynix KRW 1,620,803. One year’s difference in the years matters far more than a 1 point difference in rates. Comparing with today’s price makes this clearer. Keeping the rate at 5.24%, if the years the market credits rise to four, Samsung Electronics’ model price is KRW 323,771, 29.2% above today, and SK hynix’s KRW 1,871,495, 16.6% higher. If the years fall to two, Samsung Electronics is KRW 219,507 (-12.4%) and SK hynix KRW 1,170,631 (-27.1%). Keeping the years and letting only the rate fall to 4.5% gives Samsung Electronics +5.6% and SK hynix +3.6%. Because 81.6% of SK hynix’s price is peak profit, it is cut harder when the years shrink, while Samsung Electronics, with a larger share of normal profit, gains more when the years grow. So the author will watch rates, but will give more weight to contract news that shows how many years peak profit will last. As 2018 showed, shares move ahead of the profit trough, and how far they move is set by how much the market’s belief about the years changes. This view does not say when the shares will bottom. It says what today’s share prices doubt and what would resolve that doubt.
11. Affected sectors, KOSDAQ chip suppliers and dates to watch
Sectors hanging on the memory thread shook first
Sector moves on October 12 split by how close each sector is to memory. On Asia Economy’s closing tally, the KOSPI machinery sector fell the most at 6.72%, followed by construction 4.54%, electronics 4.51%, medical and precision 4.22%, chemicals 4.17%, telecom 3.81%, securities 3.29%, transport equipment 2.70%, metals 2.54% and financials 1.87%. Transport and storage, and food, beverage and tobacco rose. Among the largest stocks, SK Square (the holding company that owns SK hynix shares) fell 6.0% and Samsung Electro-Mechanics 3.82%, while Shinhan Financial Group rose 0.5%. SK hynix resolved on August 19 to buy back and cancel KRW 40tn of shares and is buying from August 20 to November 19; on top of its plan to return at least 50% of cumulative 2025–2027 free cash flow to shareholders, it will present an additional return plan with its third-quarter results (Segye Ilbo). Buybacks raise earnings per share by reducing the share count, but they do not change the years the market credits.
On the KOSDAQ, chip materials, parts and equipment stocks fell hard. Leeno Industrial, which makes parts for chip testing, fell 11.04%; Simmtech, which makes memory substrates, 9.32%; heat-treatment equipment maker HPSP 6.35%; deposition equipment maker Jusung Engineering 5.61%; and Wonik IPS 2.24%. Because memory makers’ investment plans for next year become these companies’ orders, doubt about the years of peak profit passes straight into doubt about the years of equipment and parts orders. Battery makers EcoPro BM (-10.33%) and EcoPro (-8.16%), robot maker Rainbow Robotics (-8.28%) and biotech Samchundang Pharm (-12.73%) also fell sharply. The more a stock’s price rests on growth expectations, the more it shares the weight of 5%-plus rates. The left of Figure 18 shows KOSPI sectors and the right the top KOSDAQ stocks’ moves on October 12.
Conversely, the fixed-rate side benefits from this flow. Large brokers that sell issued notes are gathering money leaving MMFs and deposits with promotions at 4–5% a year. The extension of liquidity ratio rules to all brokers from January 2027 is another reason brokers want to raise longer-term funds (Maeil Business). Securities stocks also bore the weight of shrinking trading and fell 3.29% on October 12. Banks, whose interest income rises when rates are high, fell less that day. The KOSPI financials sector fell 1.87%, the smallest fall among sectors, KB Financial Group slipped only 0.12% and Shinhan Financial Group rose 0.5%. On the same day that 5%-plus rates cut the value of memory’s years, the sector that earns money from those rates held up.
Dates to watch
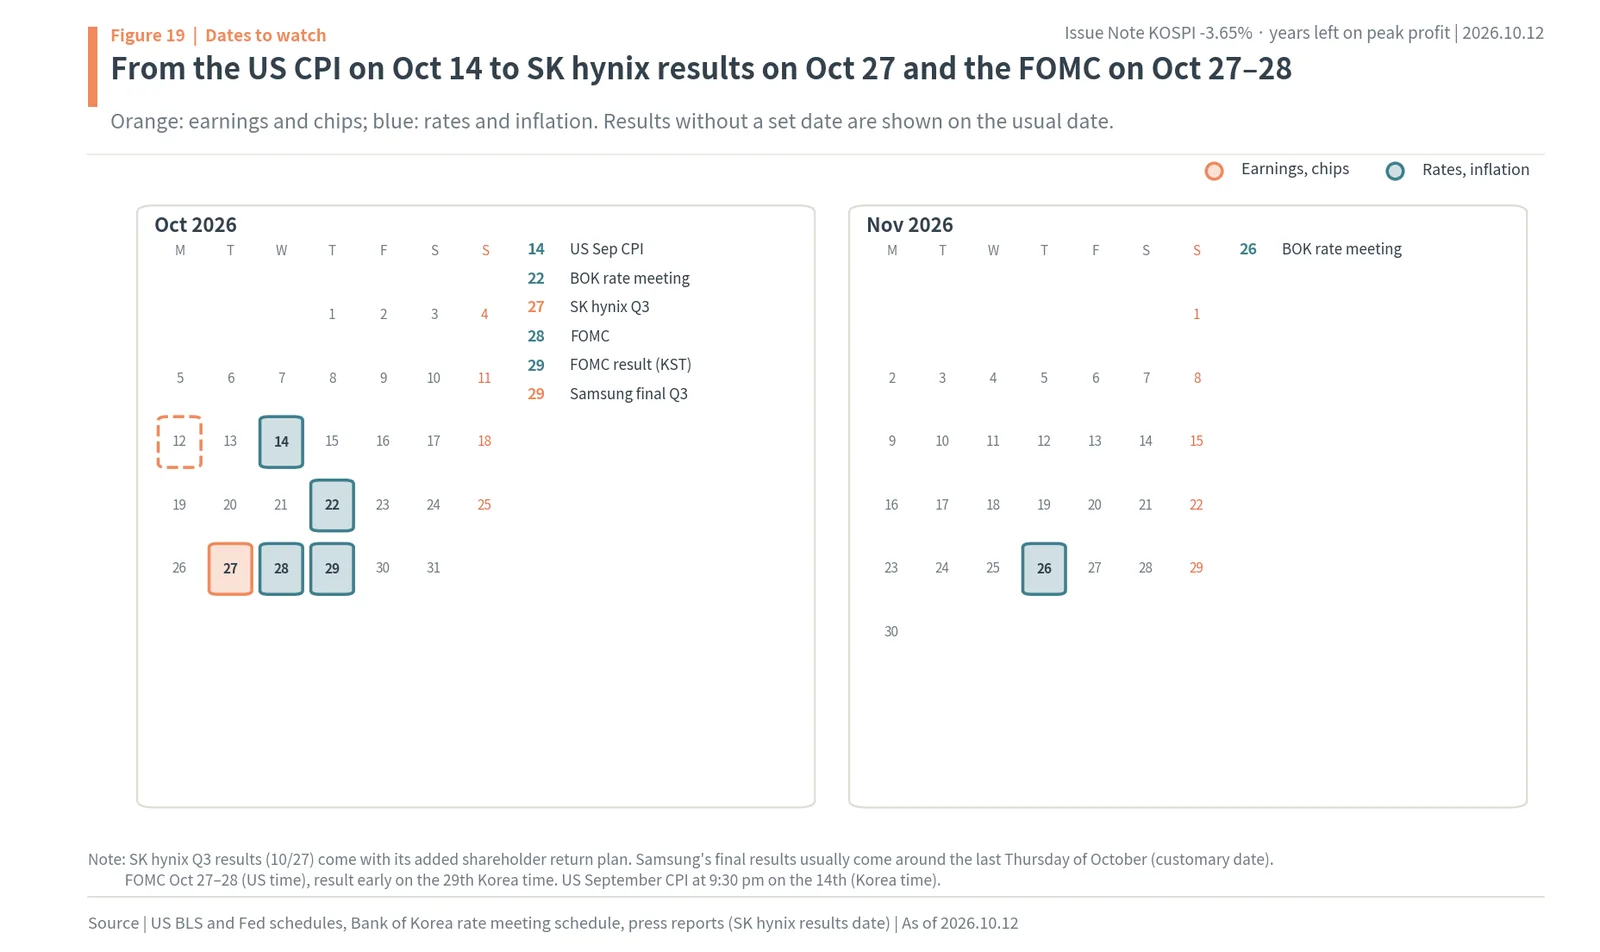
Here, in order, are the dates when clues on years and rates will come out. At 9:30 pm Korea time on October 14, the US September consumer price index (CPI) is released. Hot inflation raises the chance of another Fed hike and pushes the 10-year yield up. October 22 is the Bank of Korea’s Monetary Policy Board meeting; after hikes in July and August, the base rate is 3.00%. On October 27 SK hynix announces third-quarter results and its additional shareholder return plan. Its third-quarter operating profit consensus is about KRW 77tn (about $57.7bn), and what the company says that day about 2027 HBM and server DRAM volumes will be the first clue on the years. October 27–28 (US time) is the FOMC, with the result early on the 29th Korea time. Samsung Electronics usually releases final results with divisional detail around the last Thursday of October, which this year falls around October 29. November 26 is the next Bank of Korea rate meeting. Figure 19 marks these dates on a calendar. Fixing one thing to watch on each date: the 14th CPI and the 22nd rate meeting move rates, the value of each year. SK hynix’s results on the 27th move the years, how long peak profit will last. The FOMC on the 28th is rates again, and Samsung Electronics’ divisional detail around the 29th is years. The author expects that on a day when news on both lines points the same way, the shares will also move sharply in one direction.
12. Methodology: data, consensus and the years-left model
Share prices, market cap and flows
KOSPI and stock prices are KRX closes. On October 12, Samsung Electronics closed at KRW 250,500 and SK hynix at KRW 1,605,000; Naver’s consolidated quote (Samsung Electronics KRW 251,000) can differ. The June 22 = 100 lines and the changes since June 22 are calculated from Yahoo Finance closes, and overseas prices are October 9 (local) closes, the nearest trading day to Korea’s October 12. KOSPI market cap is the sum of the market caps of all KOSPI stocks published by the KRX and includes preferred shares. So the “two-stock weight” is the market cap of Samsung Electronics common shares plus SK hynix divided by the KOSPI total, and Samsung Electronics preferred shares are counted in the rest.
Net buying by foreigners, individuals and institutions is the KRX’s trading by investor type (KOSPI, net purchase value). It can differ slightly from figures in press reports. For example, foreigners’ October 12 net sale is KRW 2.011tn on the KRX’s final figure and KRW 2.0186–2.025tn in articles published right after the close. Individuals’ September net sale is KRW 14.20tn on the KOSPI, and there is an article (Maeil Business) putting it at KRW 12.67tn for the KOSPI and KOSDAQ combined. This report uses the KOSPI figure. The monthly KOSPI net buying used in Figure 12 (KRW tn), in order, is: individuals January -0.40, February +4.04, March +33.57, April -15.52, May +35.09, June +42.40, July +5.37, August +3.24, September -14.20, October (to the 12th) +4.65. Foreigners: +0.15, -21.06, -35.75, +1.23, -44.46, -48.43, -9.86, -10.17, -21.59, -8.45. Institutions: -2.29, +14.86, -1.06, +9.19, +9.20, +5.15, +3.99, -5.06, +4.39, -1.78. Other corporations: +2.54, +2.17, +3.24, +5.10, +0.17, +0.88, +0.50, +11.99, +31.40, +5.59. Yonhap reported foreigners’ KOSPI net sales this year at KRW 199tn; the difference is the counting period and rounding. Foreign ownership by stock is shown separately from KRX stock data (October 12) and Edaily’s report (as of October 8).
Consensus and normal profit
EPS and operating profit consensus are the figures WISEfn showed on October 12. For Samsung Electronics, 22 firms; the annual 2026–2028 figures and the Q4 2026 figure are used. They differ slightly from FnGuide and Daishin figures (for example, Daishin’s 2027 EPS for Samsung Electronics is KRW 62,394 against WISEfn’s KRW 67,701). P/E and earnings yield are the October 12 close divided by each year’s EPS. The KOSPI forward P/E of 5.11x, the 11.30x a year earlier and the trailing P/E of 11.05x are FnGuide and exchange figures cited by Maeil Business (October 12), and the earnings yield is their inverse.
Normal profit is the average actual EPS over the five years 2021–2025. For Samsung Electronics: KRW 5,777, 8,057, 2,131, 4,950 and 6,564, an average of KRW 5,496. For SK hynix: KRW 13,190, 3,063, -12,517, 27,182 and 58,955, an average of KRW 17,975. Those five years contain one memory boom (2021) and one bust (2023), so they serve as the average of one cycle.
The years-left model
Model price = value of normal profit + present value of peak profit. The value of normal profit is normal EPS × (1 + 2.5%) ÷ (discount rate – 2.5%), and the discount rate is the US 10-year yield + a 3.5 point risk premium. At 5.24% the discount rate is 8.74% and normal profit is worth 16.4 times normal EPS. The present value of peak profit adds Q4 2026 EPS minus a quarter of normal EPS, discounted 0.25 years, and 2027 (one year out) and 2028 (two years out) EPS minus normal EPS, each discounted in turn. From 2029 the 2028 amount is assumed to continue. When the years are fractional, the last year’s amount is included in proportion. By years, the model prices at 5.24% for Samsung Electronics are 0 years KRW 103,239, 1 year 160,445, 2 years 219,507, 3 years 273,822, 4 years 323,771 and 5 years 369,705; at 4.16%, 122,166, 179,946, 240,199, 296,165, 348,149 and 396,434. For SK hynix at 5.24%: 379,310, 773,617, 1,170,631, 1,535,736, 1,871,495 and 2,180,267; at 4.16%: 441,318, 839,580, 1,244,600, 1,620,803, 1,970,239 and 2,294,812. The 0-year value is above the value of normal profit because it includes the Q4 2026 peak amount. The years (years left) are the number of years of peak profit after Q4 2026.
Solving by bisection for the years that match today’s price gives 2.6 years for Samsung Electronics and 3.2 for SK hynix at 5.24%, and 2.2 and 3.0 at 4.16%. The rate effect is the difference in model price when the years solved at 5.24% are held and the rate is switched to 4.16% (Samsung Electronics -7.9%, SK hynix -5.2%). The surface is the model price over rates of 3.0–6.0% (0.25 point steps) × years of 0–6 (0.5 year steps). The risk premium and growth rate are the author’s assumptions, and changing them changes the years. With a 3.0 point risk premium the years are 2.4 for Samsung Electronics and 3.1 for SK hynix; with 4.0 points, 2.7 and 3.3. The 2.5% growth rate is meant as Korean corporate profits growing over the long run by inflation plus real growth. A higher growth rate raises the value of normal profit and so shortens the years. A higher risk premium lowers the value of normal profit and so lengthens the years needed to explain the same price. The model does not separately include taxes, dividends, buyback cancellations or net cash. The years are a yardstick to show in one number “how many years of peak profit the market is paying for”, not a forecast of how many years the companies’ profits will actually last.
The hypothetical example and 2017–2019
The hypothetical Memory Store uses the same model with normal EPS of KRW 1,000 and peak EPS of KRW 5,000 (an extra KRW 4,000). The peak amount is assumed to be received every year from one year out. 2017–2019 prices are Yahoo Finance adjusted closes (reflecting Samsung Electronics’ 50-for-1 split in May 2018); the peaks are the highest closes from June 2017 to June 2018 for Samsung Electronics and from June 2017 to August 2018 for SK hynix, and the lows are the lowest closes after the peak through March 2019. Annual and quarterly operating profits are figures from reports on company results. The consensus against which Samsung Electronics’ KRW 107.4tn preliminary third-quarter operating profit is compared also varies by compiler. FnGuide’s was KRW 106.64tn on October 7, while other tallies (KRW 108.68tn cited by Segye Ilbo, KRW 112.73tn from Visible Alpha) were higher. This report compares with FnGuide’s figure. The end-2019 prices are Yahoo adjusted closes on that year’s last trading day (December 30), and the rebound is measured from the January 2019 low. Individuals’ May–June net buying of KRW 77.49tn is the sum of KRX monthly figures (May KRW 35.09tn, June KRW 42.40tn) and matches the Chosun Ilbo’s KRW 77.5tn. US 10-year yields from Yahoo Finance (^TNX) closes and the US Treasury’s published figures can differ in the second decimal place; for October 19, 2023 Yahoo shows 4.99% and the Treasury 4.98%. The won-dollar rate differs slightly between Yahoo Finance closes and the Seoul foreign exchange market close, so the charts use Yahoo figures and the text’s “October 12 close” uses Yonhap’s figure. Dollar figures in this report are converted at KRW 1,333.7 per dollar, the Yahoo Finance close on October 12, 2026.
KOSPI plunge FAQ
Q. Why did the KOSPI fall 3.65% on October 12, 2026?
The KOSPI fell 3.65% to 6,384.24 as foreigners net sold KRW 2.011tn, 77.5% of it in Samsung Electronics and SK hynix. Doubts about the pace of AI investment, a US 10-year yield above 5% and foreign selling were all cited. The author reads them as one question: how many years peak memory profits will last.
Q. Why are Samsung Electronics and SK hynix P/E ratios so low?
At October 12 prices and WISEfn consensus, 2027 P/Es are 3.7x for Samsung Electronics and 3.59x for SK hynix, earnings yields of 27.0% and 27.9%. A P/E this low at a profit peak means the market pays for only a few years of peak profit; the author’s model puts it at about 2.6 and 3.2 years.
Q. What could move Samsung Electronics and SK hynix shares next?
Evidence on how long peak profit lasts, such as 2027 HBM and server DRAM volume and price contracts, and US interest rates. Key dates are the US CPI on October 14, SK hynix results on October 27, the FOMC on October 27–28 and Samsung Electronics’ final results around October 29.
Sources
- KRX Information Data System (pykrx), market cap of all KOSPI stocks (2026.06.22, 10.12), KOSPI trading by investor type (2026.01.02–10.12), Samsung Electronics and SK hynix trading by investor type and foreign ownership, retrieved 2026.10.12
- WISEfn, Samsung Electronics and SK hynix consensus (annual and quarterly EPS, operating profit, target prices), retrieved 2026.10.12
- Yahoo Finance, closes for the KOSPI, KOSDAQ, S&P 500, TAIEX, Nikkei 225, Philadelphia Semiconductor Index, Micron, Nvidia, Samsung Electronics and SK hynix, US 10-year (^TNX) and KRW/USD (KRW=X), downloaded 2026.10.12
- US Department of the Treasury, Daily Treasury Par Yield Curve Rates (link), 2026
- Seoul Shinmun, Samsung and SK hynix down 4%, KOSPI breaks 6,400 (link), 2026.10.12
- Money Today, KOSPI plunges 3.65% (link), 2026.10.12
- Asia Economy, KOSPI ends in the 6,380s, down 3% on foreign selling (link), 2026.10.12
- Money Today, US chip selling pressure spills into Korean shares (link), 2026.10.12
- Newspim, Market close: KOSPI falls 3% on KRW 2tn foreign selling (link), 2026.10.12
- Financial News, Foreigners dump chip stocks, KOSPI below 6,400 (link), 2026.10.12
- Digital Daily, Foreign selling sends KOSPI down 3.6%, SKT and KT hit by SpaceX news (link), 2026.10.12
- Seoul Economic Daily, KOSPI’s biggest fall since September 2 (link), 2026.10.12
- Maeil Business, Individuals net sell KRW 12.7tn, MMFs up KRW 38tn, issued-note promotions (link), 2026.10.12
- Maeil Business, Individuals sold Korean shares and bought US shares in the second half (link), 2026.10.12
- Maeil Business, KOSPI forward P/E 5.11x, trailing P/E 11.05x (link), 2026.10.12
- Edaily, Foreign ownership of Samsung Electronics lowest since 2008 (link), 2026.10.12
- Yonhap, Won-dollar closes at KRW 1,335.1 (link), 2026.10.12
- Yonhap, Bank time deposit rates (link), 2026.10.10
- Chosun Ilbo, Record investor deposits and single-stock leveraged ETFs (link), 2026.09.24
- Herald Economy, Individuals turn net sellers in September (link), 2026.09.26
- Financial News, Margin loan balances (link), 2026.09.29
- Dong-A Ilbo, Bank of Korea: KOSPI volatility 4.1% (link), 2026.09.28
- Asia Economy, Bank of Korea rate hikes in July and August (link), 2026.10.12
- Blockmedia, US 10-year at 5.229%, Brent at $103.92 (link), 2026.10.09
- Daishin Securities, Weekly, first week of October 2026 (Samsung Electronics estimates, KOSPI forward P/E 6x = 7,600, six-month range 6,300–9,300), 2026.10.07
- Money Today, Samsung Electronics Q3 preliminary results consensus KRW 106.64tn (link), 2026.10.07
- Segye Ilbo, Samsung Electronics Q3 operating profit KRW 107.4tn, SK hynix results on 10/27 (link), 2026.10.09
- Samsung Electronics Newsroom, Q4 2017 results (link), 2018.01.31
- News Tomato, Samsung Electronics 2016 operating profit (link)