Samsung Electronics (005930.KS) and SK hynix (000660.KS) Buybacks End: KRW 15tn and KRW 40tn Programs Took 96% and 101% of the Selling, So Who Buys Now?
The companies took almost all of the selling, and that buying is now ending. Samsung Electronics’ KRW 15tn buyback ended on October 6, 2026, and SK hynix’s KRW 40tn buyback ends around October 21. This report measures who sold to the companies, the price band the buying held, how much the shares can swing without it, and when the next buyback comes. Numbers as of October 12, 2026.
- Samsung Electronics’ KRW 15tn buyback ended on October 6 after 29 trading days; SK hynix had bought KRW 35.72tn of its KRW 40tn (89.3%) by October 12 and, at 400,000 shares a day, finishes around October 21 (author’s calculation).
- During the buybacks the companies took 96% (Samsung) and 101% (SK hynix) of net selling by foreigners and retail, buying 11.4% and 18.2% of all trading value, the most in either company’s history.
- The shares held in a band around the average buyback prices of KRW 263,823 and KRW 1,749,576; the October 12 closes of KRW 250,500 and KRW 1,605,000 are only 0.8% and 0.6% above the band’s floor.
- The average daily move fell from 5.40% to 2.22% (Samsung) and from 6.14% to 2.85% (SK hynix); without support, the daily range widens to between 1.1x (past buybacks) and 2.1 to 2.2x (the pre-buyback market).
- Next supports: SK hynix’s further return with late-October results (KRW 53.8tn of room, author’s calculation) and Samsung’s January 2027 board (KRW 60tn to 80tn); cancellation resolutions drew a median +2.9pp two-day excess return, compensation -2.0pp.
Key takeaways
- Samsung Electronics’ KRW 15tn (about $11.2bn) share buyback ended on October 6, and SK hynix’s KRW 40tn (about $30.0bn) buyback was 89.3% complete by October 12; at 400,000 shares a day it ends around October 21 (author’s calculation). During the buybacks the companies took 96% (Samsung) and 101% (SK hynix) of what foreigners and retail investors sold.
- Meanwhile the shares held in a band centered on the companies’ average buyback prices (Samsung KRW 263,823, about $198; SK hynix KRW 1,749,576, about $1,312), and the average daily move was less than half that of the 60 trading days before the buybacks. The October 12 closes are 0.8% and 0.6% above the floor of that band.
- Once the support is gone, the daily range widens to somewhere between 1.1 times the buyback-period level (Samsung’s past buybacks) and 2.1 to 2.2 times (the market just before the buybacks). The next supports are SK hynix’s additional shareholder return in late October (KRW 53.8tn of room left, author’s calculation) and Samsung’s board meeting in January 2027 (KRW 60tn to 80tn).
As of: October 12, 2026
Ticker: Samsung Electronics (005930.KS), SK hynix (000660.KS)
Reference close: KRX close on October 12, 2026 (Samsung Electronics KRW 250,500, about $188; SK hynix KRW 1,605,000, about $1,204)
This is the author’s personal analysis and view. The author’s calculations and estimates are not confirmed facts.
Summary: Samsung Electronics and SK hynix buybacks took 96% and 101% of the selling, and that support is ending
This report looks at what the end of the record share buybacks at Samsung Electronics and SK hynix means for the two stocks, using exchange flow data, company filings and the author’s calculations. It asks five questions. Who sold shares during the buybacks? At what price line did the companies’ buying hold the shares? How do this time’s flows differ from past buybacks? How much can the shares swing once the buying ends? And when does the next buyback come, and what changes when it does?
Some Korea-specific background first. The KOSPI is the main board of the Korea Exchange (KRX) and its benchmark index. Unlike most markets, the KRX publishes net buying by investor type (foreigners, individuals, institutions and “other corporations”) every day for each stock, so who bought and who sold is a matter of record. Korea counts large sums in units of 100 million won (eok) and one trillion won (jo); this report shows them as KRW bn and KRW tn. Dollar figures use KRW 1,333.61 per dollar, the October 12, 2026 rate.
The answer to the first question is foreigners and retail investors. Samsung Electronics bought KRW 15tn worth of its own shares (56,856,305 shares) over 29 trading days from August 24 to October 6, while over the same period foreigners sold KRW 8.30tn and retail investors KRW 7.29tn. The company took 96% of the KRW 15.59tn of combined net selling. SK hynix bought KRW 35.72tn (about $26.8bn) over 34 trading days from August 20 to October 12, while foreigners sold KRW 21.04tn, retail KRW 11.58tn and institutions KRW 2.74tn. The company took 101% of the KRW 35.37tn of combined net selling. On their own, the companies bought 11.4% (Samsung) and 18.2% (SK hynix) of all trading value in those periods, more than Samsung’s previous ten buybacks since 2017 (2.2% to 8.4%) and SK hynix’s 2018 buyback (14.2%). This was the biggest support in either company’s history.
The answer to the second question is a band centered on the companies’ average buyback prices. During the buyback, Samsung Electronics closed between KRW 248,500 (September 15) and KRW 285,500 (September 23), and the company’s average buyback price of KRW 263,823 is almost the same as the market-wide average trade price of KRW 264,426 over the same period. SK hynix closed between KRW 1,596,000 (September 3) and KRW 1,868,000, and the company’s average buyback price is KRW 1,749,576 (executions through October 8). The price bands where trading value piled up most were Samsung’s KRW 270k band (35.5%) and SK hynix’s KRW 1.70mn band (26.3%). The October 12 closes of KRW 250,500 and KRW 1,605,000 are 0.8% and 0.6% above the floor of that band.
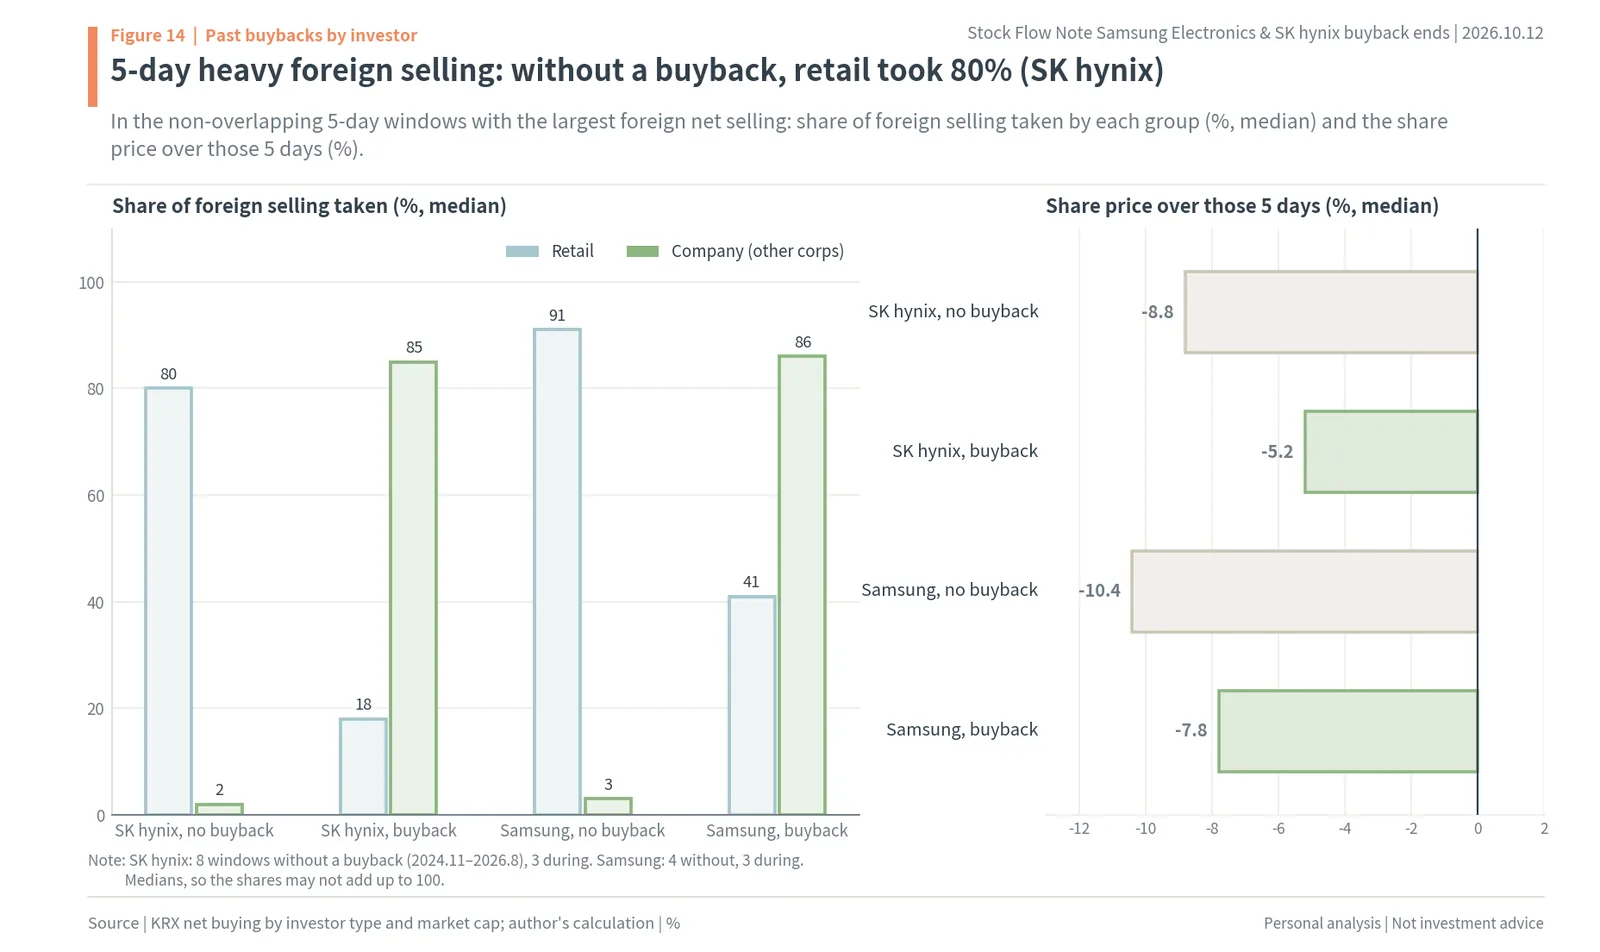
The third question takes the two stocks separately. In nine of Samsung’s ten previous buybacks, foreigners were net sellers during the buyback, and after the company stepped away its place was filled by a mix of lighter foreign selling and more retail buying. This time, in the 3 trading days after the buyback ended (October 7, 8 and 12), retail filled the gap almost alone. Retail bought KRW 2.62tn, while institutions sold KRW 1.73tn and foreigners KRW 0.93tn. At SK hynix, in periods without a company buyback, when foreigners sold a median 0.78% of market cap over five trading days, retail took 80% of it and the shares fell 8.8%. In the heavy selling windows of this buyback, the company took 85%.
The answer to the fourth question is the range. The average daily move during the buybacks (the average of the absolute daily percentage changes) was 2.22% for Samsung and 2.85% for SK hynix, less than half that of the 60 trading days before the buybacks (5.40% and 6.14%). After Samsung’s past buybacks ended, volatility over the next 20 trading days was 1.1 times the buyback-period level (median). The author put this ratio and the rough pre-buyback market at the two ends and calculated ranges by horizon. The one-month (November 9) range is KRW 214,900 to 291,900 for Samsung and KRW 1,330,000 to 1,937,000 for SK hynix, and in a market as rough as before the buybacks, the daily swing (one daily standard deviation) grows to KRW 17,400 for Samsung and KRW 130,000 for SK hynix.
The answer to the fifth question is the schedule and the money. If SK hynix buys the remaining KRW 4.28tn at 400,000 shares a day, it finishes around October 21, and the company said it will announce the size of further shareholder returns, including dividends and buybacks, with its third-quarter results. Taking 50% of the 2025-2026 FCF consensus and subtracting this KRW 40tn and dividends leaves KRW 53.8tn (about $40.3bn) of room. Samsung will decide at its January 2027 board meeting how to deliver the remaining KRW 60tn to 80tn (about $45.0bn to $60.0bn) of its 2026 shareholder return of KRW 90tn to 110tn. In the two days after a resolution to buy back shares for cancellation, the median excess return was +2.9 percentage points, while all four resolutions to buy back shares for employee compensation were followed by declines (median -2.0 percentage points). So whether the next resolution is for cancellation, and how much is bought each day, will set the width and position of the next band.
How a buyback shows up in KRX flow data: other corporations’ net buying was 0.99x SK hynix’s buyback
Daily trading by investor type in the Korean market is split into foreigners, institutions, individuals (retail) and other corporations. Institutions are financial firms such as brokerages (financial investment), insurers, asset managers (public funds), private funds, banks and pension funds; other corporations are ordinary companies not classed as institutions. When a company buys its own shares on the market through a broker, that purchase is counted as net buying by other corporations. So during a buyback the usually quiet other-corporations column suddenly grows. SBS Biz reported that other corporations net bought more than KRW 1tn a day for six straight trading days from August 20 to 27, against an average daily net purchase of KRW 18.7bn from August 1 to 19.
The author checked this link date by date. Comparing SK hynix’s daily buyback amounts (a table compiling execution filings on KIND, the Korea Exchange’s disclosure site) with KRX other-corporations net buying over the 33 trading days from August 20 to October 8, other-corporations net buying was 0.95 to 1.02 times the company’s buyback on every day, and 0.99 times for the period as a whole. For Samsung Electronics, compared with the daily acquisition amounts in its result report on DART (Korea’s electronic disclosure system), the 29-day total was 0.98 times. Trading by other ordinary companies is mixed in, but in this period most of the other-corporations column is the company itself. That is why this report reads “company buying” and “other-corporations net buying” as the same flow.
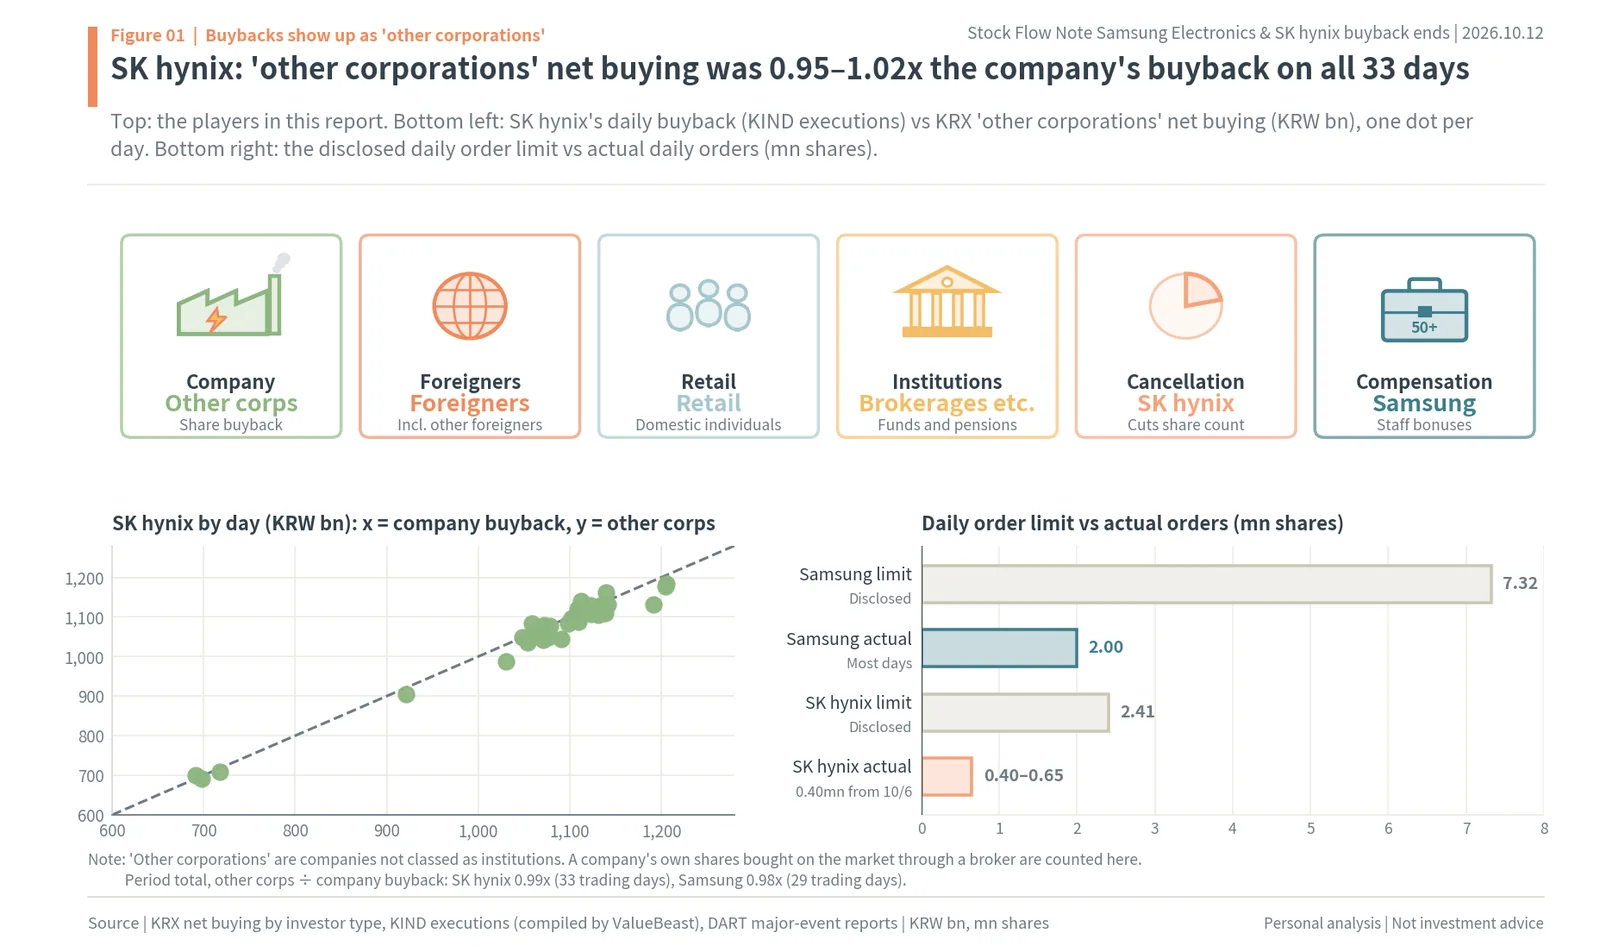
Buybacks come with a daily order limit. Korea’s Regulations on Issuance and Disclosure of Securities set the daily limit at the larger of 10% of the shares reported for acquisition and 25% of average daily volume over the previous month, within 1% of total shares outstanding. SK hynix’s daily limit was 2,407,000 shares, and its actual orders were 400,000 to 650,000 shares a day. Samsung Electronics had a daily limit of 7,321,653 shares and actually ordered 2 million shares a day (1.8 million on the first day and 1,056,305 on the last). Both companies bought far less than the limit, but the same amount every day. A buyer that buys a set amount at the same time every day is a buyer that takes up supply without haggling over price.
The purposes differ, too. Samsung Electronics’ KRW 15tn is, according to its filing, for “employee stock compensation”. It buys in advance the shares it will hand out as stock-based pay, such as performance incentives and special business performance bonuses. SK hynix’s KRW 40tn is for “enhancing shareholder value through the cancellation of treasury shares”, and every share bought will be cancelled once the purchase is complete. Compensation shares later pass to employees and can come back onto the market; cancelled shares reduce the number of shares outstanding itself. The later section on what happens when the next buyback comes shows in numbers that the market reacts differently to the two even though both are buybacks.
In short, during a buyback the other-corporations column of the flow table shows the company’s buying almost as it is. So this report reads the flows during the buybacks as “who handed shares to the company” and the flows after the buybacks as “who filled the place the company left”.
Key terms: net buying, share of trading value, volume profile, volatility, bp and excess return
Net buying is the amount bought minus the amount sold. Because someone sells whenever someone buys, net buying across all investors adds up to zero. So when one group buys heavily, the others sold that much, and “the company bought KRW 15tn” means the same as “everyone else together handed KRW 15tn of shares to the company”.
The company’s share of trading value is what the company bought in a period divided by all trading value in that period. 11.4% means that of every KRW 100 of Samsung Electronics shares that changed hands in that period, the company bought KRW 11.4. The company only buys, so on the buy side its weight is even bigger than this figure.
A volume profile stacks up how much trading took place in each price band. A band with heavy trading is a price at which many people bought. This report looks only at the volume profile of the buyback periods.
Daily swings are measured two ways. The average daily move is the average of the absolute daily percentage changes. For days of +3%, -1% and +2%, it is (3+1+2)÷3 = 2%. The standard deviation measures how widely daily changes spread around their average and is used to calculate ranges by horizon. The annualized standard deviation is the daily standard deviation multiplied by the square root of 252 (about 15.9).
A basis point (bp) is 0.01%. Buying 1bp of market cap in a day means buying KRW 100bn of shares a day in a company worth KRW 1,000tn. Market cap differs from one buyback to the next, so comparisons with past buybacks use bp.
Excess return is a stock’s return minus the KOSPI’s return over the same period, in percentage points. The resolution reaction is the excess return over the two days starting the trading day after a buyback resolution. Cancellation means a company retires the shares it bought, reducing the number of shares outstanding; a compensation buyback hands the shares it bought to employees as bonuses. FCF (free cash flow) is cash earned from operations minus capital spending, the yardstick both companies use for shareholder returns.
October 12: KOSPI -3.65% as foreigners sell KRW 2tn, and SK hynix’s buyback takes 64%
On October 12 the KOSPI fell 241.69 points (3.65%) to close at 6,384.24. It was the fourth straight decline, and the first close below 6,400 in about two months, since August 11. The KOSDAQ, Korea’s smaller tech-heavy board, fell 4.83% to 849.19. The trigger came from the US. While Korea was closed for Hangul Day (October 9, a public holiday), the Philadelphia Semiconductor Index fell 3.39% on the 8th (local time) and 0.41% on the 9th, and a report that OpenAI’s annualized revenue at the end of September fell short of expectations raised fresh questions about how fast the AI industry is growing. The chance of Chinese memory makers gaining share and high US long-term rates were also cited. Kang Jin-hyuk of Shinhan Investment & Securities said overseas bad news hit just as the KOSPI had already broken below the lower edge of its uptrend on flows from the October 8 options expiry and ETF rebalancing, and Lee Jae-won of Yuanta Securities said the biggest worry is not chip earnings but foreign flows.
Foreigners sold KRW 2,018.6bn (about $1.51bn) on the KOSPI that day, and retail bought KRW 1,467.4bn. KRX net buying by investor type for the two stocks (foreigners plus other foreigners) shows that different buyers took the selling. At Samsung Electronics, foreigners sold KRW 552.6bn and institutions KRW 433.4bn (private funds -KRW 410.4bn), and retail bought KRW 975.3bn. Other corporations came to KRW 10.7bn, effectively zero, because the company’s buyback ended on October 6. At SK hynix, foreigners sold KRW 1,005.7bn, while other corporations (the company) bought KRW 643.9bn, institutions KRW 197.8bn and retail KRW 163.9bn. The company took 64% of the foreign selling.
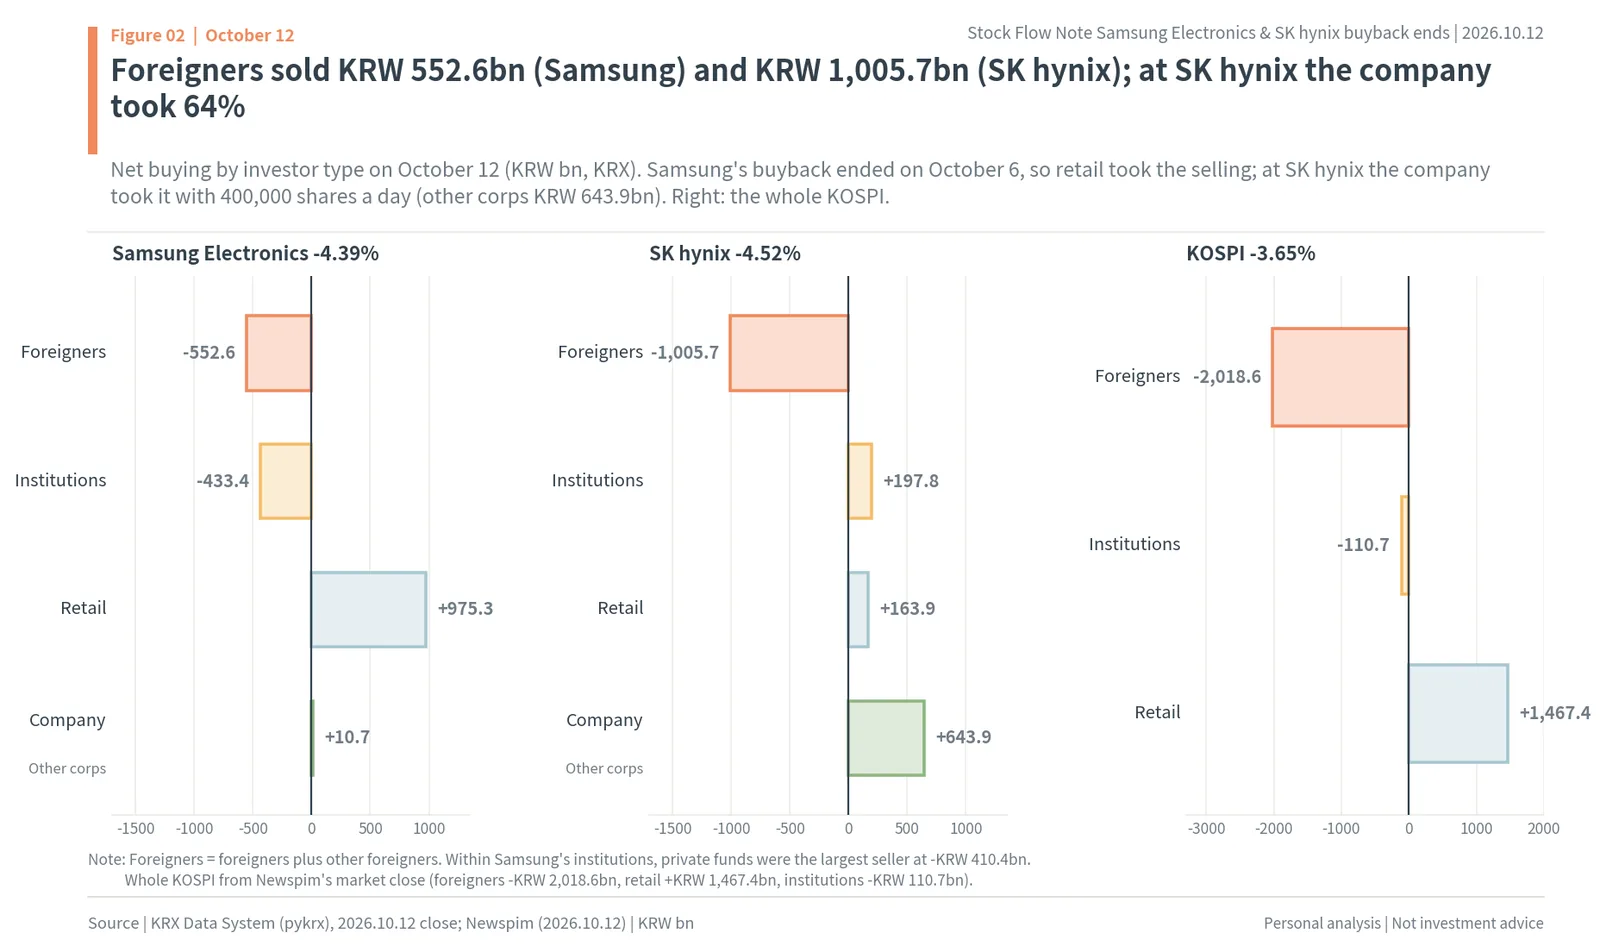
Widening the view to the sector, in electrical and electronics, the KOSPI sector both stocks belong to, foreigners sold KRW 1,708.0bn and institutions KRW 569.0bn, and retail bought KRW 1,624.0bn. Net buying by other corporations across the whole KOSPI was KRW 648.5bn, about the same size as the company buyback in SK hynix alone. Compared with late August, when other corporations were buying more than KRW 1tn a day, the support had shrunk to less than two-thirds.
Samsung Electronics closed at KRW 250,500 (-4.39%) and SK hynix at KRW 1,605,000 (-4.52%), falling by almost the same amount. Samsung opened at KRW 260,000, rose to KRW 262,500 and was pushed down to KRW 249,500, while SK hynix opened at KRW 1,640,000 and closed at its intraday low. The day’s fall was 1.4 times (Samsung) and 1.1 times (SK hynix) the daily standard deviation during the buybacks. Samsung Electronics reported a preliminary third-quarter operating profit of KRW 107.4tn (about $80.5bn, a record) on October 8, yet its shares fell for three straight trading days from October 7, the first day after the buyback ended, from KRW 272,000 to KRW 250,500 (-7.9%).
So today’s question is less about the size of the bad news than about who takes the selling. Even with the same amount of foreign selling, while the company is taking several hundred billion won a day, retail’s share is small; once the company steps away, retail has to take more, and at lower prices. The rest of this report measures in numbers how big that support was, what price line it held, and how much the shares can swing once it is gone.
Samsung’s KRW 15tn buyback ended October 6; SK hynix’s KRW 40tn buyback is 89.3% done
At a board meeting on August 19, SK hynix decided to buy 24.07 million common shares worth KRW 40,004.34bn on the market from August 20 to November 19 and to cancel all of them. The filing calculated the planned number of shares from the planned amount and the previous day’s close (KRW 1,662,000), and noted that the number of shares could change as the price moves. In other words, the amount is what sets the purchase. On the same day the company raised its policy to return at least 50% of cumulative 2025-2027 FCF (free cash flow) to shareholders.
At a board meeting on August 21, Samsung Electronics decided to buy KRW 15tn of its own shares (53,285,968 shares at the resolution-day close of KRW 281,500) from August 24 to November 21. The purpose is employee stock compensation. The same board set a 2026 shareholder return of KRW 90tn to 110tn (about $67.5bn to $82.5bn): a third-quarter cash dividend of about KRW 30tn will be confirmed at a board meeting in late October, and the method for the remaining KRW 60tn to 80tn, split between cash dividends and buybacks and cancellation, will be decided at a board meeting in January 2027. The KRW 15tn compensation buyback is counted separately from this return.

The buying was handed to brokers: SK Securities alone for SK hynix, and Samsung Securities, Shinhan Investment & Securities and KB Securities for Samsung. Samsung finished 46 days ahead of plan. Its DART result report shows it started with 1.8 million shares on August 24, bought 2 million shares on most days and finished with 1,056,305 shares on October 6. Over 29 trading days it bought 56,856,305 shares for KRW 14,999,999,899,750, an average of KRW 263,823. That is KRW 517.2bn a day on average. Its treasury shares now total 136,727,099 (2.34% of common shares).
SK hynix bought 650,000 shares a day from August 20, then slowed to 600,000 from September 21, 500,000 on October 2 and 400,000 from October 6. Confirmed executions over the 33 trading days through October 8 come to 20.05 million shares and KRW 35.08tn (average KRW 1,749,576); using other-corporations net buying of KRW 643.9bn in place of the 400,000 shares ordered on October 12 brings the cumulative total to KRW 35.72tn, 89.3% of the target amount. The daily average over 34 trading days was KRW 1,050.7bn, and over the four trading days from October 6 it was KRW 687.7bn a day. KRW 4.28tn remains.
So as of October 12 the two companies’ support is at different stages. At Samsung the support is already gone and this is the third trading day without it; at SK hynix a reduced support of a little over KRW 600bn a day has a little over a week left.
Who sold during the buybacks: the companies took 96% (Samsung) and 101% (SK hynix) of net selling
Adding up net buying by investor type over Samsung Electronics’ buyback period (August 24 to October 6, 29 trading days), other corporations come to KRW 14.71tn, almost equal to the company’s KRW 15.0tn buyback. On the other side, foreigners sold KRW 8.30tn and retail KRW 7.29tn. Institutions were net buyers of KRW 0.88tn in total, but inside that, brokerages (financial investment) bought KRW 3.78tn while asset managers sold KRW 1.49tn, private funds KRW 0.97tn and pensions KRW 0.41tn. The net sellers (foreigners and retail) add up to KRW 15.59tn, and the company took 96% of it. In shares, foreigners sold 32.50 million and retail 25.69 million, and other corporations bought 55.79 million.
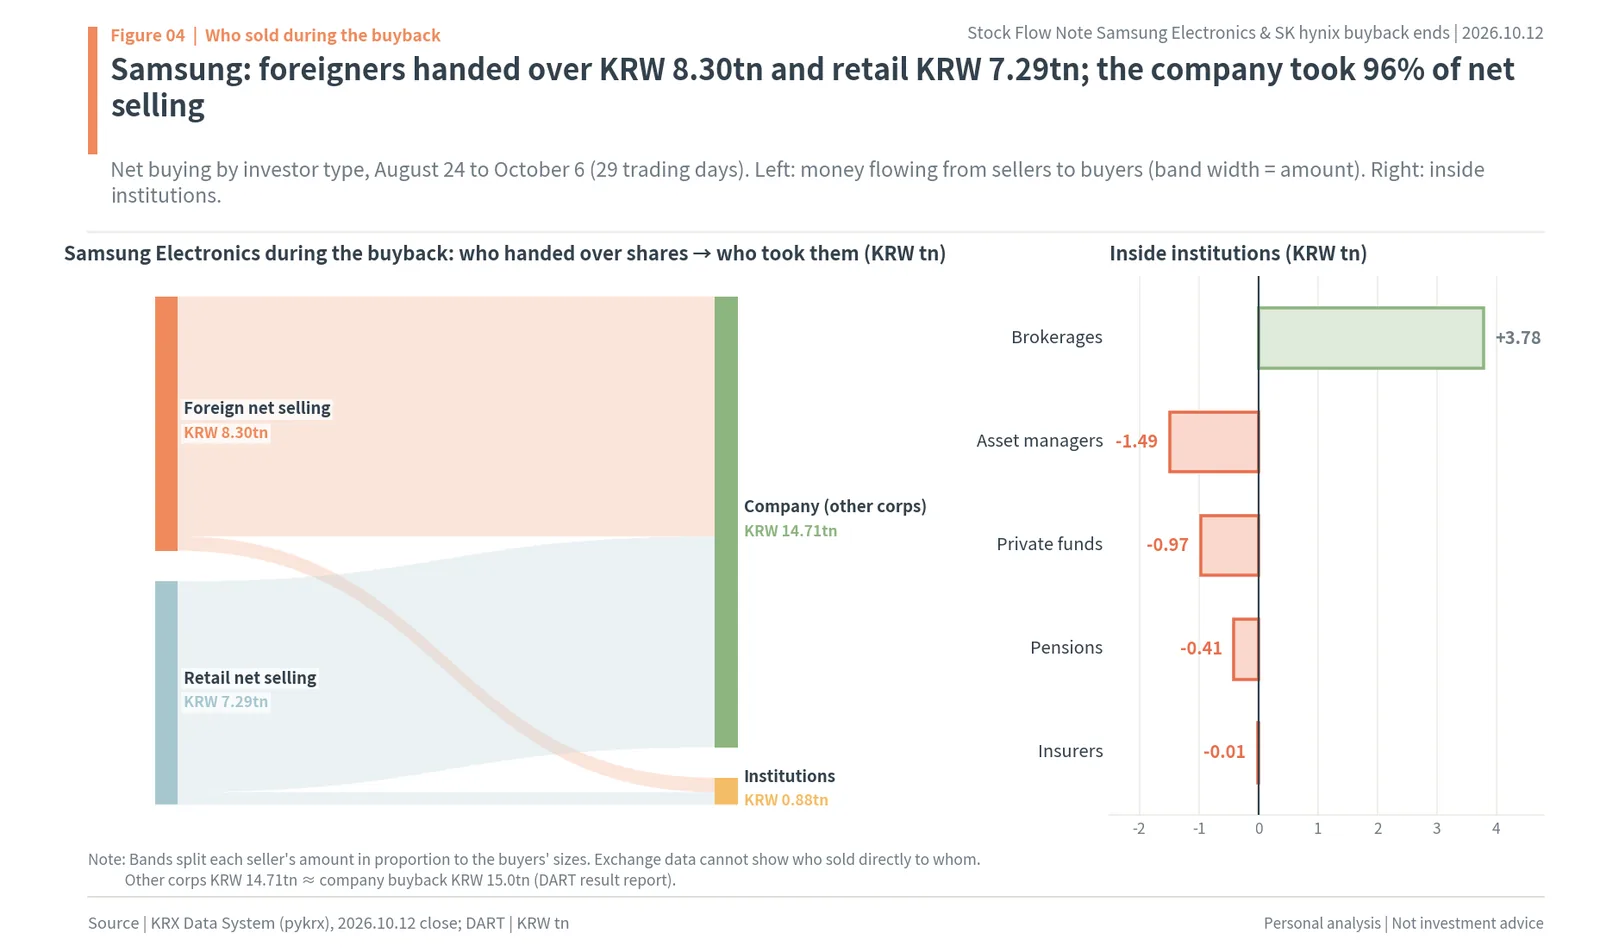
Day by day, the pattern is simple. The company bought about KRW 500bn every day, the same size each time, while foreign selling varied from day to day. On days of heavy foreign selling, retail took part of it; on days of light foreign selling, retail sold too. The company’s share of each day’s trading value ranged from 5.5% to 17.5%. As daily averages over the buyback period, foreigners were -KRW 286.2bn, retail -KRW 251.5bn, institutions +KRW 30.4bn and other corporations +KRW 507.3bn. Foreign ownership fell from 46.87% to 46.31%. So Samsung’s buyback period was a one-way flow: “foreigners and retail sell, the company takes”.
SK hynix’s buyback period (August 20 to October 12, 34 trading days) shows the same flow on a bigger scale. Other corporations bought KRW 35.37tn, while foreigners sold KRW 21.04tn, retail KRW 11.58tn and institutions KRW 2.74tn. Inside institutions, asset managers sold KRW 1.39tn, brokerages KRW 1.02tn and private funds KRW 0.24tn. Total net selling was KRW 35.37tn, matching the company’s KRW 35.72tn buyback, so the company took 101%. In shares, foreigners sold 12.17 million and retail 6.40 million, and other corporations bought 20.24 million. Foreign ownership fell 1.56 percentage points, from 50.99% to 49.43%.
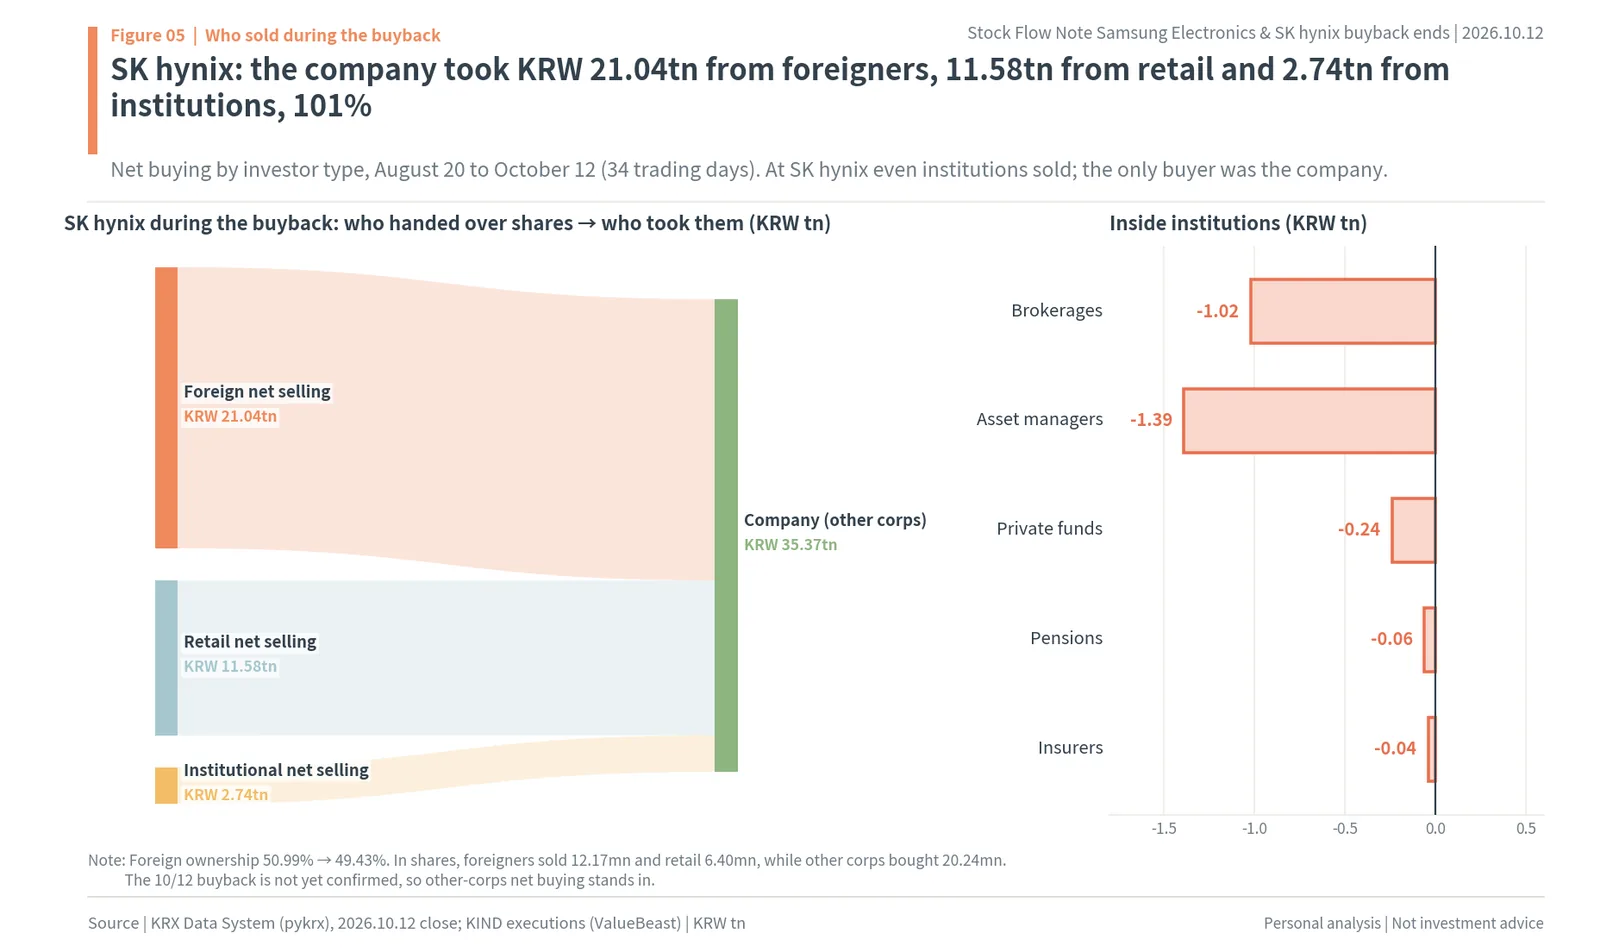
SK hynix’s daily averages were foreigners -KRW 618.8bn, retail -KRW 340.7bn, institutions -KRW 80.7bn and other corporations +KRW 1,040.2bn. The company’s share of each day’s trading value ranged from 12.0% to 27.2%. With the company buying KRW 1tn a day even while foreigners sold more than KRW 600bn a day, retail could actually sell. SK hynix without a company buyback was the exact opposite. In every stretch of heavy foreign selling, retail took 80% of it (median). This comparison comes back in the section on past buybacks.
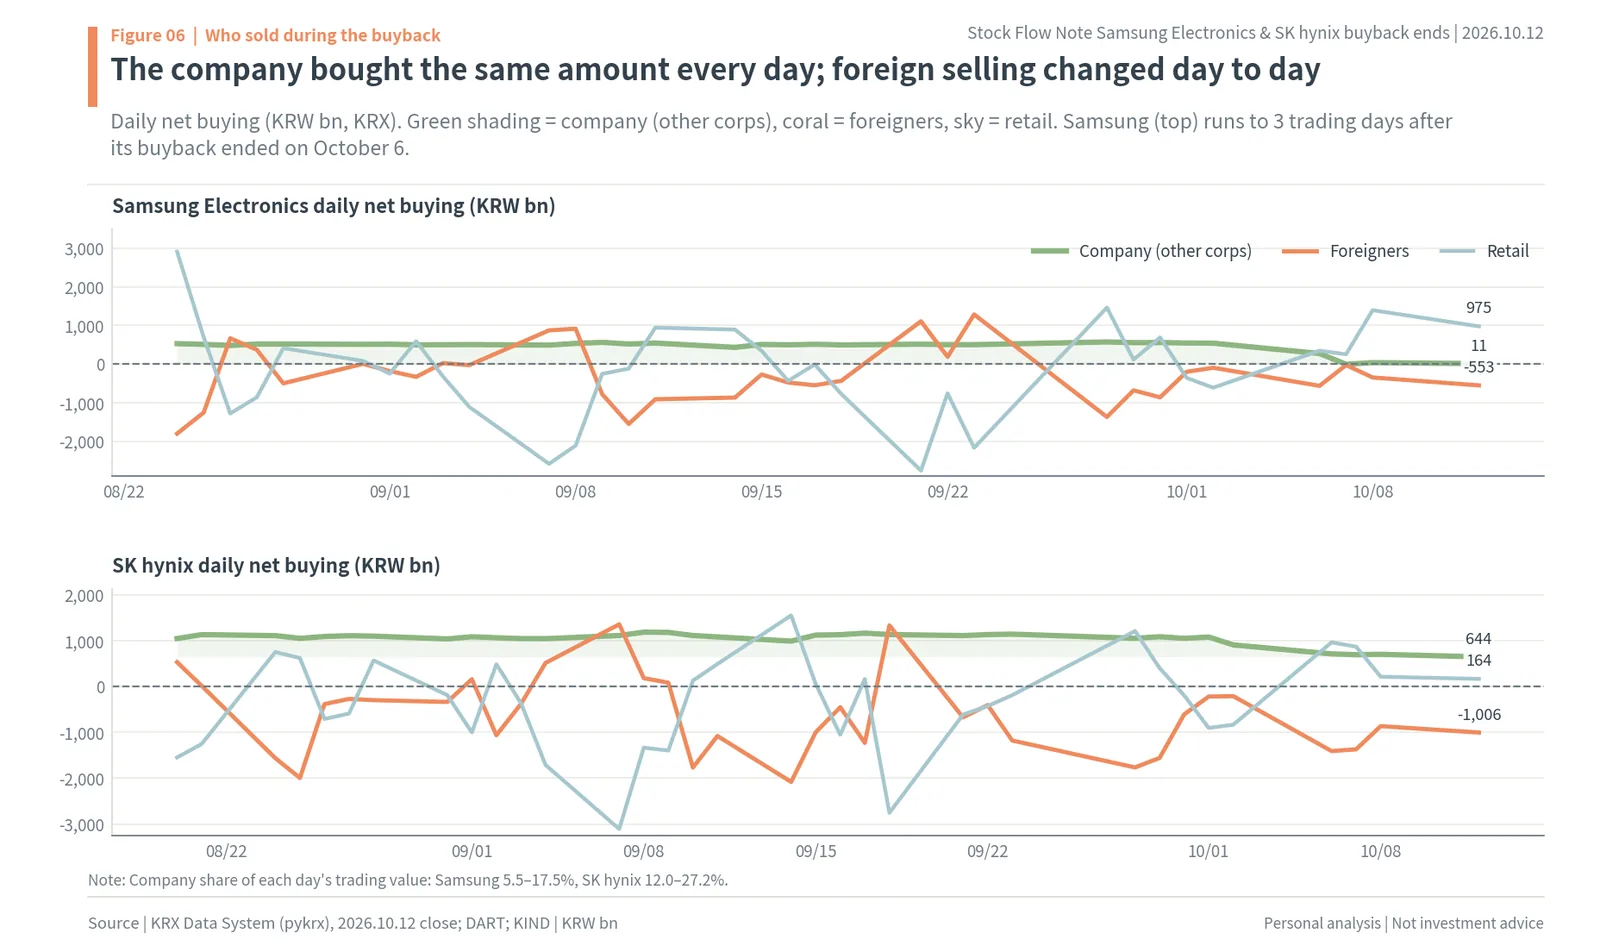
In Figure 06, the green line (the company) is almost flat for both stocks, while the coral line (foreigners) and the sky-blue line (retail) swing widely up and down. In the last 3 trading days at the right end of the Samsung chart, the green line drops to zero and the sky-blue line rises above it. Retail filling the place the company left is visible in the daily lines as well.
The two stocks moved in different directions during the buybacks. Samsung Electronics fell 3.4% from KRW 281,500 at the resolution-day (August 21) close to KRW 272,000 on the last buyback day, while the KOSPI rose 0.4% over the same period. SK hynix rose 7.0% from KRW 1,500,000 at the resolution-day (August 19) close to KRW 1,605,000 on October 12, while the KOSPI fell 1.3%. The amount the companies absorbed pointed the same way, yet the share prices went different ways, so what the support set was not the direction but the size of the swings. That is why the following sections measure price lines and ranges rather than direction.
Institutional flows: brokerages bought KRW 3.78tn of Samsung while funds and pensions sold
Institutions look small in total, but inside them the directions split. Samsung Electronics’ institutions were net buyers of KRW 0.88tn over the buyback period, but brokerages (financial investment, the account for brokers’ own trading and ETF liquidity provision) bought KRW 3.78tn, while asset managers (public funds) sold KRW 1.49tn, private funds KRW 0.97tn, pensions KRW 0.41tn and insurers KRW 0.01tn. Buying in brokerage accounts is largely trading to match index futures and options and ETF creations; selling in fund accounts is managers cutting their equity weight. So during Samsung’s buyback, the “real buyers” were the company and the brokerage accounts, while funds and pensions stood with those handing shares to the company.
At SK hynix, institutions were net sellers of KRW 2.74tn even in total. Asset managers (KRW 1.39tn), brokerages (KRW 1.02tn), private funds (KRW 0.24tn), pensions (KRW 0.06tn) and insurers (KRW 0.04tn) were all net sellers. During SK hynix’s buyback, foreigners, retail and institutions stood on one side and the company alone on the other.
After the buyback ended, Samsung’s institutions leaned heavily to the selling side. On October 7 institutions sold KRW 219.8bn (brokerages -KRW 112.3bn), and on October 8 they sold KRW 1,081.3bn, of which brokerages accounted for KRW 997.9bn. October 8 was an options expiry day that coincided with a chip ETF rebalancing. Kang Jin-hyuk of Shinhan Investment & Securities saw these expiry and rebalancing flows as what pushed the KOSPI below the lower edge of its uptrend. On October 12, private funds sold KRW 410.4bn and asset managers KRW 193.6bn, while pensions and insurers bought small amounts.
So the selling in the first three days after the company stepped away did not come from foreigners alone. Brokerage accounts sold in one go on expiry day, and private funds and asset managers followed. Retail’s KRW 2.62tn (about $1.96bn) of net buying absorbed what foreigners and institutions put on the market together. While the company was buying, it took the first KRW 500bn of such days’ selling every day.
Heavy foreign selling days: the buyback took 26% to 63% of the selling
The company’s buying is a fixed amount a day. So on days when foreigners sold more than usual, the company’s share shrank, and retail or institutions had to take the rest. The three days of heaviest foreign net selling during each buyback show the pattern.
At Samsung Electronics, on August 24, the first day of the buyback, foreigners sold KRW 1,801.1bn. The company bought KRW 468.2bn (26%), institutions also sold KRW 1,634.2bn, and retail took the selling by buying KRW 2,908.1bn. The share price fell 8.70% that day. On September 10 foreigners sold KRW 1,551.6bn, but institutions bought KRW 1,152.6bn and the company took KRW 534.2bn (34%), so the price fell only 0.19%. On September 28, against KRW 1,370.4bn of foreign selling, the company took KRW 549.5bn (40%) and retail KRW 1,462.4bn, and the price fell 5.43%.
At SK hynix, on September 14 foreigners sold KRW 2,082.2bn, the company took KRW 1,030.3bn (49%) and retail KRW 1,547.5bn, and the price fell 6.35%. On August 25, KRW 1,995.7bn of foreign selling was taken by the company (KRW 1,048.0bn, 53%), retail (KRW 618.9bn) and institutions (KRW 328.1bn), and the price rose 0.42%. On September 10, KRW 1,769.1bn of foreign selling was taken by the company (KRW 1,108.6bn, 63%) and institutions (KRW 533.2bn), and the price fell only 0.16%.
Looking at those three days for each stock, the company’s support was not a perfect shield on any single day. On days when foreigners sold close to KRW 2tn, the company took between a quarter and two-thirds of it, and depending on who took the rest, the price fell 8.70% or rose 0.42% that day. The support’s strength comes not from one day but from the days adding up. Over the whole buyback period the companies took 96% and 101% of net selling, and that is why the share prices stayed inside the band.
So the question after the buyback ends is not “who takes it on a day of heavy foreign selling” but “who takes it every day when such days follow one another”. As days without the company add up, retail and institutions have to take all of it on each day of heavy selling.
Biggest buybacks ever: 11.4% and 18.2% of trading value vs 2.2% to 8.4% before
The fair way to measure how big a company’s buying is in the flows is not the amount but its share of trading value in that period, because Samsung in 2017 and Samsung in 2026 have different share prices and different trading value. The author divided the daily acquisition amounts (common shares) in the DART result reports by KRX common-share trading value over the same periods.
Samsung Electronics’ previous ten buybacks ranged from 2.2% to 8.4%. The four in 2017 (a KRW 9.3tn program) were 8.4%, 7.0%, 5.1% and 5.0%, and the three from November 2024 to September 2025 (a KRW 10tn program) were 4.5%, 4.8% and 4.7%. The three from January to April 2026 were 5.3%, 2.2% and 6.6%. This KRW 15tn buyback was 11.4%, bigger than the largest before it, January to April 2017 (8.4%). In January to March 2026, when trading was hottest, even KRW 3.57tn of buying came to only 2.2%, whereas this time the company concentrated an average of KRW 517.2bn a day into 29 trading days.
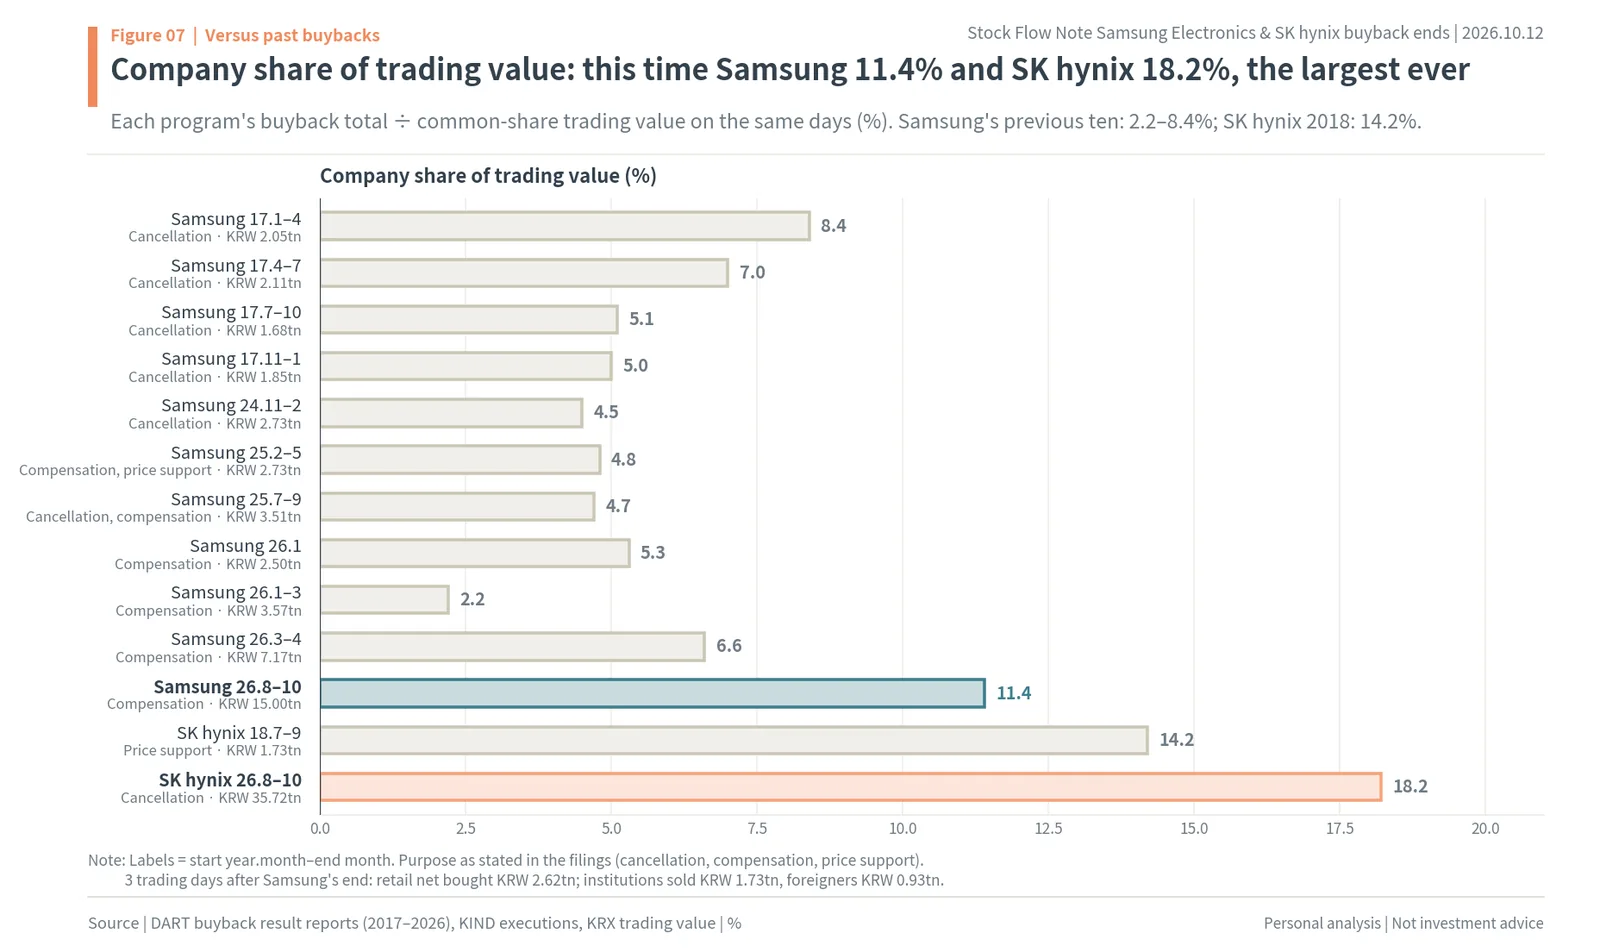
SK hynix’s only previous buyback ran from July to September 2018. It bought 22 million shares for KRW 1,733.7bn over 41 trading days, with the stated purpose of securing a fair share price. The company’s share then was 14.2%, and 30.2% on the biggest day. This time the biggest single day was 27.2% for SK hynix and 17.5% for Samsung. The current KRW 40tn buyback came to 18.2%, bigger than 2018. The shares bought in 2018 were held rather than cancelled, and SK hynix cancelled 15.3 million treasury shares in January 2026.
A bigger share also means a bigger hole when the company steps away. Samsung’s KRW 517.2bn a day and SK hynix’s KRW 1,050.7bn a day (KRW 687.7bn over the latest four trading days) disappear at the same time every day. When Samsung’s past buybacks ended, the share that disappeared was 2.2% to 8.4% of trading value; this time it is 11.4% and 18.2%. So the “change after the end” seen in past buybacks should be read as a lower bound of what may show up more strongly this time.
Support price: Samsung held around KRW 263,823 and SK hynix around KRW 1,749,576
During the 29 trading days of the buyback, Samsung Electronics closed between KRW 248,500 (September 15) and KRW 285,500 (September 23). Intraday it fell as low as KRW 243,000 (September 3), but it closed above that. The company’s average buyback price is KRW 263,823, and the market-wide average trade price over the same period (trading value ÷ volume) is KRW 264,426. Because the company bought the same amount every day, spread across the whole session, its average price comes out almost the same as the market average. So the company’s average price becomes the center line of the price band in that period.

The company’s average daily purchase price ranged from KRW 249,701 (September 15) to KRW 283,484 (September 23) at Samsung, and from KRW 1,612,262 (August 25) to KRW 1,902,595 (September 22) at SK hynix. The company bought the same amount on cheap days and dear days alike. On days when the price fell, the same money bought more shares, so the lower the price band, the bigger the company’s share. Samsung’s closing low (KRW 248,500) and the company’s lowest purchase price (KRW 249,701) fell on the same day (September 15) at almost the same price, which shows exactly that.
SK hynix closed between KRW 1,596,000 (September 3) and KRW 1,868,000 during the buyback, with an intraday low of KRW 1,557,000 (August 25) and an intraday high of KRW 1,935,000 (September 22). The company’s average buyback price through executions on October 8 is KRW 1,749,576, and the market average trade price is KRW 1,745,974. Compared with the 60 trading days before the buybacks, when SK hynix closed anywhere from KRW 1,322,000 to KRW 2,919,000 and Samsung from KRW 207,000 to KRW 362,500, the band narrowed sharply.

Where trading concentrated is shown by the volume profile. The author stacked each day’s trading value during the buyback at the price band of that day’s average trade price (bands of KRW 10,000 for Samsung and KRW 50,000 for SK hynix). For Samsung, the KRW 270k band was the thickest at 35.5% of trading value, followed by the KRW 250k band at 32.5% and the KRW 260k band at 25.4%. The company bought KRW 5.60tn in the KRW 250k band and KRW 5.22tn in the KRW 270k band. For SK hynix, the KRW 1.70mn band (KRW 1.70mn to 1.75mn) was the thickest at 26.3%, with the KRW 1.75mn band at 19.3% and the KRW 1.80mn band at 19.9%. The company bought KRW 9.14tn in the KRW 1.70mn band and KRW 7.27tn in the KRW 1.75mn band.
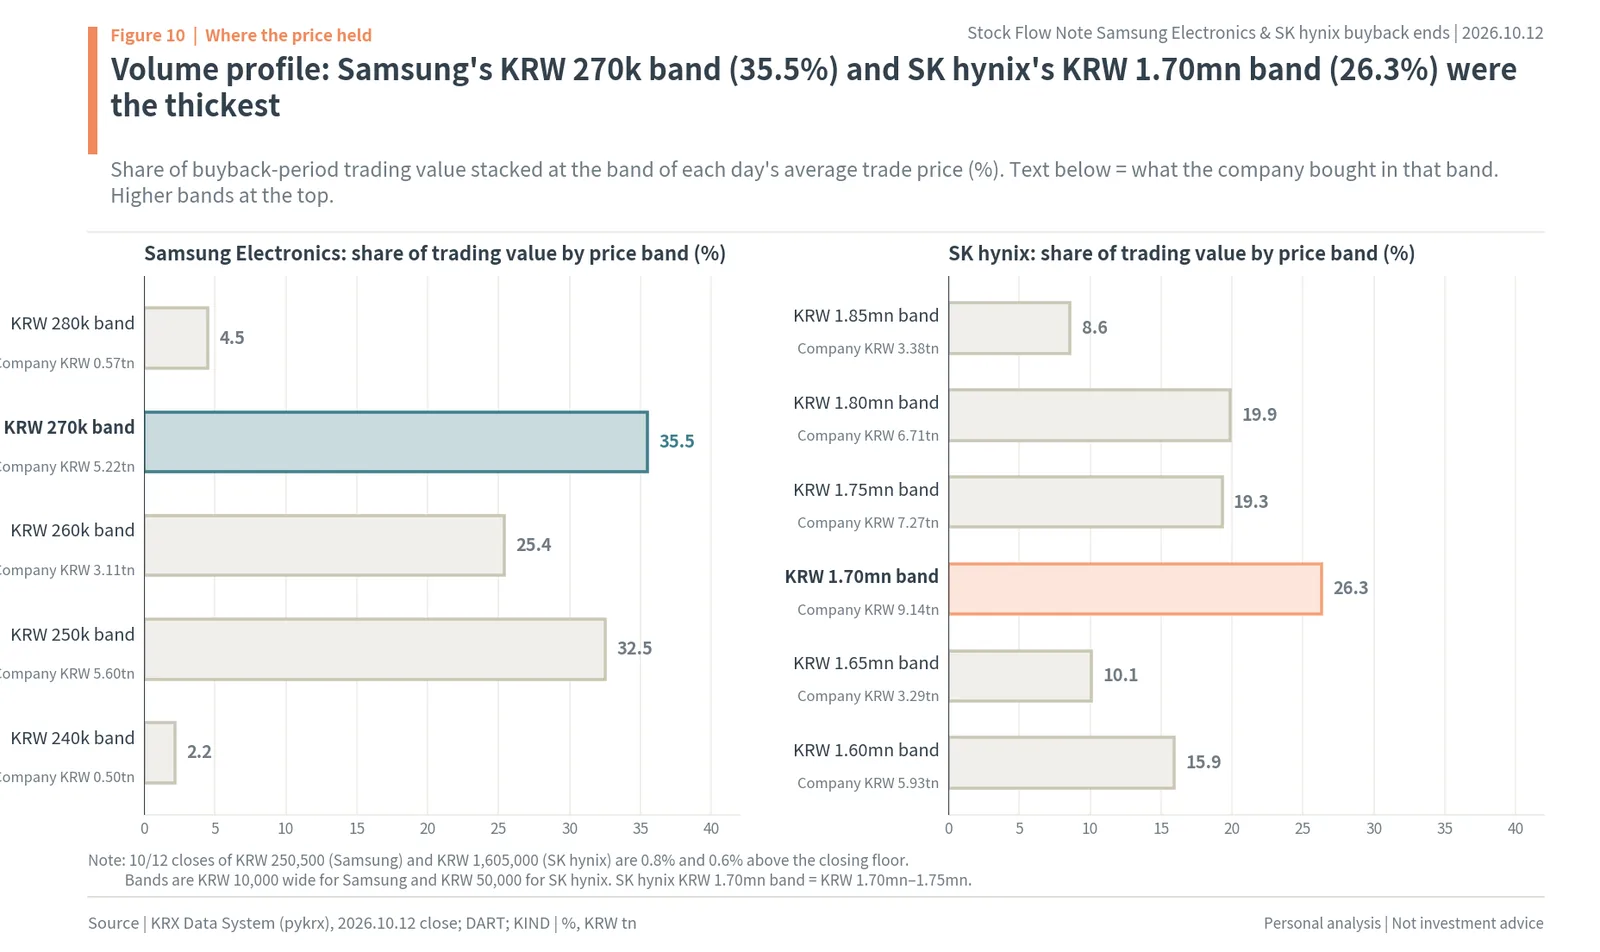
A thick band means many people bought at that price. Trading value during the buybacks was KRW 132.1tn for Samsung and KRW 195.8tn for SK hynix, and most of it changed hands in the KRW 250k to 280k bands and the KRW 1.60mn to 1.85mn bands. The October 12 closes of KRW 250,500 and KRW 1,605,000 are 0.8% and 0.6% above the floor of the band (KRW 248,500 and KRW 1,596,000 on a closing basis). Against the companies’ average buyback prices, Samsung is 5.0% below and SK hynix 8.3% below.
So both stocks are now standing at the bottom of the band the companies were propping up, and above them sits a thick layer of shares bought during the buybacks. Below the floor there was almost no trading during the buybacks. Samsung’s KRW 240k band holds only 2.2% of trading value, and SK hynix had no day on which its average trade price was below KRW 1.60mn.
Volatility halved during the buybacks: average daily move 2.22% (Samsung) and 2.85% (SK hynix)
Swings are measured by the size of daily price changes. The author uses two yardsticks. One is the average daily move, the average of the absolute daily changes. It is easy to read. The other is the standard deviation of daily changes, used to calculate ranges by horizon. Multiplying the daily standard deviation by the square root of the number of trading days gives the range for that horizon.
Samsung Electronics’ average daily move was 2.22% during the buyback. It was 5.40% in the 60 trading days before (May 27 to August 21), so it fell by more than half. SK hynix was 2.85% during the buyback and 6.14% in the prior 60 trading days (May 22 to August 19). Converted to an annual basis, Samsung’s standard deviation fell from 110.3% before to 49.4% during the buyback, and SK hynix’s from 128.9% to 62.6%. In won, the daily standard deviation at the October 12 close is KRW 7,800 for Samsung and KRW 63,000 for SK hynix.
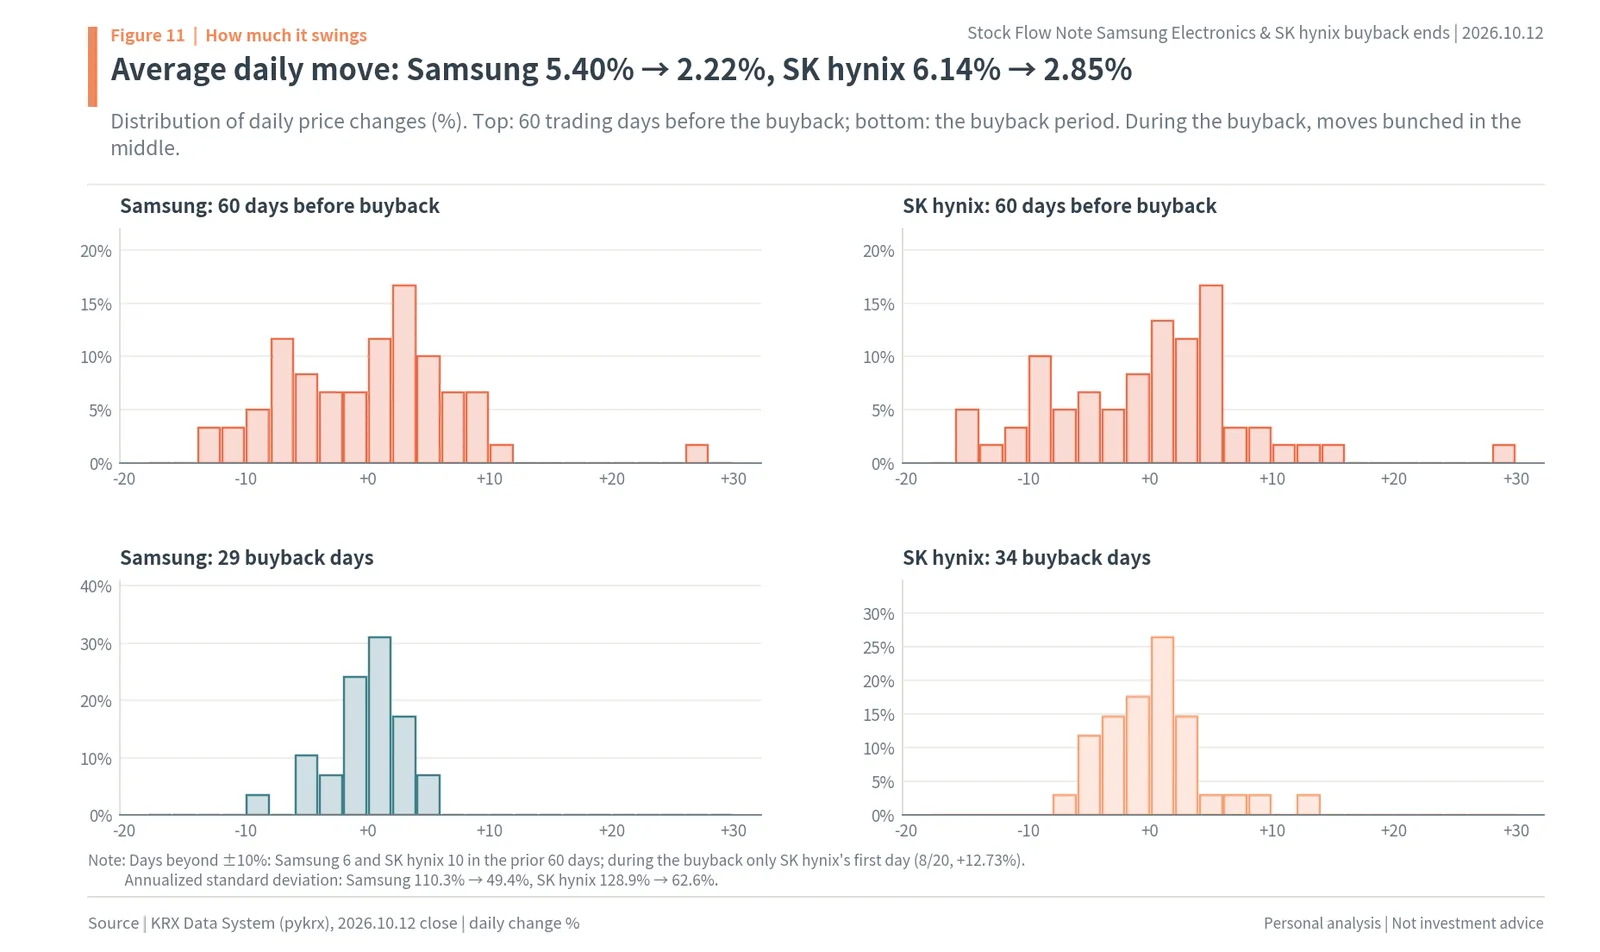
In Figure 11, the top two panels (before the buybacks) have bars spread widely from -15% to +30%, while in the bottom two (during the buybacks) the bars bunch tall near zero. They are the same stocks, yet daily moves while the company was buying and before it started look different enough to belong to different stocks.
The shape of the distribution differs too. In the 60 trading days before the buybacks, daily changes exceeded ±10% on 6 days for Samsung and 10 for SK hynix. During the buybacks there was only one such day, SK hynix’s first day (+12.73% on August 20), and moves beyond ±5% came on only 3 of Samsung’s 29 days and 5 of SK hynix’s 34. During the buybacks there was a buyer buying the same amount at the same time every day, and even on days of heavy foreign selling that buying took a large part of the supply. Samsung’s -4.39% and SK hynix’s -4.52% on October 12 were 1.4 and 1.1 times the buyback-period daily standard deviation.
The whole market also calmed down in the same period. The KOSPI volatility index (VKOSPI) hit 94.81 on June 24, its highest since the index began, and fell to 39.33 on September 4. So the author reads the low swings during the buybacks as the result of “company buying plus a calmer market” and puts the swings after the buybacks between two ends. One end is the ratio seen when Samsung’s past buybacks ended (1.1 times); the other is the market just before the buybacks (2.1 to 2.2 times).
Samsung has already moved into that range. The average daily move in the 3 trading days after its buyback ended (October 7, 8 and 12) was 2.70%, bigger than 2.22% during the buyback. The shares fell on all three days.
So after the buybacks end, the daily standard deviation is between KRW 8,600 and KRW 17,400 for Samsung and between KRW 70,000 and KRW 130,000 for SK hynix (author’s calculation). The low end is the case where things pass quietly as in past buybacks; the high end is the case where, without support, the market goes back to being as rough as before the buybacks.
Samsung’s past buybacks: foreigners sold in 9 of 10, then foreigners and retail filled the gap
Samsung Electronics has bought back shares eleven times from 2017 through this one. The author split each into the buyback period and the 20 trading days after it ended, and compared net buying by investor type as bp (0.01%) of average daily market cap. This removes the difference in market cap between 2017 and 2026.
First, the buyback periods. In nine of the ten completed buybacks, foreigners were net sellers. The exception was July to September 2025, when foreigners bought KRW 6.88tn and retail sold KRW 10.86tn. Retail were net sellers in three of the ten and small net buyers in the rest. Other corporations bought 0.94 to 3.18bp of market cap a day in all ten, and this time it was 3.29bp, the largest. So Samsung’s buyback periods were mostly a “foreigners sell, the company takes” structure, and this time retail joined the sellers too.
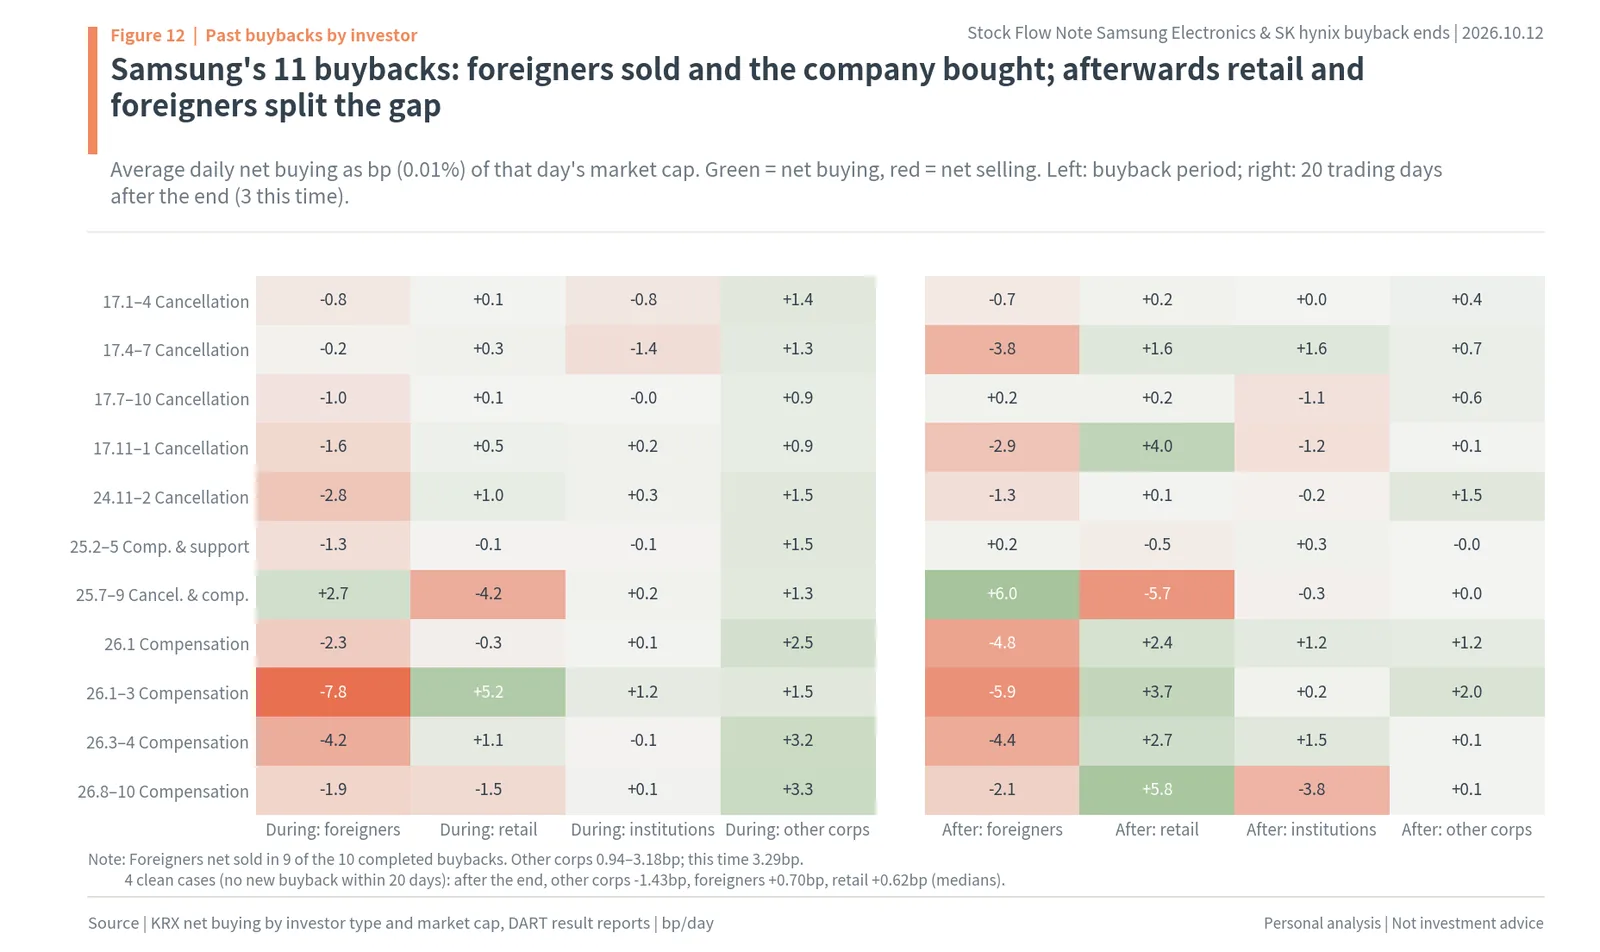
In Figure 12, the fourth column on the left (other corporations during the buyback) is green in all eleven rows, and the first column (foreigners during the buyback) is red in ten of the eleven. On the right, the fourth column (other corporations after the end) has almost lost its color, and the second column (retail after the end) has more green. The green the company used to paint is painted by retail after the end.
Next, after the end. Leaving out the six cases where the next buyback started within 20 trading days, and looking at the four with a clean gap (November 2017 to January 2018, February to May 2025, July to September 2025 and March to April 2026), daily net buying by other corporations fell by a median 1.43bp. That place was filled by foreign selling falling by 0.70bp and retail buying rising by 0.62bp. Foreigners and retail split the place the company left roughly in half.
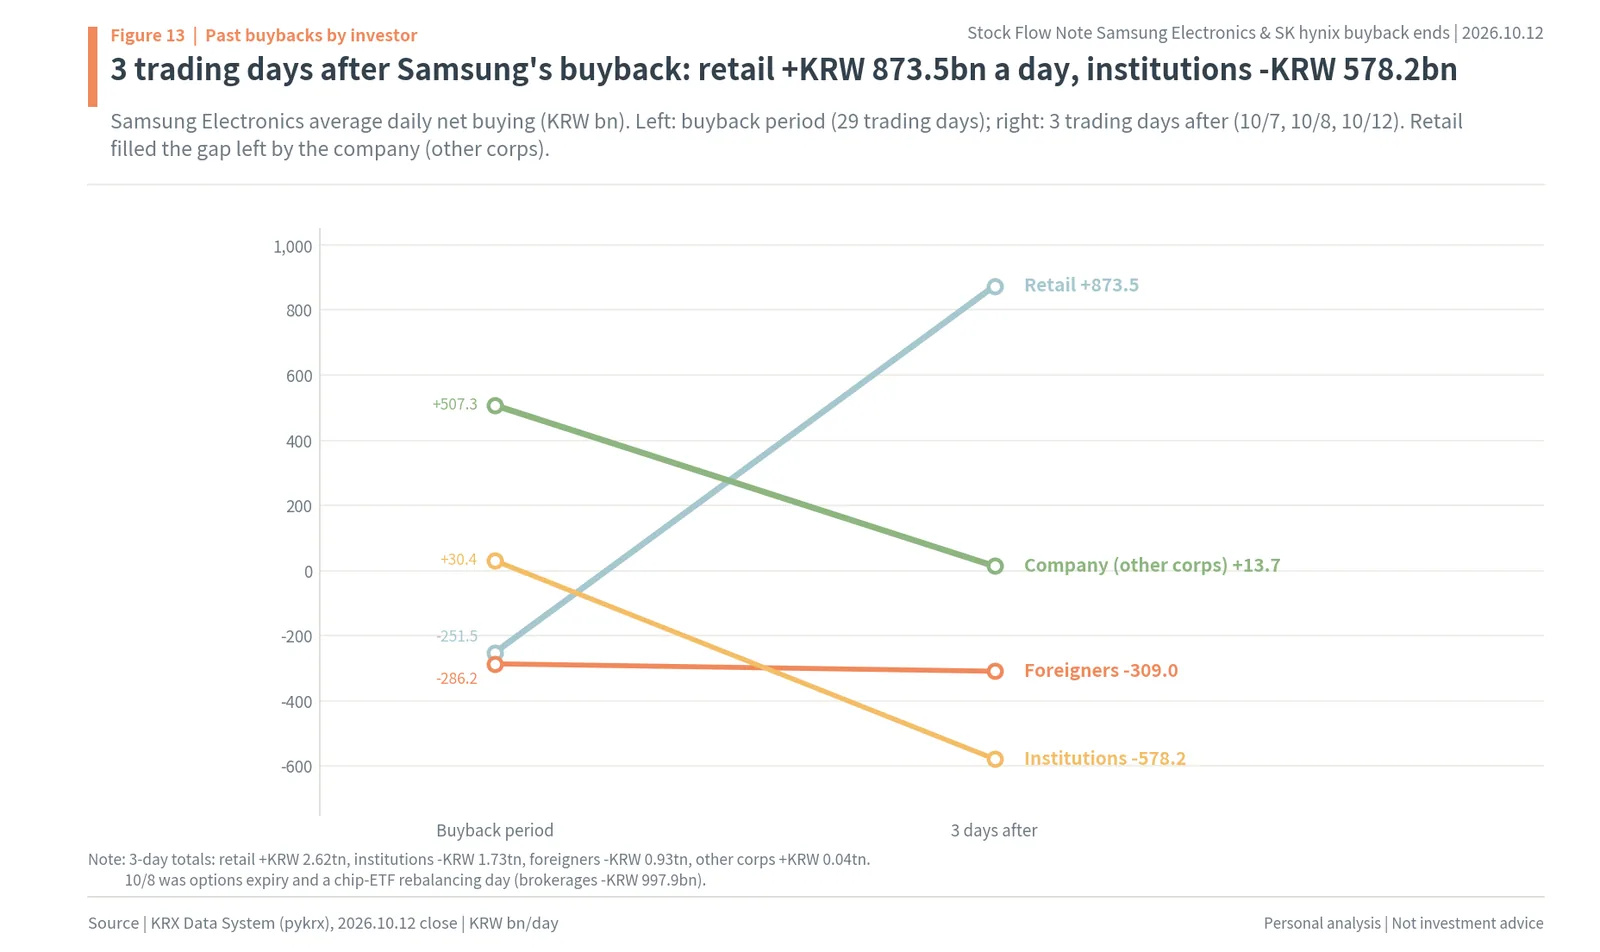
This time is different. Over the 3 trading days of October 7, 8 and 12, Samsung’s average daily net buying was retail +KRW 873.5bn (-KRW 251.5bn during the buyback), institutions -KRW 578.2bn (+KRW 30.4bn during), foreigners -KRW 309.0bn (-KRW 286.2bn during) and other corporations +KRW 13.7bn (+KRW 507.3bn during). Foreign selling did not shrink, institutions sold as well, and retail bought more than the company used to. Over the 3 trading days in total, retail net bought KRW 2.62tn, while institutions net sold KRW 1.73tn and foreigners KRW 0.93tn. So this time retail is filling the company’s place almost alone.
Separating out the windows of heavy foreign selling makes the receiving side even clearer. The author picked the non-overlapping five-trading-day windows with the largest total foreign net selling from November 2024 up to just before the buybacks. In eight windows without a company buyback, SK hynix’s foreigners sold a median 0.78% of market cap, retail took 80% of it, and the shares fell 8.8% (-3.6 percentage points against the KOSPI). In the three windows of heaviest foreign selling during this buyback, the company (other corporations) took 85% and retail 18%, and the shares fell 5.2%. At Samsung Electronics, retail took 91% in four windows without a buyback and the shares fell 10.4%. In three windows during this buyback, the company took 86% and retail 41%, and the shares fell 7.8%.
Swings after the end were 1.1 times the buyback-period level, the median of the four clean cases: 1.21 times for November 2017 to January 2018, 0.66 times for February to May 2025, 1.22 times for July to September 2025 and 0.99 times for March to April 2026. SK hynix’s 2018 buyback was 1.19 times. Returns against the KOSPI in the 20 trading days after the end were scattered from -7.3 to +12.8 percentage points. So the ranges by horizon in this report set no direction and draw only the width.
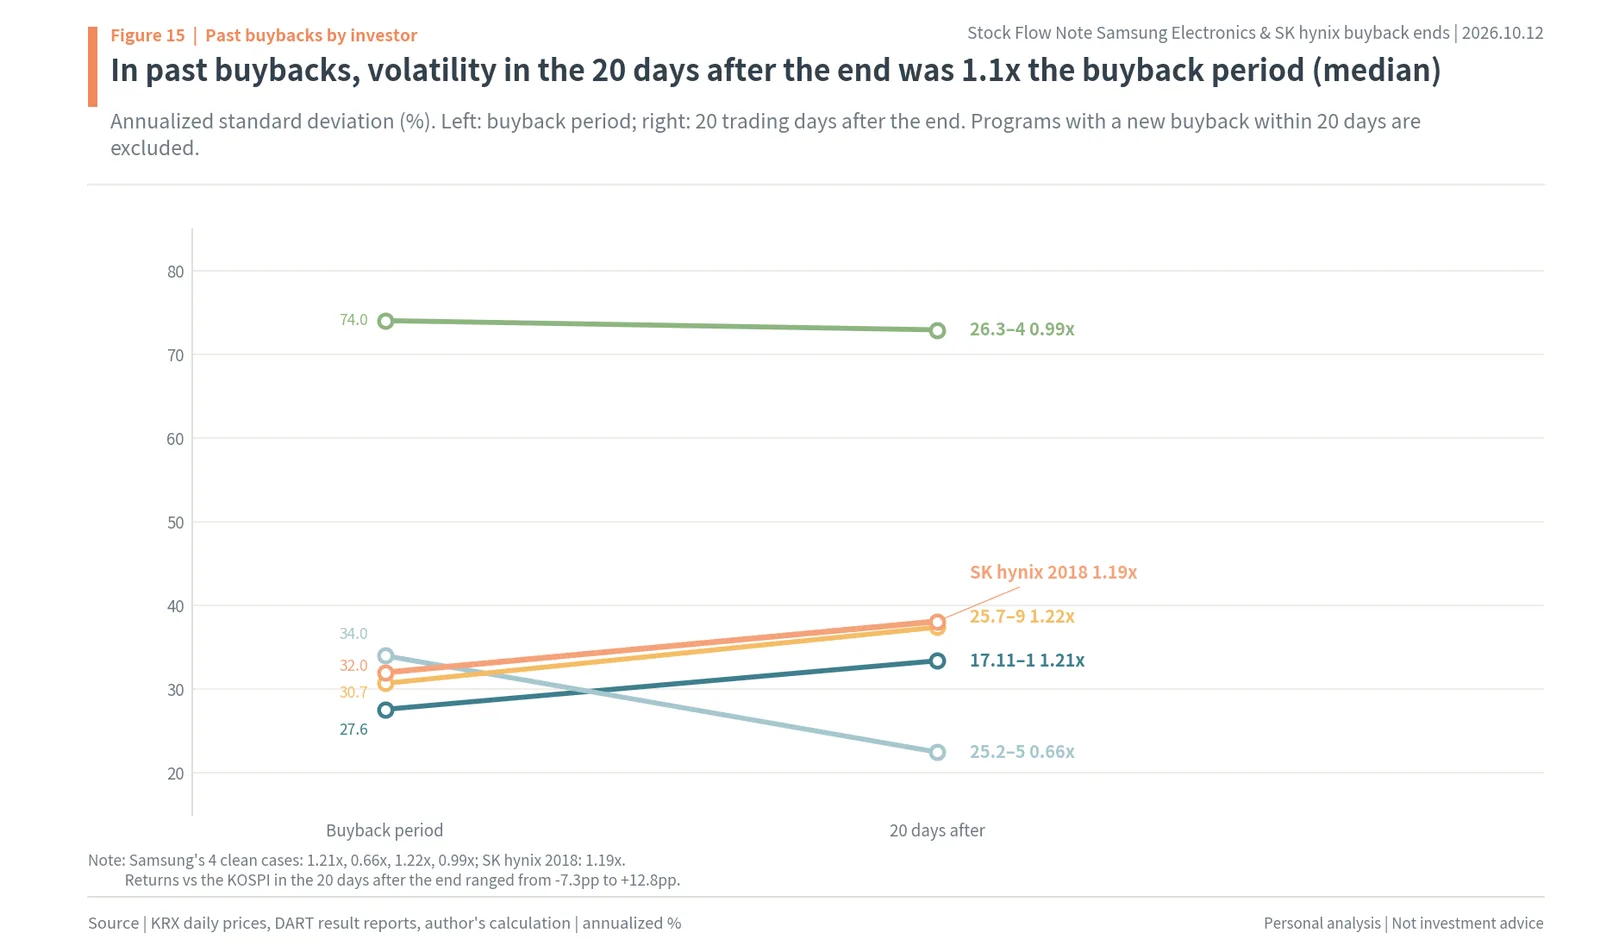
Of the five lines in Figure 15, four are the same or higher on the right than on the left. The only case where swings shrank after the end was February to May 2025, when the company’s share of trading value was small at 4.8%.
In sum, in past buybacks the place the company left was filled by a mix of lighter foreign selling and retail buying, and swings grew slightly, to 1.1 times. This time the share that disappears is bigger, 11.4% (Samsung) and 18.2% (SK hynix) of trading value against 2.2% to 8.4% in past buybacks, and retail is taking it alone while foreign selling continues unchanged. So the author sets 1.1 times as the lower bound and the rough pre-buyback market (2.1 to 2.2 times) as the upper bound.
Every Samsung and SK hynix buyback since 2017: 13 programs and what followed
Samsung Electronics’ four buybacks in 2017 were a KRW 9.3tn cancellation program. The first (January 25 to April 10, 50 trading days) bought 1.02 million common shares for KRW 2.05tn, 8.4% of trading value. In that period foreigners sold KRW 1.10tn and institutions KRW 1.10tn, and retail bought KRW 0.16tn. The shares beat the KOSPI by 6.6 percentage points. The second (April 28 to July 20) was 900,000 shares and KRW 2.11tn (7.0%), the third (July 28 to October 23) 670,000 shares and KRW 1.68tn (5.1%), and the fourth (November 1 to January 26, 2018) 712,000 shares and KRW 1.85tn (5.0%). After the first three ended, the next tranche was resolved 7 to 17 days later; after the fourth ended, swings over the next 20 trading days were 1.21 times the buyback-period level, and the return against the KOSPI was -2.1 percentage points.
The three from November 2024 to September 2025 were a KRW 10tn program. The first (November 20, 2024 to February 13, 2025, 55 trading days) bought 50.14 million shares for KRW 2.73tn (average KRW 54,526) and cancelled them all, 4.5% of trading value. In that period foreigners sold KRW 4.84tn, while retail bought KRW 1.60tn and institutions KRW 0.56tn. The second (February 19 to May 13, 2025) was 48.15 million shares and KRW 2.73tn (KRW 56,646), and the third (July 9 to September 29) 49.72 million shares and KRW 3.51tn (KRW 70,594). After the second ended, swings actually shrank to 0.66 times, and after the third they were 1.22 times. The third was the only buyback in which foreigners bought (KRW 6.88tn) and retail sold (KRW 10.86tn), and the shares rose 37.1% during it.
The four in 2026 were all for employee stock compensation. January (January 8 to 23, 12 trading days) bought 17.3 million shares for KRW 2.50tn (KRW 144,545); January to March (January 30 to March 10, 24 trading days) bought 19.5 million shares for KRW 3.57tn (KRW 183,252); and March to April (March 23 to April 20, 21 trading days) bought 36.67 million shares for KRW 7.17tn (KRW 195,637). The January to March buyback came while foreigners sold KRW 21.14tn and retail bought KRW 13.98tn, and trading was so heavy that the company’s share was only 2.2%. After the March to April buyback ended, swings stayed the same at 0.99 times, and 123 days passed before the next resolution (August 21). This August to October buyback bought 56.86 million shares for KRW 15.0tn (KRW 263,823), 11.4% of trading value.
SK hynix’s 2018 buyback (July 30 to September 28, 41 trading days) bought 22 million shares for KRW 1.73tn (average KRW 78,806), 14.2% of trading value. In that period foreigners (KRW 1.41tn) and institutions (KRW 0.81tn) sold, and retail bought KRW 0.48tn. The shares fell 15.1% during it, 17.2 percentage points worse than the KOSPI. Swings in the 20 trading days after the end were 1.19 times, and the shares beat the KOSPI by 7.3 percentage points. This August to October buyback, KRW 35.72tn over 34 trading days, is on a different order of magnitude from the 2018 buyback (KRW 1.73tn).
So the record of thirteen buybacks points the same way. During buybacks, foreigners usually sold and the company took the shares (in nine of Samsung’s ten), and swings after the end ranged from 0.66 to 1.22 times, with a median of 1.1 times. The two current buybacks sit at the very top of that record in both amount and share of trading value.
Without a buyback, retail took 80% of SK hynix’s heavy foreign selling and the stock fell 8.8%
SK hynix made no buyback between 2018 and this one. So what “after the company steps away” looks like has to be found in heavy foreign selling during the years without a company buyback. The author picked the eight non-overlapping windows with the largest five-trading-day foreign net selling from November 2024 up to just before this resolution.
In the five trading days to April 9, 2025, foreigners sold KRW 1.94tn (1.50% of market cap), retail took KRW 1.51tn, and the shares fell 16.6%. In the window to November 6, 2025, KRW 3.99tn of foreign selling was taken by retail (KRW 2.56tn) and institutions (KRW 1.29tn). In the window to November 26, KRW 2.18tn of selling was taken by retail (KRW 0.96tn) and institutions (KRW 1.18tn), and the shares fell 6.8%. In the window to February 6, 2026, KRW 5.04tn of selling met KRW 4.49tn of retail buying (-7.7%); to March 4, KRW 5.45tn met KRW 4.52tn (-15.5%); and to April 1, KRW 4.16tn met KRW 2.99tn (-10.3%). In the window to May 13, retail took KRW 9.09tn of KRW 9.98tn of selling, and in the window to June 29, retail took KRW 13.14tn against KRW 12.16tn of selling, and the shares fell 10.0%.
In seven of the eight windows retail took the most, a median 80% of the foreign selling. Other corporations were effectively absent in all eight, at KRW 0.03tn to 0.18tn. The median share price change was -8.8%, or -3.6 percentage points against the KOSPI. In the biggest selling window of this buyback (mid-September), other corporations (the company) took 85% and retail 18%, and the shares fell 5.2%.
So these eight windows are the baseline for SK hynix once its support is gone. When foreigners sell heavily, retail takes most of it, and over those five trading days the shares fall a median 8.8%. The few days between the end of the company’s buying around October 21 and the announcement of further returns are the stretch when things go back to that pattern.
SK hynix buyback end date: KRW 4.28tn left, ending around October 21
SK hynix’s current buyback is set by amount. The filing calculated the planned 24.07 million shares from the planned amount of KRW 40,004.34bn and the previous day’s close, and noted that the number of shares could change as the price moves. So the end date is counted from the amount left.
Through October 12 the company had spent KRW 35.72tn (KRW 35.08tn confirmed through October 8 plus KRW 643.9bn of other-corporations net buying on October 12), 89.3% of the target. KRW 4.28tn remains. The company has been ordering 400,000 shares a day since October 6, and at the October 12 close 400,000 shares are KRW 642.0bn. Dividing the amount left by this pace gives 6.7 trading days, so the last buying day is around October 21 (author’s calculation). In shares, it had bought 20.45 million by October 12, 85.0% of 24.07 million, so the amount limit fills first.
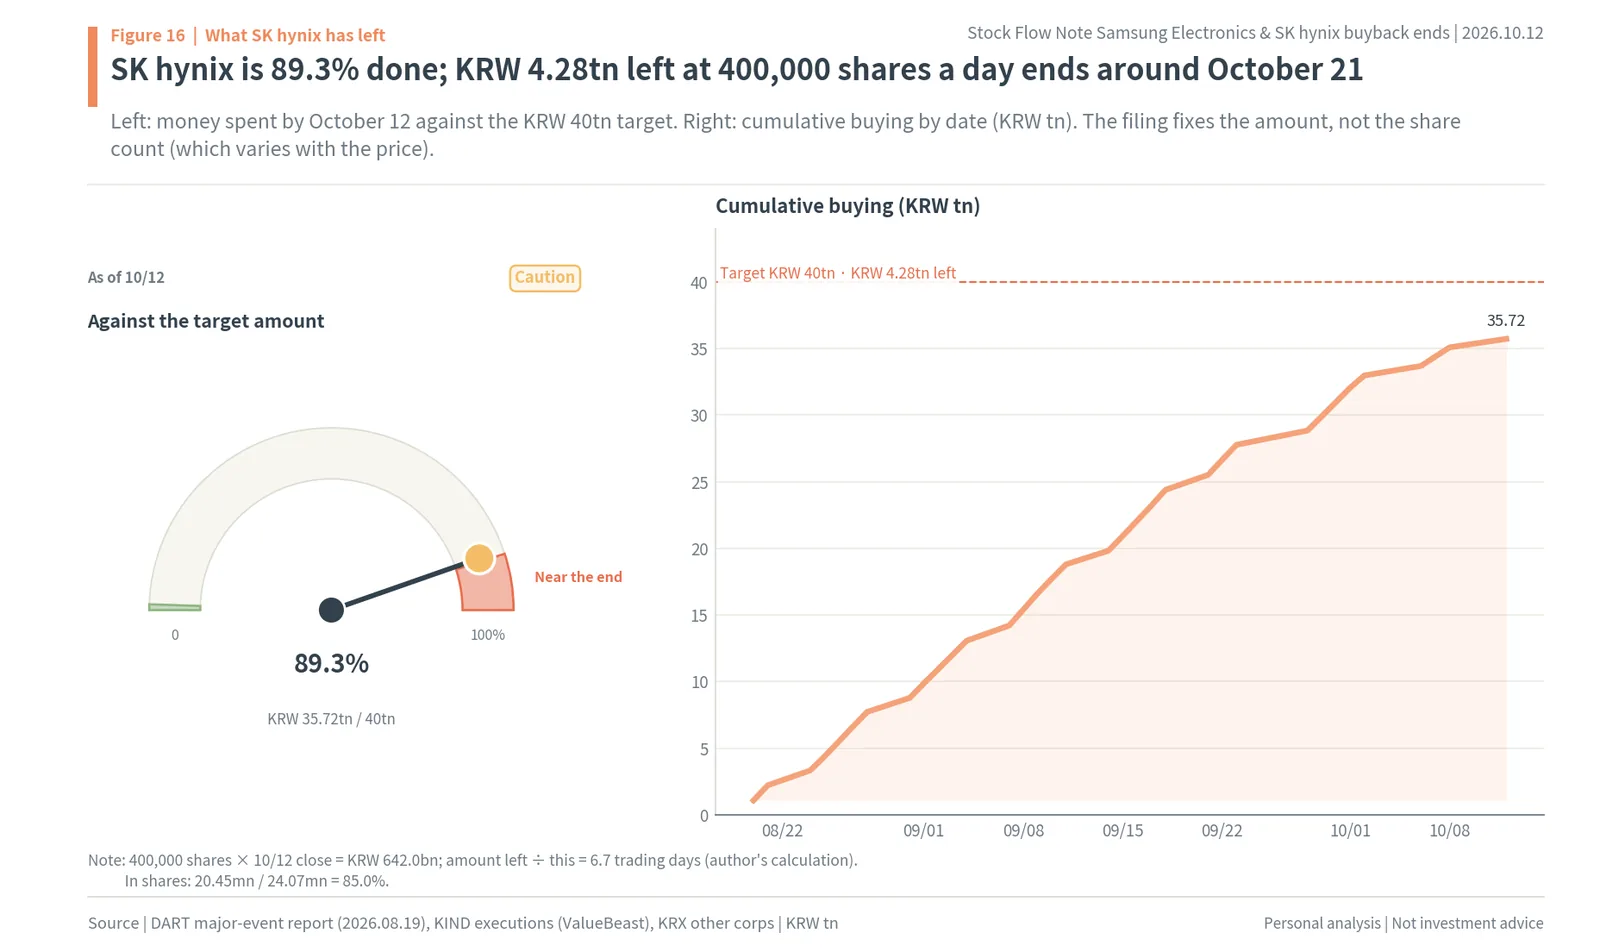
The pace has already slowed. The company, which bought 650,000 shares a day (about KRW 1tn) on most days from August 20 to September 18, cut to 600,000 from September 21, 500,000 on October 2 and 400,000 from October 6. As a daily average, that is down from KRW 1,050.7bn over 34 trading days to KRW 687.7bn over the latest four, less than two-thirds. This pace is also why the company took only 64% of the KRW 1,005.7bn of foreign selling on October 12.
So SK hynix is walking the same road as Samsung about two weeks later. When the buying ends around October 21, SK hynix’s other-corporations column will also go empty, and who fills it will set the next flows. Since the company said on August 19 that it would announce the size and method of further returns with its third-quarter results, the gap after the support goes may be just the few days until the results date.
Next buyback: SK hynix’s KRW 53.8tn of room in late October, Samsung’s KRW 60tn to 80tn in January 2027
The timing of the next buyback can be estimated from the schedules the companies have already given and the length of past gaps. On August 19 SK hynix said “the specific size and method of additional returns, including dividends and share buybacks, will be announced at the time of the third-quarter results, after a board resolution”. The third-quarter results date has not yet been disclosed in an IR notice; last year’s third-quarter results came on October 29, and this year’s second-quarter results on July 29. If this buyback ends around October 21, the next resolution comes on results day and buying starts the next day (the same order as the August 19 resolution and August 20 start), the days without support come to a little over six.
The money is counted from the FCF policy. SK hynix said it will return at least 50% of cumulative 2025-2027 FCF. WISEfn consensus FCF is KRW 25.9tn for 2025 (actual), KRW 165.9tn for 2026 and KRW 261.2tn for 2027. Adding only through 2026, half of KRW 191.8tn, or KRW 95.9tn, is the minimum return, and subtracting this KRW 40tn and the 2025 year-end dividend of KRW 2.1tn leaves KRW 53.8tn of room. Adding through 2027, the minimum return is KRW 226.5tn and the room left is KRW 184.4tn (author’s calculation). Buying KRW 53.8tn at this buyback’s daily average (KRW 1,050.7bn) would take 51 trading days, about two and a half months. The money is already piling up. SK hynix’s first-half FCF was about KRW 73.41tn and its net cash at the end of the second quarter about KRW 69tn (News Tomato), and the industry saw a good chance of larger cash dividends (including a special dividend) together with step-by-step further buybacks and cancellations.
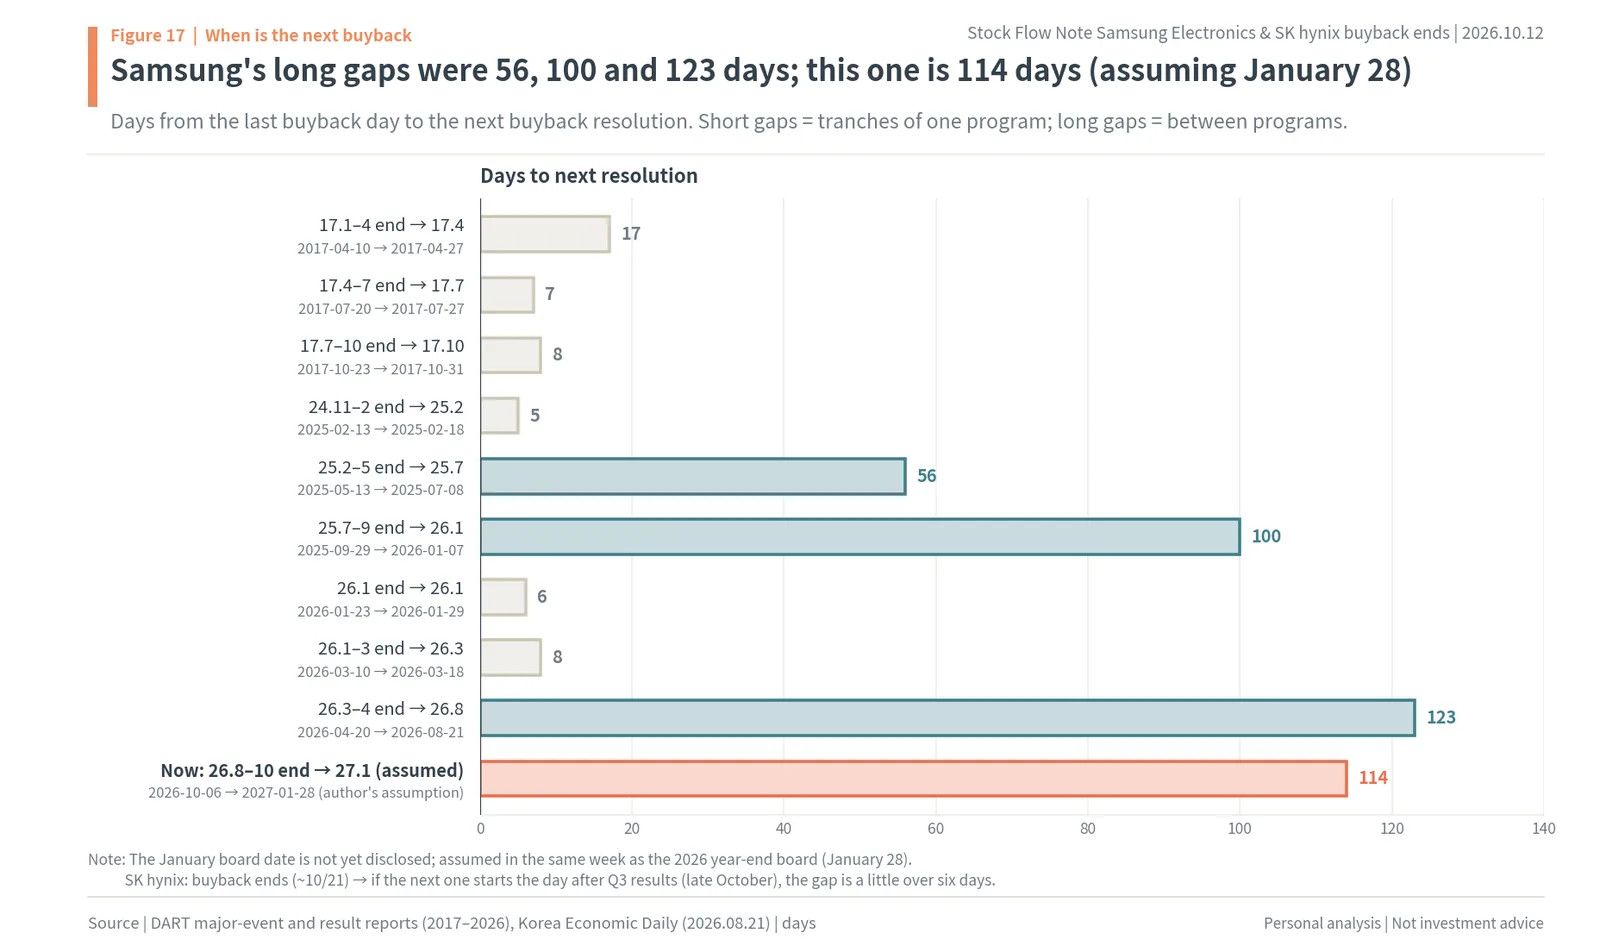
The bars in Figure 17 fall into two groups. The short gray bars (5 to 17 days) are cases where the next tranche of one program followed right away, and the long teal bars (56, 100 and 123 days) are cases that waited for the next program. This time’s 114 days (coral) belongs to the long group.
For Samsung Electronics, past gaps are the guide. The gap from the last buying day to the next resolution was either short, 5 to 17 days (three times in 2017, February 2025, and January and March 2026), or long: 56 days (May to July 2025), 100 days (September 2025 to January 2026) and 123 days (April to August 2026). Short gaps came when one program was bought in tranches; long gaps fall between programs. This KRW 15tn was a single resolution for compensation, and the company said it will decide how to deliver the remaining KRW 60tn to 80tn of returns at its January 2027 board meeting. The 2026 year-end board met on January 28, so assuming the same week, the gap from October 6 is 114 days, in the same range as the three past long gaps (56, 100 and 123 days).
The money for the January board meeting is counted from the numbers the company has given. The 2026 return of KRW 90tn to 110tn is 50% of cumulative 2024-2026 FCF minus the KRW 29.3tn already returned, and a third-quarter cash dividend of about KRW 30tn (including the regular dividend, about KRW 5,000 a share) will be confirmed at the late-October board meeting. The remaining KRW 60tn to 80tn will be split in January between cash dividends and buybacks and cancellation. The Korea Economic Daily reported the same day that Samsung plans further buybacks separate from the KRW 15tn compensation buyback. If half goes to buybacks, that is KRW 30tn to 40tn, which takes 58 to 77 trading days at this buyback’s daily average (KRW 517.2bn), or 2.05% to 2.73% of listed shares. If all of it goes to buybacks and cancellation, that is KRW 60tn to 80tn, 116 to 155 trading days, or 4.10% to 5.46% (at the October 12 close, author’s calculation).
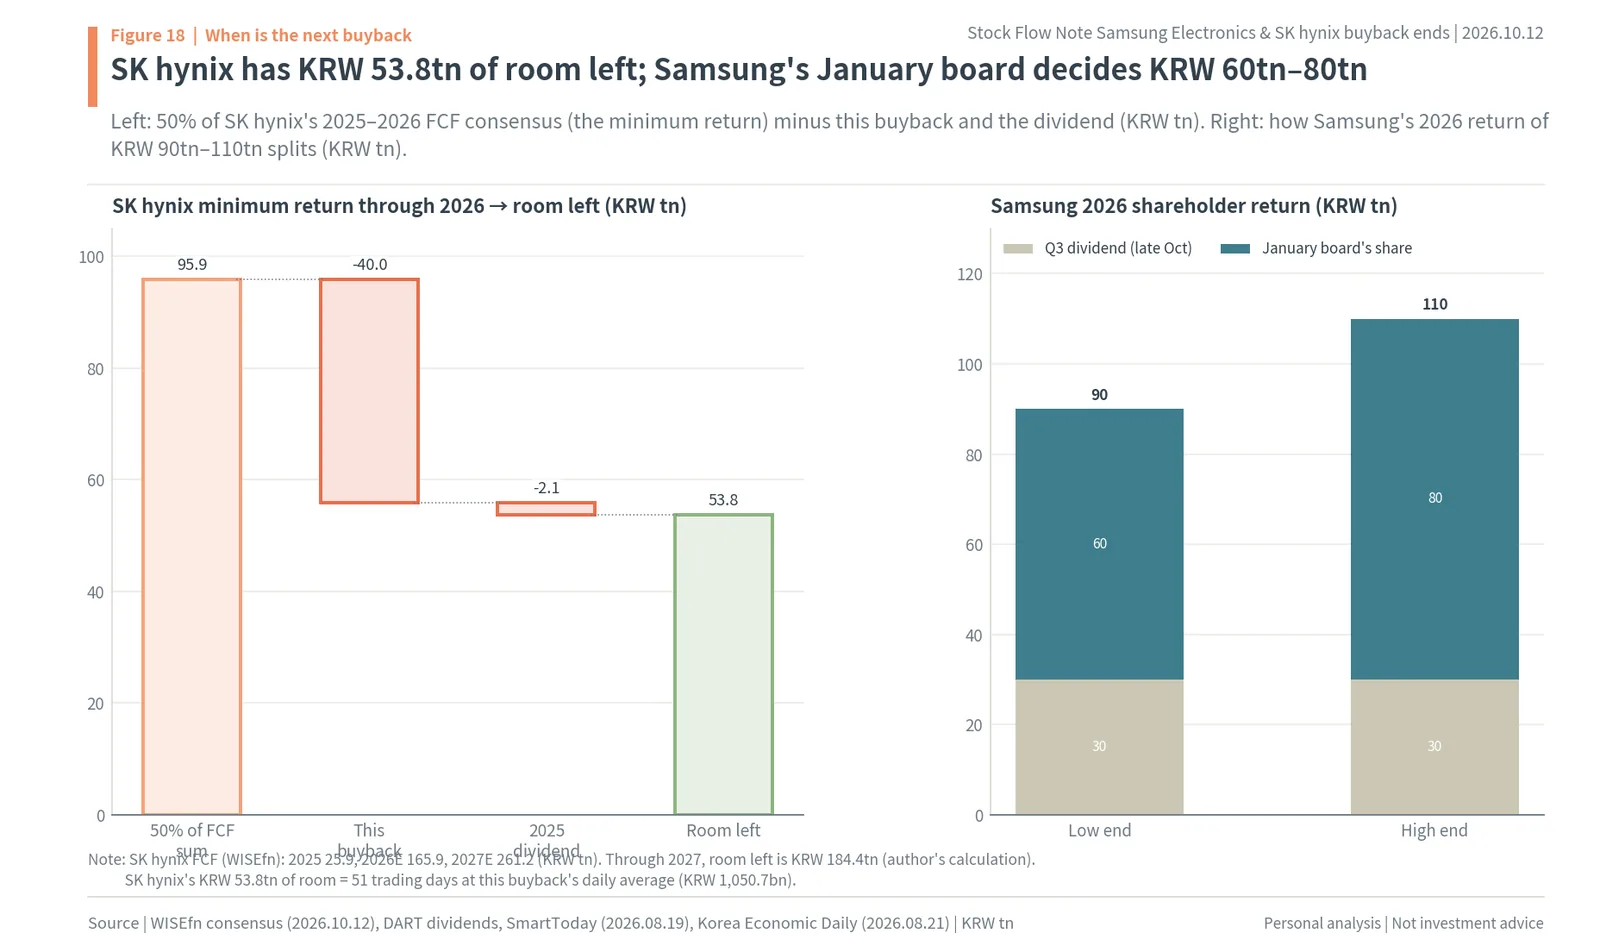
So in the order of the next supports, SK hynix comes first. For SK hynix, further returns arrive with its results a little over six days after the buyback ends, and the room left, counting only through 2026, is already bigger than this buyback. For Samsung, the method for KRW 60tn to 80tn is decided in January, at the end of a long 114-day gap. In between, the new return Samsung confirms is the third-quarter dividend of about KRW 30tn at the late-October board meeting.
Next buyback size: KRW 476.2bn to 1,269.8bn a day, up to 27.9% of trading value
The force a next buyback exerts on flows is set less by the total than by how much is bought each day. Both companies’ current resolutions set a three-month acquisition period. The author assumes the next buyback is also spread over three months (63 trading days) and compares the daily purchase with average daily trading value during the current buybacks (KRW 4.56tn for Samsung and KRW 5.76tn for SK hynix).
If SK hynix uses all of its KRW 53.8tn of room left on a 2025-2026 basis for buybacks and cancellation, that is KRW 854.0bn a day, 14.8% of daily trading value. That is smaller than this buyback’s average share (18.2%) and bigger than the KRW 687.7bn a day since October 6. SK hynix’s next buyback could be a support of similar size to this one.
If Samsung Electronics uses half of the January board’s KRW 60tn to 80tn (KRW 30tn to 40tn) for buybacks, that is KRW 476.2bn to 634.9bn a day, 10.5% to 13.9% of trading value. That is the same size as this KRW 15tn buyback’s KRW 517.2bn a day and 11.4%. If it uses all of it (KRW 60tn to 80tn) for buybacks and cancellation, that is KRW 952.4bn to 1,269.8bn a day, 20.9% to 27.9%, a bigger support than any buyback by either company.
So the first numbers to look at in the next resolution are not the total but the “daily order quantity” and the “acquisition period”. Both companies state their daily order limit and acquisition period in the resolution filing, and file the quantity they order each day on KIND. Multiplying the daily order quantity by that day’s close gives the amount the company takes that day, and comparing it with foreign net selling shows at once how thick the support is.
Buyback announcement reaction: cancellation +2.9pp, employee compensation -2.0pp
When the next buyback comes, two things change. One is the share price reaction right after the resolution; the other is the size of the swings while the buying goes on. The author collected the two companies’ 13 resolutions and measured the excess return against the KOSPI over two days starting the trading day after each resolution, because most resolutions were filed after the market closed.
The purpose decided the reaction. The six resolutions to buy back for cancellation (Samsung’s four in 2017 and November 2024, SK hynix’s August 2026) had a median two-day excess return of +2.9 percentage points, and five of the six rose. SK hynix’s August 19 resolution was the biggest at +8.5 percentage points, and Samsung’s KRW 10tn resolution of November 2024 was +3.0 percentage points. The four resolutions for employee compensation (Samsung’s two in January 2026, March and August) all fell, with a median of -2.0 percentage points. The two days after this KRW 15tn resolution (August 21) were the worst at -6.2 percentage points. The two 2025 resolutions with mixed purposes were +1.6 and -2.8 percentage points.

In Figure 19, five of the six green bars (cancellation) extend to the right, and all four red bars (compensation) extend to the left. Even for the same company’s “share buyback” resolution, the market’s first reaction was opposite depending on the purpose.
The difference comes from where the shares go. A buyback for cancellation permanently reduces the number of shares outstanding and increases what the remaining shareholders own. With a compensation buyback, the shares go to employees and can come back onto the market. Samsung filed eight disposals of treasury shares for compensation from May 2025 to July 2026. So whether the January board’s KRW 60tn to 80tn comes as “buybacks and cancellation”, and whether SK hynix’s further return comes as cancellation like this one, will decide the reaction on resolution day.
Swings while buying goes on are just as seen in the earlier section. The daily standard deviation during the buybacks was 3.1% for Samsung and 3.9% for SK hynix; without support it becomes 3.4% and 4.3% on the past-buyback ratio, and 6.9% and 8.1% on the pre-buyback market. The author calculated ranges by horizon along three paths. The first is the “gap” path, using the past-buyback ratio of 1.1 times. The second is the “next buyback” path, in which swings return to the buyback-period level from October 30 for SK hynix and from January 29, 2027 for Samsung, with the resolution reaction (cancellation median +2.9%) added. The third is the “rough market” path, using the swings of the 60 trading days before the buybacks. Ranges are one standard deviation up and down (68%), with no direction set.
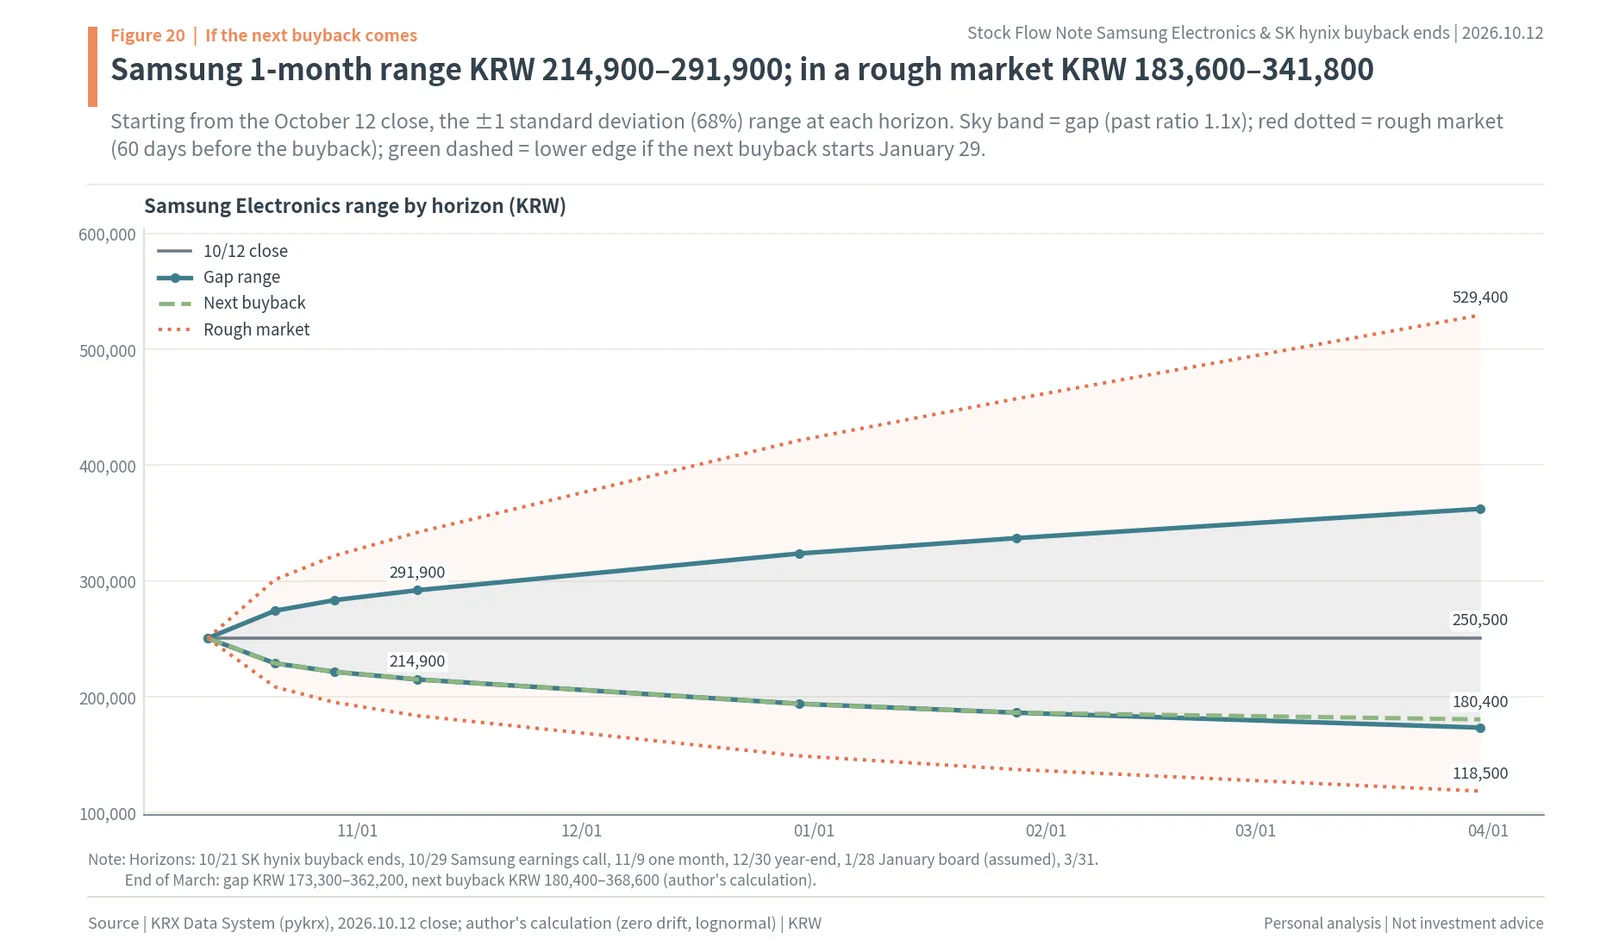
For Samsung Electronics (KRW 250,500 on October 12), the gap path gives KRW 228,800 to 274,200 on October 21, when SK hynix’s buying ends; KRW 221,400 to 283,400 on October 29 (third-quarter conference call); KRW 214,900 to 291,900 at one month (November 9); KRW 193,900 to 323,600 at year-end; and KRW 186,200 to 336,900 at the January board meeting (assumed January 28). There is no next buyback before January, so the next-buyback path is the same until then. If buying starts on January 29, the end-March range is KRW 180,400 to 368,600 (midpoint KRW 257,900), with a lower edge KRW 7,100 higher than the KRW 173,300 to 362,200 of a continuing gap. The rough-market path gives KRW 195,000 to 321,800 on October 29, KRW 183,600 to 341,800 at one month, KRW 148,900 to 421,300 at year-end and KRW 137,200 to 457,200 at the January board meeting.
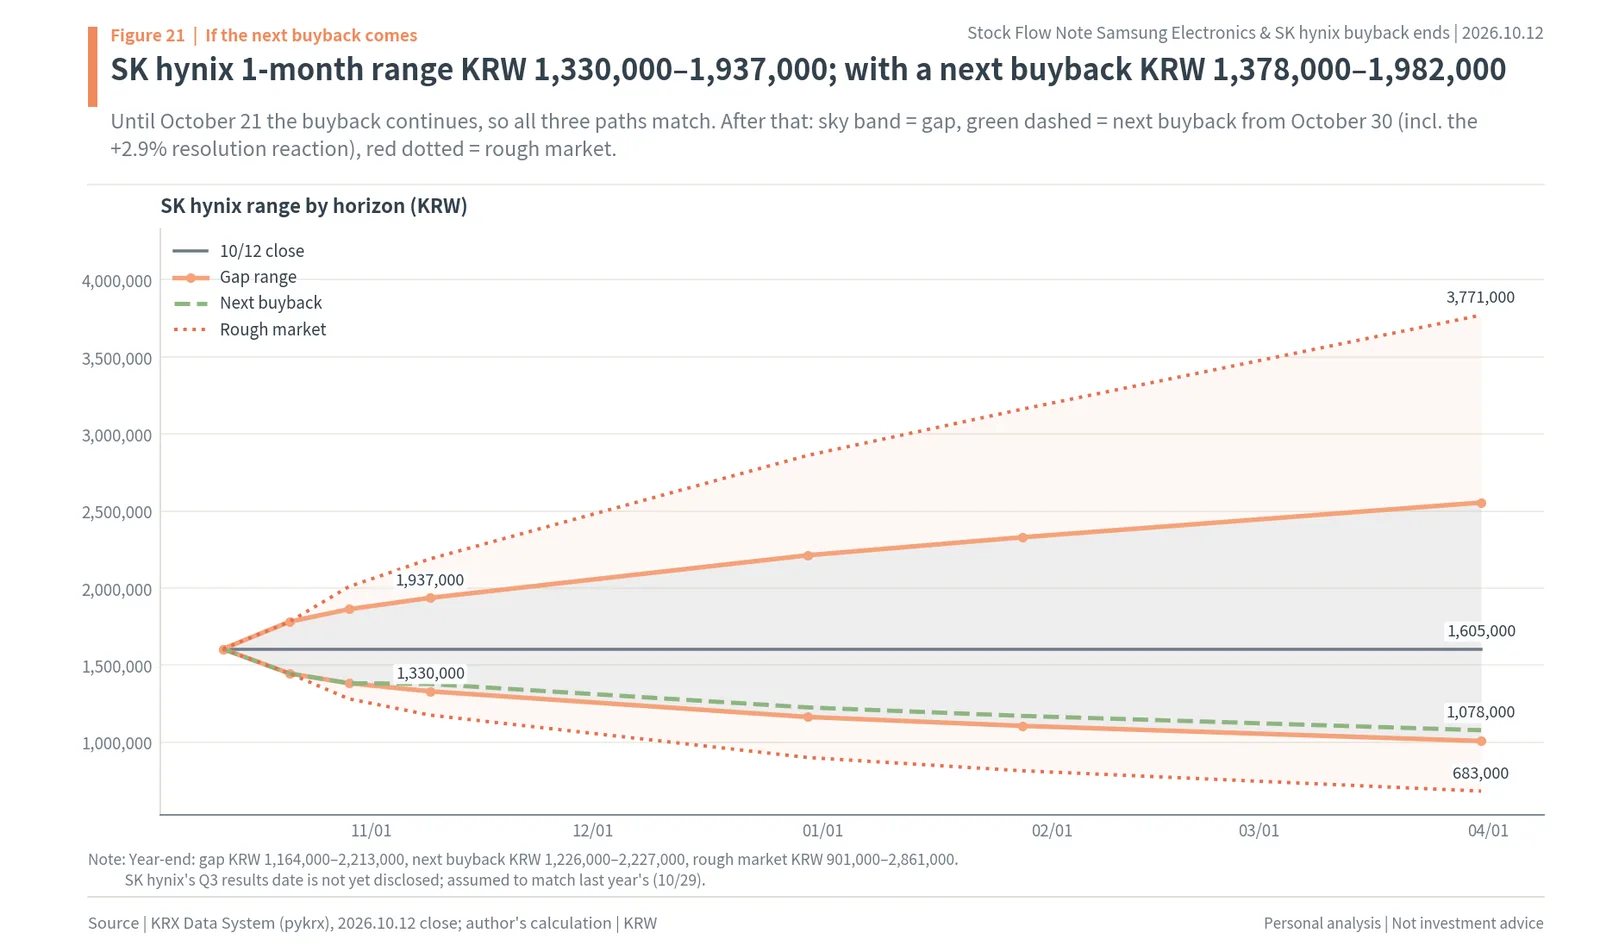
For SK hynix (KRW 1,605,000), the company’s buying continues until October 21, so all three paths are the same until then (KRW 1,446,000 to 1,782,000). After that, the gap path gives KRW 1,383,000 to 1,863,000 at the late-October results (assumed October 29), KRW 1,330,000 to 1,937,000 at one month, KRW 1,164,000 to 2,213,000 at year-end and KRW 1,106,000 to 2,330,000 at the end of January. If the next buyback starts on October 30, the range is KRW 1,378,000 to 1,982,000 at one month (midpoint KRW 1,652,000) and KRW 1,226,000 to 2,227,000 at year-end, with lower edges KRW 48,000 and KRW 62,000 higher. The rough-market path gives KRW 1,282,000 to 2,009,000 at the end of October, KRW 1,176,000 to 2,190,000 at one month and KRW 901,000 to 2,861,000 at year-end. At the same year-end, the rough-market path’s lower edge is KRW 325,000 below the next-buyback path’s.
So what a next buyback changes is the lower edge of the range. A cancellation resolution lifts the price once on resolution day, and the daily buying brings the daily range back to the buyback-period level. For SK hynix that point is close, at the end of October; for Samsung it is far, at the end of January. Where the two stocks’ ranges diverge most is whether they go back to the “rough market” path. The longer the gap without support, the more weight that path carries.
Samsung’s 130.32 million compensation shares and its eight treasury share disposals
Samsung Electronics bought 130.32 million shares for compensation in four buybacks in 2026. As of October 12 it holds 136,727,099 treasury shares. The company does not release these shares all at once; each time it pays bonuses and incentives, it files a disposal of treasury shares and moves them into employees’ accounts. From May 26, 2025 to July 13, 2026 there were eight disposals totaling 18,177,033 shares. The biggest single release was 6,729,069 shares on January 30, 2026, 23.6% of average daily volume in 2026 (28.48 million shares).
So the flows of a compensation buyback come in two stages. While it buys, the company takes a set amount every day; on bonus days, part of it passes to employees and becomes shares that can be sold. What has passed so far is part of what was bought in 2026, and the remaining 130 million or so shares will go out across future bonus days. This second stage is also why the resolution-day reaction split between cancellation and compensation. Shares bought for cancellation have no second stage.
This difference connects to the choice before the January board meeting. How much of the remaining KRW 60tn to 80tn goes to buybacks and cancellation decides both the size of the support and how much the share count falls. If all of it goes to buybacks and cancellation, listed shares shrink by 4.10% to 5.46% (at the October 12 close, author’s calculation). So the word to look for in the January resolution is “cancellation”.
Dates to watch: October 21, October 29, November 12 and January 2027
The next three months of flows split by date. SK hynix’s buying ends around October 21 (author’s calculation). At 10 a.m. on October 29 Samsung Electronics holds its third-quarter conference call (per its IR notice), and the third-quarter cash dividend of about KRW 30tn will be confirmed at a late-October board meeting. SK hynix’s third-quarter results and further return announcement come at the end of October (October 29 last year; no IR notice yet). November 12 is the KOSPI 200 options expiry, November 19 is SK hynix’s buyback deadline, and November 21 is Samsung’s buyback deadline (already finished). In January 2027, Samsung’s year-end board decides how to deliver the remaining KRW 60tn to 80tn of returns.
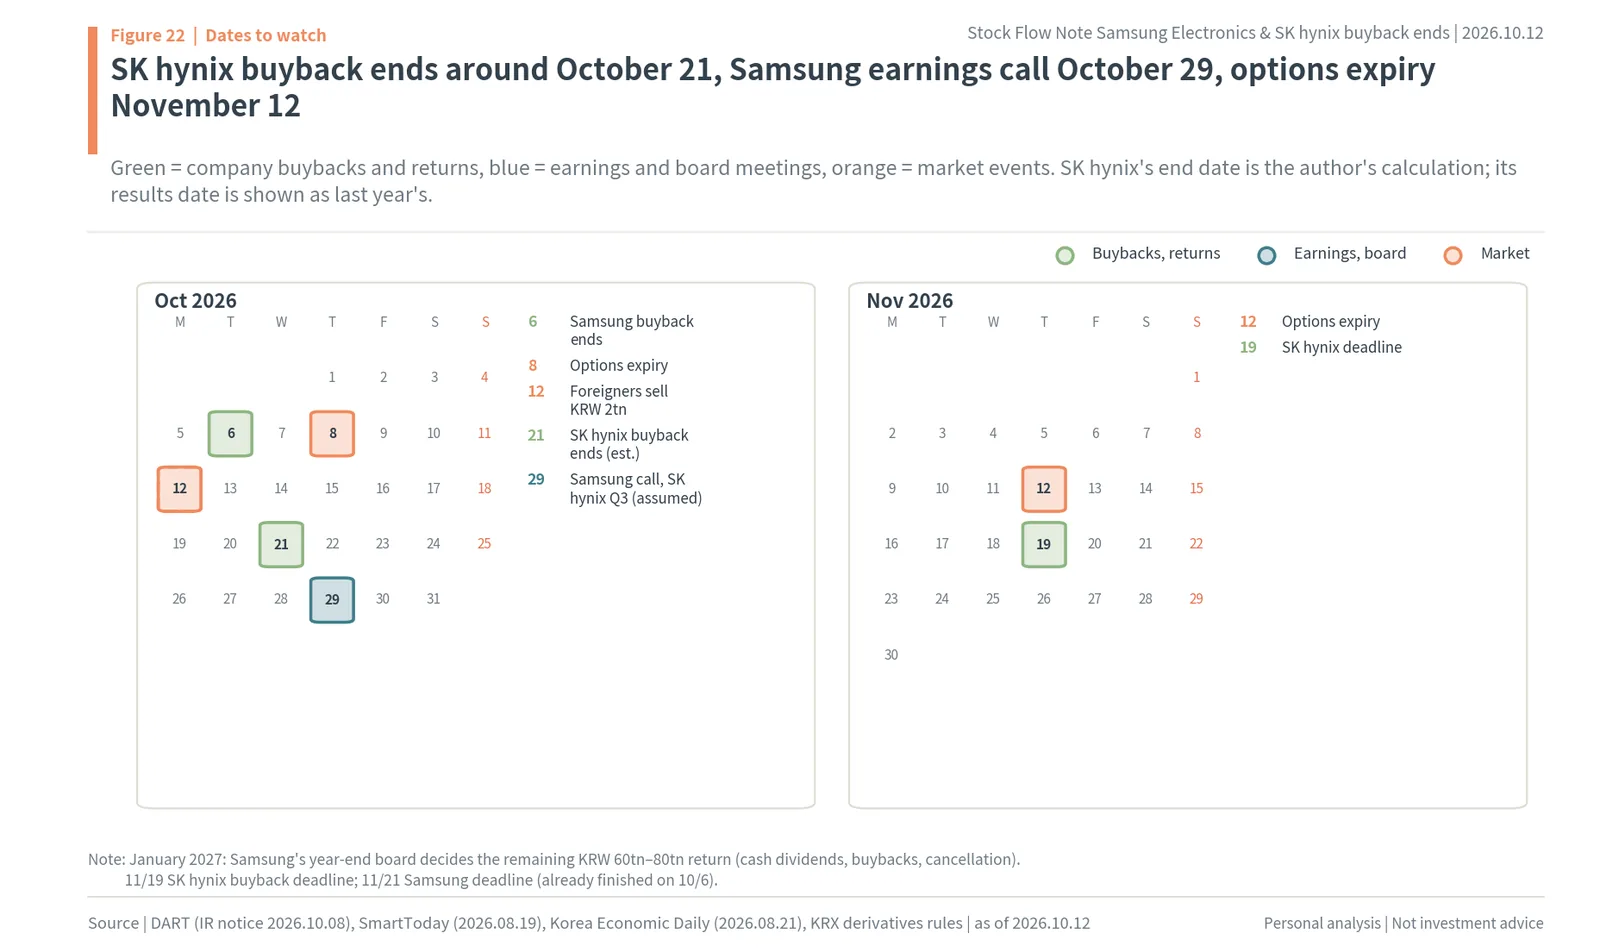
The November 12 options expiry is the same kind of date as the last one. On the October 8 expiry, Samsung’s institutions sold KRW 1,081.3bn, of which brokerages accounted for KRW 997.9bn. The company’s buying had already ended by that day, and retail bought KRW 1,393.3bn. Heavy selling on expiry days was first met by the company’s KRW 500bn a day while it was buying; without it, retail takes it.
Read by investor group, this period looks like this. During the buybacks, foreigners and retail handed over shares while the company bought a set amount every day: KRW 8.30tn from foreigners and KRW 7.29tn from retail at Samsung, and KRW 21.04tn from foreigners and KRW 11.58tn from retail at SK hynix. Selling while there is a buyer who does not haggle over price is a common choice in the market, and that is what happened this time too. At Samsung, where the buyback has ended, the buying side has switched to retail. Retail bought KRW 2.62tn on October 7, 8 and 12, and over those days the share price fell 7.9% from KRW 272,000 to KRW 250,500. Retail is now taking, at lower prices, the shares the company used to take at around KRW 263,823.
So the end of October is the first fork in the road. If SK hynix delivers its further return as a buyback for cancellation, the daily other-corporations column fills up again and the range moves to the “next buyback” path. In the same week Samsung confirms its third-quarter dividend of about KRW 30tn, and its record results come back into focus. Which side foreigners and institutions take on the day good news is in focus, and whether retail keeps net buying, will be the first report card for flows without the company. For Samsung, a long gap without support follows until the January board meeting, and in the meantime the range is set somewhere between the “gap” and “rough market” paths.
Data and methods: KRX flows, DART and KIND filings, and volatility ranges
Prices and net buying by investor type are from the Korea Exchange (KRX) Data System. Share prices are regular-session closes, and net buying by investor type is net buying in won of trading value. Foreigners are foreigners plus other foreigners, and institutions are the sum of brokerages (financial investment), insurers, asset managers, private funds, banks, other financial institutions and pensions. For the 2017-2018 buybacks, data for October 2016 to December 2018 from the same source were downloaded separately and appended. Samsung Electronics’ 2017 prices are before its 50-for-1 stock split in May 2018, and since buyback comparisons use bp of market cap and returns rather than amounts, they are not affected by the split.
Company buying comes from two sources. For Samsung Electronics, the author used the daily acquisition tables (common shares) in its DART treasury share acquisition result reports: four in 2017, three in 2025 and four in 2026, eleven in all. SK hynix’s 2018 buyback also uses its result report. SK hynix’s current buyback has no result report yet, so the author used ValueBeast’s table compiling KIND’s daily order and execution filings (executions through October 8), and for October 12, before executions were confirmed, KRX other-corporations net buying (KRW 643.9bn) stands in. The results of checking both sources date by date against other-corporations net buying are in the earlier section on other corporations.
The company’s share of trading value is the company’s total buying in a buyback divided by total common-share trading value on the same days. The daily share is that day’s company buying ÷ that day’s trading value. The volume profile stacks each day’s trading value during the buyback at the price band containing that day’s average trade price (trading value ÷ volume). Company buying is also stacked at the band of that day’s market average trade price. So the distribution between the intraday high and low is not reflected.
Swings are measured with daily price changes (close to close). The “average daily move” is the average of the absolute daily changes, and the standard deviation is annualized over 252 trading days a year. The 60 trading days before the buyback are the 60 trading days before its first day. “After the end” for past buybacks is the 20 trading days after the last buying day; buybacks where the next buyback started within those 20 trading days (six of them) are excluded from the medians of the swing ratio and of the changes by investor group. The medians are calculated from the four clean cases (November 2017 to January 2018, February to May 2025, July to September 2025 and March to April 2026).
Heavy foreign selling windows are the non-overlapping five-trading-day windows with the lowest sum of foreign net buying as a percentage of market cap (eight for SK hynix; for Samsung, four after excluding windows that overlap buyback periods). The share taken is retail (or other-corporations) net buying in that window ÷ foreign net selling, and returns are measured from the close before the first day of the window.
The resolution reaction is the return from the resolution-day close to the close two trading days later, minus the KOSPI’s return over the same period. Most resolutions were filed after the close, so counting starts the day after the resolution. Purposes follow the original filings (Samsung: cancellation in 2017 and November 2024, compensation and price stabilization in February 2025, cancellation and compensation in July 2025, compensation for all four in 2026; SK hynix: price stabilization in 2018, cancellation in 2026).
Ranges by horizon start at the October 12 close and stack each path’s daily standard deviation for every trading day to get one standard deviation up and down (lognormal assumption, zero drift). The gap path uses the buyback-period standard deviation × 1.1 (the past-buyback median), the rough-market path uses the standard deviation of the 60 trading days before the buyback, and the next-buyback path uses the buyback-period standard deviation from the start date of buying, with the resolution reaction (cancellation median +2.9%) added. For SK hynix, all three paths use the buyback-period standard deviation until October 21. The next buyback start dates are assumed to be October 30 for SK hynix (the day after last year’s third-quarter results on October 29) and January 29, 2027 for Samsung (the same week as the 2026 year-end board meeting on January 28). Trading days exclude weekends, December 25, December 31, January 1, the Lunar New Year holiday (February 8 and 9) and March 1.
SK hynix’s room left is calculated from WISEfn consensus FCF (retrieved October 12, 2026). The company’s policy is “50% or more”, so this figure is a minimum, and the company’s definition of FCF may differ from the consensus definition. Samsung’s KRW 60tn to 80tn for January comes from a Korea Economic Daily report (August 21, 2026), and the buyback-share scenarios (none, half, all) are the author’s assumptions. Dollar conversions use KRW 1,333.61 per dollar (Yahoo Finance, October 12, 2026).
Wrap-up: who buys Samsung Electronics and SK hynix after the buybacks, and at what price
In these buybacks, each company was the biggest buyer in its own history. Samsung alone bought 11.4% of trading value in its buyback period and SK hynix 18.2%, and they took 96% and 101% of what foreigners and retail sold. Thanks to that, the shares moved in a band centered on the companies’ average buyback prices (KRW 263,823 and KRW 1,749,576), and the average daily move was less than half that of the 60 trading days before. On October 12 both stocks stood just above the floor of that band.
At Samsung the support is already gone. In the 3 trading days after the buyback ended, foreign selling did not shrink, institutions sold too, and retail bought KRW 2.62tn to fill the company’s place. SK hynix will stand in the same place around October 21. After Samsung’s past buybacks ended, swings were 1.1 times, and when the share that disappears is as big as it is this time, the rough pre-buyback market (2.1 to 2.2 times) becomes the upper end.
The next support comes to SK hynix first. The company said it will announce further returns with its third-quarter results, and on 2025-2026 FCF consensus alone the room left is KRW 53.8tn. Samsung faces a 114-day gap until its January 2027 board meeting decides how to deliver KRW 60tn to 80tn. In past resolutions, cancellation brought +2.9 percentage points over two days and compensation -2.0 percentage points, so the purpose of the next resolution and the daily buying pace will set the position and width of the next band.
Gathering the numbers for each stock in one line each: Samsung Electronics has company buying of KRW 15.0tn, 96% of net selling, an average buyback price of KRW 263,823, a closing floor of KRW 248,500 and a daily standard deviation of KRW 7,800 during the buyback; once the support is gone, the daily standard deviation is KRW 8,600 to 17,400, and the next resolution is in January 2027. SK hynix has company buying of KRW 35.72tn, 101% of net selling, an average buyback price of KRW 1,749,576, a closing floor of KRW 1,596,000 and a daily standard deviation of KRW 63,000 during the buyback; once the support is gone, the daily standard deviation is KRW 70,000 to 130,000, and the next resolution comes with the late-October results.
The author’s thread in this report is a single one. While a company buys the same amount every day, the share price range narrows; when that buying stops, the range widens, and the wider range lasts until the next buying comes. So SK hynix’s further return at the end of October and Samsung’s board meeting in January 2027 are the next two dates for the flows in both stocks.
Samsung Electronics and SK hynix buyback FAQ
Q. Did Samsung Electronics finish its KRW 15 trillion share buyback?
Yes. Samsung Electronics finished on October 6, 2026, 46 days ahead of plan, after buying 56,856,305 shares over 29 trading days at an average of KRW 263,823 (about $198). The buyback was for employee stock compensation, not cancellation.
Q. When does SK hynix’s KRW 40 trillion buyback end?
By October 12, 2026 SK hynix had spent KRW 35.72tn, 89.3% of the target, leaving KRW 4.28tn. At 400,000 shares a day (KRW 642.0bn at the October 12 close), that takes 6.7 trading days, so buying ends around October 21 (author’s calculation). All shares bought will be cancelled.
Q. Who sold Samsung Electronics and SK hynix shares during the buybacks?
Foreigners and retail investors. At Samsung, foreigners sold KRW 8.30tn and retail KRW 7.29tn, and the company took 96% of the net selling. At SK hynix, foreigners sold KRW 21.04tn, retail KRW 11.58tn and institutions KRW 2.74tn, and the company took 101%.
Q. How much can the shares swing after the buybacks end?
During the buybacks the daily standard deviation was KRW 7,800 for Samsung and KRW 63,000 for SK hynix. Without support the author calculates KRW 8,600 to 17,400 and KRW 70,000 to 130,000; the one-month (November 9) range is KRW 214,900 to 291,900 for Samsung and KRW 1,330,000 to 1,937,000 for SK hynix.
Q. When could the next buyback come?
SK hynix said it will announce further returns, including dividends and buybacks, with its third-quarter results in late October; its remaining room is KRW 53.8tn (author’s calculation). Samsung decides how to deliver its remaining KRW 60tn to 80tn at its January 2027 board meeting, 114 days after October 6 if the board meets on January 28.
Sources
- Korea Exchange (KRX) Data System, daily prices, net buying by investor type (trading value) and market cap (pykrx, as of the 2026.10.12 close)
- Financial Supervisory Service DART, Samsung Electronics treasury share acquisition result reports (11 from 2017 to 2026, latest 2026.10.12), major-event reports (decisions to acquire and dispose of treasury shares), cash and in-kind dividend decisions, investor relations (IR) event notices
- Financial Supervisory Service DART, SK hynix major-event report (decision to acquire treasury shares, 2026.08.19), share cancellation decision (2026.08.19), treasury share acquisition result report (2018.10.02)
- ValueBeast, SK hynix share buyback tracker (compiled KIND order and execution filings, https://www.valuebeast.co.kr/buyback/), retrieved 2026.10.12
- Newspim, KOSPI market close (link), 2026.10.12
- Newspim, Samsung Electronics completes KRW 15tn share buyback (link), 2026.10.12
- Slist (citing Yonhap), Samsung Electronics and SK hynix fall more than 4% (link), 2026.10.12
- Korea Economic Daily, Samsung Electronics’ share buyback ends for now (link), 2026.10.07
- Korea Economic Daily, Samsung Electronics’ KRW 110tn-plus shareholder return (link), 2026.08.21
- MTN, Samsung Electronics’ shareholder return of up to KRW 110tn (link), 2026.08.21
- SmartToday, SK hynix resolves KRW 40tn share buyback and cancellation (link), 2026.08.19
- News Tomato, Chipmakers to return 50%-plus of free cash flow (link), 2026.08.20
- SBS Biz, “Other corporations” emerge as big buyers on share buybacks (link), 2026.08.28
- WISEfn (WiseReport) consensus (FCF, retrieved 2026.10.12)
- Yahoo Finance, KRW/USD (KRW=X) for dollar conversions, 2026.10.12
Disclaimer
This post records the author’s personal analysis and views based on publicly available information and does not recommend any particular product or company. It does not recommend buying or selling any financial investment product and is not an investment advisory service.
Figures are as published at the time of writing. The company share of trading value, the volume profiles, the swing ratios, the expected end date of SK hynix’s buyback, the remaining return capacity, the price ranges by horizon and the dollar conversions were calculated by the author from public data and market prices and are not confirmed forecasts. Accuracy and completeness are not guaranteed.
The ranges by horizon are calculations that assume past swings continue; they are not target prices. “Author’s calculation” and “author’s view” mark the author’s own calculations and assumptions, not confirmed facts. This post does not recommend trading at any particular time or promise any return.
Author’s interests: not disclosed
Responsibility for decisions and their outcomes lies with the reader.
As of: October 12, 2026