
Korea’s Shrinking Workforce: Working-Age Population, Potential Growth at 0.6% and What It Means for Stocks (2026)
This report is the English edition of the author’s Korean note on Korea’s shrinking working-age population and potential growth.
In July 1983, to mark Korea’s population passing 40 million, the government held a “national rally to prevent a population explosion.” The event is listed in the population policy chronology of the National Archives of Korea. In April of the same year the Ministry of Health and Social Affairs pushed a plan to make families pay more for health insurance from the third child onward. The archive’s list of 1980s slogans includes lines such as “Even with one child each, the country is overcrowded,” “Even two is too many!” and “A nuclear explosion is frightening; a population explosion is more frightening.” The whole country was worried about having too many people.
Yet in that very year Korea’s total fertility rate fell to 2.06, the first time the number of children a woman has over her lifetime dropped below 2.1, the level that keeps a population steady. In the year of a rally against a population explosion, the road to a shrinking population had already begun. Fertility never came back above 2.1. The government dropped birth control only in 1996, with its “New Population Policy,” and turned to encouraging births only in 2005, with the Framework Act on Low Birth Rate and Aging Society.
So this time the question is: now that the children born then are past forty and Korea’s working-age population has started to shrink, what happens to growth, interest rates, housing, pensions and the stock market? This report follows, with government projections, how the collapse in births turns into a falling working-age population, and uses Bank of Korea, KDI and IMF estimates to see how far it drags down the growth rate the economy can sustain without strain (potential growth). It then looks at how Korea is filling the gap today with a higher employment rate, older workers, women, foreigners and robots; how jobs, wages and growth moved in Japan, which went down the same road 30 years earlier; and what happens to the floor under interest rates and to households, pensions, schools and the army. Finally it traces how the chain reaches Korean stocks and lists the indicators the author is watching.
As of: October 28, 2026 (population figures are Statistics Korea’s December 2023 projection, medium scenario; births are final 2025 data and the August 2026 vital statistics; potential growth is the Bank of Korea’s December 2024 estimate; share prices are end-September 2026 closes). Won amounts are converted at KRW 1,324.77 per dollar, the USD/KRW rate on October 27, 2026.
How it works in Korea: Statistics Korea (renamed the National Data Office in 2025) publishes the official population projection every few years, with low, medium and high scenarios; this report uses the medium scenario released in December 2023. The Bank of Korea (BOK) is the central bank; it sets the base rate eight times a year and publishes its own estimates of potential growth and the neutral rate. KDI is the state-funded Korea Development Institute. Korean shares trade on the KOSPI, the main board of the Korea Exchange (tickers ending .KS), and the KOSDAQ, its growth-company board (tickers ending .KQ). The E-9 visa is the work permit under Korea’s Employment Permit System, which lets small manufacturers, farms, fisheries and builders hire low-skilled workers from 17 partner countries; the government fixes the annual quota each December.
Topics covered: births and the fertility rate; the working-age population and the age structure; how fast Korea shrinks compared with other countries; estimates and projections of potential growth; actual growth; what can offset aging; the employment rate and work by older people, women and foreigners; robots and foreign workers; unemployment, job openings and wages in Japan; Japan’s potential growth broken down; the neutral rate and bond yields; households and housing; the National Pension and old-age dependency; schools and the army; how sectors fared in the Japanese and Korean stock markets; the author’s view and indicators to watch; and the basis of calculation.
Stocks mentioned. Japan: Dip (2379.T), Keyence (6861.T), SMS (2175.T), Persol Holdings (2181.T), Recruit Holdings (6098.T), Mitsubishi UFJ Financial Group (8306.T), Fanuc (6954.T), Nidec (6594.T), Daiwa House Industry (1925.T) and Central Japan Railway, or JR Central (9022.T). Korea: Kleannara (004540.KS), Hanssem (009240.KS), MegaStudyEdu (215200.KQ), Samsung Life Insurance (032830.KS), Hyundai Engineering & Construction (000720.KS), Rainbow Robotics (277810.KQ) and Doosan Robotics (454910.KS).
Korea started running short of children more than 40 years ago, and the result has now reached the workplace
The conclusion of this chapter is that today’s population decline did not appear suddenly; it is the result of something that began 40 years ago. The fertility rate fell below replacement in 1983 and never came back, and the number of babies born each year has fallen to about a quarter of the early-1970s level. People enter working age 15 years after birth and start working in earnest only in their mid-20s, so changes in fertility always reach the workplace 15 to 25 years later.
From 1.025 million births to 230,000
According to Statistics Korea’s birth statistics, births peaked at 1.025 million in 1971. In 1983 the total fertility rate fell to 2.06, below the replacement level of 2.1 for the first time, and in 1984 it dropped to 1.74. From 2002 it stayed below 1.3, and in 2018 it fell below 1 for the first time, to 0.977. The bottom came in 2023, with 230,000 births and a fertility rate of 0.721. More than four times as many children were born in 1971 as in 2023.
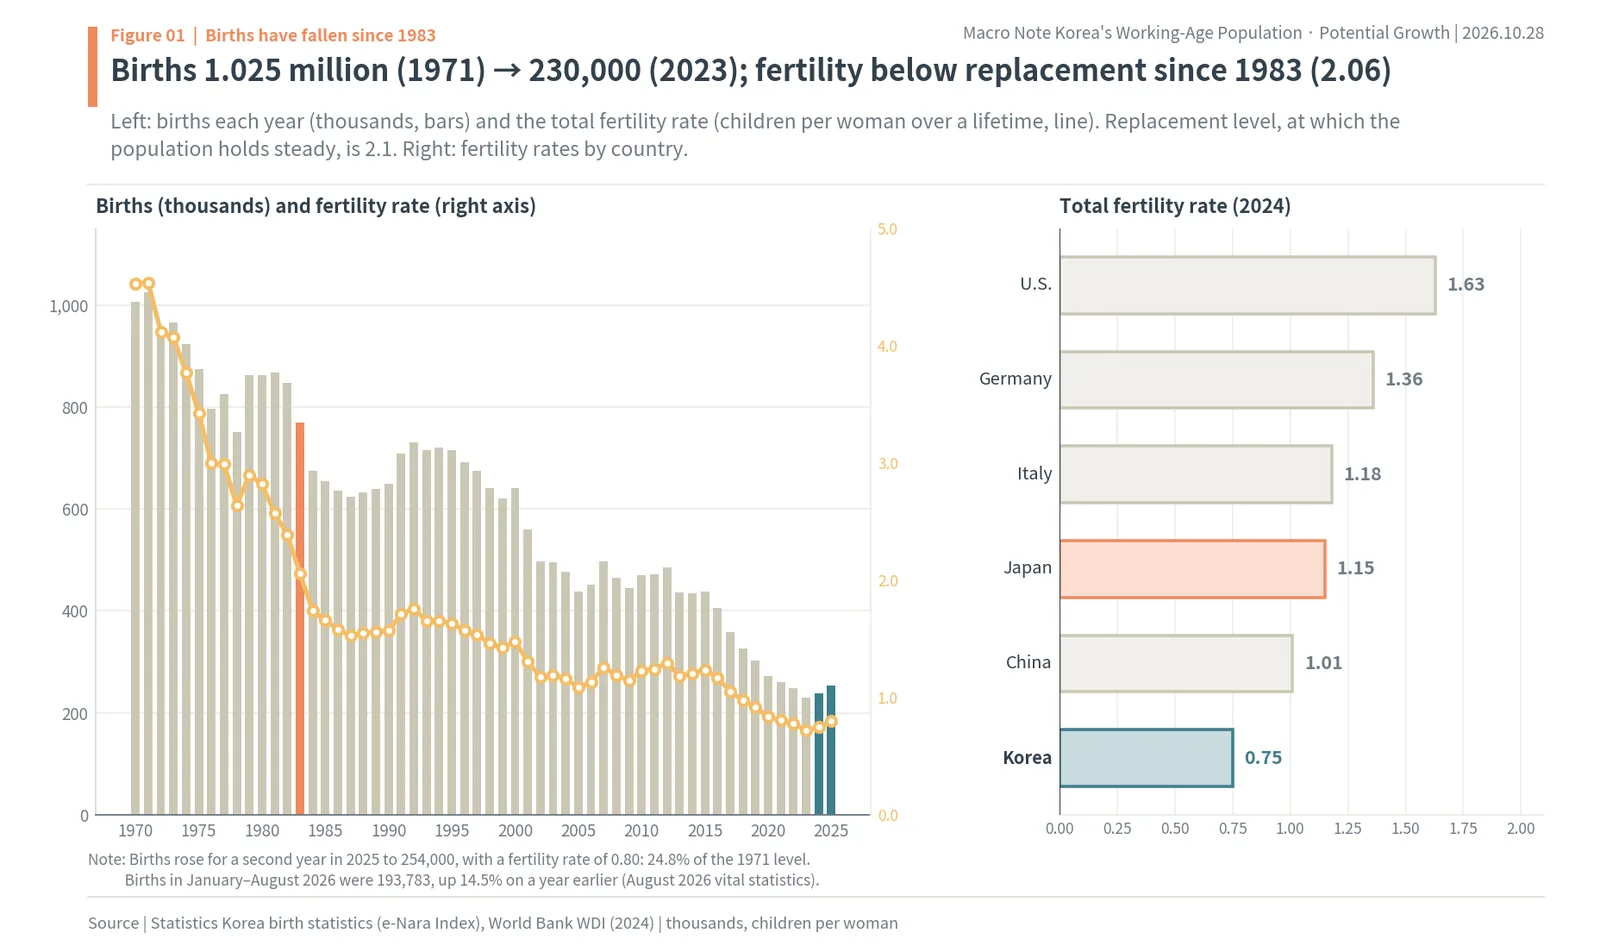
The bars on the left are births each year and the yellow line is the fertility rate; the 1983 bar is shaded coral. The brief rise in births in the early 1990s was not a rise in fertility: the baby boomers born in the 1950s and 1960s had reached the age of having children. When there are many potential parents, births can rise even at low fertility. Today the reverse is true: the number of people of child-bearing age is itself shrinking, so even a small rise in fertility cannot lift births much.
The right panel shows World Bank fertility rates for 2024. Korea, at 0.75, is the lowest of the countries compared: Japan is at 1.15, Italy 1.18, Germany 1.36 and the U.S. 1.63, and even China is at 1.01. Korea sits well below countries famous for low fertility. In a December 2023 report the Bank of Korea attributed about 70% of Korea’s aging to low fertility and 30% to longer life expectancy.
The recent rebound is welcome, but it cannot change the numbers to 2040
Births rose for a second year, to 238,000 in 2024 and 254,000 in 2025, and the 2025 fertility rate was 0.80. In 2026, January-August births were 193,783, 14.5% more than a year earlier, and the August fertility rate was 0.87. Many explain this by a temporary rise in the number of people in their early 30s, born in the larger cohorts of the early 1990s, together with more marriages. Even so, deaths have exceeded births for 82 straight months.
Even if the rebound continues, these children will reach working age (15) around 2040 and start working in earnest around 2050. In other words, everyone who will enter working age before 2040 has already been born. How much the workforce shrinks over the next 15 years is a fixed number that birth policy cannot change. The next chapters look at how big that fixed number is.
Key terms and a hypothetical example: number of workers times output per worker
The conclusion of this chapter is that every link in this report comes from one simple equation: the size of an economy equals the number of people working times what each person produces. When the number of workers falls, output per worker has to rise faster than that for the economy to grow. The terms and the hypothetical example below are the minimum tools needed to read the numbers that follow.
Terms used in this report
The working-age population means people aged 15 to 64, whether or not they actually work. The total fertility rate is the number of children a woman is expected to have over her lifetime; 2.1 is the replacement level that keeps the population steady, slightly above two because of deaths and the sex ratio at birth. The old-age dependency ratio is the number of people aged 65 and over for every 100 people aged 15 to 64.
Potential growth is the growth rate an economy can sustain without stoking inflation, estimated by adding the contributions of labor, capital and productivity. Total factor productivity (TFP) is output that grows without adding people or machines: the share of technology and efficiency. The neutral rate is the interest rate that neither pushes nor holds back the economy, usually expressed in real terms after inflation. The job openings-to-applicants ratio is a Japanese statistic for the number of jobs per job seeker; above 1 means a labor shortage.
Working it through with a hypothetical country
Imagine a country with 100 workers, each producing 1 unit a year, so the economy is 100. If the number of workers falls by 1% a year, next year there are 99. If output per worker stays the same, the economy shrinks 1% to 99. If output per worker rises 1%, 99 times 1.01 is about 100, so the economy stands still. To grow 2%, output per worker has to rise by almost 3% (hypothetical numbers).
This hypothetical country looks a lot like Korea in the 2030s. In the government projection we will see shortly, the population aged 15 to 64 falls by about 500,000 a year in the 2030s, or roughly 1.5% a year. Raising the share of people who work (the employment rate) or working longer hours can soften the decline a little, but in the end growth depends on how fast output per worker rises. That the Bank of Korea expects potential growth below 1%, and that it sees the number rising if productivity improves, are both extensions of this arithmetic.
The hypothetical example also says something about interest rates. If the economy does not grow, there is less reason to build factories, fewer people want to borrow, and the floor under interest rates falls. As people age and more of them save for retirement, the effect grows. That is why the floor under growth and the floor under interest rates fall together. The next chapter starts with the first term in the equation: where the number of workers was decided.
The working-age population peaked in 2019 and will fall by about 500,000 a year in the 2030s
The conclusion of this chapter is that Korea’s working-age population is already shrinking and that the decline is fastest in the 2030s. In Statistics Korea’s population projection (December 2023, medium scenario) the population aged 15 to 64 peaked in 2019. By 2040 it is more than a fifth smaller than at the peak, and by 2072 it is less than half. This group is the people who work, pay taxes and drive consumption.
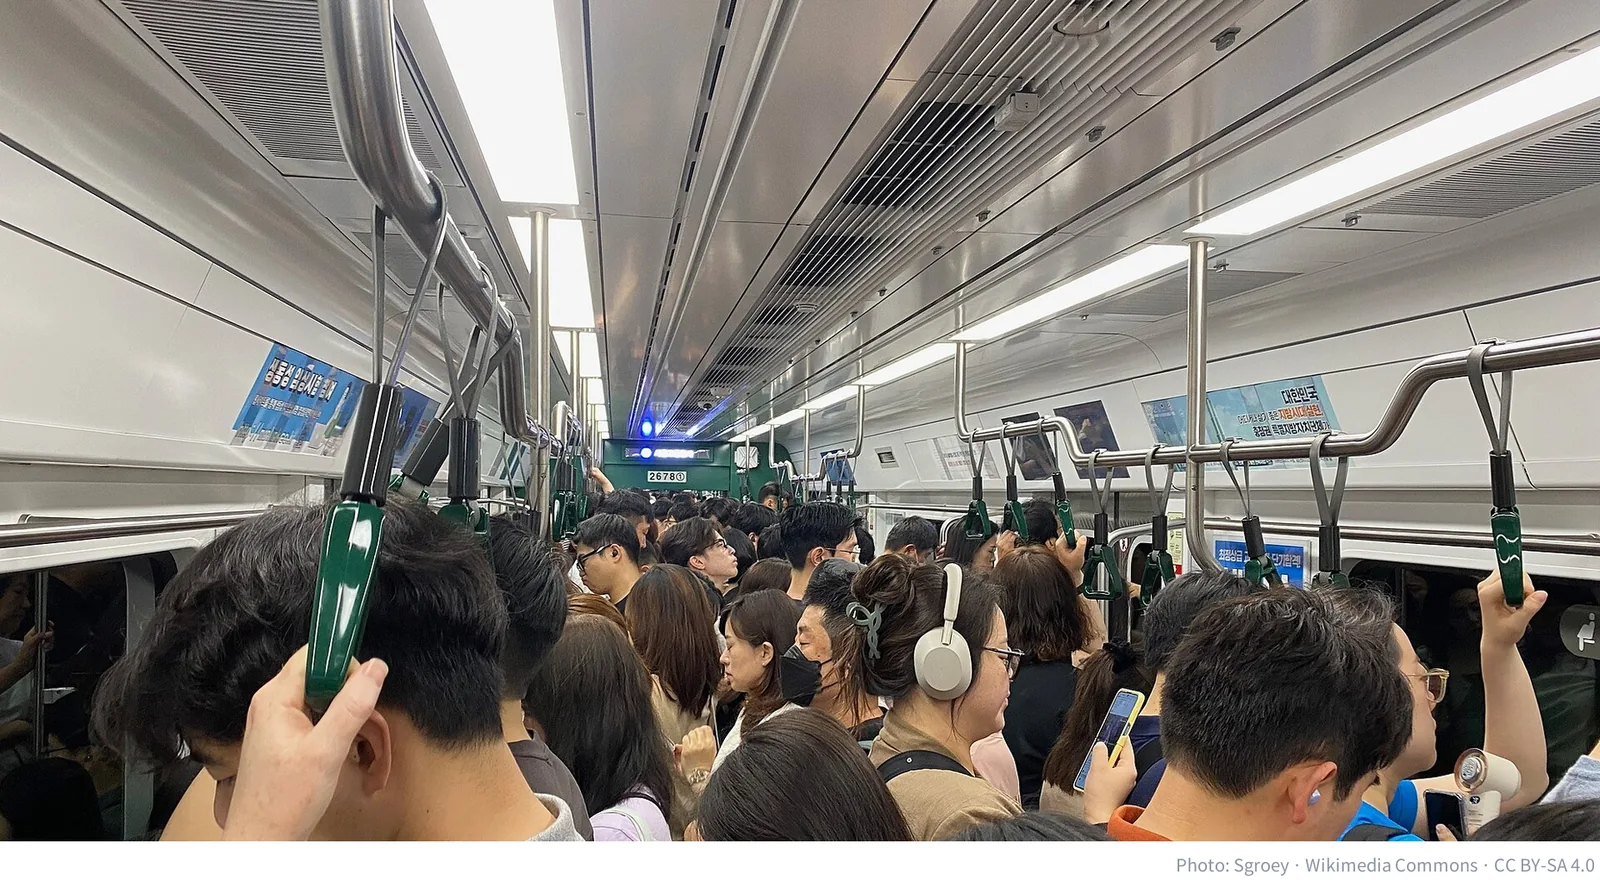
The people packing the morning rush-hour subway are the working-age population. Their number fell from 37.6 million in 2019 to 35.9 million in 2025, a drop of more than 1.7 million already, and Korea’s 2025 register-based census counts 35.87 million aged 15 to 64, 69.2% of the population and below 70% for the first time. Every commuter car will carry fewer working-age people each year from here.
37.6 million in 2019 → 29.0 million in 2040 → 16.6 million in 2072
Adding up the projection’s single-year age groups, the population aged 15 to 64 peaks at 37.6 million (37,628,000) in 2019. It falls to 34.2 million in 2030 and 29.0 million in 2040, 22.9% below the peak, then to 24.4 million in 2050 (-35.0%) and 16.6 million in 2072, less than half the peak (-55.9%). It drops below 30 million in 2039.
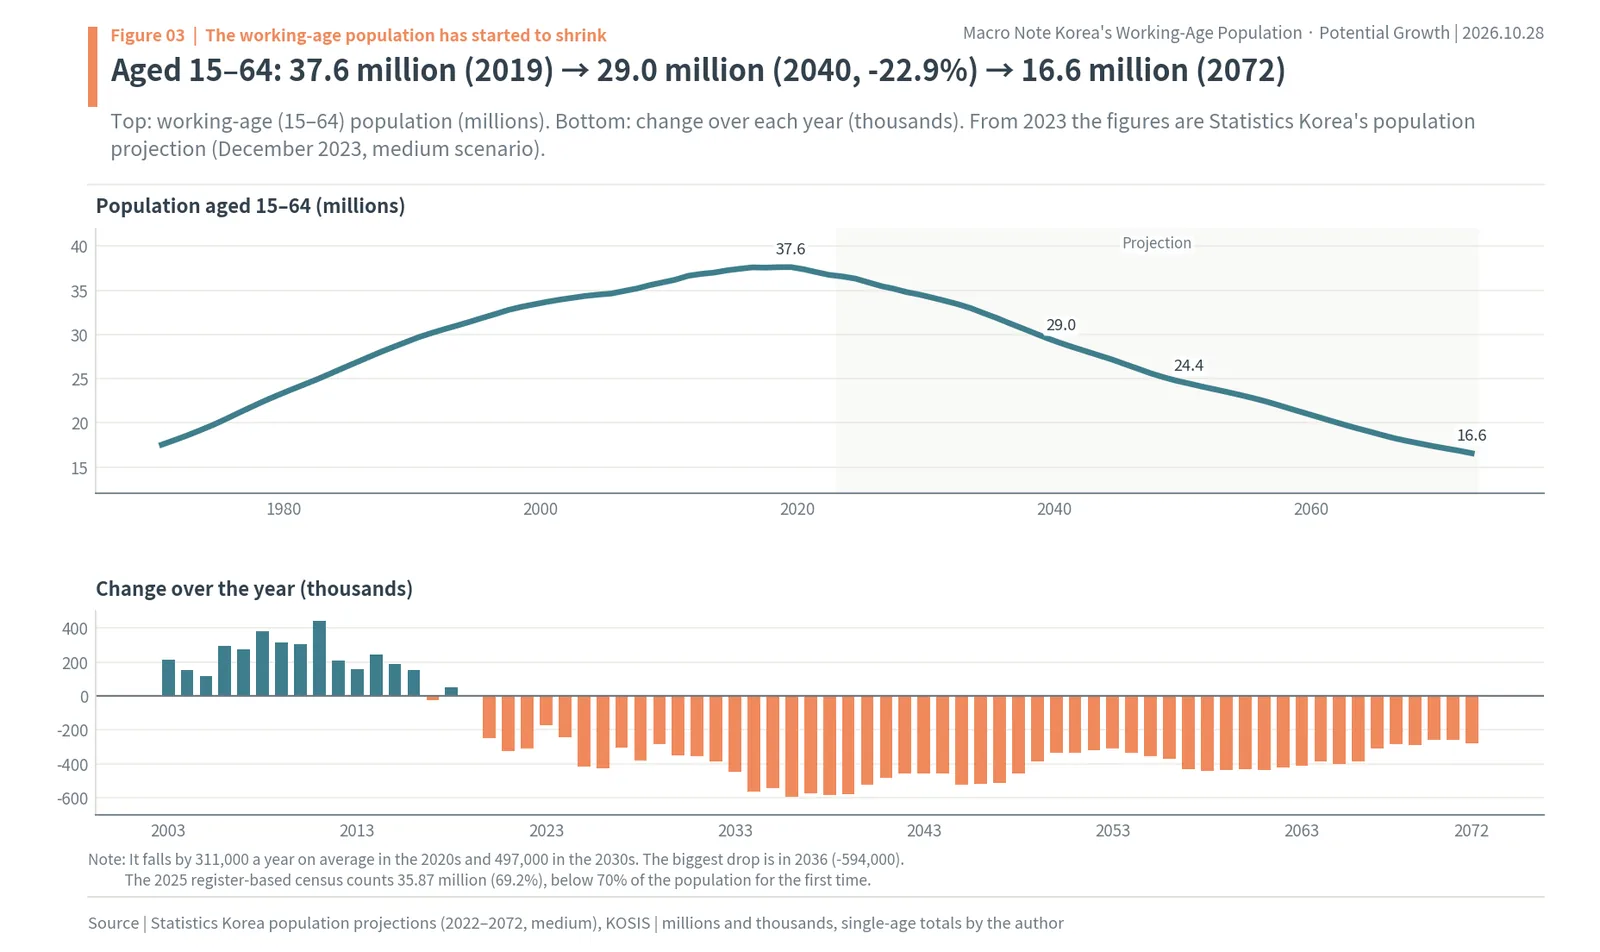
The bars at the bottom show the change over each year. Until the early 2010s the working-age population grew by 200,000 to 400,000 a year, but in the 2020s it falls by 311,000 a year on average and in the 2030s by 497,000. The biggest drop comes in 2036, at 594,000: roughly a mid-sized city’s worth of workers disappearing in a single year. The reason is that baby boomers born in 1955-74 turn 65 one cohort after another, while the 15-year-olds replacing them come from generations of only about 200,000 to 300,000 births a year. Each year the people leaving the group were born when 800,000 to 1 million babies arrived annually, and those entering were born when about half as many did, so the gap turns straight into decline.
Each worker will support three times as many older people
The age structure makes the change even clearer. The share of people aged 65 and over was 20.3% in 2025, already past the 20% threshold for a “super-aged society.” It passes 30% in 2036 and reaches 40.1% in 2050 and 47.7% in 2072. The total population peaked at 51.836 million in 2020 and falls to 36.222 million by 2072.
The right side of the next chart is the old-age dependency ratio: people aged 65 and over per 100 people of working age. It rises from 29.3 in 2025 to 38.0 in 2030, 59.1 in 2040 and 104.2 in 2072, when there will be more older people than working-age people.
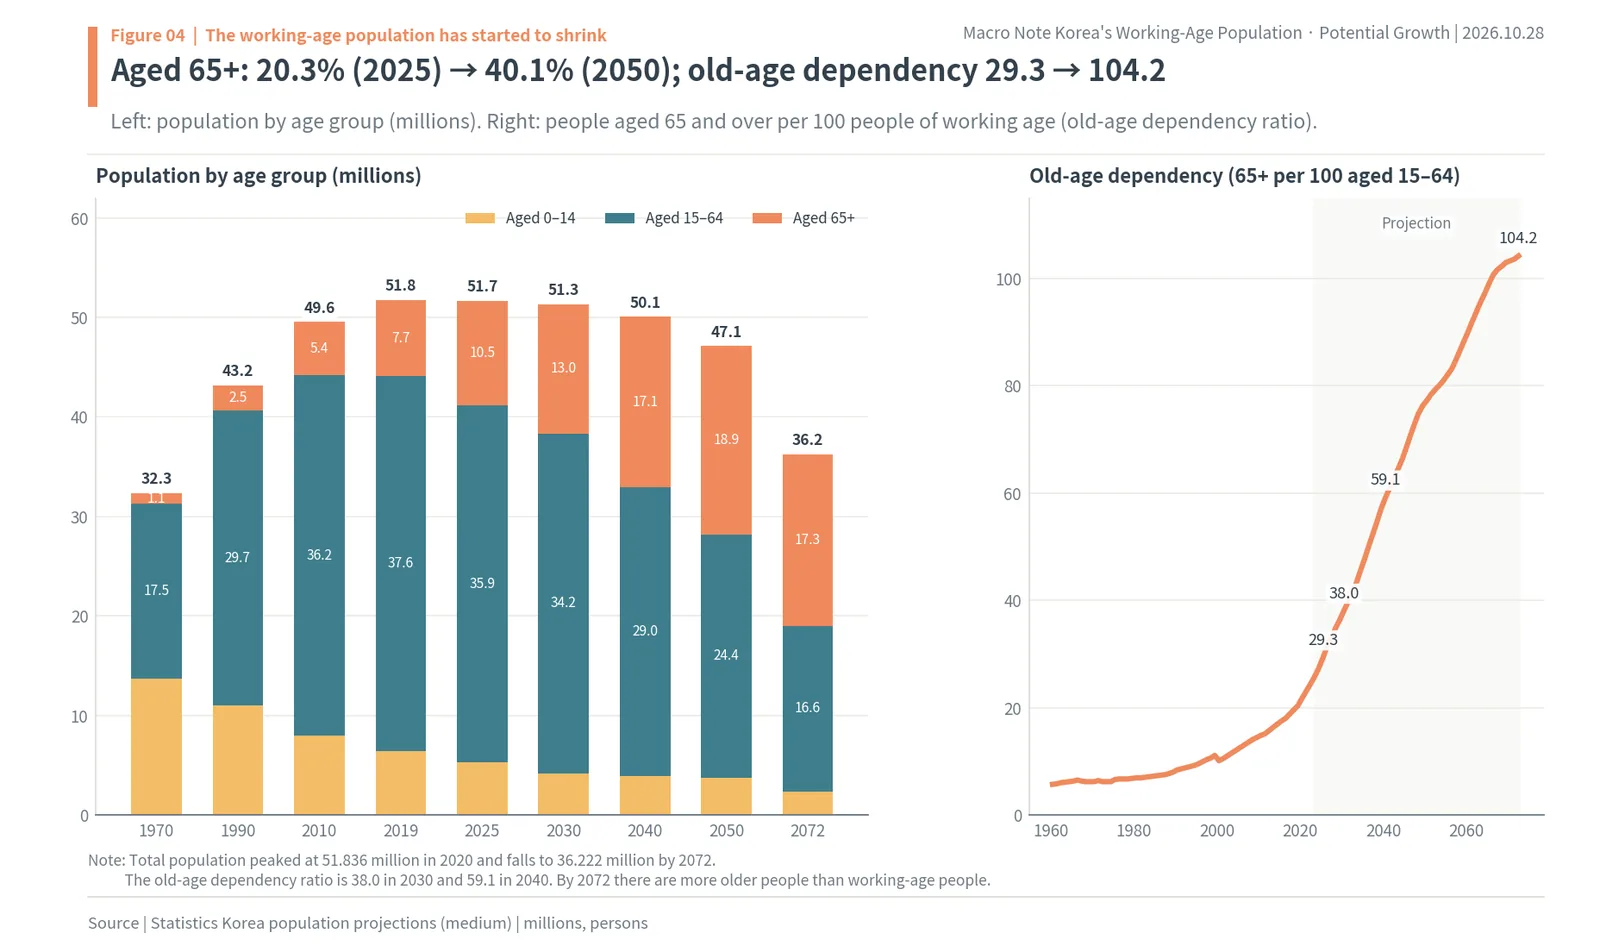
The weight of this change is that two things happen at once: fewer people to work and more people to support. That matters because an economy is, in the end, the number of workers times output per worker. If the number of workers falls by more than 1% a year, the economy as a whole shrinks unless output per worker rises by at least as much. So how fast is this decline compared with other countries? The next chapter lines Korea up with the countries that went first.
Korea is going down the road Japan took over 30 years at twice the speed
The conclusion of this chapter is that several countries have seen their working-age populations shrink, but none as fast as Korea. If each country’s peak year for the 15-64 population is set as year 0, Japan stood at 82.9 thirty years after its peak, a fall of just over 17%. Korea, on the government projection, stands at 65.9 in 2049, thirty years after its peak: a fall of 34%. Over the same 30 years, Korea’s decline is twice Japan’s.
Thirty years after the peak: Japan 82.9 vs Korea 65.9
In World Bank data the 15-64 population peaked in 1992 in Italy, 1995 in Japan, 1997 in Germany and 2015 in China. Korea’s peak is 2019 on the government projection (2018 on the World Bank’s numbers). The U.S. is still growing. With each peak set to 100, Italy and Germany were still in the 90s almost 30 years later, because both kept bringing in workers through immigration. Japan, taking in very few immigrants, fell to 82.9 in 30 years. Korea’s line is steeper than Japan’s from the start: 77.1 twenty years after the peak, 65.9 after thirty, and 44.1 after 53 years, in 2072. Korea goes through in about 15 years the decline Japan went through in 30.
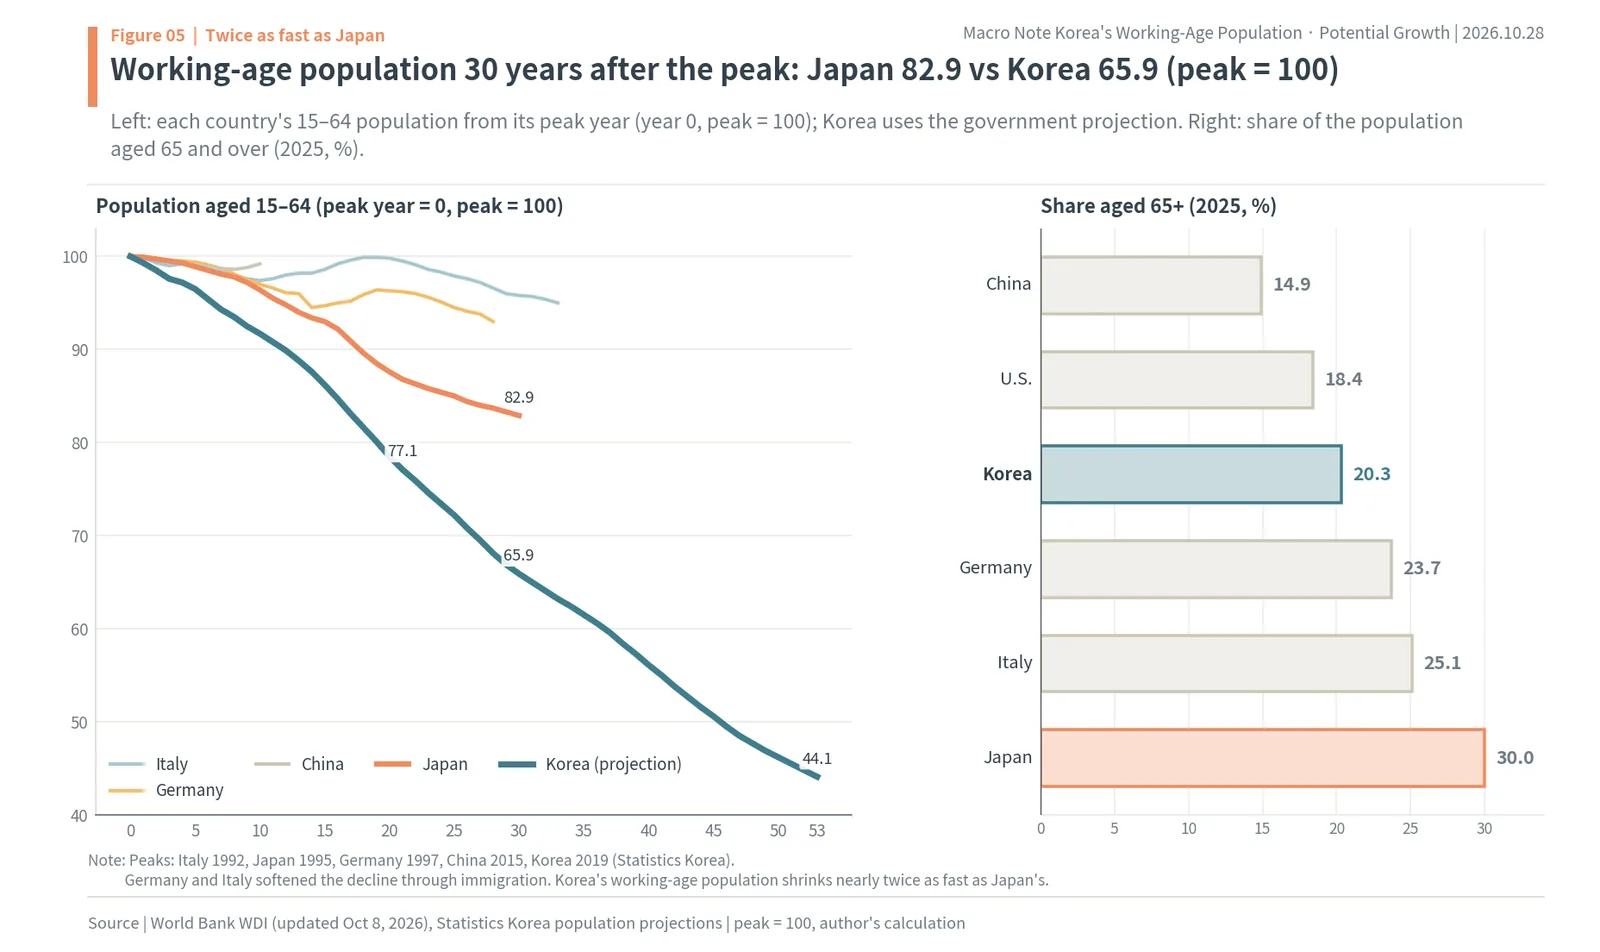
The right panel is the share of people aged 65 and over in 2025. Korea, at 20.3%, is still below Japan (30.0%), Italy (25.1%) and Germany (23.7%), but as the previous chapter showed, it passes 30% in 2036 and reaches today’s Japan. The Bank of Korea has pointed out that Korea took far less time than Japan to go from an aged to a super-aged society.
Speed matters because of the time it leaves for adjustment. When the workforce shrinks slowly, companies install machines and change how they work, and governments have time to adjust retirement ages and pensions. When it shrinks fast, those adjustments cannot keep up. Automating one factory takes years, and reforming a pension system takes close to a decade of debate, so a difference in speed is a difference in preparation time. How fast schools close, how fast the army shrinks and how fast provincial towns empty all follow the slope of this line.
China and Korea: neighbors aging at the same time
China passed its peak in 2015 and has so far fallen by less than 1%, but with a fertility rate of 1.01 it is likely to follow a road similar to Korea’s. As the first post in this macro series on China’s Lewis turning point showed, China has run out of rural workers to move to the cities, and now its working-age population itself has begun to fall. Since a large share of Korea’s exports goes to China and Korean firms compete with Chinese ones in the same industries, the neighbor’s aging also changes demand and competition for Korean companies.
In short, Korea started later than Japan but reaches the same point much faster. How fast, then, can an economy grow when its workforce shrinks this quickly? The next chapter looks at the potential growth estimates of the Bank of Korea and KDI.
The growth rate the economy can sustain falls from 2% to below 1%
The conclusion of this chapter is that as the workforce shrinks, the growth rate Korea can sustain without strain, its potential growth, keeps falling. The Bank of Korea estimates that potential growth fell from an annual average of 5.0% in 2001-05 to 2.0% in 2024-26 and expects it to reach 0.6% in 2045-49. It also calculated that without a policy response the chance of growth at or below 0% in the 2050s is 68%.
What potential growth is
Potential growth is the growth an economy can achieve when it uses its people, machines and technology normally, without stoking inflation. Actual growth in any one year can be above or below it, but averaged over several years it returns to the neighborhood of potential growth, so potential growth works as both floor and ceiling. It is usually estimated by adding three parts: growth in people and hours worked (labor), growth in machines and factories (capital), and producing more with the same people and machines (productivity, or total factor productivity).
When the working-age population shrinks, the labor contribution turns negative. In a country with fewer people there is also less reason to build factories, so the capital contribution shrinks too. What remains is productivity. That is the route by which the population decline in the previous chapters drags down potential growth.
5.0% in 2001-05 → 2.0% in 2024-26 → 0.6% in 2045-49
BOK Issue Note No. 2024-33 (December 19, 2024), averaging four models, puts potential growth at 5.0% in 2001-05, 4.1% in 2006-10, 3.4% in 2011-15, 2.6% in 2016-20, 2.1% in 2021-23 and 2.0% in 2024-26. Its projections are 1.8% for 2025-29, 1.3% for 2030-34, 1.1% for 2035-39, 0.7% for 2040-44 and 0.6% for 2045-49. The note blames the decline on the shrinking working-age population and slower productivity and capital investment: growth of the population aged 15 and over swings from 0.4% a year in the early 2020s to -0.7% a year in the late 2040s, dragging down the labor contribution.
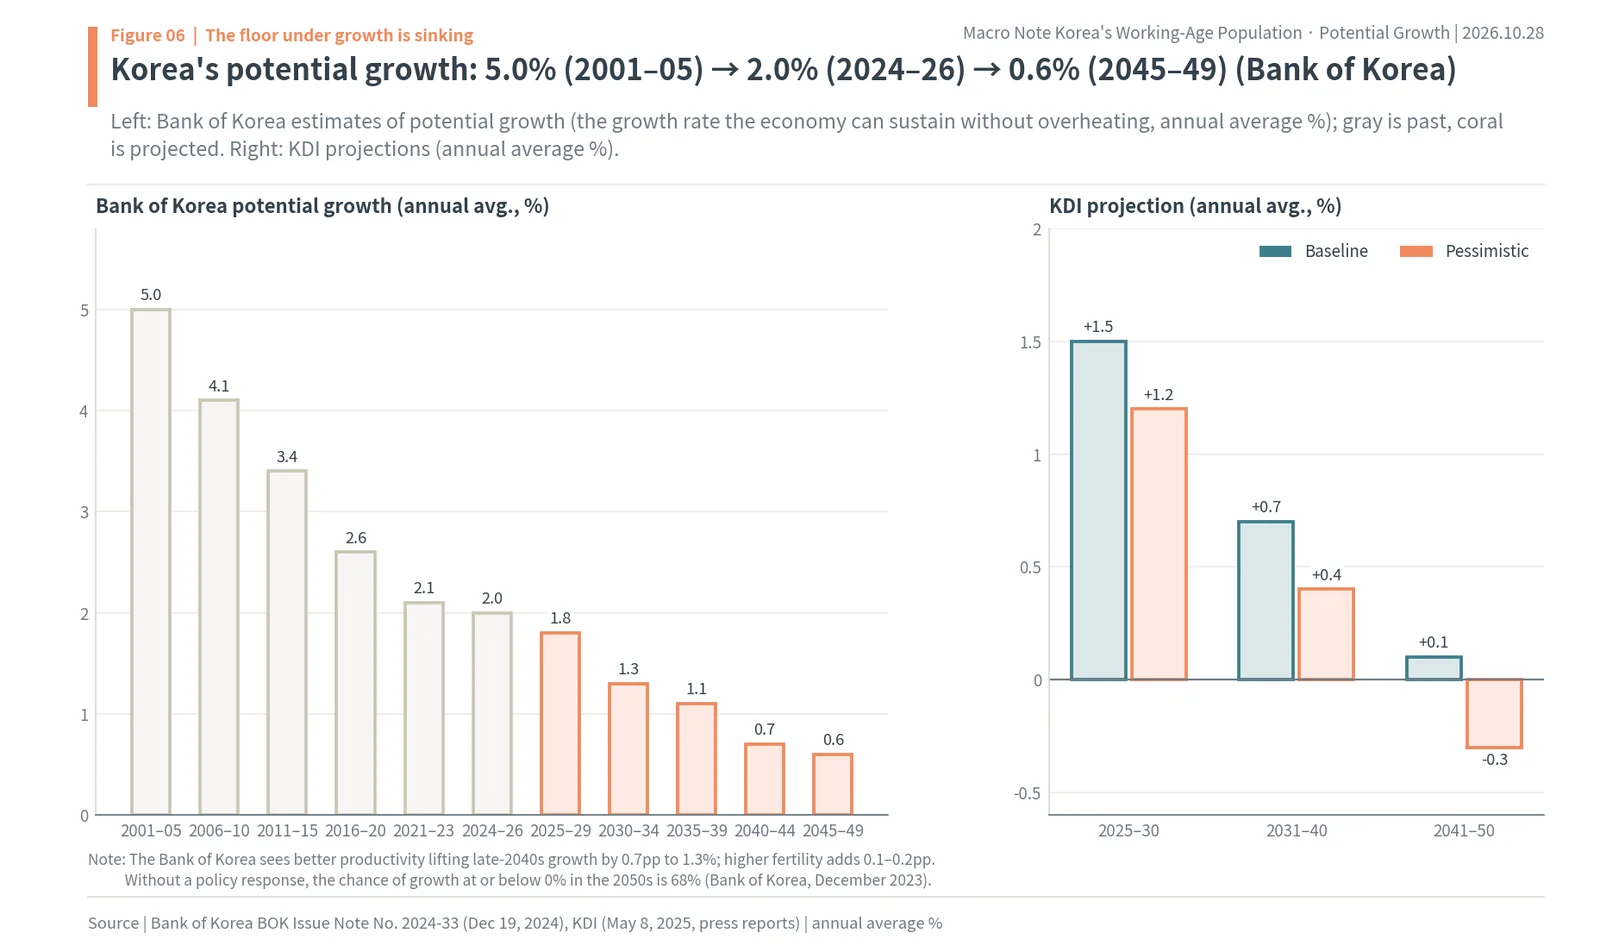
KDI’s projection (May 8, 2025, as reported) is lower still: 1.5% in 2025-30, 0.7% in 2031-40 and 0.1% in 2041-50 in the baseline, and -0.3% in 2041-50 in a pessimistic scenario with weaker productivity. The Bank of Korea’s December 2023 report put the chance of growth at or below 0% in the 2050s, without a policy response, at 68%, and the chance of the population falling below 40 million by 2070 at 90%. The institutions’ numbers differ a little, but the direction is the same: in the 2040s Korea’s baseline growth rate falls below 1%.
In the same note the Bank of Korea found that better productivity would lift potential growth in the late 2040s by 0.7pp, to 1.3%; higher fertility would add 0.1-0.2pp; and higher productivity among women and older workers another 0.1pp. Fertility helps little because, as we saw, a child born today takes 20 years to reach the workplace. What can be changed is mainly output per person. Bank of Korea Governor Shin Hyun Song told the National Assembly’s October audit that a new potential growth estimate would be published within the year.
Actual growth has followed the same path
Averaging World Bank figures by decade, Korea’s actual growth was 10.6% in the 1970s, 9.0% in the 1980s, 7.4% in the 1990s, 4.9% in the 2000s, 3.5% in the 2010s and 1.9% in 2020-25. Japan’s fell to 1.4% in the 1990s and 0.5% in the 2000s as it passed its working-age peak (1995). Growth in 2025 was 1.01% in Korea and 1.19% in Japan.
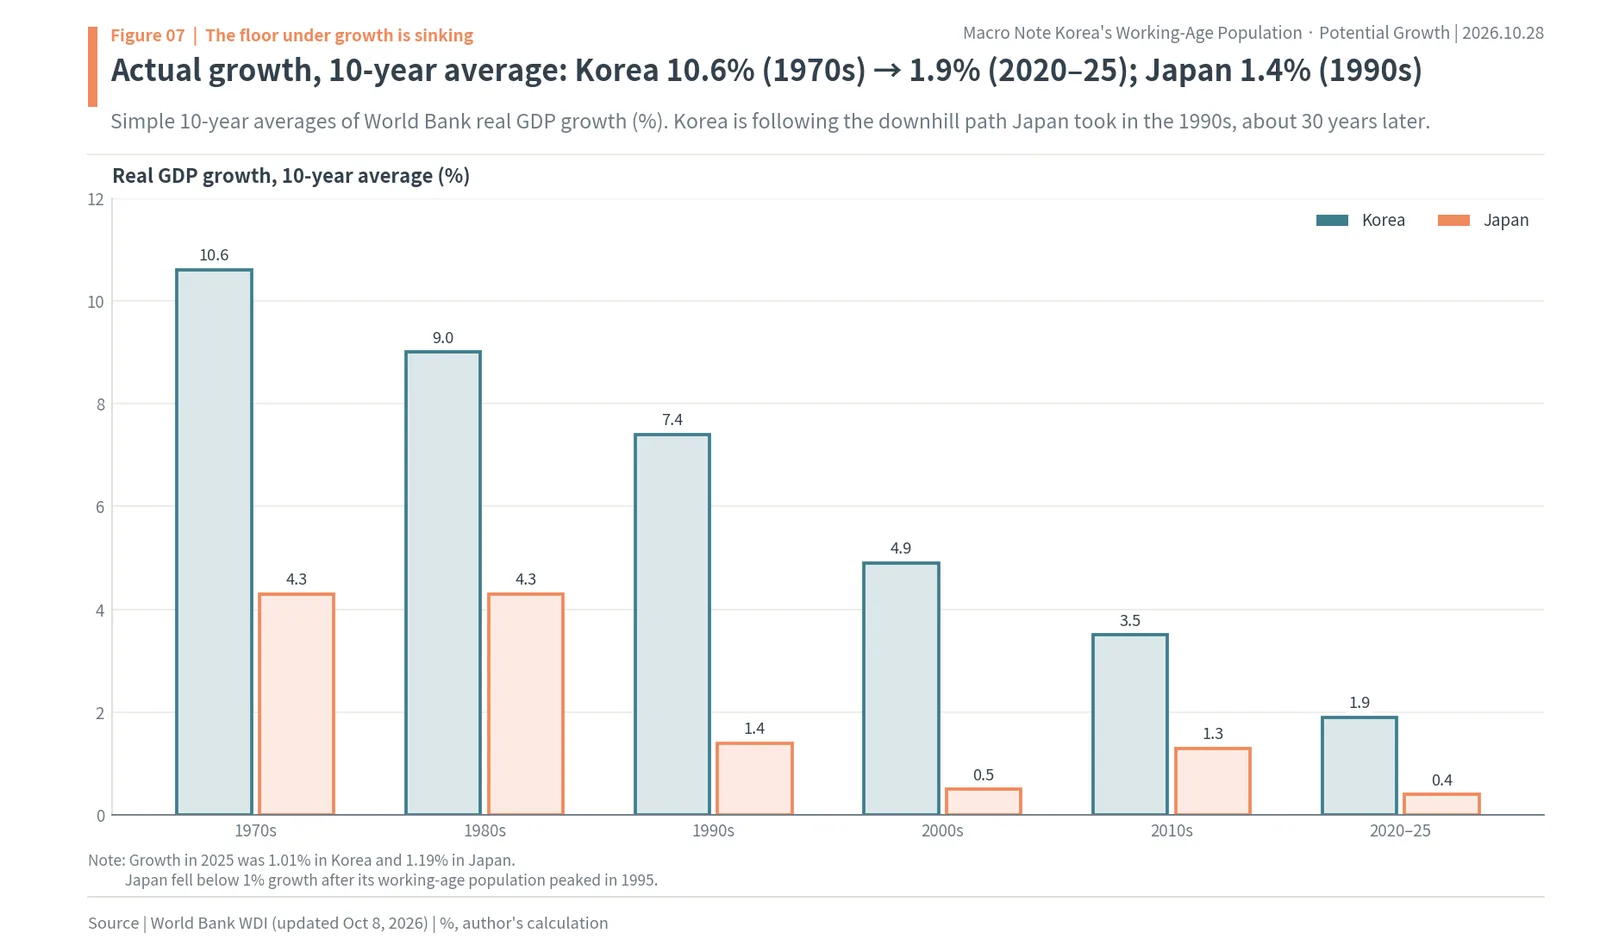
On ten-year averages Korea is following the downhill path Japan took in the 1990s, about 30 years later but starting from a higher point. The 2020-25 average of 1.9% is below Japan’s 1980s (4.3%) and slightly above its 1990s (1.4%).
The gap can be filled, but only by doing all three things
On April 3, 2025 the IMF calculated that Korea’s labor force will shrink by more than a quarter by 2050, cutting potential growth by 0.67pp a year on average. It also set out what could make up for it: higher labor force participation could offset about a fifth of the aging drag, better reallocation of money and people to more productive firms could add 0.22pp, and AI up to 0.44pp.
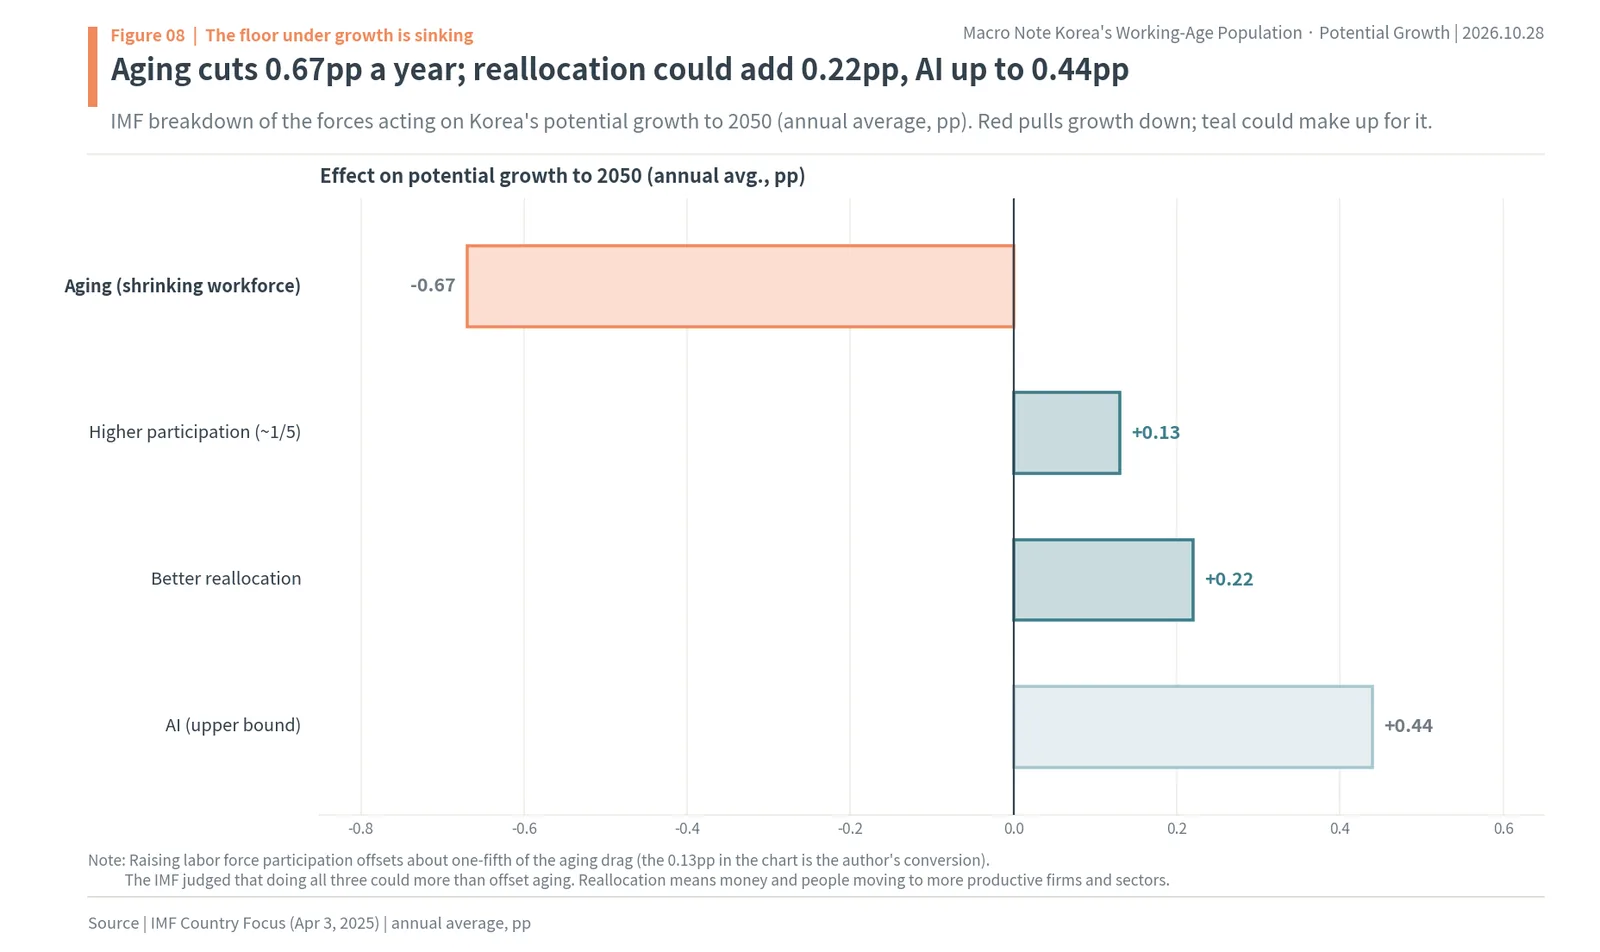
Together the three exceed the aging drag, but none of them comes on its own. Participation has already risen a lot (next chapter), better reallocation requires changing regulation and the structure of the labor market, and the AI figure is the top of the estimated range. The drag from population is already fixed; the offset depends on effort. So how is Korea filling the shrinking workforce today?
For now, more people working for longer are filling the gap
The conclusion of this chapter is that although the working-age population has fallen, the number of people in work has risen, and women, older people, foreigners and robots made up the difference. These tools have already been used heavily, though, so the room left to fill the gap is shrinking. When the working-age population falls by 500,000 a year in the 2030s, the same approach will not hold.
Employment rate for ages 15-64: 61.5% → 69.8%
In Statistics Korea’s Economically Active Population Survey, the employment rate for ages 15 to 64 rose from 61.5% in 2000 to a record 69.8% in 2025. The share of working-age people actually in work rose by more than 8pp in 25 years. Multiplying that difference by the 2025 working-age population, about 2.98 million more people are working because of the higher employment rate alone (author’s calculation). Total employment rose from 21.17 million in 2000 to 28.77 million in 2025.
The faces filling Korea’s factories and offices have also changed. Women’s participation rate for ages 15 to 64 rose from 52.1% to 64.7%, and the employment rate for ages 55 to 64 from 57.8% to 70.5%. The employment rate for people aged 60 and over went from 36.2% in 2010 to 46.7% in 2025.

In 2025 total employment grew by 193,000, while employment of people aged 60 and over rose by 345,000 and of people in their 20s fell by 170,000. In other words, people aged 60 and over filled all the new jobs and more.
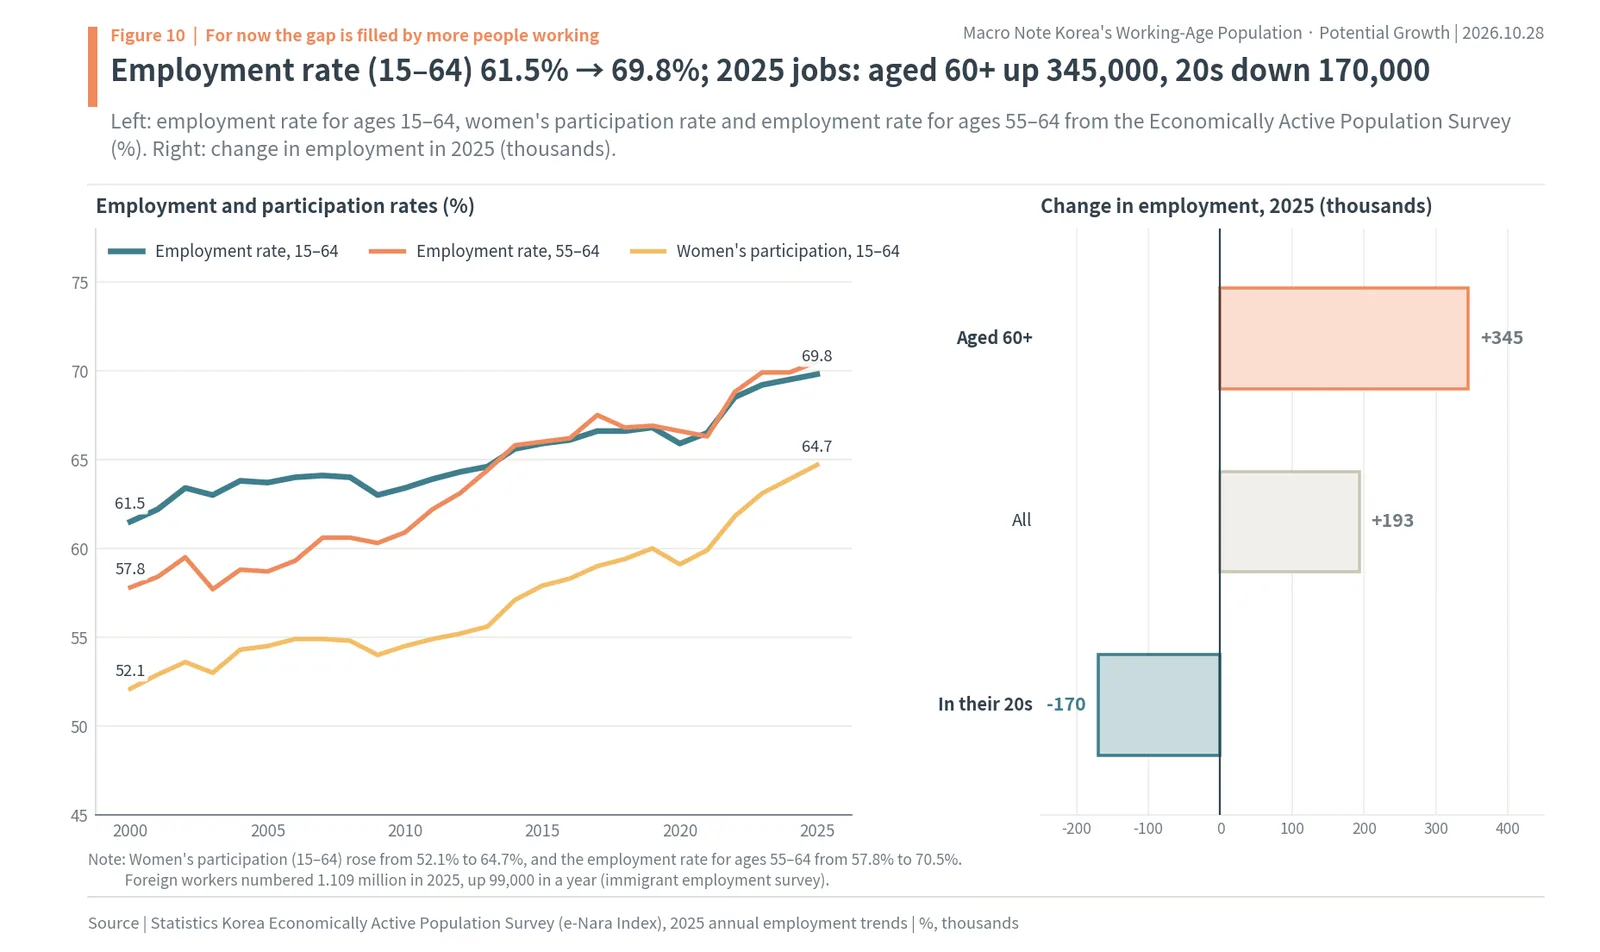
The chart says two things. First, employment statistics did not look bad even though the working-age population has been shrinking since 2019, because more people worked for longer. Second, that approach has limits. As the employment rate for ages 15 to 64 approaches 70%, there is less room to raise it, and the share of people in their 60s who work cannot rise forever. The fall in employment of people in their 20s reflects a shortage of jobs, but also a shrinking number of people in their 20s.
What a shrinking cohort of twenty-somethings means
Fewer workers in their 20s means more than a shortage of young hands. People in their 20s learn new technology fastest, change jobs and move to more productive firms, and rent their first home, buy furniture and marry. The economy’s dynamism and the first steps of consumption are concentrated at this age. More workers in their 60s can fill the number of jobs, but not the mobility and the new spending. That is why one more or one fewer worker weighs differently on the economy depending on age.
More work by older people is good in itself, but hours and pay need to be looked at too. In Japan the new jobs were filled with short-hours work by older people and women, and real wages per person did not rise. In Korea, too, many of the new jobs for older people are likely to be short-hours or low-paid. A higher employment rate can slow the fall in the number of workers, but it is harder to slow the fall in total hours worked. In the Bank of Japan’s breakdown, the hours-worked contribution was negative for 30 years.
Foreigners and robots
Foreign workers numbered 1.109 million in 2025, up 99,000 in a year and the most since the series began in 2012 (survey of immigrants’ residence and employment). Of these, 321,000 work under the Employment Permit System (E-9), eight in ten of them in mining and manufacturing. Yet the government set the 2026 E-9 quota at 80,000, 38.5% below the 130,000 of 2025. Employers report a shortage of 467,000 workers, a shortage rate of 2.4% (Ministry of Employment and Labor, as of April 1, 2026).
Korea already uses more robots than anyone. According to the International Federation of Robotics (IFR) World Robotics 2025, Korea has 1,220 industrial robots per 10,000 manufacturing employees, the most in the world: 9.2 times the world average (132) and 2.7 times Japan (446). Singapore (818), Germany (449) and Sweden (377) follow.
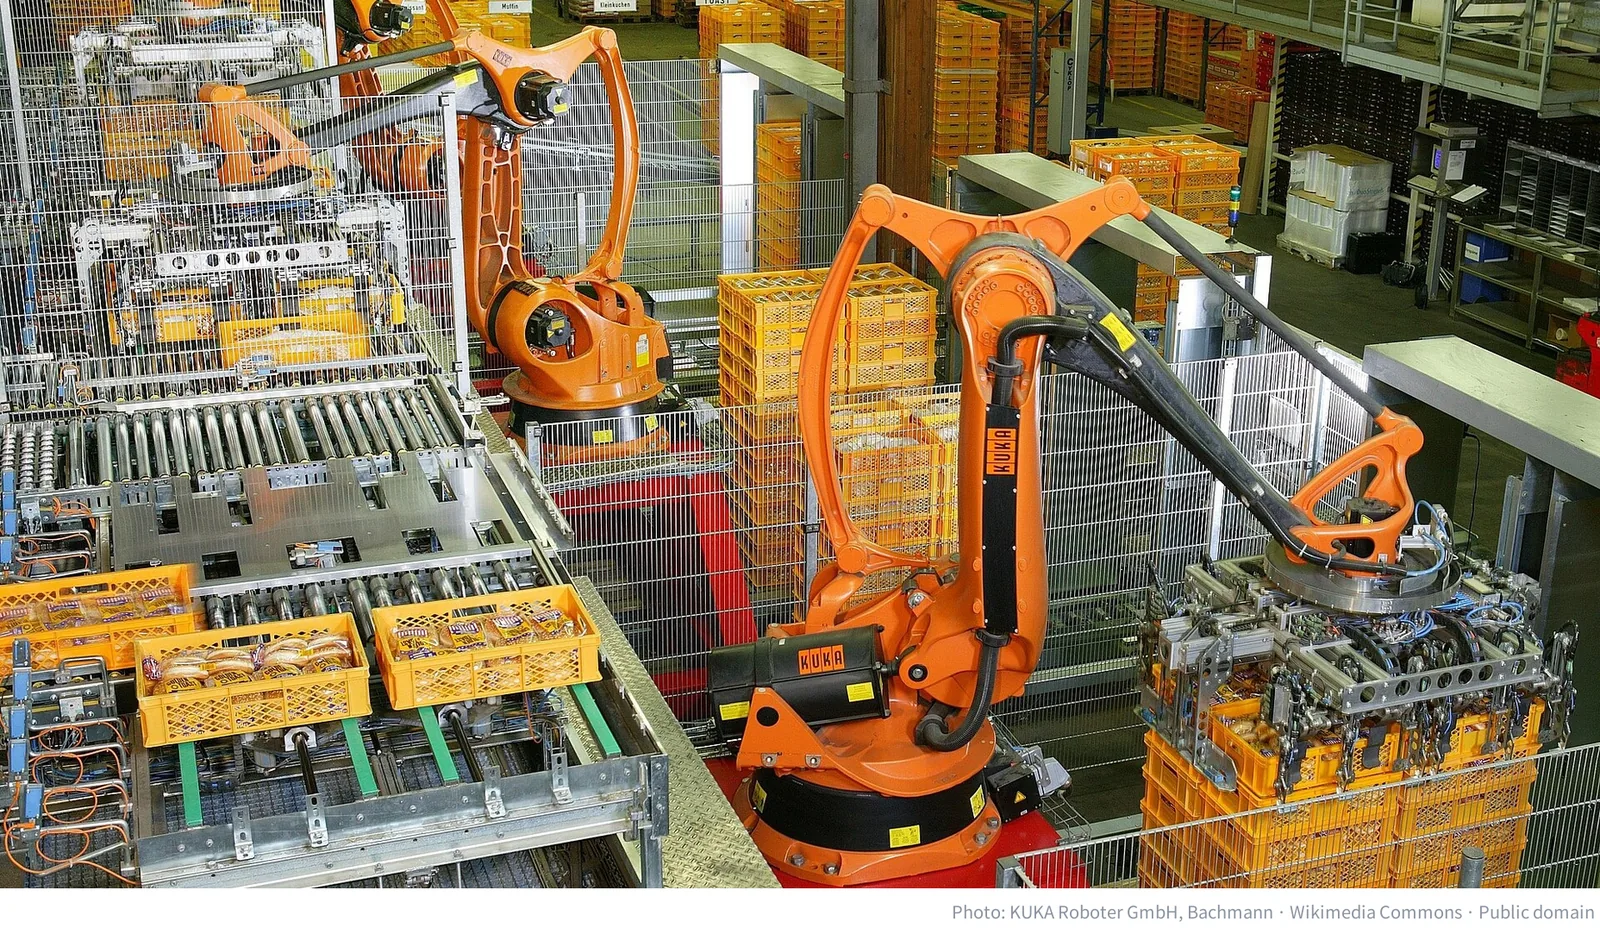
The robot figures sit next to the foreign worker quota in the chart below, because both are ways of replacing missing hands.
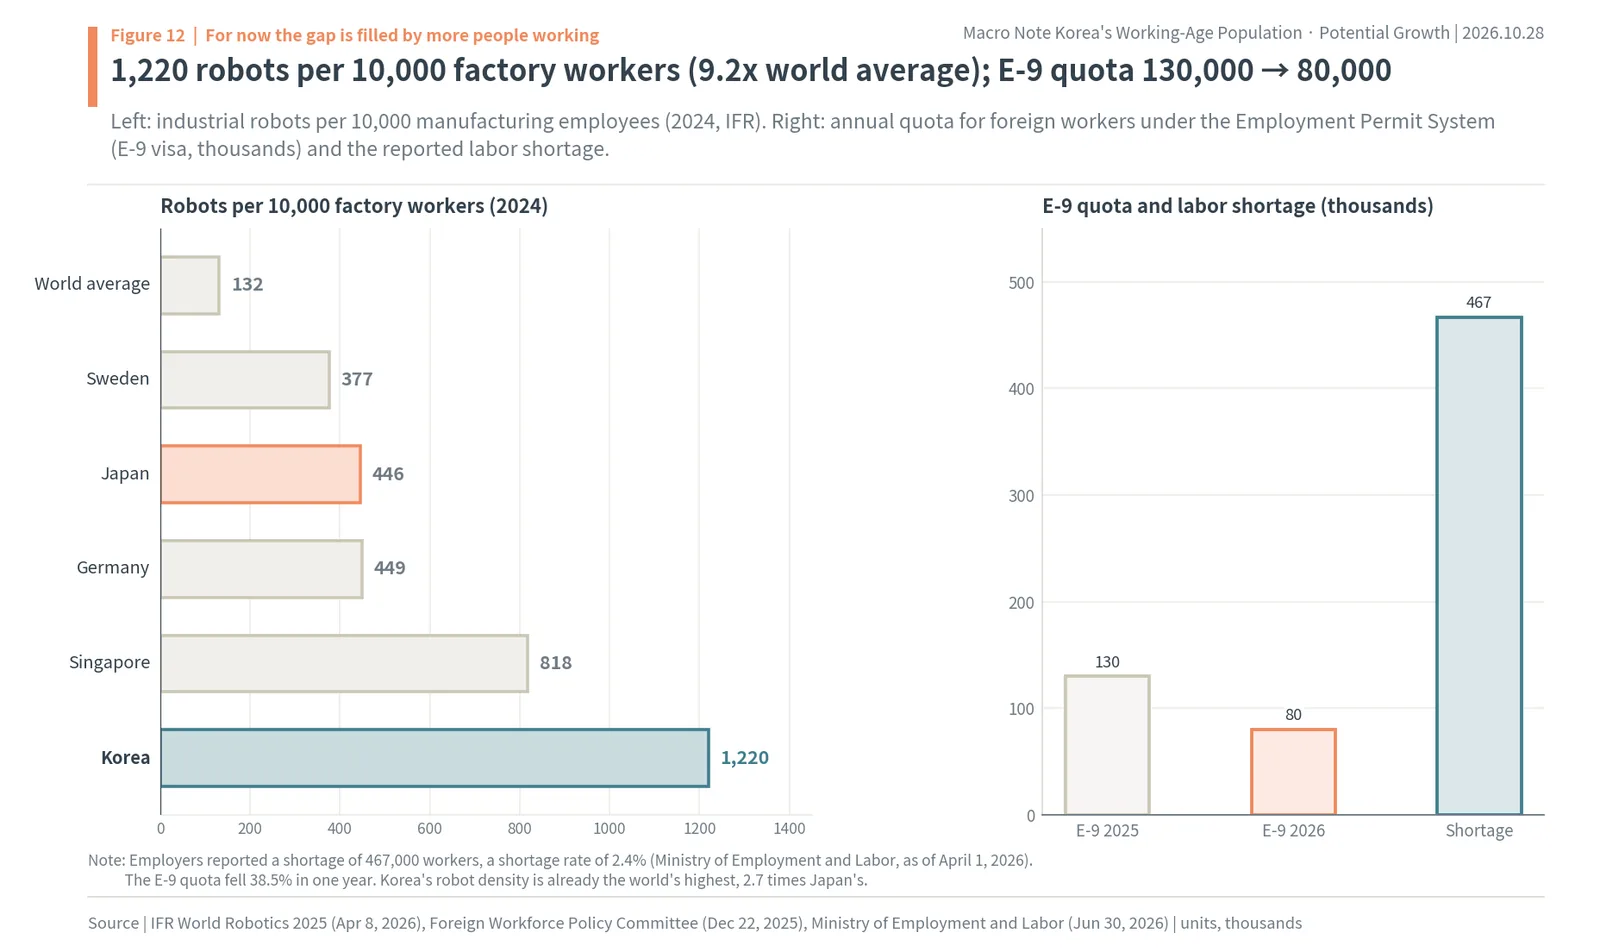
The world’s highest robot density is good news that automation is advanced, but it also means much of what is easy to automate has already been automated. The remaining gaps are in care, construction, farming and fishing, and services, where robots are hard to use. Foreign workers are the fastest way to fill those jobs, but the annual quota is set politically. So far Korea has bought time with a higher employment rate and robots; from here those two will struggle to keep up with the decline of the 2030s. What happened to Japan, which went down the same road 30 years earlier?
In Japan, a falling population first cost jobs; the labor shortage came only 20 years later
The conclusion of this chapter is that when the working-age population shrinks, what comes first is not a shortage of workers but a shortage of demand. After Japan’s working-age population peaked in 1995, unemployment actually rose for seven years, and a clear labor shortage, with more than one job per job seeker, appeared only in 2014. Even after workers became scarce, wages after inflation did not rise.
After the 1995 peak: unemployment 3.2% → 5.4%
Japan’s population aged 15 to 64 peaked at 87.26 million in 1995 (land ministry white paper) and stood at 73.529 million on October 1, 2025, down 15.7% in 30 years (Statistics Bureau of Japan). Yet in the long-term statistics of the Japan Institute for Labour Policy and Training (JILPT), unemployment rose from 3.2% in 1995 to 5.4% in 2002. The job openings-to-applicants ratio was 0.63 in 1995 and passed 1 only in 2014 (1.09). It reached 1.61 in 2018, the highest since 1973, and was 1.22 in 2025 and 1.18 in August 2026.
Talk of labor shortages at Japanese shipyards and construction sites took off only in the mid-2010s, about 20 years from the peak to the shortage. In between, after the bubble burst, Japanese firms cut investment and jobs to pay down debt. There was little reason to build new factories in a country whose population was shrinking, and the falling population cut consumption. The first face of population decline was not “too few workers” but “too few buyers.”
Real wages -16.7% (1996-2023)
A labor shortage should push wages up, but not in Japan. The real wage index in the Ministry of Health, Labour and Welfare’s Monthly Labour Survey (2020 = 100) peaked at 116.5 in 1996 and stood at 97.1 in 2023, down 16.7%. Even after the shortage became clear in 2014, real wages slid further from around 102.3. The new jobs were filled by non-regular, older and female workers on short hours, and firms chose to hire more people and install machines rather than raise wages.
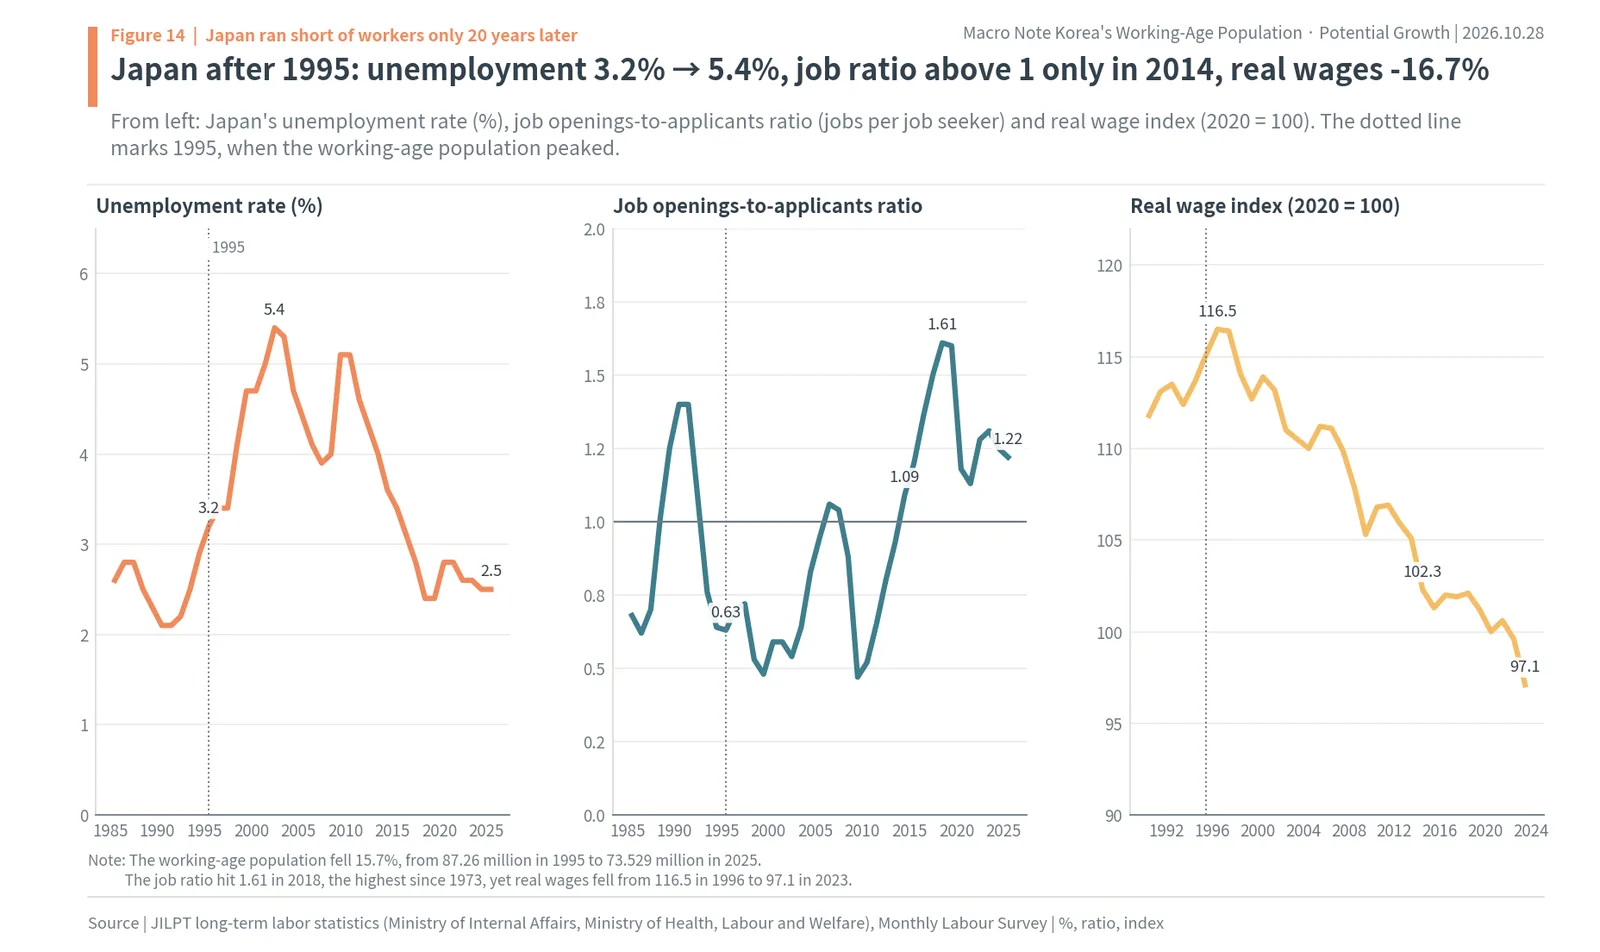
Like Korea, Japan held up by putting more people to work. In 2025 Japan had 9.43 million employed people aged 65 and over, an employment rate of 26.0% for that age group, and an employment rate of 75.3% for women aged 15 to 64. Foreign workers numbered 2,571,037 at the end of October 2025, 3.77 times the 682,450 of 2012. As a result the labor force reached 70.04 million in 2025, above 70 million for the first time. Japan showed that the number of workers can grow while the population shrinks, but at the price of wages per person not rising.
Japan’s potential growth: 4.24% (1983-89) → 1.98% (1990s) → 0.57% (2010s)
Averaging the Bank of Japan’s estimates of potential growth by period gives 4.24% for 1983-89, 1.98% for the 1990s, 0.70% for the 2000s, 0.57% for the 2010s and 0.57% for 2020-26 (author’s calculation). Splitting these into the contributions of productivity (TFP), capital, hours worked and employment shows why Japan’s floor fell.
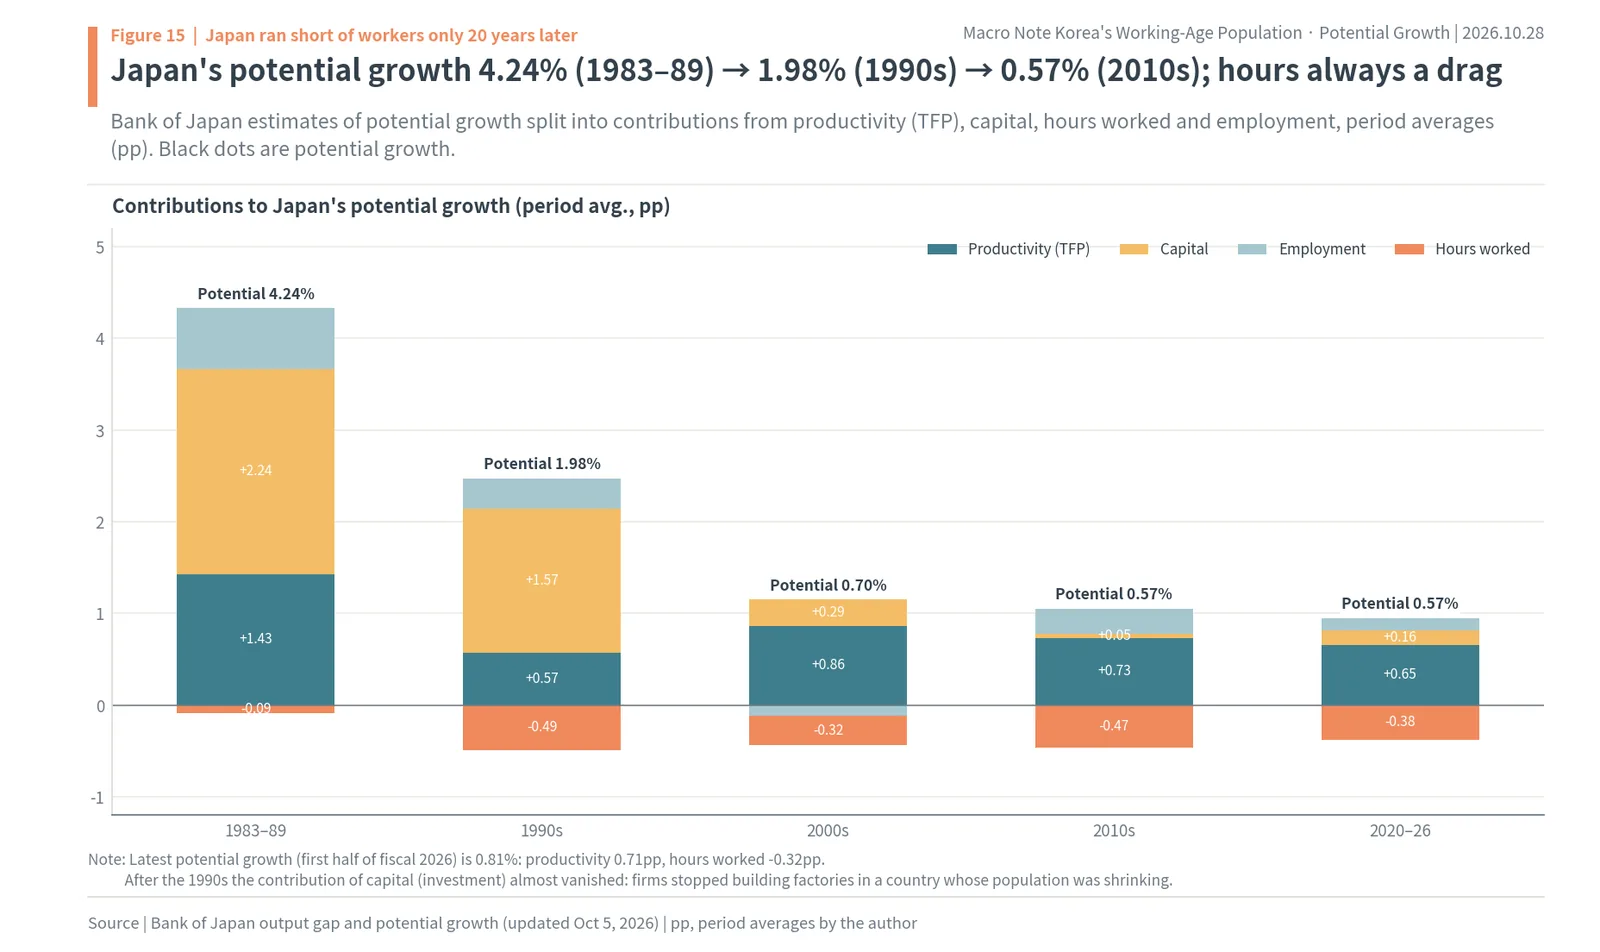
The contribution of hours worked was negative throughout: -0.49pp in the 1990s and -0.47pp in the 2010s, as the population shrank and more people worked short hours. Capital is even more striking. Its contribution, 2.24pp in 1983-89, fell to 0.29pp in the 2000s and 0.05pp in the 2010s: firms stopped building factories in a country with fewer people. What remains is productivity (0.6 to 0.9pp); of Japan’s 0.81% potential growth in the first half of fiscal 2026, productivity accounts for 0.71pp.
The lesson for Korea is clear. When the workforce shrinks, the labor contribution turns negative, the investment contribution shrinks with it, and the floor under growth falls to whatever productivity provides. Korea goes through that decline twice as fast as Japan. So when the floor under growth falls, what happens to the floor under interest rates?
Korea and Japan: what is the same and what differs
The conclusion of this chapter is that Korea is following Japan’s road but differs in three ways: the decline is twice as fast, growth was higher at the start, and debt sits with different owners and the economy depends more on the outside world. So rather than copying Japan’s outcomes, it makes more sense to borrow the order of its chain.
The same: the order of the chain
Japan’s sequence was falling fertility, a peak in the working-age population, falling investment and weak demand, a falling floor under growth and interest rates, a labor shortage 20 years later, and more work by women, older people and foreigners. Korea is in the same sequence. Fertility fell below replacement in 1983, the working-age population peaked in 2019, and potential growth and the real neutral rate are already falling. A record employment rate with people aged 60 and over filling the new jobs also looks like Japan in the 2010s. Just as Japan’s employment of people aged 65 and over rose for 22 straight years to 9.43 million, in Korea employment of people aged 60 and over rose by more than total employment in 2025.
Difference one: speed
Thirty years after its peak Japan’s working-age population had fallen to 82.9; Korea’s falls to 65.9 over the same 30 years. Korea has to make the adjustments to retirement ages, pensions, immigration and automation that Japan made over 30 years in about 15. First-grade enrollment falling below half its 1999 level, and active-duty troops falling by more than 110,000 in six years, are previews of that speed.
Difference two: the starting point and who owes the debt
Japan reached its population peak while firms were cutting investment to repay debts after the bubble burst in the early 1990s: the population factor and the debt factor hit at once. In Korea, households owe more than firms, and house prices are still holding up as the working-age population starts to fall. As the balance sheet recession note in this series showed, Korea’s debt sits with households, so the point where falling population cuts housing demand is where it meets the debt problem. Household numbers rising until 2041 works to delay that meeting.
Difference three: how much is earned abroad
Korea is export-heavy, and sectors that rely on global demand, such as semiconductors, make up a large share of the stock market. A shrinking domestic workforce does not set the sales of companies that earn abroad. In Japan, too, the market’s big gains during 13 years of labor shortage came from companies that earned abroad and companies that raised productivity. This explains both why Korean stocks can rise despite a falling population and why sectors that depend on the domestic population lag. Another difference is that the won is not a reserve currency, so Korean rates are unlikely to stay at zero for long the way Japan’s did.
When people grow fewer and older, the floor under interest rates falls too
The conclusion of this chapter is that aging pulls down the interest rate that neither pushes nor holds back the economy, the neutral rate. On Bank of Korea estimates, Korea’s long-run real neutral rate fell from 1.4% to 3.1% in Q1 2000 to -0.2% to 1.3% in Q1 2024, and the BOK Economic Research Institute calculated that if fertility and life expectancy had stayed at 1991 levels, the 2024 equilibrium real rate would have been 1.4pp higher. Rates rose this year because of inflation; the fall in the floor has not reversed.
Why aging lowers interest rates
An interest rate is the price at which borrowers and lenders meet. With fewer workers, firms build fewer factories and borrow less; the vanishing capital contribution in Japan’s breakdown is exactly that. Meanwhile people preparing for retirement save more, because the longer they expect to live, the longer they must save for life after work. When borrowing demand falls and the supply of savings rises, the price of money, the interest rate, falls. Lower growth also lowers the expected return on investment and works in the same direction.
The Bank of Korea estimated Korea’s long-run real neutral rate with several models in a November 2024 working paper: 1.4% to 3.1% in Q1 2000, -1.1% to 0.5% in Q1 2020 and -0.2% to 1.3% in Q1 2024. A June 2025 report by its Economic Research Institute found that with 1991 fertility and life expectancy the 2024 equilibrium real rate would have been 1.4pp higher, and that successful structural reform would raise real rates and growth by about 1pp a year on average in 2025-2070.

Korea’s real neutral rate: 1.4% to 3.1% (2000) → -0.2% to 1.3% (2024), with aging accounting for 1.4pp
The left side of the chart shows 10-year government bond yields in Korea and Japan. Korea’s 10-year yield fell from 8.25% in 2000 to 1.25% in 2019. Japan’s fell to -0.28% in August 2019, below zero. Rates stuck near zero for more than 20 years after the working-age peak: that is what Japan looked like.
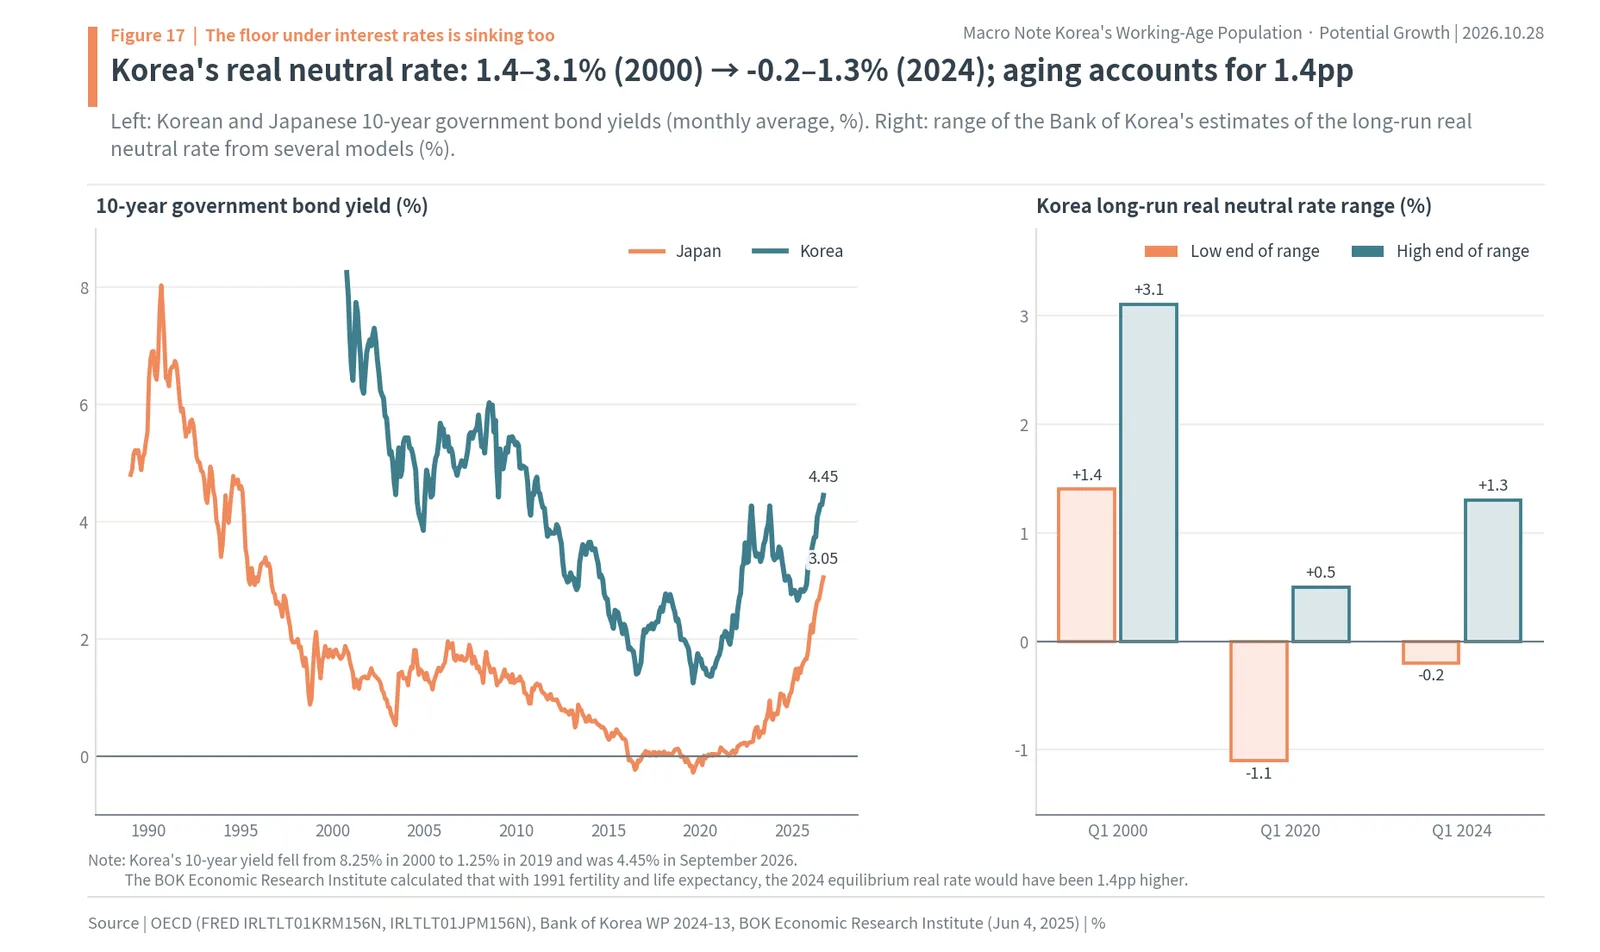
In September 2026 Korea’s 10-year yield was 4.45% and Japan’s 3.05%, both sharply higher. Korea’s base rate rose twice this year, in July and August, to 3.00%, and was held on October 22. The Bank of Korea describes 3.00% as the upper part of its earlier estimated range for the nominal neutral rate (centered around 2.5%) and is re-estimating the neutral rate. The author’s reading is that the current rise in rates reflects inflation and global rates, not a recovery of the floor that population has pushed down.
The difference matters to investors. Rates that rose because of inflation come back down once inflation is under control, and the floor they return to is the one aging has lowered. In Japan that floor was zero. Korea is aging faster than Japan, and the low end of its real neutral rate range has already touched negative territory. A low floor under rates affects banks’ lending margins, insurers’ investment returns and the mortgage rates that support house prices. The next chapter looks at housing and pensions.
What a lower floor under rates means for sectors
When the floor under rates falls, banking gets harder first. Banks earn the gap between deposit and loan rates, and as rates approach zero they cannot cut deposit rates further, so the gap narrows. That is why Japanese bank shares lagged for more than 20 years while rates sat near zero, and beat the market only after rates rose again. Banks also have fewer places to lend: fewer firms want to build factories in a shrinking country, and fewer young households are buying their first home.
Insurers and pension managers have two faces. Their customer base grows, because more people prepare for retirement and older people’s assets grow. But low rates make it harder to earn the returns they have promised. The sharp rise in Korean insurance shares while rates rose recently is a move in that direction; if rates fall again, the pressure reverses.
In a low-rate era, by contrast, companies that pay steady cash and growth stocks valued on distant profits gain, because the discount rate used to turn future profits into today’s value falls. House prices are supported by low rates on the same principle. So the force by which a falling population cuts housing demand and the force by which a lower rate floor supports house prices pull in opposite directions; which wins will differ by region and by when household numbers turn down.
Housing and pensions: households shrink late, the burden grows early
The conclusion of this chapter is that the number of people and the number of households move at different speeds. Population peaked in 2020, but because more people live alone, households keep increasing until 2041. Housing demand turns down 21 years later than the population. The number of older people pensions must support, on the other hand, grows quickly from now.
Households: 21.66 million (2022) → 24.37 million (2041 peak) → 23.28 million (2052)
In the Statistics Korea household projection (December 12, 2024), households rise from 21.66 million in 2022 to a peak of 24.37 million in 2041 and then fall to 23.28 million in 2052. Single-person households rise from 34.1% to 41.3% of the total, and households headed by someone aged 65 or over from 24.1% to 50.6%. Average household size falls from 2.26 to 1.81 people. Households peak in 2038 in Seoul and 2044 in Gyeonggi.
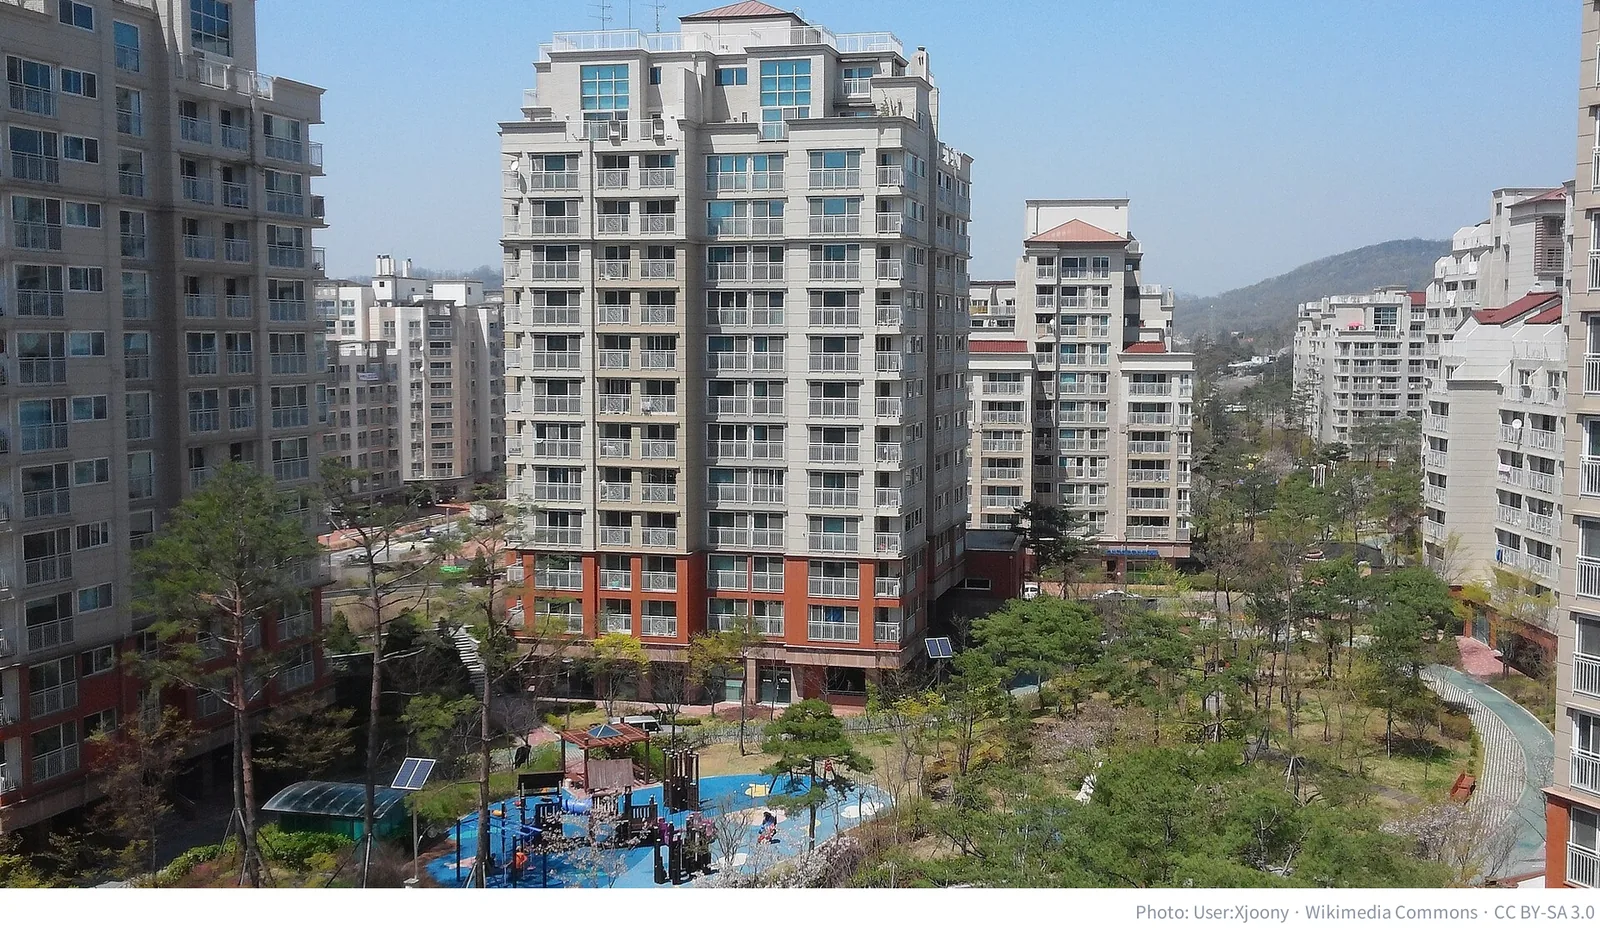
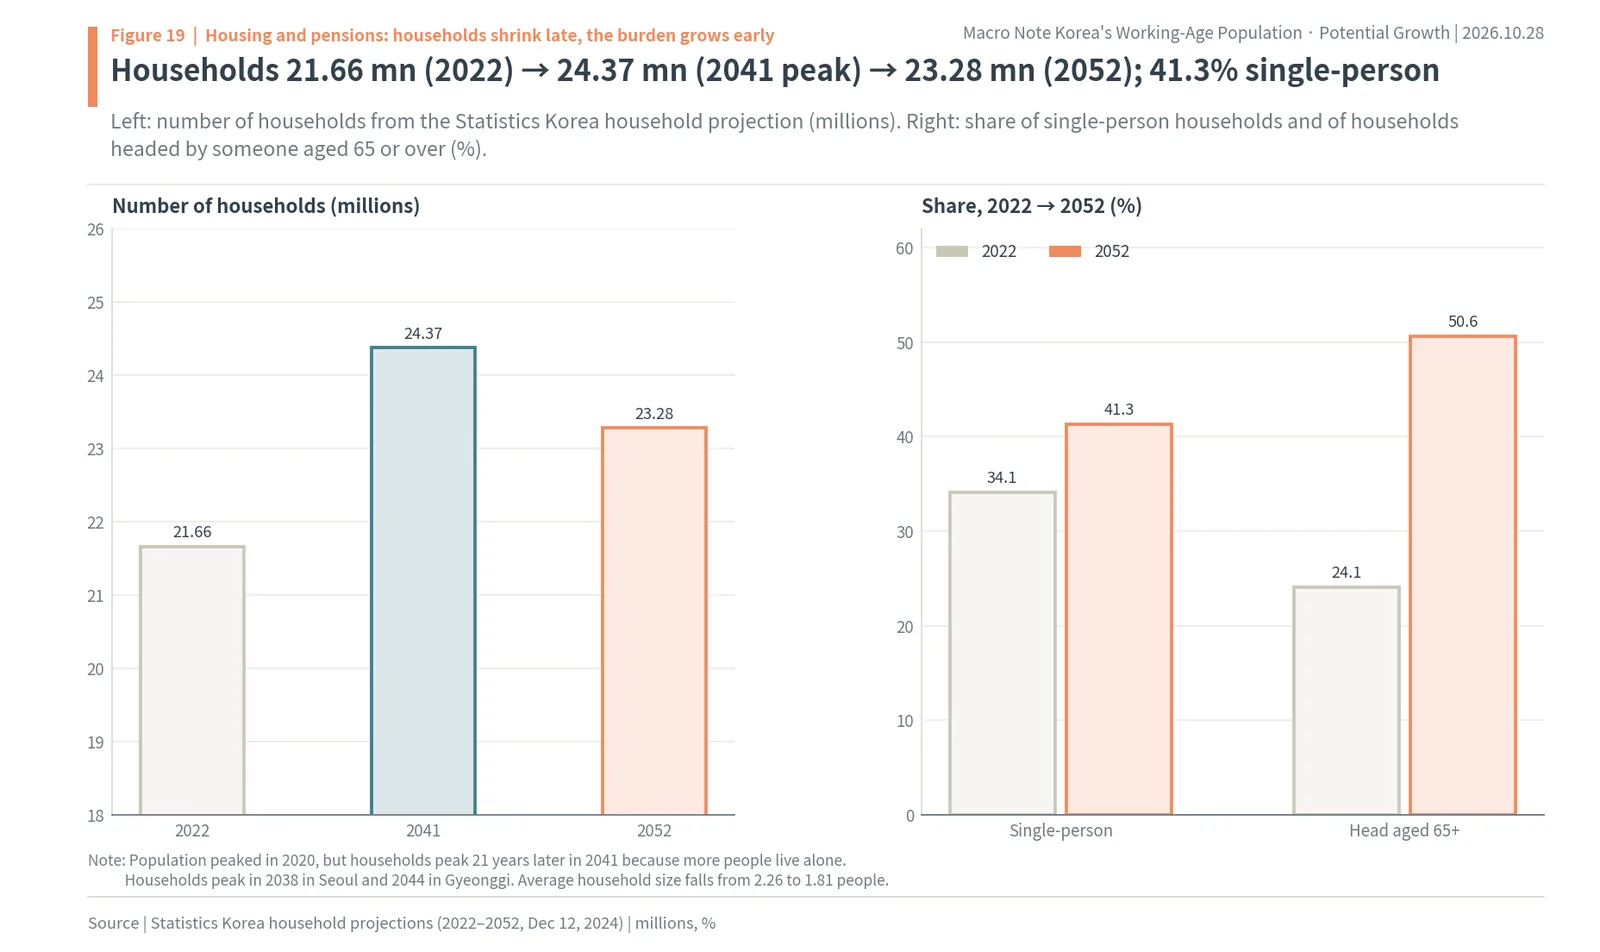
While household numbers grow, total housing demand holds up. But the new households are one- and two-person and older households. Demand shifts toward smaller homes, toward places close to hospitals and transport rather than the outskirts, and toward renting rather than owning. In the 2040s, when household numbers pass their peak, vacant homes rise, starting in the provinces. In Japan, too, empty homes and dying provincial towns spread about 20 years after the working-age peak; in Korea the gap works out to 21 years.
National Pension fund depletion: 2055 → 2064 after reform (2071 if returns are 1pp higher)
A pension system pays retirees out of contributions from workers, so it is the first thing shaken when the workforce shrinks. The 5th actuarial projection in 2023 found that the National Pension fund would run out in 2055. The reform passed by the National Assembly on March 20, 2025 raises the contribution rate from 9% to 13% (from 9.5% in 2026, up 0.5pp a year) and sets the income replacement rate at 43%. The Ministry of Health and Welfare said this parametric reform alone pushes depletion back to 2064, and to 2071 if the fund’s return is 1pp higher.
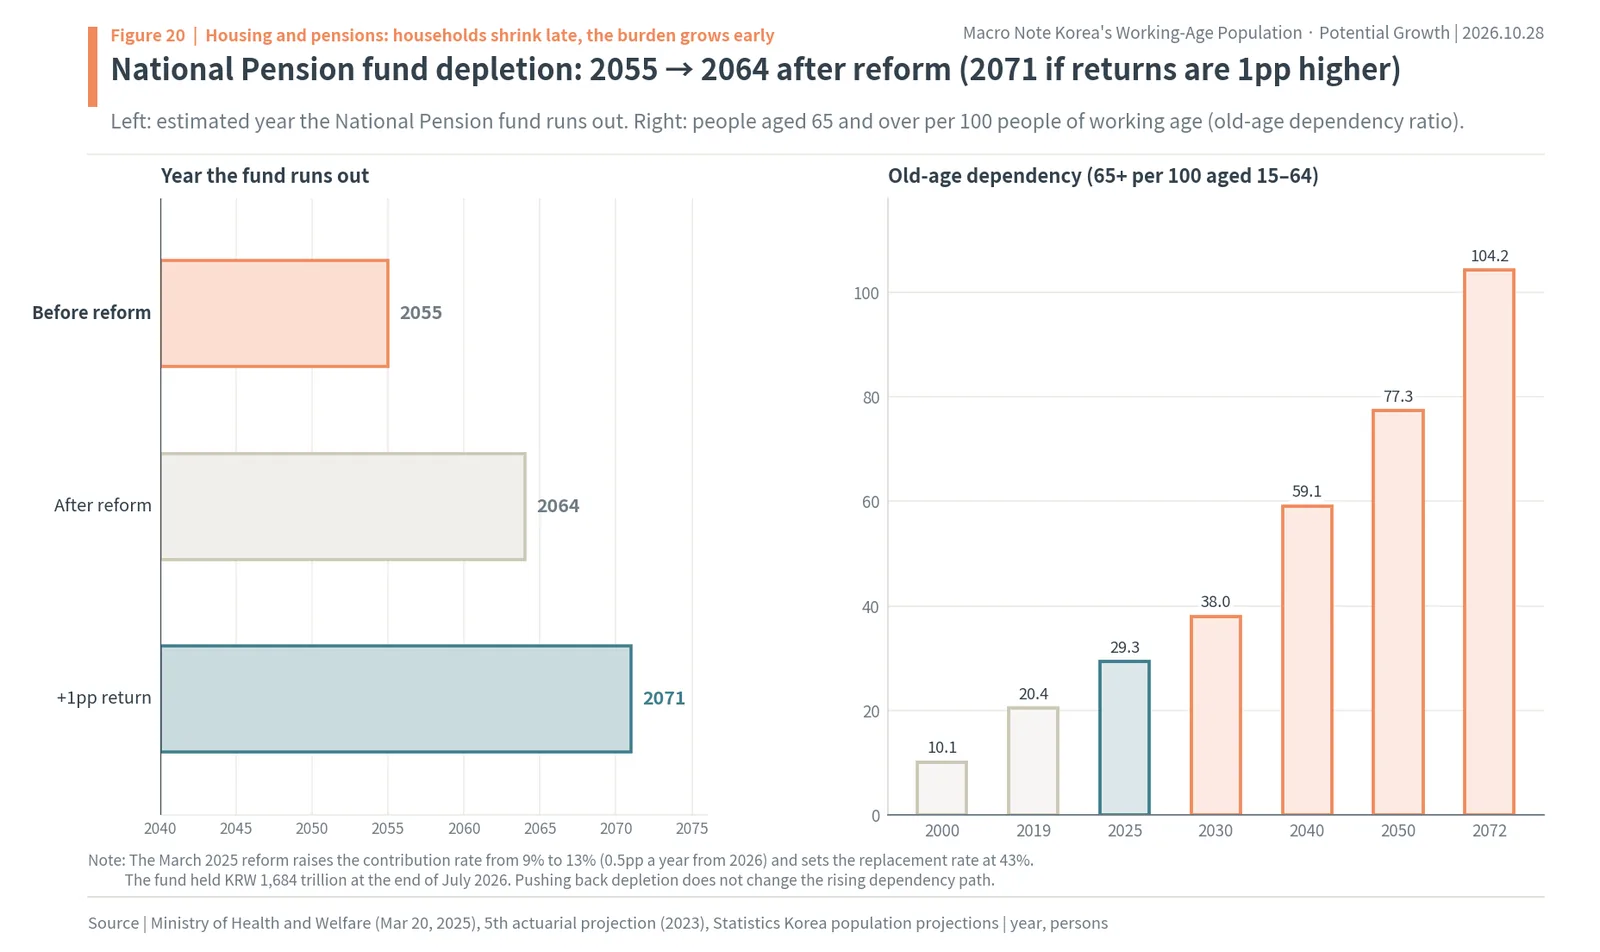
The old-age dependency ratio on the right (people aged 65 and over per 100 aged 15 to 64) goes from 10.1 in 2000, 20.4 in 2019 and 29.3 in 2025 to 38.0 in 2030, 59.1 in 2040, 77.3 in 2050 and 104.2 in 2072. Delaying depletion does not change the path by which each worker supports more older people. The fund held KRW 1,684 trillion (about $1.27 trillion) at the end of July 2026, a large share of it in domestic and foreign shares. While the fund grows it is a big buyer of stocks; once it starts selling assets to pay pensions, it becomes a seller. That point comes when pension payments exceed contribution income plus fund returns.
In short, housing turns down later than the population thanks to household numbers, and the pension burden grows earlier because of dependency. And some places feel the population decline even sooner: schools and the army.
Schools and the army feel it first
The conclusion of this chapter is that population decline passes through each part of society in age order. When births fall, maternity wards and daycare centers feel it first, then schools, then universities and the army, and finally workplaces. Korea is now passing through schools and the army, and the workplace is the next stop.
First-graders: 713,500 in 1999 → 298,200 in 2026 (-58.2%)
On Ministry of Education figures, elementary school entrants fell from 713,500 in 1999 to 468,200 in 2009, 401,800 in 2023 and 324,000 in 2025, and in 2026 dropped below 300,000 for the first time, to 298,200: 58.2% fewer than in 1999. By 2031 they fall further, to 220,500. In 2026, 210 elementary schools have no new pupils at all (press reports). The 254,000 babies born in 2025 equal 69.0% of this year’s four-year university intake of 369,000 (author’s calculation); if capacity stays where it is, about one in three university places will be empty in the 2040s.
Active-duty troops: 563,000 in 2019 → 450,000 in 2025
According to Ministry of National Defense figures submitted to the National Assembly, active-duty personnel fell from 563,000 in 2019 to 450,000 in July 2025, a drop of more than 110,000 in six years; the ministry described it as “50,000 short of the 500,000 required.” In 2012 there were 639,000. The Korea Institute for Defense Analyses (KIDA) projects 396,000 in 2038, below 400,000 (press reports). Army enlisted soldiers fell from 303,000 to 205,000.
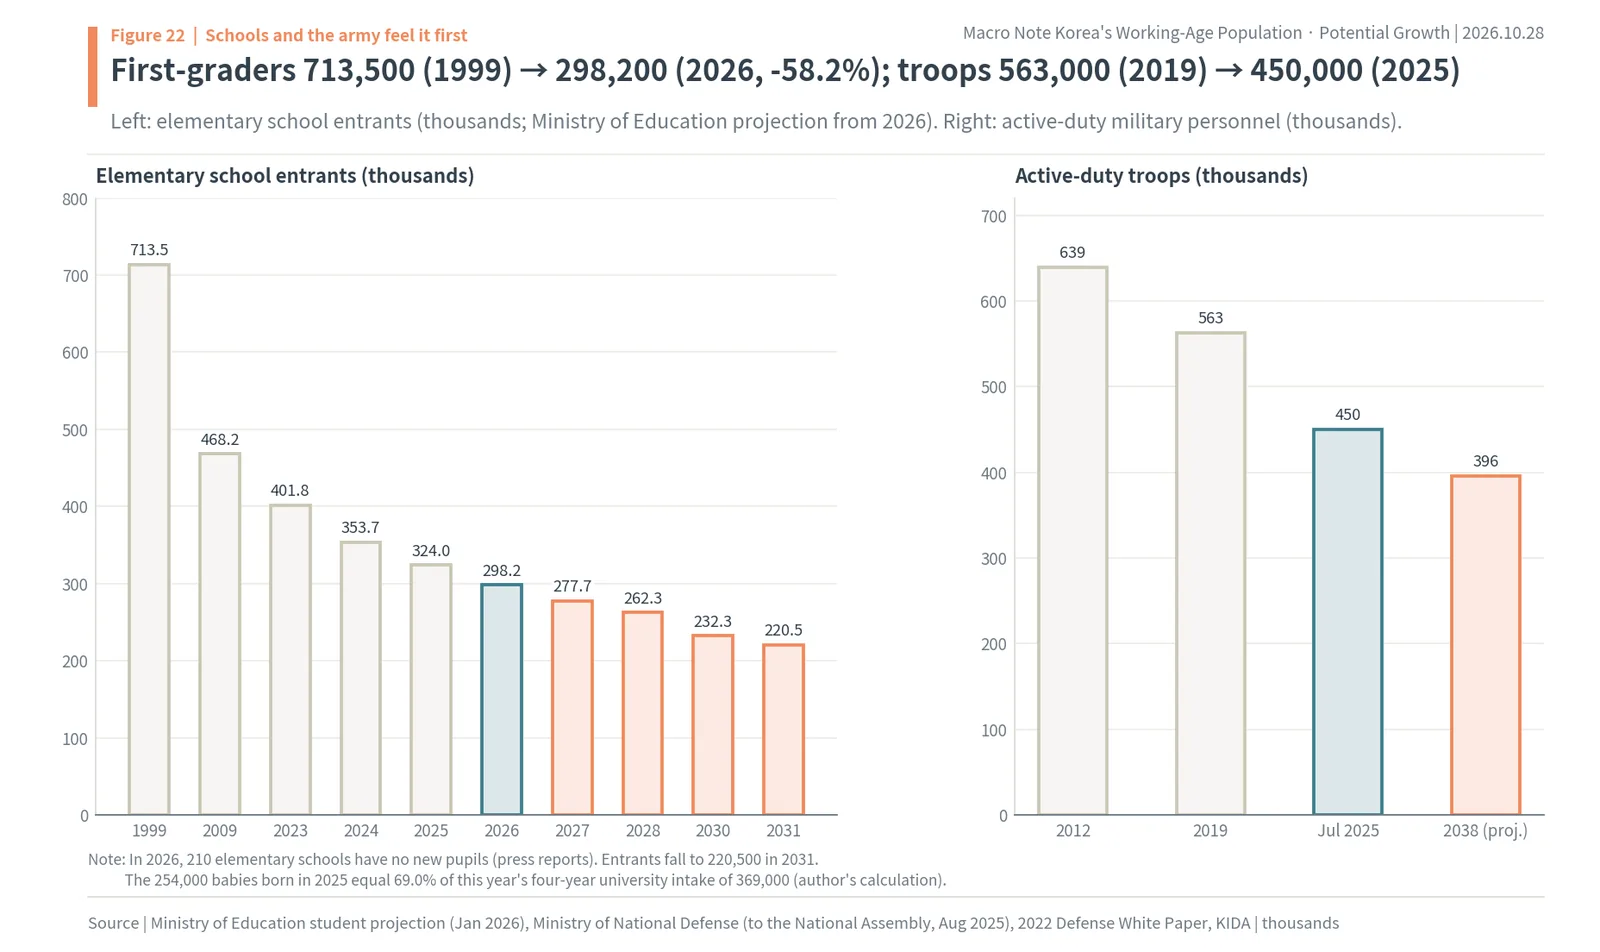
The school and army numbers show in advance what will happen in the workplace. When today’s 300,000 first-graders reach working age in the 2040s, the number of people entering the workforce each year will be about half today’s. Schools are responding with mergers, the army with automated weapons and changes to service. Workplaces face the same choices: use fewer people, bring people in from elsewhere, or shrink the business. Those choices differ by industry, and the differences show up in share prices.
Universities are the last gate between school and work, so their changes reach local economies directly. When a provincial university loses students, studio rentals, restaurants and bus routes in its town shrink with it, and when graduates leave for the Seoul area, that town’s working-age population falls again. That is why the fall in school-age population shows up first and hardest in the provinces, and why household numbers peak at different times in Seoul (2038) and Gyeonggi (2044). In a country running out of workers, people do not decline evenly; they gather where jobs and schools are, and the rest of the country shrinks faster.
Changes in the army reach industry the same way. With fewer troops, maintaining the same defense capability means spending more on unmanned systems, surveillance equipment and automated weapons instead of people. The principle that machines and software are in greater demand wherever people are scarce works the same way in factories, hospitals and warehouses.
Policy turned 40 years late, and today it is buying time
The conclusion of this chapter is that population policy has always followed changes in fertility far behind, and that today’s policies are closer to buying time than to reversing the decline. Policy can reach four things: births, the share of people who work and for how long, foreign workers, and productivity. Only the last three can change the numbers to 2040.
Twenty-two years from restraint to encouragement
According to the National Archives chronology, Korea made family planning a national policy in 1961 and in 1983 was still pushing extra health insurance charges from the third child. Fertility fell below replacement that same year, at 2.06, but the government gave up birth restraint only 13 years later, with the 1996 New Population Policy. It turned to encouraging births with the 2005 framework act on low fertility and aging, and the first basic plan came in 2006. Twenty-two years passed between fertility falling below replacement and the switch to encouragement. The generation not born in those years is the generation not entering the workplace today.
The levers today
The share of people who work, and for how long, has already moved a lot: the employment rate for ages 15 to 64 is at a record, and that for ages 55 to 64 is above 70%. The next step is adjusting the retirement age and the pension age; the 2025 reform changed contributions and the replacement rate. Foreign worker quotas are set every year and rise and fall with the economy and politics; cutting the 2026 E-9 quota to 80,000 raises costs for industries short of workers. Productivity depends on regulation, the structure of the labor market, corporate investment and the adoption of AI. The Bank of Korea and the IMF both name productivity as the biggest lever because it alone raises output per person regardless of how many people work.
Three paths for the 2030s
The numbers in this report suggest three paths for the 2030s. The baseline is the Bank of Korea’s projection, with potential growth falling to 1.3% in 2030-34 and 1.1% in 2035-39. The bad path is KDI’s pessimistic scenario with weaker productivity: 0.4% in 2031-40 and -0.3% in 2041-50. The good path is the Bank of Korea’s productivity scenario, which keeps potential growth at 1.3% even in the late 2040s and at 1.8% in the early 2030s. None of the paths returns to 2%; they differ by about 1pp. Compounded over 30 years, that 1pp makes the economy more than a third larger or smaller (author’s calculation: 1.01 to the 30th power).
For investors, these three paths say that the expected return on investments that rely on the growth of the Korean economy as a whole is falling. When the whole domestic economy was growing, sales rose in almost every sector; with a baseline around 1%, share prices are decided by the difference between sectors with growing and shrinking customer numbers, and between firms that use fewer people and those that need more. The next chapter looks at how that difference actually played out in the Japanese and Korean markets.
Stocks: winners were firms that earn more with fewer people and firms that connect scarce workers
The conclusion of this chapter is that in a country running out of workers, the fortunes of sectors diverge sharply. In Japan, over the 13 years from end-2012 when the labor shortage became clear, firms that find scarce workers and firms that sell automation sensors beat the market by a wide margin, while robot makers and domestic businesses such as housing and railways lagged. In Korea, companies that depend on the number of children and households have already fallen to about a fifth of their value in ten years.
Japan, 13 years of labor shortage (end-2012 → Sep 2026): Dip +3,525%, Nikkei +542%, Fanuc +87%
On Yahoo Finance month-end closes from December 2012 to September 2026 (excluding dividends), the Nikkei 225 rose 542%. Job-ad company Dip rose the most, +3,525%, followed by Keyence, which sells factory automation sensors (+1,249%), SMS, which matches nurses and care workers to jobs (+1,151%), and staffing company Persol (+695%). Recruit has risen 1,192% since its listing in November 2014. Mitsubishi UFJ, a bank, beat the market at +703%, much of it after rates rose again from 2024.
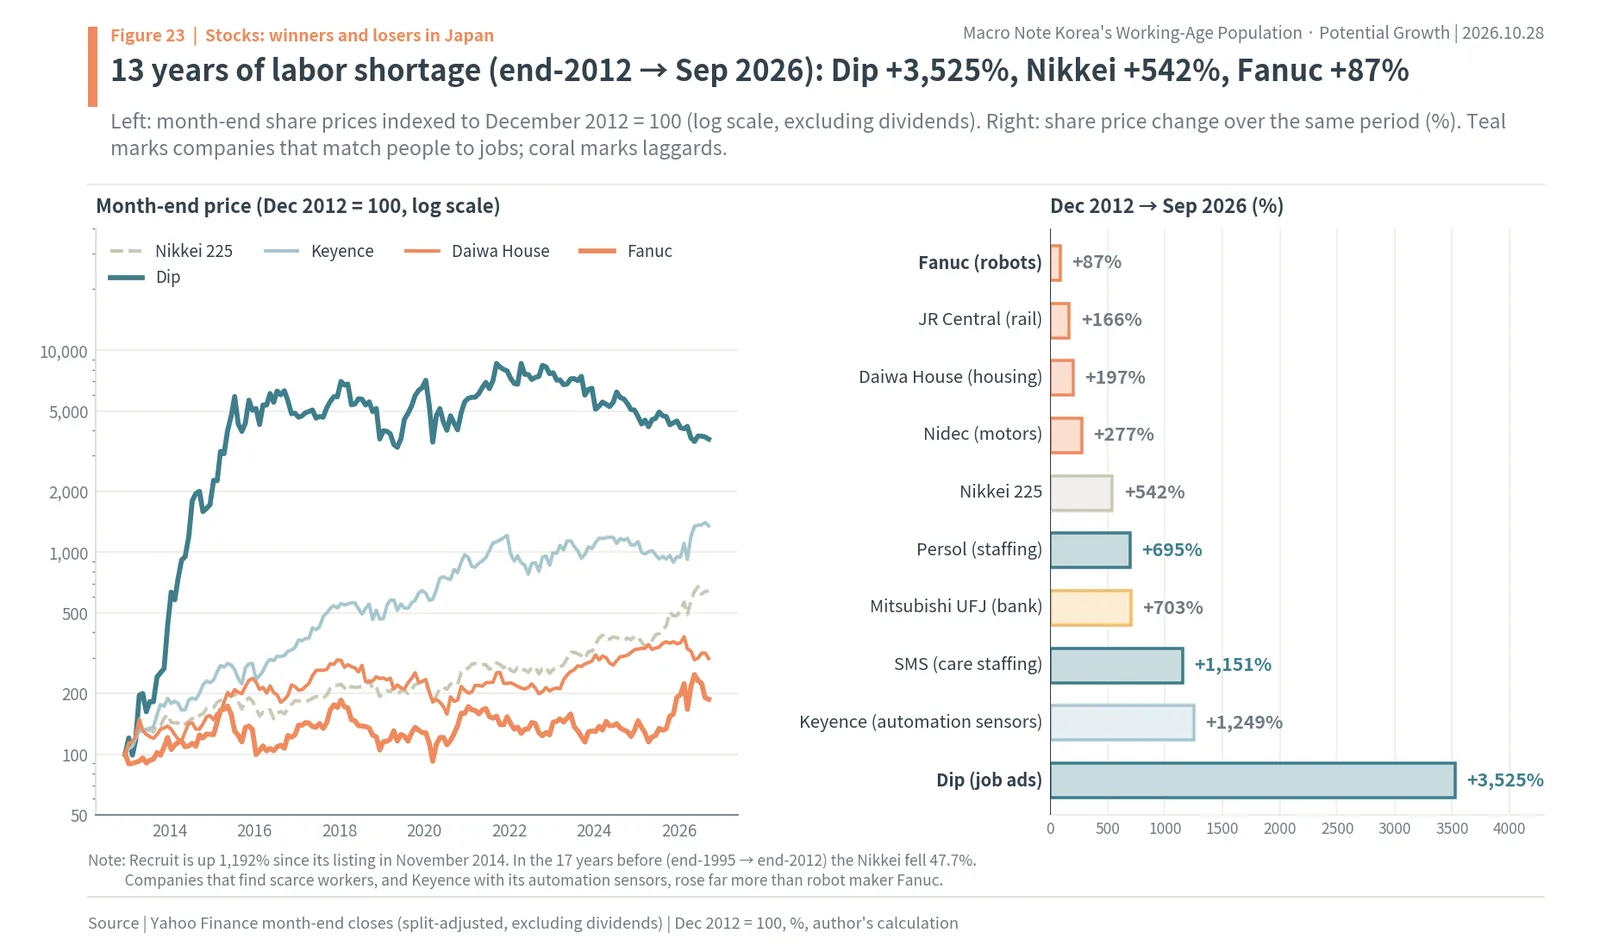
By contrast, industrial robot maker Fanuc rose 87%, motor maker Nidec 277%, homebuilder Daiwa House 197% and railway operator JR Central 166%, all behind the market. Contrary to the simple idea that “robots replace missing workers,” the firms that find scarce people and the firms that sell high-margin automation parts earned far more than the robot makers. Robots are equipment whose orders swing with the economy and with Chinese investment, while connecting people to jobs is a business whose fees pile up steadily as workers grow scarcer. For reference, over the 17 years before (end-1995 → end-2012) the Nikkei fell 47.7%. While the working-age population began shrinking and demand was short, the whole market fell; once workers became scarce, it rose.
Korea, Jan 2016 → Sep 2026: Kleannara -78.9%, Hanssem -85.6% vs KOSPI +257.6%
In Korea the same method was applied from January 2016 to September 2026. The KOSPI rose 257.6%. Diaper maker Kleannara fell 78.9% and furniture and interiors company Hanssem fell 85.6%, moving opposite to the market. These are companies whose sales feel fewer children, fewer marriages and fewer house moves directly. Tutoring company MegaStudyEdu rose 217.2% over the whole period but is down 11.4% since January 2021, flat over the last five years as falling student numbers began to bite.
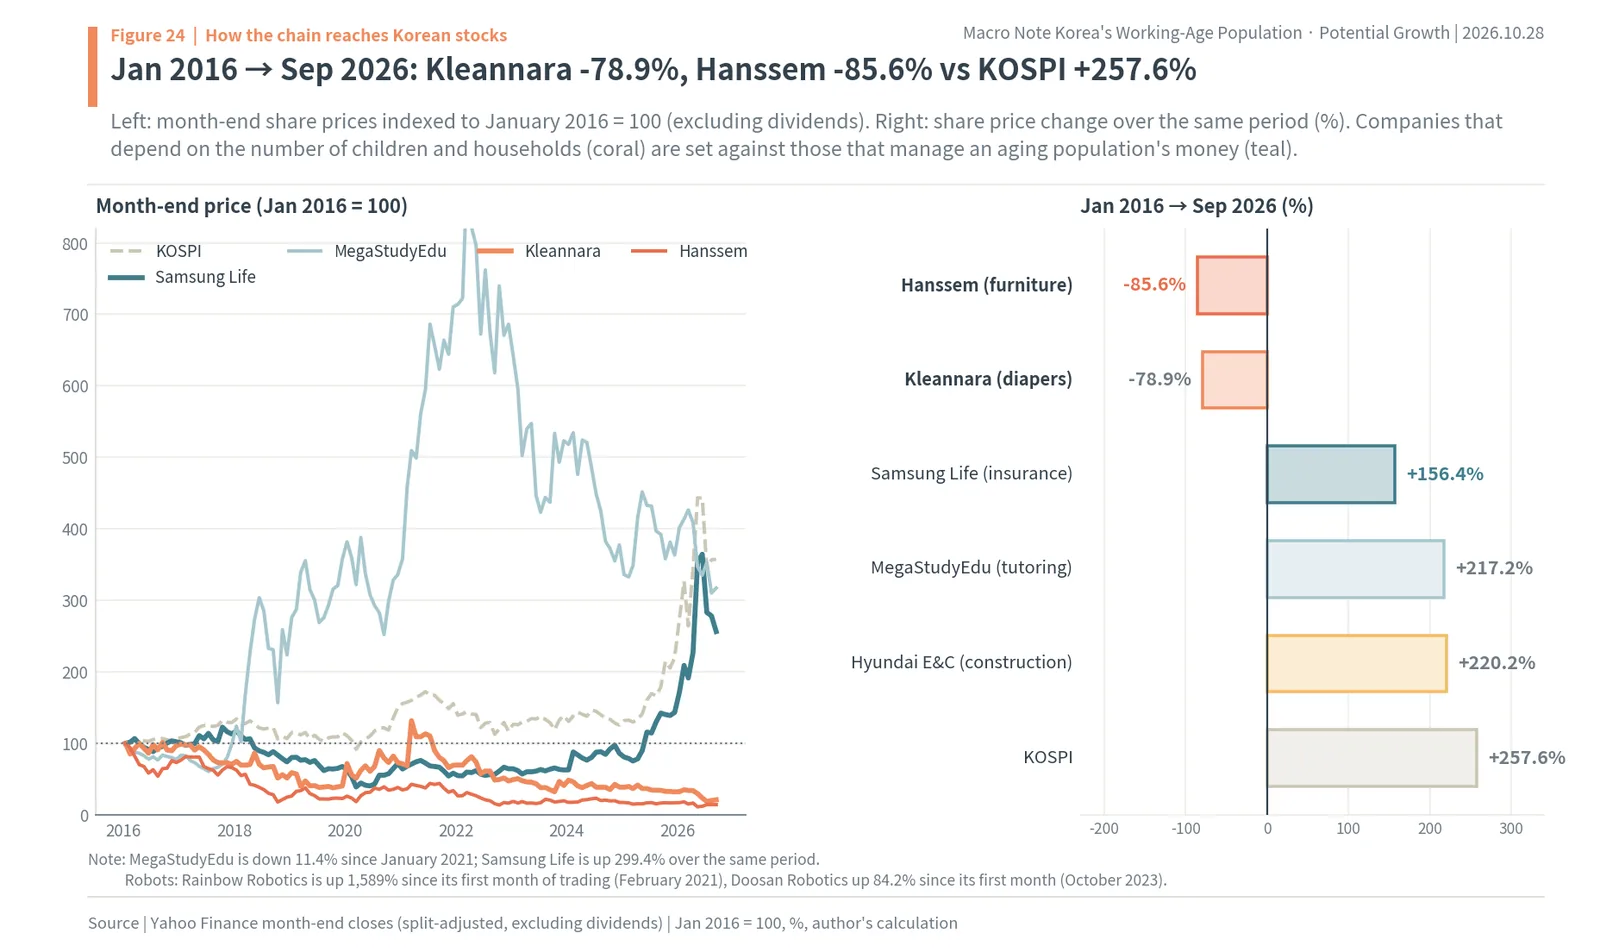
Companies that manage an aging population’s money did differently. Insurer Samsung Life rose 156.4% from 2016 and 299.4% since January 2021, helped by both rising rates and the growing assets of older people. Robot makers also rose sharply: Rainbow Robotics is up 1,589% from its first month of trading (February 2021) and Doosan Robotics up 84.2% from its first month (October 2023). But as Japan’s Fanuc shows, robot makers’ shares swing widely with expectations and orders. Hyundai E&C (+220.2%) is hard to explain by population alone, since nuclear and overseas projects matter more to it than housing.
A sector map: where population sets the number of customers and where it does not
The first question in sorting sectors is “Does Korea’s population decide how many customers this company has?” Baby products, study materials, tutoring, weddings, furniture, provincial retail and provincial bank branches all have customer numbers set by Korea’s population, especially its young population. As we saw, first-grade entrants are fewer than half their 1999 level, and employment of people in their 20s fell by 170,000 in 2025 alone. Unless such businesses raise prices or sales per customer, their revenue falls; Kleannara’s and Hanssem’s ten years are the result.
Some places, by contrast, gain customers. The population aged 65 and over grows from 10.51 million in 2025 to 17.15 million in 2040 (government projection). Insurance, pensions and asset management, medicine and long-term care, and consumer goods used by older people belong here. That Japan’s SMS, which supplies care workers, beat the market so widely is the result of customers and labor shortages growing at the same time.
The third group is businesses whose customer numbers Korea’s population does not set. In export sectors such as semiconductors, shipbuilding, defense and autos, global demand rather than domestic population sets sales. But these firms still have to hire factory workers from Korea’s population, so automation, foreign workers and overseas plants become the variables that set costs and capacity. The world’s highest robot density and an E-9 quota that changes every year go straight into these industries’ cost sheets.
How the chain reaches Korean stocks and your account
Translated into a portfolio, the chain splits three ways. First, companies that rely on the number of children, students, newlyweds and house moves (baby products, study materials and tutoring, weddings, furniture, provincial retail) face a decline whose size is already fixed. Second, companies that look after older people and their money (insurance, pensions and asset management, medical devices and care, consumption by older people) gain customers as the population ages. Third, companies that earn more with fewer people (automation parts and software, staffing and job-matching platforms) see demand grow as the labor shortage deepens. Japan’s experience is that within this third group, firms that connect people and high-margin parts makers won for longer than equipment makers.

The falling floor under rates also needs to be part of the picture. While rates stay low, companies with steady dividends and growth stocks gain value, and banks that depend on lending margins lose out. Japanese bank shares lagged for a long time while rates sat at zero and beat the market widely only after rates rose again from 2024. If Korea’s current rise in rates is driven by inflation, the floor rates fall back to once inflation is tamed is the low level set by an aging, older society, and that belongs in how an account is built.
The author’s view: the floor is already set, and what can change is output per person
The author believes it is close to a settled fact that the floor under Korea’s growth and interest rates will keep falling over the next 15 years. Everyone who will enter working age before 2040 has been born, and on the government projection the working-age population in 2040 will be 22.9% smaller than in 2019. Korea goes through in about half the time the decline Japan went through over 30 years. The Bank of Korea’s expectation that potential growth falls from 2.0% to 0.6-0.7% in the 2040s comes from the same arithmetic.
What can change is output per person. On the Bank of Korea’s estimates, better productivity would raise potential growth in the late 2040s by 0.7pp, and the IMF judged that reallocation and AI could more than offset aging. The approach of holding on through a higher employment rate and more work by older people has been used heavily, robot density is already the world’s highest, and politics sets the foreign worker quota each year. So how fast this chain moves will be shown by productivity and foreign worker policy over the next few years, and by the Bank of Korea’s new potential growth estimate that will reflect them.
Eight indicators the author watches
The author watches eight indicators. ① Birth growth speaks to the size of the workforce in the 2040s; ②-④ (the 15-64 employment rate, employment of people in their 20s and the E-9 foreign worker quota) to today’s labor supply; ⑤-⑦ (potential growth, the base rate and the 10-year Korean Treasury Bond yield) to the floor under growth and rates; and ⑧ the labor shortage rate to the gaps firms actually feel.
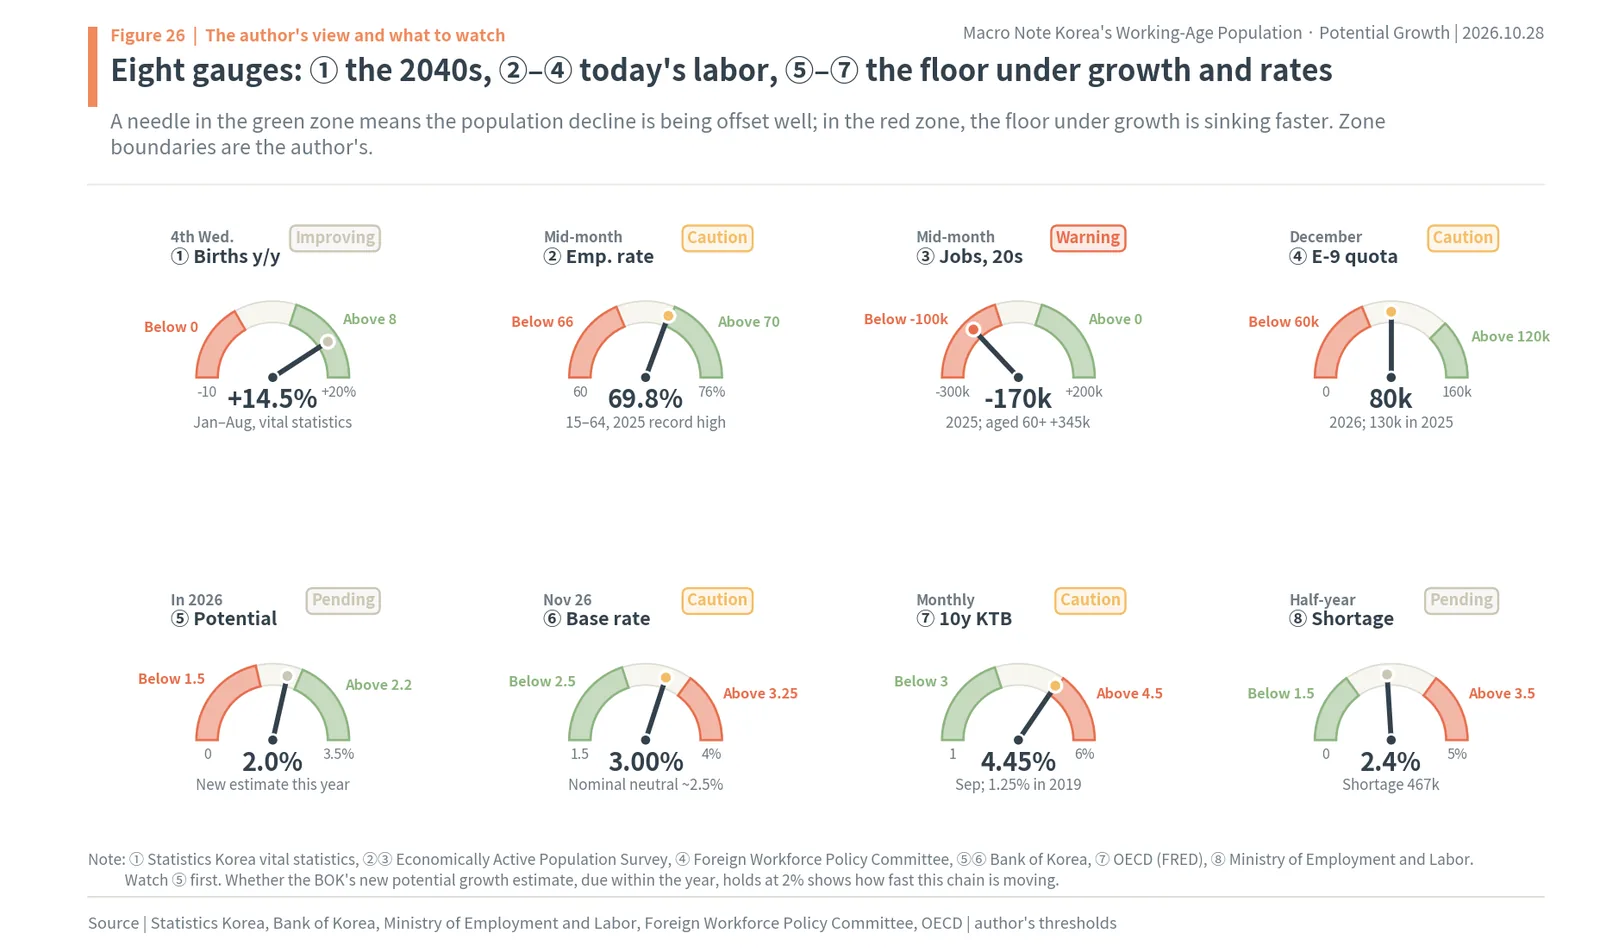
Watch ⑤ first. Whether the new potential growth estimate the Bank of Korea publishes within the year holds at 2% or drops below it will show how fast this chain is moving. The nearest dates are the monthly vital statistics (births) around the fourth Wednesday of each month, the monthly employment report in mid-month, the Bank of Korea rate decision on November 26, and the Foreign Workforce Policy Committee’s decision on the 2027 E-9 quota in December. The 2026 Defense White Paper is also due in December.
Frequently asked questions
If fertility rises, does the chain change?
Not before 2040. The people who turn 15 in 2040 were born in 2025, and everyone older has already been born. A fertility rebound starts to reach the workplace only from the late 2040s. The Bank of Korea calculated that higher fertility would raise potential growth in the 2040s by 0.1-0.2pp: meaningful, but smaller than the productivity effect (0.7pp) and with a longer lag.
When the workforce shrinks, doesn’t unemployment fall and wages rise?
In the long run workers become scarce, but in Japan demand fell first. After Japan’s working-age population peaked, unemployment rose for seven years, from 3.2% to 5.4%, and a labor shortage became clear only about 20 years later, in 2014. Even then real wages did not rise. Korea’s faster decline may shorten this lag, but a labor shortage does not automatically mean higher wages for everyone.
Do house prices fall when the population falls?
Household numbers keep rising until 2041, so total housing demand turns down later than the population. But the new households are one- and two-person and older households, so the shape of demand changes, and the peak differs by region: 2038 in Seoul and 2044 in Gyeonggi. Vacant homes rise earlier in the provinces. A lower floor under rates works to support house prices.
Will rates go to zero as in Japan?
The low end of the Bank of Korea’s estimated range for the real neutral rate is already negative (-0.2%). In Japan rates stayed near zero for more than 20 years after the working-age peak. Some argue, though, that because the won is not a reserve currency and foreign money plays a large role, Korean rates cannot stay at zero for long the way Japan’s did. This report’s judgment is that the floor under rates is falling; the level of rates right now is set by inflation and global rates.
Basis of calculation and data
This chapter explains where the numbers in this report come from and how they were calculated. All of the author’s calculations were done in one calculation script, and the charts and text use only its results. Raw data were downloaded on October 28, 2026.
Population figures are Statistics Korea’s population projection (2022-2072, released December 14, 2023, medium scenario), downloaded by single year of age from KOSIS and summed into the 15-64 and 65-and-over groups. The 2072 old-age dependency ratio of 104.2, total population of 36.22 million and working-age population of 16.58 million match the press release. Values for 2023-2025 are also projections, so they differ slightly from the 2025 register-based census (35.87 million aged 15-64). The peak year is 2019 on the government projection and 2018 on World Bank data (based on UN estimates); the text follows the government projection. The cross-country chart indexes the World Bank WDI (updated October 8, 2026) 15-64 population to each country’s peak year = 100. On that source Japan peaked at 87.46 million and stood at 72.50 million in 2025, slightly different in basis from the 87.26 million (land ministry) and 73.529 million (Statistics Bureau) used in the text.
Births and fertility are Statistics Korea birth statistics (e-Nara Index 1428, updated September 28, 2026), with 2026 monthly values checked against reports of the October 28 vital statistics release. Potential growth is from the tables of BOK Issue Note No. 2024-33; the KDI projections are as reported in the press and may differ from the original tables. Ten-year averages of actual growth are simple averages of World Bank real GDP growth. Japan’s period averages and contributions to potential growth are the author’s averages of the Bank of Japan’s half-yearly data updated on October 5, 2026 (with the estimation method revised in March 2026).
Employment data are Statistics Korea’s Economically Active Population Survey (e-Nara Index 1494, 1496, 1497). The roughly 2.98 million additional workers attributed to the higher employment rate is the author’s calculation: the 2025 projected population aged 15-64 times the difference between the 2000 and 2025 employment rates. Japan’s unemployment rate and job openings-to-applicants ratio are JILPT long-term labor statistics, and real wages come from the Monthly Labour Survey (2020 = 100); the 2024 value follows a sample revision and does not link to earlier years, so the series stops at 2023. The 0.13pp for higher participation in the IMF chart is the author’s conversion of “about one-fifth of the aging drag” into a number.
Interest rates are 10-year government bond yields (monthly averages) from OECD series on FRED and the range in Bank of Korea working paper 2024-13. Share prices are Yahoo Finance month-end closes (split-adjusted, excluding dividends), and returns run from the starting month’s close to the end-September 2026 close. The USD/KRW rate is KRW 1,324.77 per dollar on October 27, 2026. Quotations from Korean sources are the author’s translations.
Maochaedung’s take. Korea’s shortage of children began in 1983, and it is now arriving at the workplace. The working-age population peaked at 37.6 million in 2019 and falls to 29.0 million by 2040, twice as fast as Japan’s decline, so the Bank of Korea sees potential growth sliding from 2.0% to 0.6%. So far a record employment rate, older workers, women, foreigners and the world’s densest robot use have filled the gap, but those tools are running out. Japan’s precedent says weak demand comes before labor shortages and that real wages need not rise; the floor under interest rates falls with growth. In the stock market the winners were the firms that connect scarce workers and earn more with fewer people, and the losers were businesses that count on more children and households.
Korea’s shrinking working-age population: quick answers
Q. If Korea’s fertility rate rises, does the decline in the workforce change?
Not before 2040. Everyone who turns 15 by 2040 has already been born, so a rebound in births reaches the workplace only from the late 2040s. The Bank of Korea calculated that higher fertility would raise potential growth in the 2040s by 0.1 to 0.2 percentage points, less than the 0.7 points from better productivity.
Q. When the workforce shrinks, doesn’t unemployment fall and wages rise?
Japan’s experience says demand falls first. After its working-age population peaked in 1995, unemployment rose from 3.2% to 5.4%, the job openings-to-applicants ratio passed 1 only in 2014, and real wages fell 16.7% from 1996 to 2023.
Q. Do Korean house prices fall when the population falls?
Not right away. Because more people live alone, the number of households keeps rising until 2041 (2038 in Seoul, 2044 in Gyeonggi) even though the population peaked in 2020. Demand shifts toward smaller homes and older households, vacant homes rise first in the provinces, and a lower floor under interest rates supports prices.
Q. Will Korean interest rates go to zero as in Japan?
The low end of the Bank of Korea’s range for the real neutral rate is already -0.2%, and aging accounts for about 1.4 percentage points of the fall. Rates rose in 2026 because of inflation, but the floor they return to is lower. Because the won is not a reserve currency, Korean rates are unlikely to stay at zero for as long as Japan’s did.
Sources
- National Archives of Korea, “50 Years of Population Policy” chronology and slogans (link)
- Statistics Korea birth statistics (e-Nara Index 1428, https://www.index.go.kr/unity/potal/main/EachDtlPageDetail.do?idx_cd=1428), updated Sep 28, 2026; August 2026 vital statistics (Financial News, https://www.fnnews.com/news/202610281109055074), Oct 28, 2026
- Statistics Korea population projections 2022-2072 (link), Dec 14, 2023; KOSIS; 2025 register-based census (Kyunghyang Shinmun, https://www.khan.co.kr/article/202607281341001/amp), Jul 28, 2026
- Bank of Korea, BOK Issue Note No. 2024-33 on potential growth (link), Dec 19, 2024; Bank of Korea, report on ultra-low fertility and a super-aged society (link), Dec 3, 2023
- KDI potential growth outlook (Segye Ilbo, https://www.segye.com/newsView/20250508510191), May 8, 2025; IMF Country Focus, “Korea’s Rapid Aging Doesn’t Have to Be Economic Destiny” (link), Apr 3, 2025; World Bank WDI, updated Oct 8, 2026; Bank of Japan output gap and potential growth (link), updated Oct 5, 2026
- Statistics Korea Economically Active Population Survey (e-Nara Index 1494, 1496, 1497); 2025 survey of immigrants’ residence and employment, Dec 18, 2025; Ministry of Employment and Labor occupational labor force survey, Jun 30, 2026; Foreign Workforce Policy Committee, Dec 22, 2025; IFR World Robotics 2025 (link), Apr 8, 2026
- JILPT long-term labor statistics (link); Ministry of Health, Labour and Welfare Monthly Labour Survey and foreign employment status (link), Jan 30, 2026; Statistics Bureau of Japan population estimates (link), Mar 19, 2026
- Bank of Korea Working Paper 2024-13 (link), Nov 3, 2024; BOK Economic Research Institute (Aju Business Daily, https://www.ajunews.com/view/20250604104518942), Jun 4, 2025; FRED IRLTLT01KRM156N and IRLTLT01JPM156N; base rate decision (Kyunghyang Shinmun, https://khan.co.kr/article/202610220950001), Oct 22, 2026
- Statistics Korea household projections (Newsis, https://mobile.newsis.com/view/NISX20241212_0002993974), Dec 12, 2024; National Pension reform (YTN, https://www.ytn.co.kr/_ln/0101_202503202150374299), Mar 20, 2025; Ministry of Education student projections (SBS Biz, https://biz.sbs.co.kr/amp/article/20000284389), Jan 13, 2026; active-duty troops (Herald Economy, https://www.heraldk.com/article/2025080915224798154), Aug 9, 2025
- Yahoo Finance month-end closes (Dec 2012 to Sep 2026)
- Photos: Korea Copyright Commission (CC BY 4.0), Sgroey (CC BY-SA 4.0), Anonyme (CC BY 2.5), KUKA Roboter (public domain), Wvdp (CC0), public domain, Xjoony (CC BY-SA 3.0), watchsmart (CC BY 2.0), Tristan Surtel (CC BY-SA 4.0), via Wikimedia Commons
Was this note useful?
Thanks. Your answer helps decide what to cover next.
Korea market snapshot · Oct 28, 2026
New to Korean stocks? Start here for the basics.
Most read lately
Get the Saturday note on Korean stocks
One email every Saturday with the week’s new research on Korean listed companies and links to the updated data pages. Built from DART filings and KRX data. Free; unsubscribe in one click. See past issues