Korean Steel Stocks and China’s Shorter Working Hours: China Cuts Steel First, and a 1% Price Rise Is 18.3% of Dongkuk CM’s (460850.KS) Market Cap
A China that works less is making less steel, and Korean steel stocks have not priced it in. Weekly working hours of China’s enterprise employees turned down after nine years of gains, and the March to August average fell from 48.70 hours in 2023 to 48.15 hours in 2026. This report follows the chain from falling hours to factories running less, China’s steel output and export cuts, Korea’s anti-dumping wall and higher domestic prices, compares it with the 2016 supply-side reform, and ranks eight Korean steel stocks by what a 1% price rise is worth against market cap. Numbers as of October 14, 2026.
- China’s weekly working hours were 0.3 to 0.4 hours below a year earlier in every month from March to August 2026; the March to August average fell from 48.70 hours in 2023 to 48.15 in 2026, and this year’s drop is 2.0x last year’s.
- Factories running less cut steel first: Q2 steel utilization 77.6% (3.2pp below a year earlier), crude steel -3.1% and steel exports -3.0% in January to August, only 7.79% of 247 mills profitable, and a CISA output-cut pledge on September 15.
- Korea’s anti-dumping duties of 22% to 34% on Chinese plate, hot-rolled, coated and color sheet and special steel bars cut first-half hot-rolled imports 32.8%, and domestic prices rose (rebar +20.4%, hot-rolled +10.8%).
- In the 2016 supply-side reform, six Korean steel stocks rose 43.3% in 313 trading days vs the KOSPI‘s 4.3%; in the 313 trading days since July 1, 2025, eight steel stocks are up only 5.9% vs the KOSPI’s 94.5%.
- A 1% price rise equals 18.3% of Dongkuk CM’s market cap, 7.2% of Dongkuk Steel’s and 6.0% of Hyundai Steel’s (104% of its 2025 operating profit), and their shares are down 21.9%, 7.2% and 5.8%. Next checks: China’s September data in late October and the coated and color sheet final ruling in October.
Key takeaways
- Weekly working hours of China’s enterprise employees, as reported by the National Bureau of Statistics, were 0.3 to 0.4 hours shorter than a year earlier in every month from March to August 2026. The March to August average came down from 48.70 hours in 2023 to 48.15 hours in 2026, and this year’s drop is 2.0 times last year’s. Over the same period China’s steel utilization fell to 77.6% in the second quarter, 3.2 percentage points below a year earlier, and crude steel output was down 3.1% in January to August.
- During the 2016 supply-side reform, an equal-weight basket of six Korean steel stocks rose 43.3% in 313 trading days, far ahead of the KOSPI (+4.3%). In the 313 trading days since the anti-involution meeting of the Central Financial and Economic Affairs Commission (July 1, 2025), an eight-stock steel basket rose 5.9% while the KOSPI rose 94.5%. The supply picture looks the same, but steel stocks are still near the starting line.
- With costs unchanged, a 1% price rise is worth 18.3% of market cap at Dongkuk CM, 7.2% at Dongkuk Steel and 6.0% at Hyundai Steel, the three highest of the eight companies, and their shares are down 21.9%, 7.2% and 5.8% since the anti-involution meeting. The author sees these three as the ones set to collect what is left of China’s steel cuts.
As of: October 14, 2026
Ticker: eight steel stocks. Dongkuk CM (460850.KS), Dongkuk Steel Mill (460860.KS), Hyundai Steel (004020.KS), KG Steel (016380.KS), POSCO Holdings (005490.KS), SeAH Besteel Holdings (001430.KS), Hyundai BNG Steel (004560.KS), TCC Steel (002710.KS)
Reference close: KRX close on October 14, 2026 (KRX Data System adjusted prices). KRW 1,339.1 per dollar on October 14 (Yahoo Finance).
This is the author’s personal analysis and view. The author’s calculations and estimates are not confirmed facts.
Summary: China’s shorter working hours, steel output cuts and Korean steel stocks
This report asks one question. If China’s working hours are falling, what is that a sign of, and which Korean stocks gain from it? Answering it means looking, in order, at whether hours really fell, why they fell, what China makes less of when hours fall, which Korean companies fill the gap, and how much of that the share prices already reflect.
Some Korea-specific background first. The KOSPI is the main board of the Korea Exchange (KRX) and its benchmark index. Yahoo-style tickers end in .KS for KOSPI stocks; all eight steel stocks in this report trade on the KOSPI. DART is Korea’s electronic disclosure system, where listed companies file their reports. Korea counts large sums in units of 100 million won (eok, so KRW 100mn) and one trillion won (jo); this report shows them as KRW bn and KRW tn. Dollar figures use KRW 1,339.1 per dollar, the October 14, 2026 rate (Yahoo Finance). Dongkuk Steel Mill (Dongkuk Steel for short) split in June 2023; the old company is today’s Dongkuk Holdings, and its cold-rolled and color sheet business became Dongkuk CM.
The first answer is a number. Every month China’s National Bureau of Statistics (NBS) publishes the hours that urban enterprise employees actually worked in a week. The figure rose for nine years from 2016, reaching 49.0 hours in December 2023 and December 2024 and 49.1 hours in January 2025. It has come down since, to 48.2 hours in August 2026. From March to August this year, all six months were 0.3 to 0.4 hours shorter than the same month a year earlier. The March to August average was 48.70 hours in 2023, 48.63 in 2024, 48.47 in 2025 and 48.15 in 2026, a fall of 0.16 hours from 2024 to 2025 and 0.32 hours from 2025 to 2026. This year’s drop is 2.0 times last year’s.
The second answer is the reason. Two hands are cutting working hours. One is the government. The Politburo of the Chinese Communist Party first raised “preventing involution-style vicious competition” on July 30, 2024; the consumption-boosting plan of March 16, 2025 said employers must not illegally extend working hours; and the Central Financial and Economic Affairs Commission meeting chaired by President Xi Jinping on July 1, 2025 decided to rein in low-price, disorderly competition and retire outdated capacity. In July 2026 the State Council called for the paid annual leave regulations to be revised. The other hand is business. Chinese labor law scholar Dong Baohua explained that when the economy is under pressure, companies first stop hiring, then cut overtime, and if the economy does not recover, cut staff. Over the same period China’s second-quarter growth was 4.3%, August retail sales grew 0.4% and youth unemployment was 18.9%. Falling working hours are a sign that factories are running less and that growth has turned down.
The third answer is what gets made less. In the second quarter, capacity utilization at China’s industrial firms above designated size was 73.0%, 1.0 percentage point lower than a year earlier, and steel (ferrous metal smelting and rolling) was at 77.6%, 3.2 points lower. Crude steel output peaked at 1,065mn tonnes in 2020, fell to 961mn tonnes in 2025 (-4.4%) and is down 3.1% in January to August this year. Steel exports, which hit a record 119mn tonnes in 2025, have been subject to export licensing since January this year and fell 3.0% in January to August, with flat products down 7.9%. In the second week of September, only 7.79% of 247 Chinese steel mills made money selling steel, and on September 15 the China Iron and Steel Association (CISA) issued a “self-imposed output and inventory cut” initiative together with 44 to 45 companies including Baowu and Ansteel. A China that works less is making and exporting less steel first.
The fourth answer is where the gap goes. Korea was a major destination, taking 7.74mn tonnes of China’s 119mn tonnes of steel exports in 2025. The Korea Trade Commission issued final anti-dumping rulings on Chinese plate (27.91% to 34.10%) and hot-rolled steel (28.16% to 33.10%), put provisional duties of 22.34% to 33.67% on coated and color sheet from June, and issued a preliminary ruling on special steel bars on September 17. In the first half of this year Korea’s imports of Chinese steel fell 6.6%, and hot-rolled imports fell 32.8%. In early October, Korean distribution prices were 20.4% higher than a year earlier for rebar, 15.3% for cold-rolled and 10.8% for hot-rolled. With China cutting output and the duty wall in place, Korean steelmakers have started selling the same products at higher prices.
The fifth answer is the share price. After President Xi first spoke of “supply-side structural reform” on November 10, 2015, China cut 115mn tonnes of steel capacity in 2016 and 2017, China’s steel price index rose 123.6%, and POSCO’s operating profit rose 91.8% from KRW 2.41tn in 2015 to KRW 4.62tn in 2017. Over those 313 trading days, six Korean steel stocks rose 43.3% and the KOSPI rose 4.3%. In the 313 trading days since this year’s anti-involution meeting, eight steel stocks are up 5.9% and the KOSPI is up 94.5%. The steel basket divided by the KOSPI times 100 stood at 137.4 on day 313 in 2016; this time it is 54.5.
The sixth answer is this report’s conclusion. If prices rise 1% while costs stay the same, 1% of revenue is added to operating profit. On 2025 revenue, that amount is KRW 27.7bn (about $20.7mn) at Dongkuk CM, 18.3% of its KRW 151.3bn (about $113mn) market cap; KRW 32.0bn at Dongkuk Steel, 7.2% of market cap (54% of its 2025 operating profit of KRW 59.4bn); and KRW 227.3bn (about $170mn) at Hyundai Steel, 6.0% of market cap (104% of its 2025 operating profit of KRW 219.2bn). These are the three highest ratios of the eight companies, and since the anti-involution meeting their shares are down 21.9%, 7.2% and 5.8%. The author reads China’s falling working hours as a signal of “growth turning down → steel output cuts” and sees these three, with the biggest price lever, as the ones set to collect what is left of China’s cuts.
This report follows that chain in order. It first looks at how China’s working hours moved month by month, then checks with a policy timeline and economic indicators why government and business cut hours. It then measures what factories running less make and export less of in steel, and what wall that volume meets in Korea. Next it lays Korean steel stocks during the 2016 supply reform over the current episode, and finally it sets out the price lever of the eight companies, the signals the author watches and the basis for the numbers.
China weekly working hours: March to August average 48.70 → 48.15 hours, down after nine years of gains

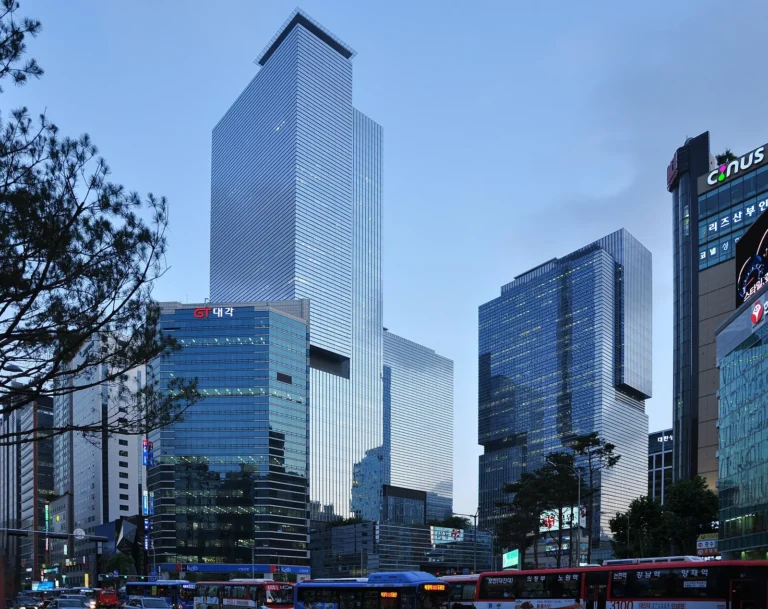
The photo above shows an assembly line at an electronics factory in Shenzhen, China. Workers in white cleanroom suits sit side by side at long benches attaching parts. China became the world’s factory because lines like this ran two shifts a day, six days a week. The number that measures that time is the NBS “average weekly working hours of enterprise employees nationwide”.
Start with what the number covers and how it is measured. The NBS asks urban enterprise employees how many hours they actually worked in the week that includes the 3rd to the 9th of each month. Lunch breaks are excluded, and public bodies and the self-employed are not covered. The “weekly working hours of urban employed persons” in the China Labour Statistical Yearbook covers more, including public bodies, the self-employed and temporary workers. The figure appears in the mid-month release on the national economy, and the January value is not published separately, because the combined January and February release carries only the February value.
This number rose for nine years from 2016. In January 2026 the Hong Kong outlet HK01 summed up 2025 working hours as having “ended nine straight years of increases”. The Economic Observer noted that 16 of the 24 months in 2023 and 2024 were at 48.7 hours or more. The peaks were 49.0 hours in December 2023 and December 2024 and 49.1 hours in January 2025. Since then the number has come down, and August 2026 was 48.2 hours.
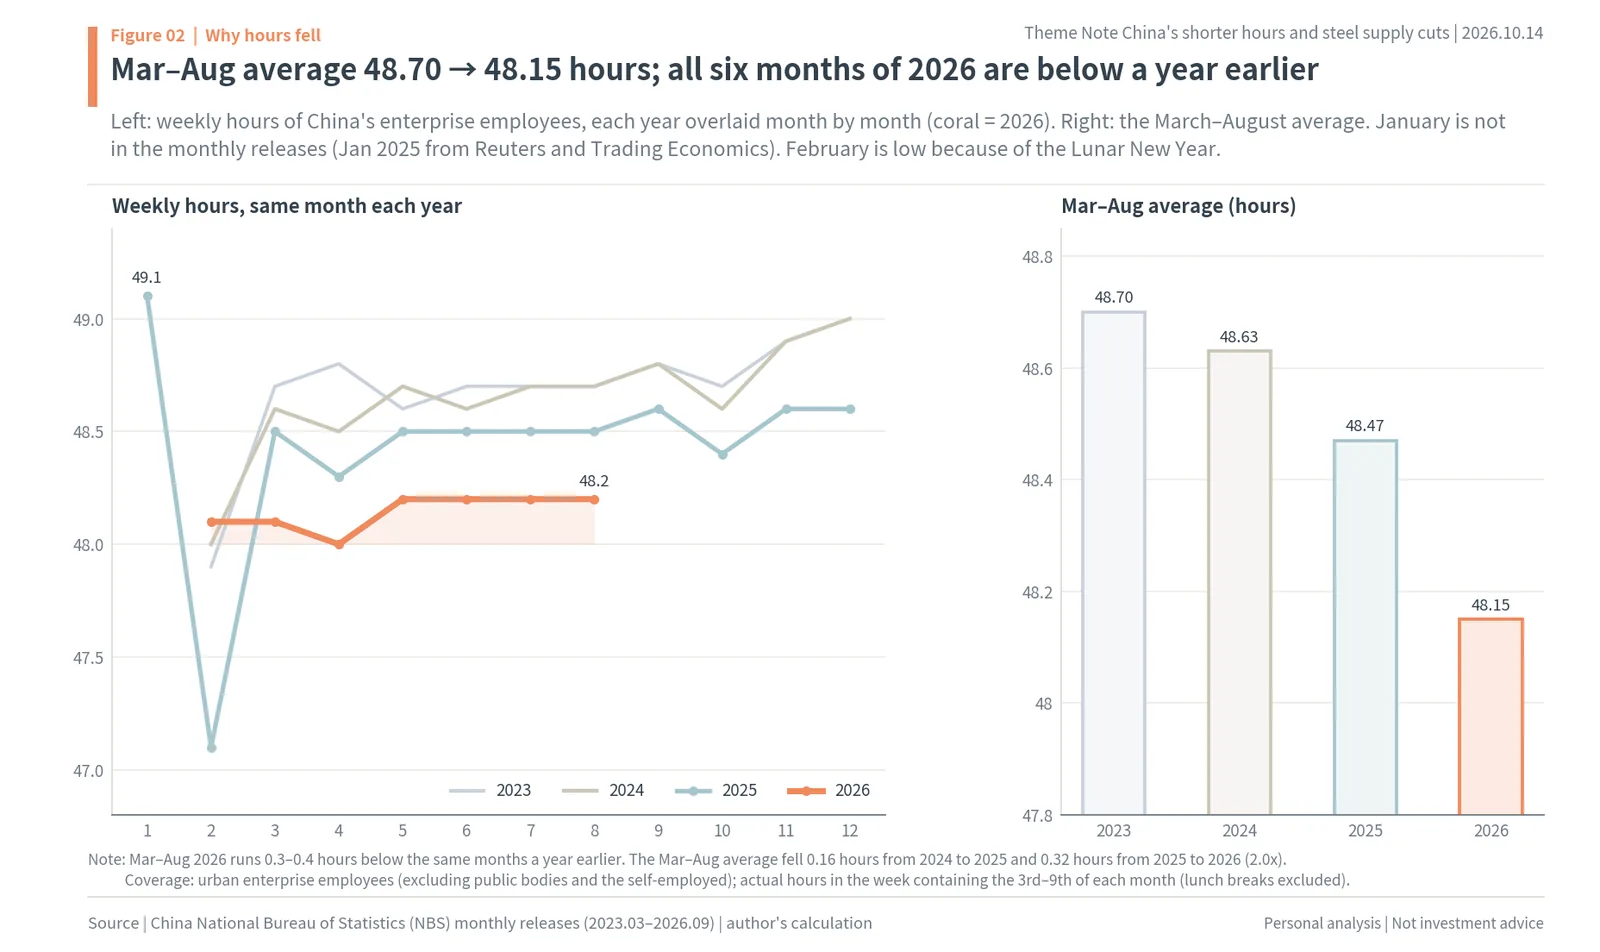
The left side of Figure 02 overlays each year month by month. February is low every year because of the Lunar New Year, and since the holiday fell in late January in 2025 and mid-February in 2026, the Februaries are hard to compare. So the comparison runs from March to August. March 2026 was 48.1 hours, 0.4 hours shorter than a year earlier, and April to August were 48.0 to 48.2 hours, 0.3 hours shorter than a year earlier each month. All six months are shorter than the same month last year. The Economic Observer wrote that January 2026 was the lowest January in nearly three years and that March to May were the lowest for those months in nearly four years.
The right side is the March to August average: 48.70 hours in 2023, 48.63 in 2024, 48.47 in 2025 and 48.15 in 2026. The average fell 0.07 hours from 2023 to 2024, 0.16 hours from 2024 to 2025 and 0.32 hours from 2025 to 2026. The drop has grown every year, and this year it is 2.0 times last year’s. 0.32 hours is about 19 minutes a week, or about 3.8 minutes a day over a five-day week. That looks small, but this indicator is the average of all urban enterprise employees in China, so a number that moved around 0.1 hours a year in 2023 to 2025 moving 0.32 hours this year means the direction changed and then picked up speed.

Figure 03 sets the number beside the legal limits. Article 36 of China’s Labor Law sets a working-hours system of no more than 8 hours a day and an average of 44 hours a week, and the State Council rules, a lower-level administrative regulation, set 8 hours a day and 40 hours a week. Under Article 41 of the Labor Law, overtime is capped at 3 hours a day and 36 hours a month. The 48.2 hours of August 2026 is 4.2 hours longer than the Labor Law’s 44 and 8.2 hours longer than the State Council’s 40. In the 2023 Labour Statistical Yearbook, accommodation and food services ran 53.8 hours a week, and manufacturing, transport and wholesale/retail also topped 51 hours.
The gap matters because of cost. Article 44 of the Labor Law sets overtime pay at 150% on workdays, 200% on rest days and 300% on statutory holidays. The 4 to 8 hours above the legal week are the part companies stretch or shrink with their order books, and that part is the first to go. Falling working hours mean factories have stopped running lines on overtime. That is why this report reads working hours as a signal of growth and supply.
Why China’s working hours fell: anti-involution policy, overtime limits and fewer orders
Two hands are cutting China’s working hours. One is the government’s; the other belongs to factories whose orders have shrunk. They moved for different reasons but point the same way: the model in which China worked longer, made more and shipped it out cheaply is coming to an end.
The government’s hand starts with the word “involution” (neijuan). It is the Chinese term for self-defeating competition in which rivals in the same market cut prices and lengthen hours just to survive. At its July 30, 2024 meeting the Politburo of the Chinese Communist Party said for the first time that it would “strengthen industry self-discipline and prevent involution-style vicious competition”, and in the same passage it called for “opening exit channels for outdated and inefficient capacity”. The Central Economic Work Conference in December 2024 made this a priority for 2025, and the Government Work Report of March 5, 2025 included “comprehensively rectifying involution-style competition” for the first time.
Working hours were addressed directly in consumption policy that same month. The special action plan to boost consumption issued by the General Offices of the CPC Central Committee and the State Council on March 16, 2025 said, under rest and leave rights, that workers’ rights to rest and leave must be protected by law and that working hours must not be illegally extended. The sixth meeting of the Central Financial and Economic Affairs Commission, chaired by President Xi on July 1, 2025, decided to “govern low-price, disorderly competition among companies according to law and promote the orderly exit of outdated capacity”. The March 2026 Government Work Report lowered the growth target to 4.5% to 5% and, in the same document, pledged to “deepen the rectification of involution-style competition” and to “implement the system of paid staggered leave for employees”. The State Council’s approval of the 15th Five-Year plan to expand consumption, made public on July 13, 2026, called for the revision of the regulations on paid annual leave for employees. In August, Henan province encouraged employers to try short breaks built from “a Friday half-day + the weekend + annual leave”.
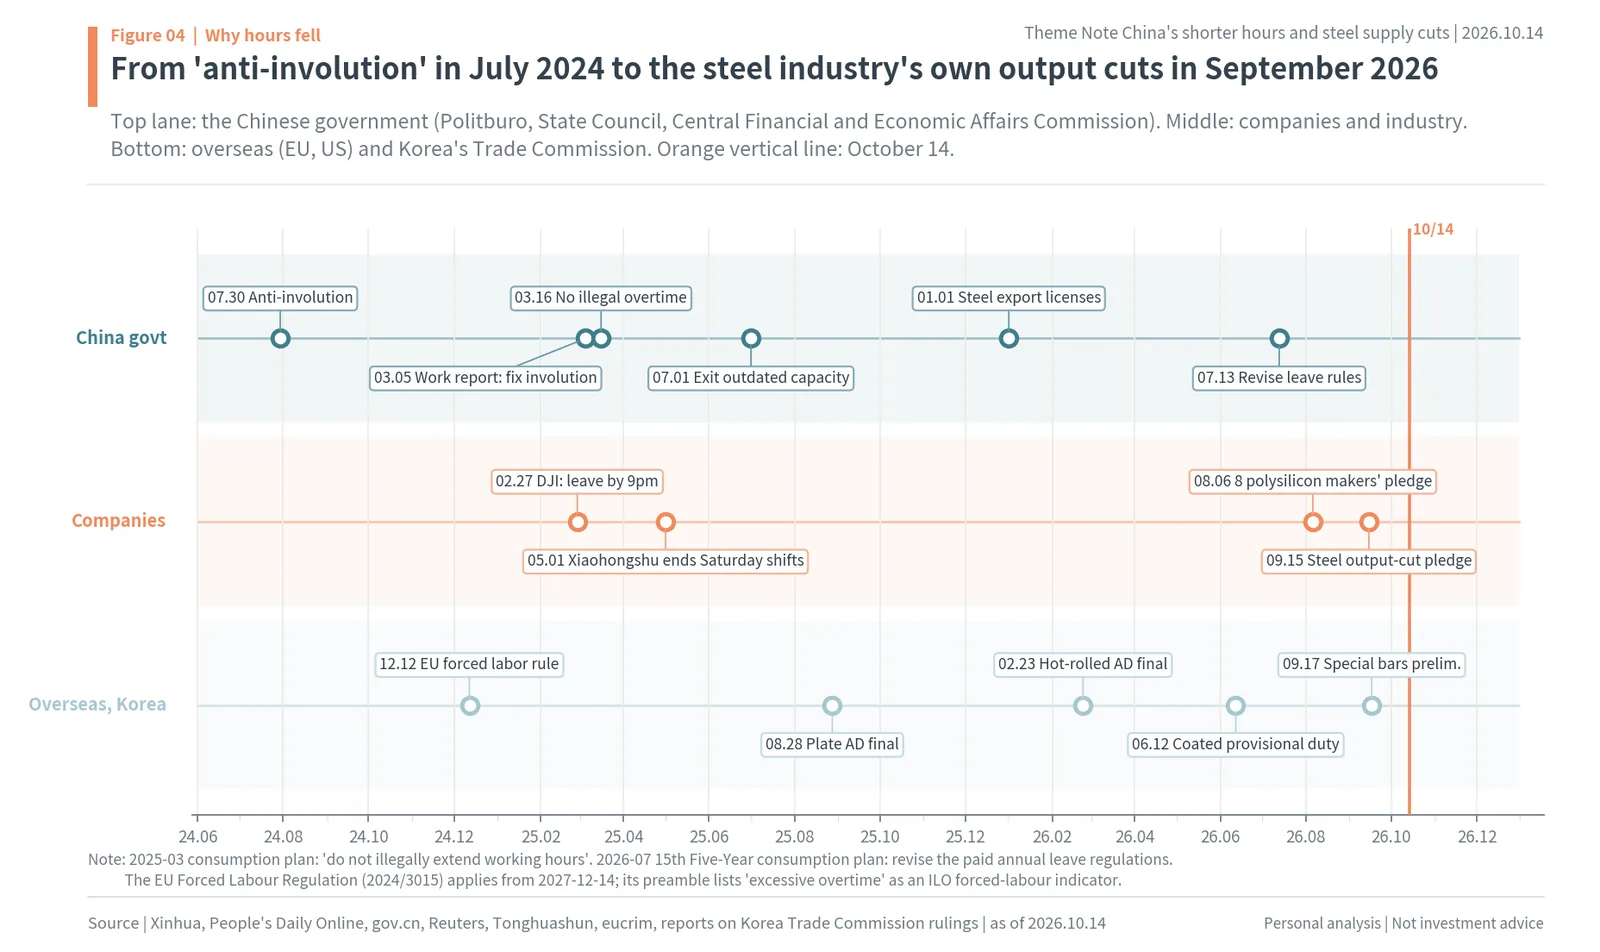
Figure 04 draws this in three lanes. The top lane is the Chinese government, the middle lane companies and industry, and the bottom lane overseas and Korea. The government lane starts with “preventing involution” in July 2024 and continues with the ban on illegal overtime in March 2025, the exit of outdated capacity in July 2025, export licensing for steel in January 2026 and the revision of annual leave rules in July 2026. In the company lane, drone maker DJI began “forced clock-off” at 9 p.m. from February 27, 2025, appliance maker Midea decided to send staff home at 6:20 p.m., and Xiaohongshu scrapped alternating Saturday shifts from May 1, 2025. At the industry level, eight polysilicon makers (over 90% of effective domestic capacity) pledged on August 6, 2026 not to sell below cost, and the steel industry announced its own output cuts on September 15.
Local labor bureaus have changed their stance too. Law firm DLA Piper wrote in April 2026 that while the law is unchanged, local labor bureaus have become “noticeably more cautious and restrictive” in approving comprehensive and flexible working-hours systems. A comprehensive working-hours system calculates hours as an average over several weeks, so with approval a company can pack overtime into busy weeks. That door has narrowed. Overseas, the EU Forced Labour Regulation was published in the Official Journal on December 12, 2024 and applies from December 14, 2027, and recital 1 of the regulation lists “excessive overtime” as an International Labour Organization (ILO) indicator of forced labor. Reuters reported in April 2025 that Beijing-based analyst Liu Xingliang said, “These big companies fear losing overseas orders due to violations.”
The other hand is orders. Even when the government tells people to rest, factories keep running if orders are plentiful. That working hours actually fell means orders fell too. Dong Baohua, vice president of the China Society of Social Law, told the Economic Observer that when the economy is under pressure, companies first stop hiring, then cut existing staff’s overtime so that working hours fall noticeably, and if the economy does not improve, they eventually choose layoffs. In the same article an employment researcher said working hours move in the same direction as the economy, with a small lag, and Associate Professor Mao Yufei of Capital University of Economics and Business said the room to absorb economic pressure through working hours is already near its limit.

Figure 05 puts those orders into numbers. The left side is capacity utilization at China’s industrial firms above designated size. All industry fell from 76.2% in the fourth quarter of 2024 to 73.0% in the second quarter of 2026, 1.0 percentage point below a year earlier. Steel peaked at 80.8% in the second quarter of 2025 and was 77.6% in the second quarter of 2026, 3.2 points below a year earlier. Steel fell more than industry as a whole. The right side is spending per domestic trip over the National Day holiday. Dividing the Ministry of Culture and Tourism’s total spending by person-trips gives CNY 911.04 in 2025 (8 days) and CNY 893.92 in 2026 (7 days), down 1.9%. People traveled more, but spent less per trip.
Other indicators point the same way. China grew 5.0% in 2025, 4.7% in the first half of 2026 and 4.3% in the second quarter. August retail sales rose only 0.4% from a year earlier, the August urban surveyed unemployment rate was 5.3%, and unemployment among 16- to 24-year-olds was 18.9%. Meanwhile 2025 average manufacturing wages rose to CNY 113,594 (+5.2%) at non-private units and CNY 76,055 (+6.4%) at private ones. Wages are rising and orders are falling. Cutting overtime is where those two forces meet.
So this report reads China’s falling working hours as a two-layer signal. First, as the government reins in involution and enforces the right to rest, the model of pushing out volume on overtime has hit the brakes. Second, orders have shrunk and factories are running less. Where the two signals overlap is where growth turns down, and the first thing to shrink there is what China made the most of and exported the cheapest. That is steel.
China’s overtime fell 7.2%: the hours above the 44-hour legal week shrank from 4.47 to 4.15
To read falling working hours as a supply signal, the number has to be split once more. The standard in China’s Labor Law is an average of 44 hours a week. Time above that line is overtime that companies stretch or shrink with their orders, and it requires extra pay of 150% on workdays and 200% on rest days. It is the knob a factory turns up to run lines harder when orders are strong, and the first knob it turns down when orders fall.
On the March to August average, the part above 44 hours was 4.47 hours of the 48.47 hours in 2025 and 4.15 hours of the 48.15 hours in 2026. Total working hours fell 0.66%, but the overtime part fell 7.2%. The same 0.32 hours came out of overtime rather than the legal week, and overtime is the time when factories make the extra goods they send abroad. On August’s 48.2 hours, 8.7% of working hours is above the legal 44.
Article 41 of the Labor Law caps overtime at 36 hours a month, which over 52 weeks a year is about 8.3 hours a week. Adding that cap to the legal 44 hours gives 52.3 hours a week as the legal maximum, yet in 2023 accommodation and food ran 53.8 hours, and manufacturing, transport and wholesale/retail topped 51. Chinese factories were running close to the legal limit. That is the point Associate Professor Mao Yufei of Capital University of Economics and Business made when he said the room to absorb economic pressure through working hours is already near its limit.
So this decline is the result of being boxed in from two sides. From above, law and enforcement stop overtime from growing further; from below, shrinking orders take overtime away. If local labor bureaus make comprehensive working-hours approval harder, the practice of packing overtime into busy weeks to meet delivery dates also becomes harder to use. The capacity of Chinese factories to make more with the same equipment and export it more cheaply came from this overtime. When it shrinks, supply shrinks. The next chapter shows that the industry where this showed up first and largest in the numbers is steel.
China steel output cuts: crude steel -3.1%, exports -3.0%, and only 7.79% of mills profitable
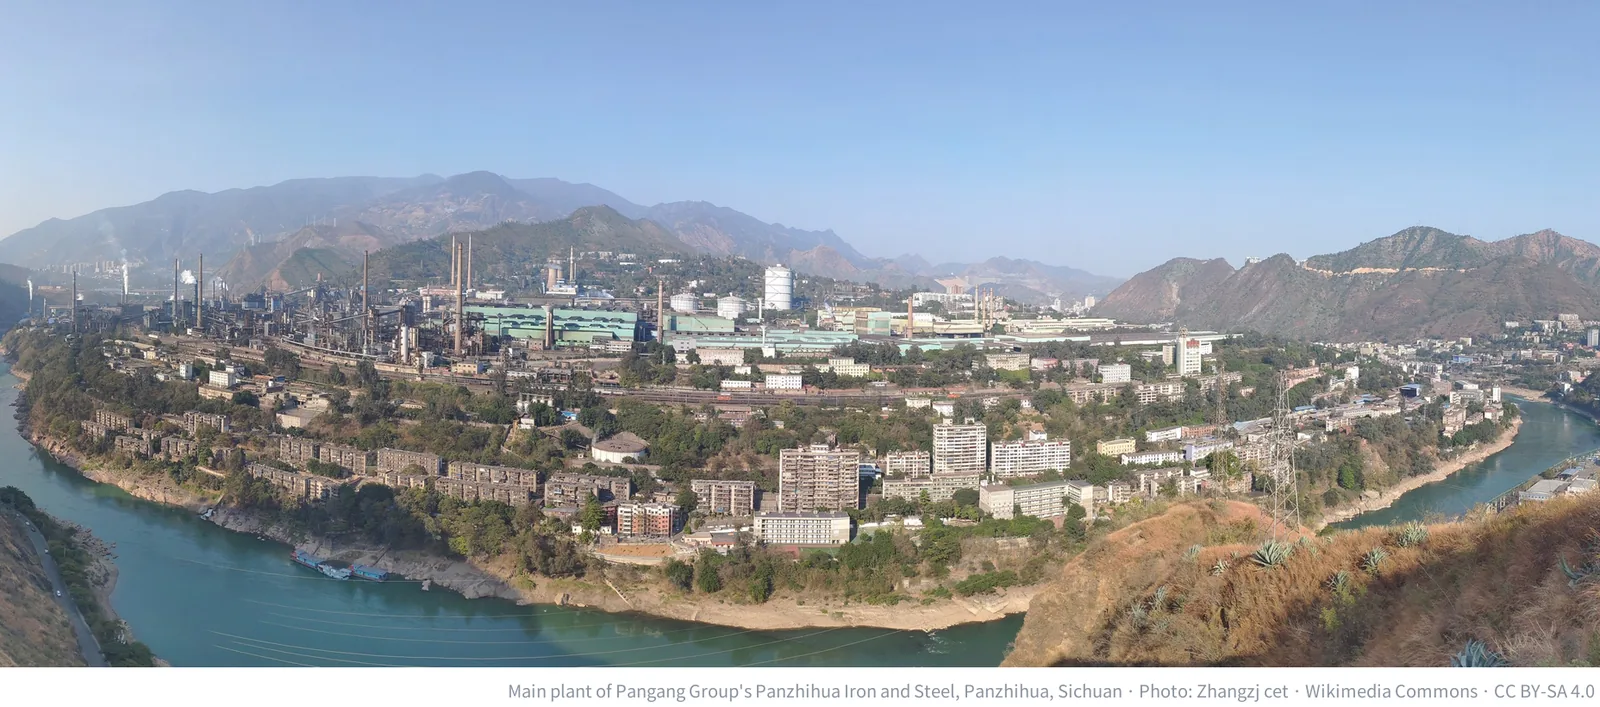
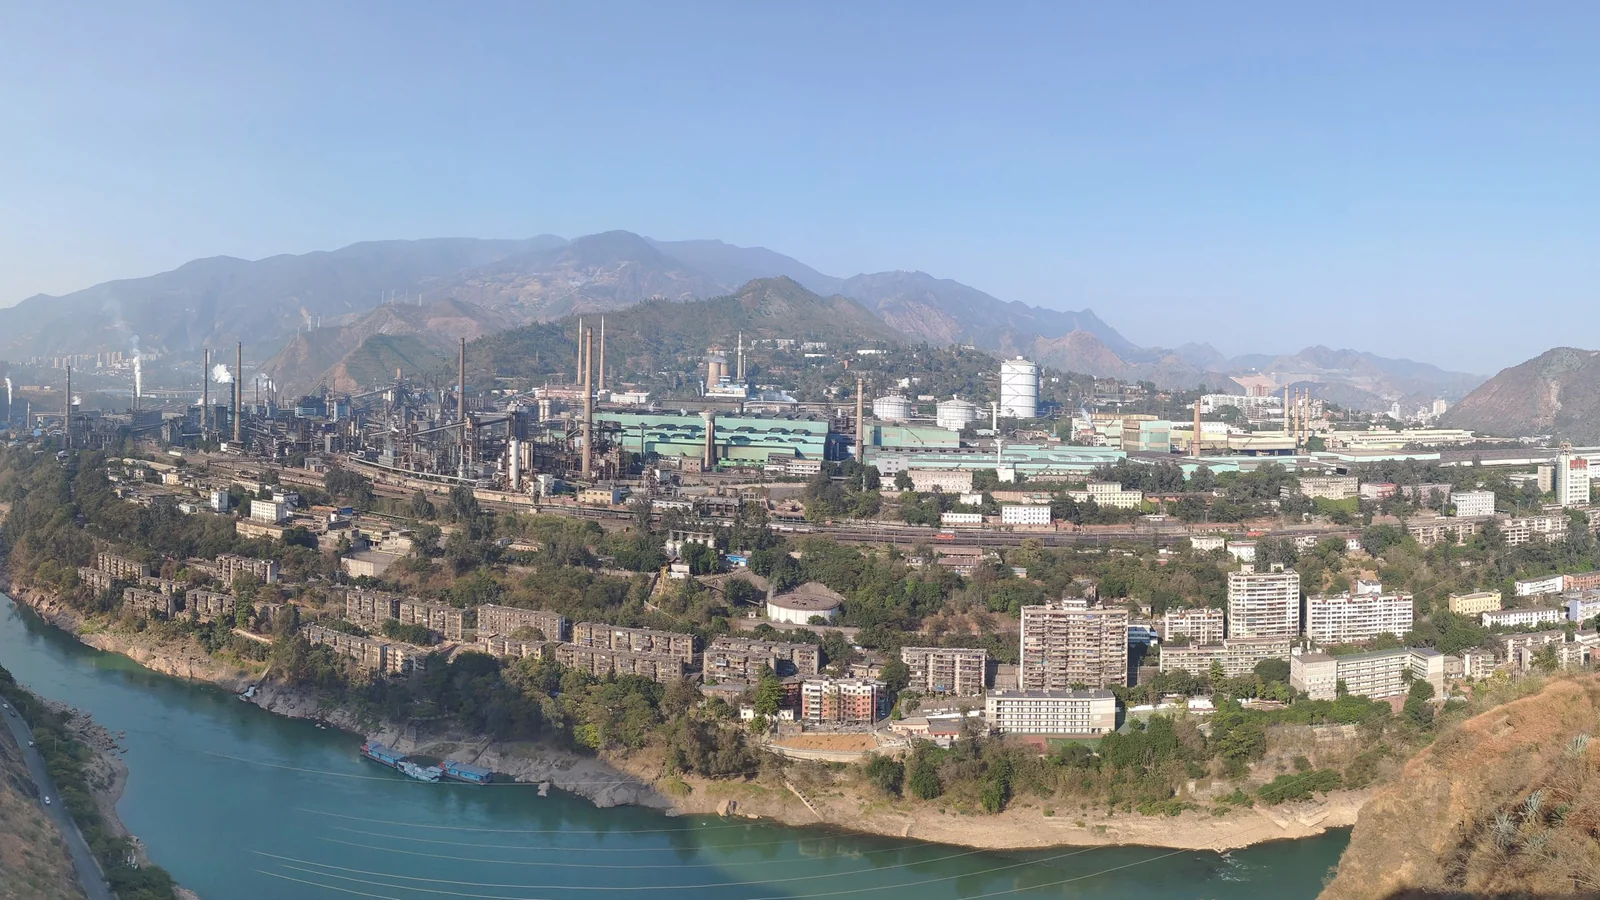
The photo above is the main plant of Pangang Group’s steelworks in Panzhihua, Sichuan province. Blast furnaces and rolling mills line the valley between the mountains. China has hundreds of mills like this, and in 2020 they made 1,065mn tonnes of crude steel. When working hours fall and factories start running less, these mills are where the numbers change first.
There are three reasons steel comes first. First, steel is the commodity China made and exported the most of; its steel exports hit a record 119mn tonnes in 2025. Second, steel was already losing money: producer prices for ferrous metal smelting were 7.7% lower than a year earlier through all of 2025. Third, it is an industry where the government directly controls output. In December 2025 the National Development and Reform Commission (NDRC) said it would keep controlling national crude steel output and strictly prohibit new steelmaking capacity during the 15th Five-Year Plan (2026 to 2030), and the plan approved in March 2026 calls for an orderly reduction of steel capacity.

The left side of Figure 07 is China’s crude steel output. It rose from 804mn tonnes in 2015 to 1,065mn tonnes in 2020, then fell to 1,033mn in 2021, 1,013mn in 2022, 1,019mn in 2023, 1,005mn in 2024 and 961mn in 2025. 2025 was 4.4% lower than the year before, the first year below 1bn tonnes in six years, and 9.8% below the 2020 peak. January to August this year was 652mn tonnes, down another 3.1%, and August alone was 74.61mn tonnes, down 3.7%. The 3.1% drop in January to August means about 20.9mn tonnes less was made than in the same period last year (author’s calculation).
The right side is steel product exports. Exports of 112mn tonnes in 2015 fell after the supply reform to 75.43mn tonnes in 2017 and 53.70mn in 2020, then rose again to 90.26mn in 2023, 111mn in 2024 and 119mn in 2025. That is a 121.6% increase from 2020 to 2025. Steel that could not be used inside China was pushed abroad, and the average export price fell 8.1% to $694 per tonne in 2025. That flow changed on January 1 this year. MOFCOM and the General Administration of Customs, in Announcement No. 79 of 2025, put about 300 steel tariff lines under export licensing. It is not a ban, but exports need an export contract and a manufacturer’s quality certificate. Steel exports in January to August this year were 75.15mn tonnes, down 3.0%, and flat products were 44.26mn tonnes, down 7.9%. The average export price rose 1.0% to $705.9 per tonne.
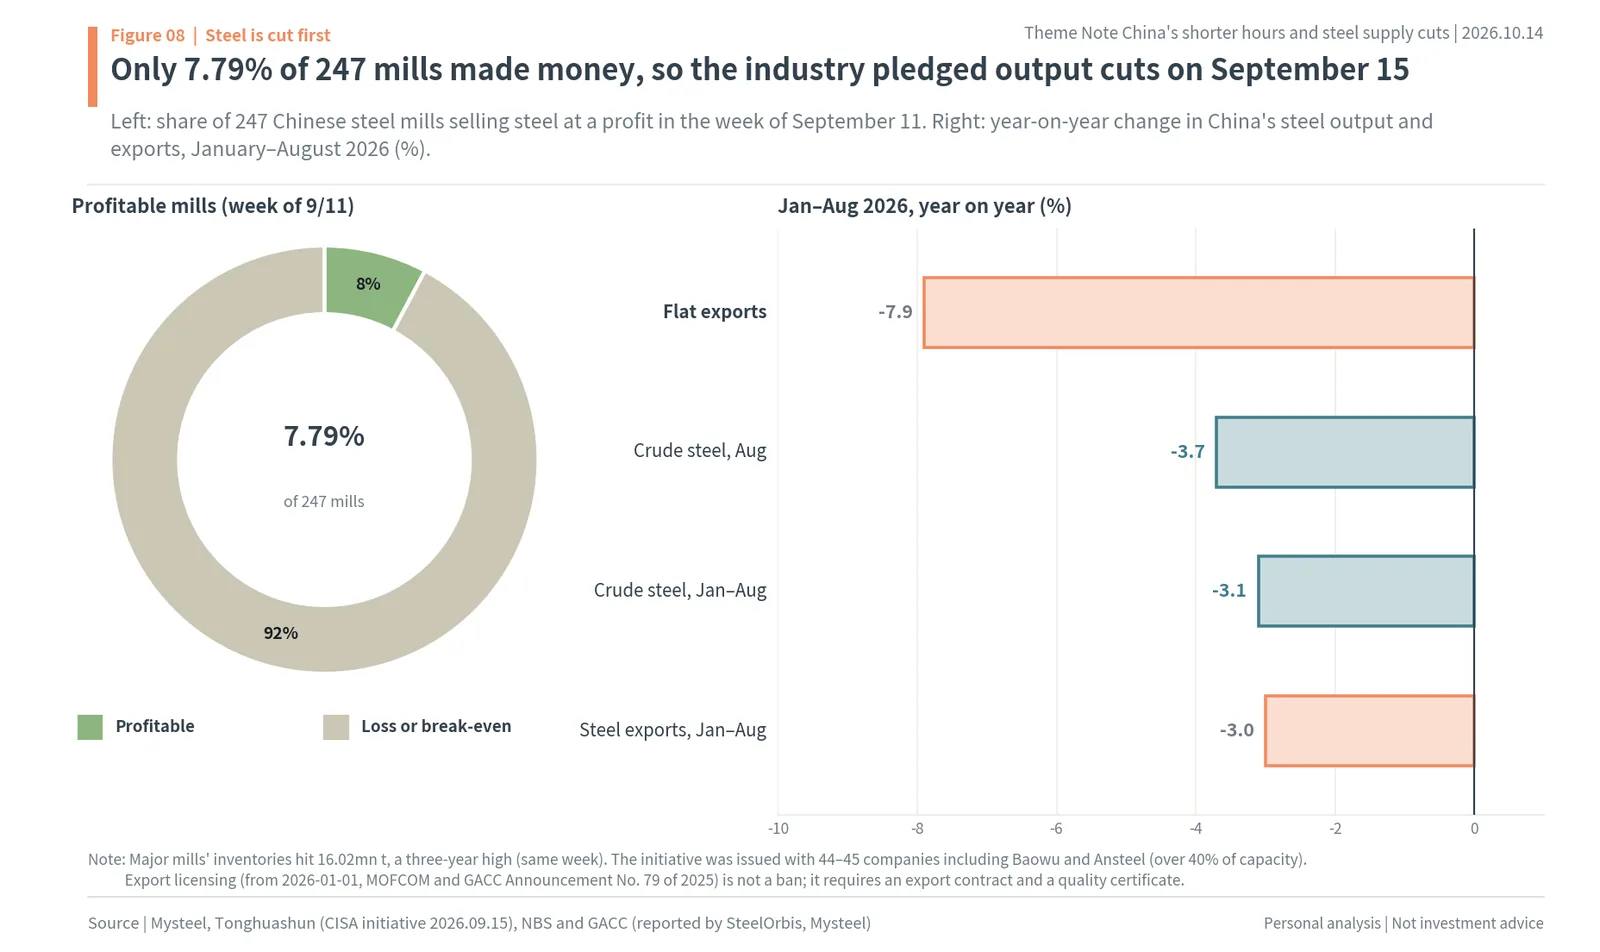
Figure 08 shows why the cuts are likely to continue. The left side is the share of 247 Chinese steel mills surveyed by Mysteel that made money selling steel in the week that included September 11: 7.79%, or about 19 mills. At the same time, major mills’ inventories were 16.02mn tonnes, the highest in three years. The next week, on September 15, CISA issued an “initiative to fully implement self-imposed production control and inventory reduction in the steel industry” together with 44 to 45 companies including Baowu, Ansteel, HBIS, Shougang and Shagang (over 40% of capacity). The initiative says members will “strictly implement output control”, criticizes overproduction and calls on them not to sell below cost.
The right side gathers the January to August numbers. Crude steel was down 3.1% for January to August and 3.7% in August alone; steel exports were down 3.0% and flat exports down 7.9%. That is the same direction as the 77.6% steel utilization in the second quarter (-3.2 points) seen in Figure 05. Working hours fall, utilization falls, and output and exports fall together. These three numbers are the link in this report’s chain from “China works less” to “China makes less steel”.
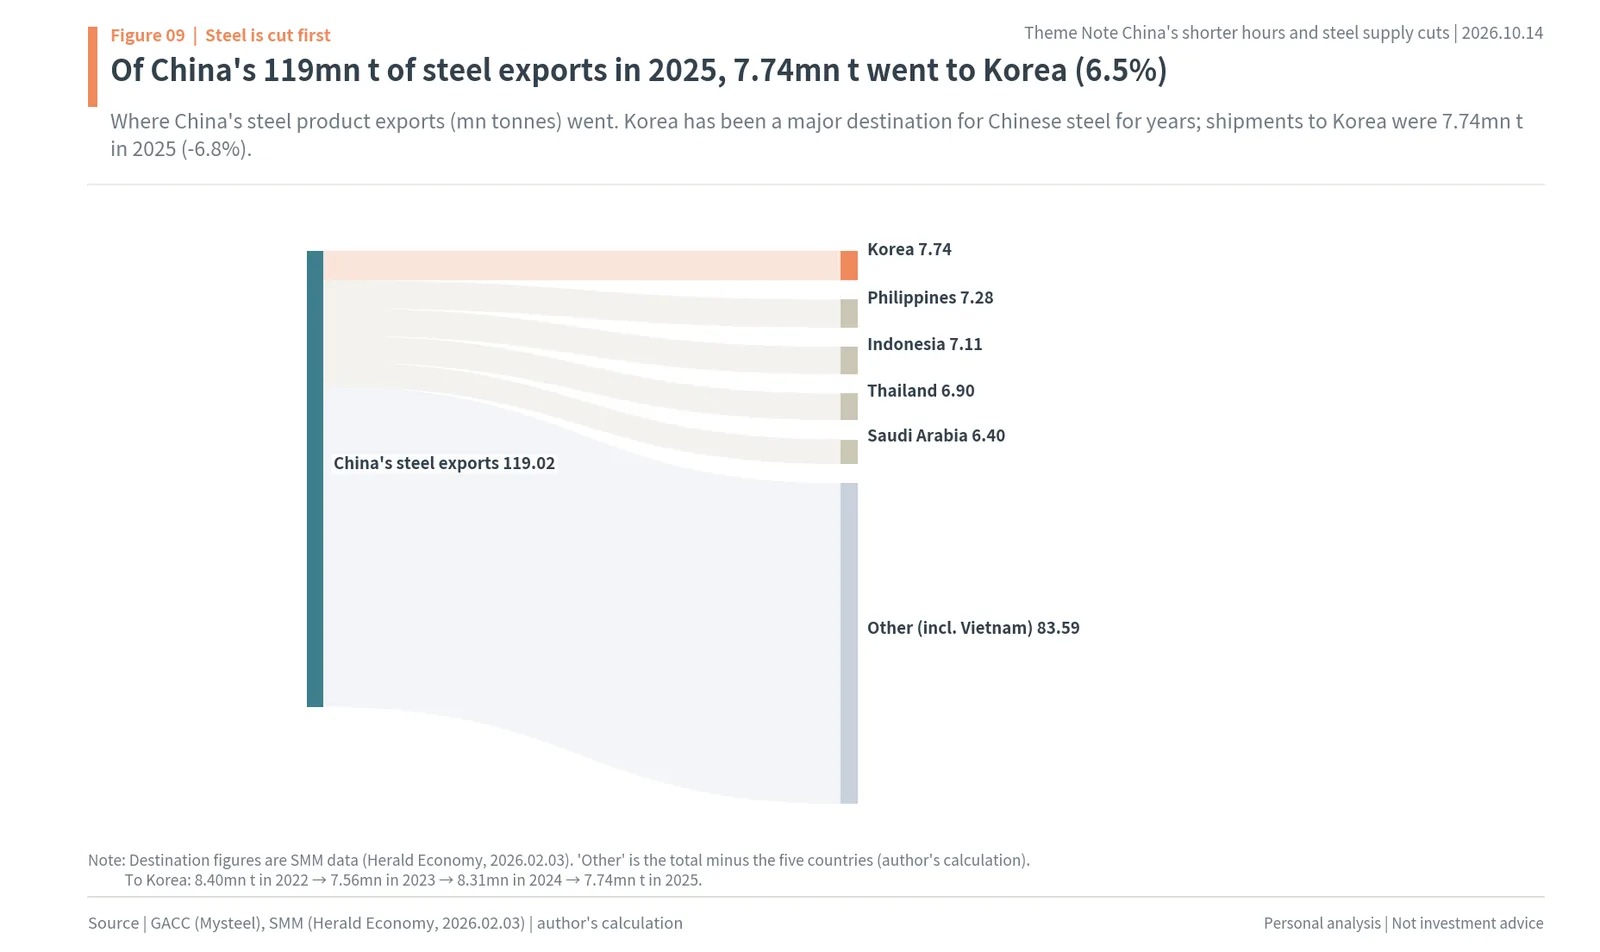
Figure 09 shows where China’s 119mn tonnes of steel exports went in 2025. According to market research firm SMM, 7.74mn tonnes went to Korea, 6.5% of China’s steel exports. The Philippines (7.28mn tonnes), Indonesia (7.11mn), Thailand (6.90mn) and Saudi Arabia (6.40mn) followed. Shipments to Korea were 8.40mn tonnes in 2022, 7.56mn in 2023, 8.31mn in 2024 and 7.74mn in 2025, in the 7mn to 8mn tonne range every year. Korea has been a major destination for Chinese steel for years, so when China makes and exports less, the share Korea’s market receives is large too.
This is where the report makes clear why it chose steel. When Chinese supply shrinks, Korean companies making the same products gain. The industry where that link can be confirmed in numbers is steel. Crude steel output has fallen for two years, utilization is below a year earlier, exports are under licensing, and the industry has declared its own output cuts. So every beneficiary in this report is a steelmaker.
Korea’s 22% to 34% anti-dumping duties on Chinese steel and rising domestic steel prices
China making and exporting less already gives Korean steelmakers breathing room. On top of that, Korea built one more wall: the Korea Trade Commission’s anti-dumping duties. An anti-dumping duty is an extra duty charged on imports, equal to the gap, when an exporting country is found to sell below its home price and hurt the importing country’s industry. In 2025 and 2026 the commission ruled on five Chinese steel products one after another.

The left side of Figure 10 is that wall. The solid line is the low end of the duty rate and the dashed line the high end. Plate (thick steel for shipbuilding and bridges) went through a preliminary ruling on February 20, 2025 and a final ruling on August 28 that set 27.91% to 34.10% for five years. Hot-rolled steel (the feedstock for cars and steel pipe) carried provisional duties from September 23, 2025, and the final ruling on February 23, 2026 set 28.16% to 33.10% on Chinese material. Six Chinese and three Japanese makers accepted five-year price undertakings, and those nine accounted for about 81% of Korea’s hot-rolled imports over the last three years. For H-beams, a five-year extension of the 28.23% to 32.72% duty was recommended on September 17. For special steel bars, a preliminary ruling of 25.08% to 27.96% came the same day, with provisional duties expected around mid-November and a final ruling in February 2027. Coated and color sheet carried provisional duties of 22.34% to 33.67% for four months from June after an April preliminary ruling, with a final ruling due in October.
The wall is 22% to 34% high. Duties of that size erase most of the price gap between Chinese and Korean steel. In Korea Iron & Steel Association and SteelDaily data compiled by Eugene Investment & Securities, Korean carbon special steel bars cost KRW 1,032,000 per tonne in 2025 and Chinese ones KRW 896,000, so Chinese bars were 13.2% cheaper, and alloy steel bars were 18.9% cheaper. Add a 25% to 28% duty and the Chinese product becomes more expensive. Korean buyers lose their reason to buy Chinese.
The right side is the result. In Hana Securities’ weekly report of October 12, Korean distribution prices on October 8 were higher than a year earlier by 20.4% for rebar (KRW 855,000 per tonne), 15.3% for cold-rolled (KRW 980,000), 12.0% for H-beams (KRW 1,210,000), 10.8% for hot-rolled (KRW 920,000, about $687) and 6.5% for plate (KRW 980,000). All five products rose. With Chinese cuts reducing outside volume and the duty wall narrowing the way in, Korean steelmakers began to sell the same products at higher prices.

Figure 11 shows the volume coming in. The left side is China’s steel exports to Korea in Chinese data: 8.40mn tonnes in 2022, 7.56mn in 2023, 8.31mn in 2024 and 7.74mn in 2025. 2025 was down 6.8%. The right side is Korea’s imports in the first half of 2026 in Korea Iron & Steel Association data. Imports of Chinese steel fell 6.6% to 3.788mn tonnes, and hot-rolled sheet imports fell 32.8% to 1.121mn tonnes. Hanwha Investment & Securities noted that Chinese plate imports fell 33% in the year after the provisional duty, and hot-rolled imports fell 87% within three months of their provisional duty.
When prices rise, profit follows right away. POSCO’s carbon steel selling price rose from KRW 920,000 per tonne in the first quarter to KRW 962,000 in the second. Dongkuk Steel’s second-quarter operating profit of KRW 45.6bn beat market expectations (KRW 33.7bn), and Hana Securities explained that its plate sales rose 13.2% from a year earlier to 265,000 tonnes as falling Chinese imports lifted its market share. Dongkuk CM swung to an operating profit of KRW 21.1bn in the second quarter, when provisional duties on coated and color sheet took effect. Hana Securities, citing “tighter regulation of Chinese steel imports”, sees high visibility for POSCO Holdings’ earnings improvement next year as well.
In short, for Korean steelmakers China’s falling working hours are a double tailwind. Outside, China makes and exports less; inside, the duty wall blocks the remaining volume. The result of the two together is higher domestic prices. The next chapter shows this is not the first time. China also cut steel capacity in 2016, and how Korean steel stocks moved then is the benchmark for now.
China’s 2016 supply-side reform: Korean steel stocks +43.3% vs KOSPI +4.3% after 313 trading days
This is not the first time China has cut steel. On November 10, 2015, at the 11th meeting of the Central Leading Group for Financial and Economic Affairs, President Xi said for the first time that China would “strengthen supply-side structural reform while moderately expanding aggregate demand”. Three months later, on February 4, 2016, the State Council issued Document No. 6 [2016], “Opinions on resolving overcapacity in the steel industry and achieving turnaround”, pledging to cut a further 100mn to 150mn tonnes of crude steel capacity over five years from 2016. The next day came Document No. 7, retiring about 500mn tonnes of coal capacity over three to five years.
Actual cuts came faster than the targets. According to the 2017 Government Work Report, over 65mn tonnes of steel capacity were cut in 2016 alone. In 2017 a target of about 50mn tonnes of steel cuts was put in the Government Work Report for the first time and was reached early, by the end of August. Separately, 140mn tonnes of “ditiaogang” (substandard induction-furnace steel that failed quality standards) were cleared by October. Over 2016 and 2017, 115mn tonnes of steel capacity were cut.
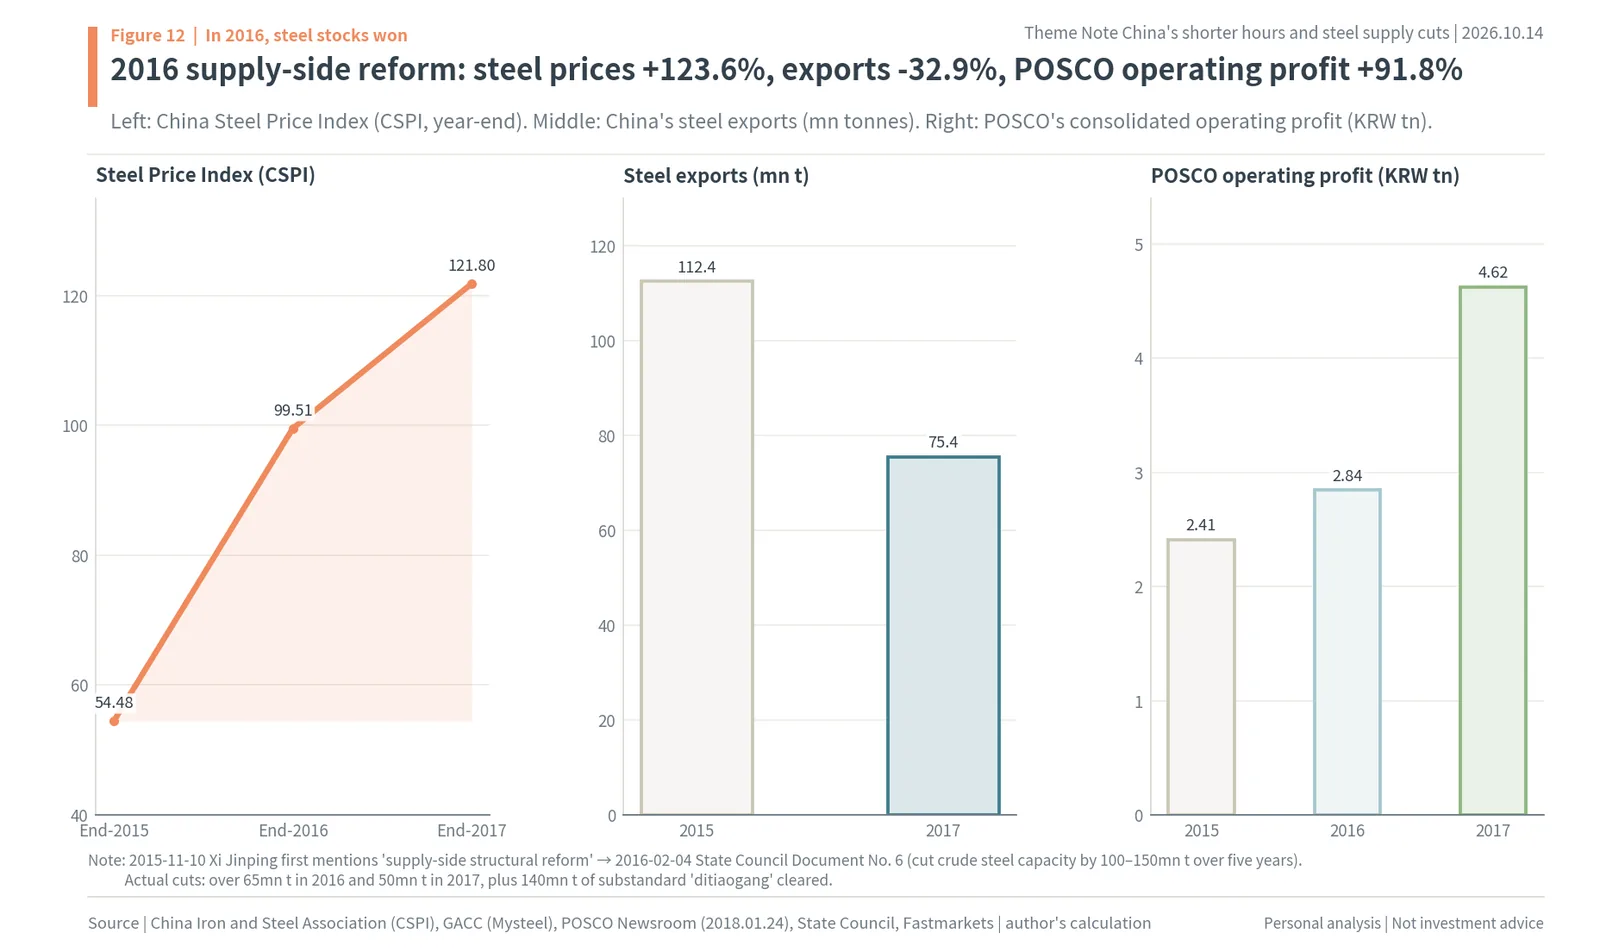
Figure 12 shows the result. The left side is CISA’s China Steel Price Index (CSPI), which went from 54.48 at the end of December 2015 to 99.51 at the end of 2016 and 121.80 at the end of 2017, up 123.6% in two years. The middle is China’s steel exports, which fell 32.9% from 112mn tonnes in 2015 to 75.43mn tonnes in 2017. The right side is POSCO’s consolidated operating profit: KRW 2.41tn in 2015, KRW 2.8443tn in 2016 and KRW 4.6218tn (about $3.45bn) in 2017, up 91.8% in two years, with 2017 the highest in six years. When China made less, prices inside China rose, volume going abroad fell, and Korean steelmakers’ profits grew. That is the same shape as the chain this report draws now.
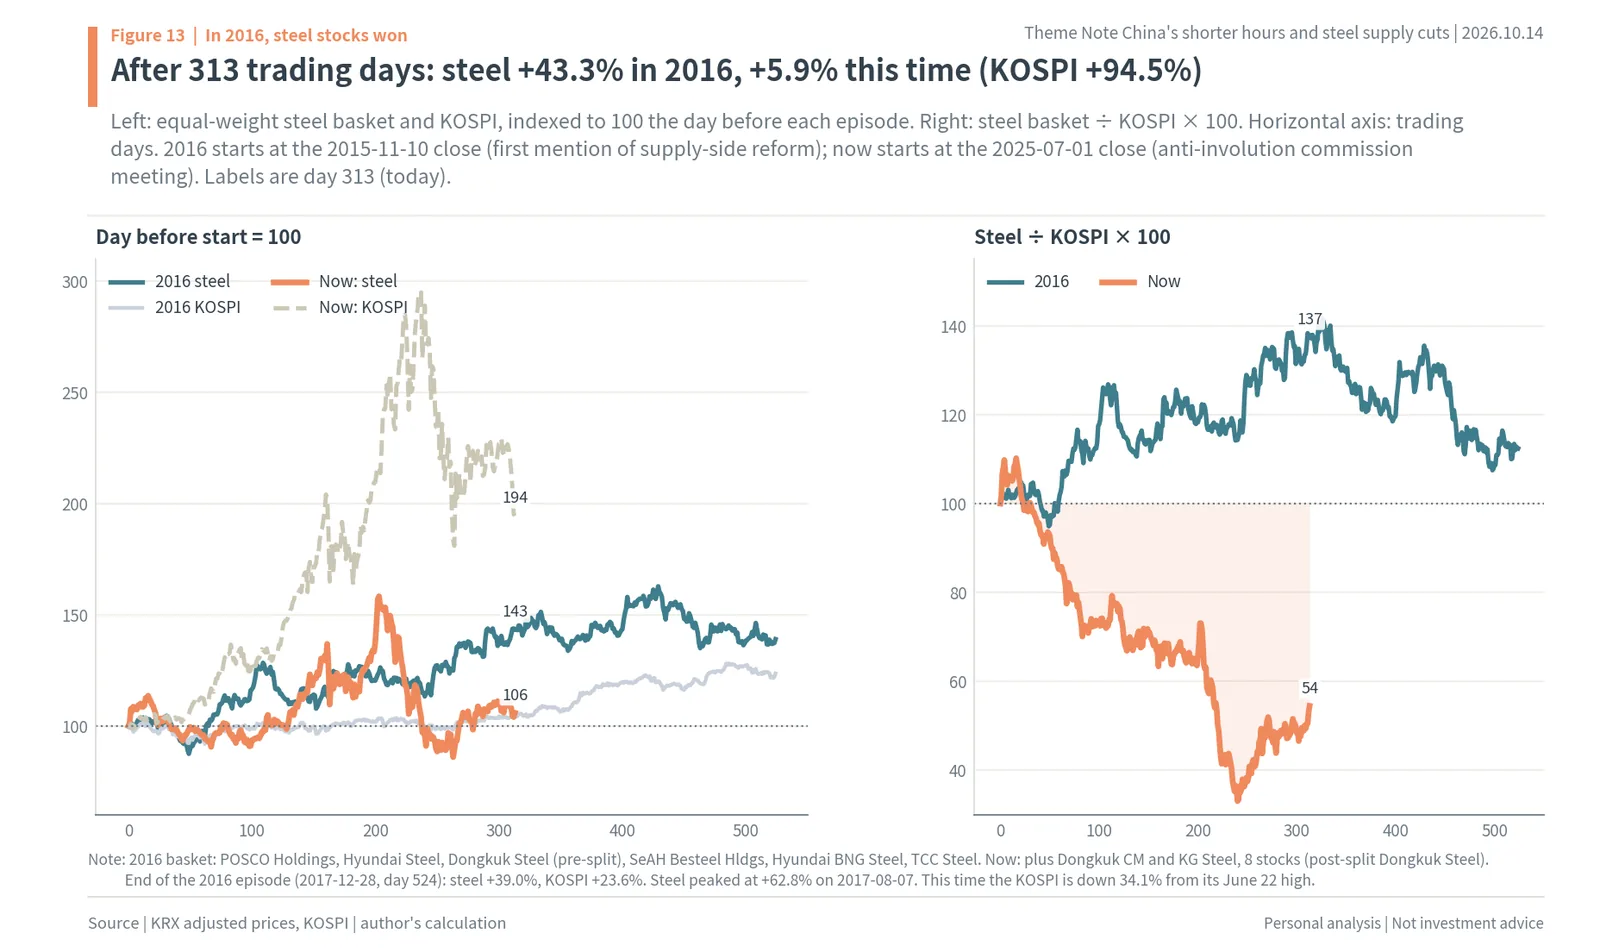
Figure 13 lays how that chain showed up in share prices over the current episode. The left side shows the Korean steel basket and the KOSPI indexed to 100 on the day before each episode began. The 2016 episode starts from the close of November 10, 2015, when President Xi first spoke of supply-side reform, and its basket holds six stocks in equal weights: POSCO Holdings, Hyundai Steel, Dongkuk Steel (the pre-split company), SeAH Besteel Holdings, Hyundai BNG Steel and TCC Steel. The current episode starts from the close of July 1, 2025, the day of the anti-involution meeting of the Central Financial and Economic Affairs Commission, and its basket adds Dongkuk CM and KG Steel for eight stocks.
Today is trading day 313 of the current episode. On day 313 of the 2016 episode (February 16, 2017), the steel basket was up 43.3% and the KOSPI up 4.3%. On day 313 of the current episode, today, the steel basket is up 5.9% and the KOSPI up 94.5%. In 2016 steel led the KOSPI by 39.0 percentage points; this time it trails by 88.6 points. The 2016 episode ended on December 28, 2017 (trading day 524) with steel up 39.0% and the KOSPI up 23.6%, and steel peaked at +62.8% on August 7, 2017.
The right side is the steel basket divided by the KOSPI times 100. A value above 100 means steel rose more than the KOSPI. In the 2016 episode it crossed 100 within a few months after the start, stood at 137.4 on day 313 and 112.4 at the end. In the current episode it briefly topped 100 right after the start, then kept falling and is 54.5 on day 313. This time the KOSPI, led by semiconductors, climbed to 9,114.55 on June 22, 2026 and has since fallen 34.1%. Steel did not keep up on the way up, and it fell less on the way down. Since the KOSPI high on June 22, the steel basket has risen 1.8%.

Figure 14 breaks it down by stock. The left side is the 2016 episode (November 10, 2015 → December 28, 2017): POSCO Holdings +91.1%, Dongkuk Steel (the pre-split company, today’s Dongkuk Holdings) +65.2%, Hyundai BNG Steel +18.1%, Hyundai Steel +15.1%, SeAH Besteel Holdings +6.6% and TCC Steel +5.9%. The gray dashed line is the KOSPI’s 23.6% over the same period. The right side is the current episode (July 1, 2025 → October 14, 2026). SeAH Besteel Holdings rose 40.5% and POSCO Holdings 12.0%, and all the others fell: Hyundai Steel -5.8%, Hyundai BNG Steel -6.4%, Dongkuk Steel -7.2%, KG Steel -11.5%, TCC Steel -14.9% and Dongkuk CM -21.9%. Over the same period the KOSPI rose 94.5%.
Putting the two episodes side by side shows where things stand now. In 2016 it took less than a year for China’s cuts to pass through steel prices to Korean steelmakers’ profits and then to share prices. This time Chinese output has fallen for two years, utilization is down, exports are under licensing, Korea has built a duty wall and domestic prices have started to rise, yet steel stocks are near the starting line. The supply picture is the same, but share prices do not yet reflect it. That means there is something left. The next chapter works out where among the eight companies the largest share of it remains.
Steel price lever: a 1% price rise is 18.3% of Dongkuk CM’s market cap, 7.2% Dongkuk Steel, 6.0% Hyundai Steel
What China’s cuts and the duty wall give Korean steelmakers is price. Even making the same products in the same plants and selling the same volume, profit grows when prices rise. So the question for picking beneficiaries becomes: when prices rise, whose profit, and whose share price, moves the most? This chapter asks that question of the eight companies with the same yardstick.
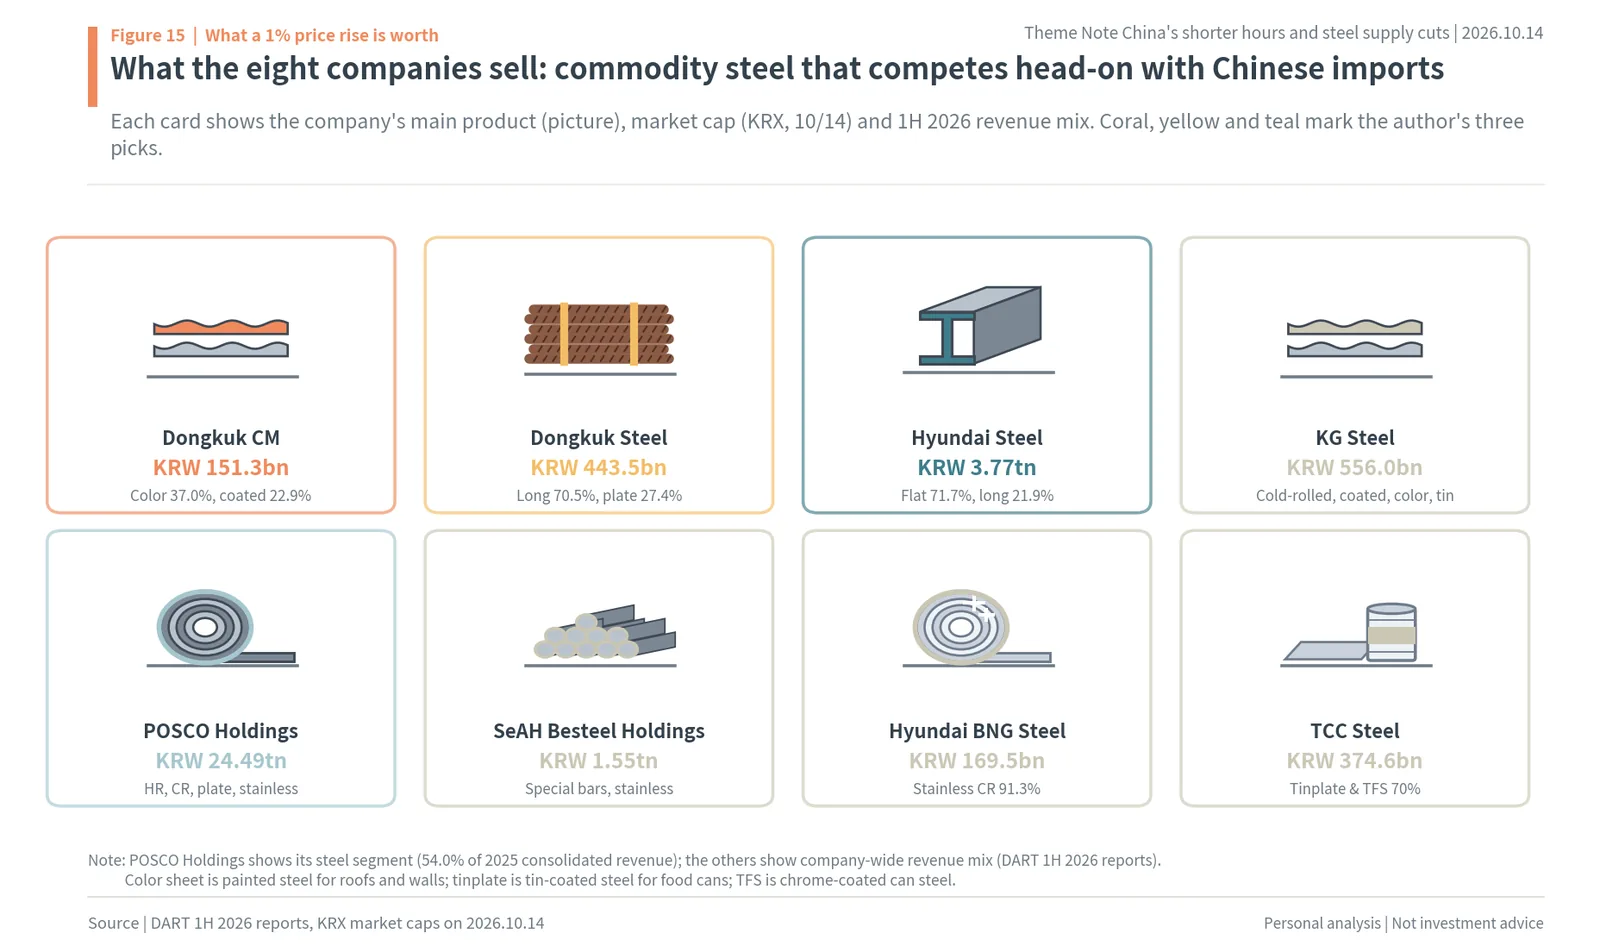
Figure 15 shows what the eight companies sell. Dongkuk CM sells color sheet for roofs and walls (37.0% of first-half revenue) and cold-rolled galvanized sheet (22.9%). Dongkuk Steel sells long products such as rebar and sections (70.5%) and plate (27.4%), with 82.7% of revenue at home. Hyundai Steel sells flat products (71.7%) and long products (21.9%). KG Steel sells cold-rolled, coated, color and tinplate sheet; POSCO Holdings, in its steel segment, sells hot-rolled, cold-rolled, plate and stainless steel; SeAH Besteel Holdings sells special steel bars and stainless; Hyundai BNG Steel sells stainless cold-rolled steel (91.3%); and TCC Steel sells tinplate for food cans and chrome-coated can steel (TFS, 70%). All eight sell commodity steel that competes head-on with Chinese imports, and most of those products are under an anti-dumping ruling or investigation.
The yardstick is simple. If prices rise 1% with costs unchanged, 1% of revenue goes straight into operating profit. That amount is calculated from 2025 revenue (for POSCO Holdings, the steel segment after intra-group eliminations) and divided by market cap (at the October 14 KRX close) and by 2025 operating profit. Divided by market cap, it shows how strongly the share price feels a 1% price rise; divided by operating profit, how much profit swings with a 1% price rise. Both measure how large revenue is relative to market cap or profit, so the bigger a company’s revenue is relative to its valuation, the higher the value.

The left side of Figure 16 is a 1% price rise divided by market cap. Dongkuk CM is highest at 18.3%: a 1% price rise is worth KRW 27.7bn, against a market cap of KRW 151.3bn. Its revenue (KRW 2.7687tn, about $2.07bn) is 18.3 times its market cap. Then come Dongkuk Steel at 7.2% (KRW 32.0bn ÷ KRW 443.5bn), Hyundai Steel at 6.0% (KRW 227.3bn ÷ KRW 3.7698tn), KG Steel at 5.7%, Hyundai BNG Steel at 4.4%, SeAH Besteel Holdings at 2.4%, TCC Steel at 1.6% and POSCO Holdings at 1.5%. POSCO Holdings’ steel segment revenue is over KRW 37tn, so its 1% price rise of KRW 372.8bn is the largest of the eight in won, but with a market cap of KRW 24.4856tn (about $18.3bn) it is the smallest as a ratio.
The right side is a 1% price rise divided by 2025 operating profit. Hyundai Steel is highest at 104%. Its 2025 operating profit was KRW 219.2bn, and a 1% price rise is worth KRW 227.3bn, so a price rise of just 1% would more than double its profit. Then come Dongkuk Steel at 54%, SeAH Besteel Holdings at 37%, Hyundai BNG Steel at 29%, KG Steel at 21% and POSCO Holdings at 20%. Dongkuk CM and TCC Steel had operating losses in 2025 and are left out of this ratio. Dongkuk CM went from an operating loss of KRW 38.8bn in 2025 to an operating profit of KRW 30.0bn in the first half of 2026.
A 1% price rise is a small assumption. Shinhan Securities expects 2027 to be the first year that fully reflects anti-dumping duties on Chinese coated and color sheet for KG Steel, and expects the normalization of domestic prices from the duties to lift selling prices by 3% or more. Applying the same 3% to the three companies gives KRW 83.1bn at Dongkuk CM, KRW 96.1bn at Dongkuk Steel and KRW 682.0bn (about $509mn) at Hyundai Steel (author’s calculation, assuming unchanged costs). Against October 8 distribution prices 10.8% higher than a year earlier for hot-rolled and 20.4% for rebar, 1% to 3% is a conservative number.

Figure 17 puts the two questions on one chart. The horizontal axis is a 1% price rise divided by market cap, the vertical axis is the share price change in the current episode (July 1, 2025 → October 14, 2026), and circle size is market cap. In the bottom right, where the lever is large and the share price has still fallen, sit Dongkuk CM (18.3%, -21.9%), Dongkuk Steel (7.2%, -7.2%) and Hyundai Steel (6.0%, -5.8%). SeAH Besteel Holdings in the top left (2.4%, +40.5%) has already risen on hopes for special steel bar anti-dumping duties, and POSCO Holdings (1.5%, +12.0%) has a small lever for its size. The KOSPI rose 94.5% over the same period.
The conclusion of this chapter is clear. The companies whose share prices stand to gain most from the price rise created by China’s cuts and the duty wall are those where a 1% price rise is large against market cap but the share price does not yet reflect it. Of the eight, the ones that fit are Dongkuk CM, Dongkuk Steel and Hyundai Steel. The next chapter looks at the three one by one.
Dongkuk CM, Dongkuk Steel and Hyundai Steel: first in line to fill the gap left by Chinese steel
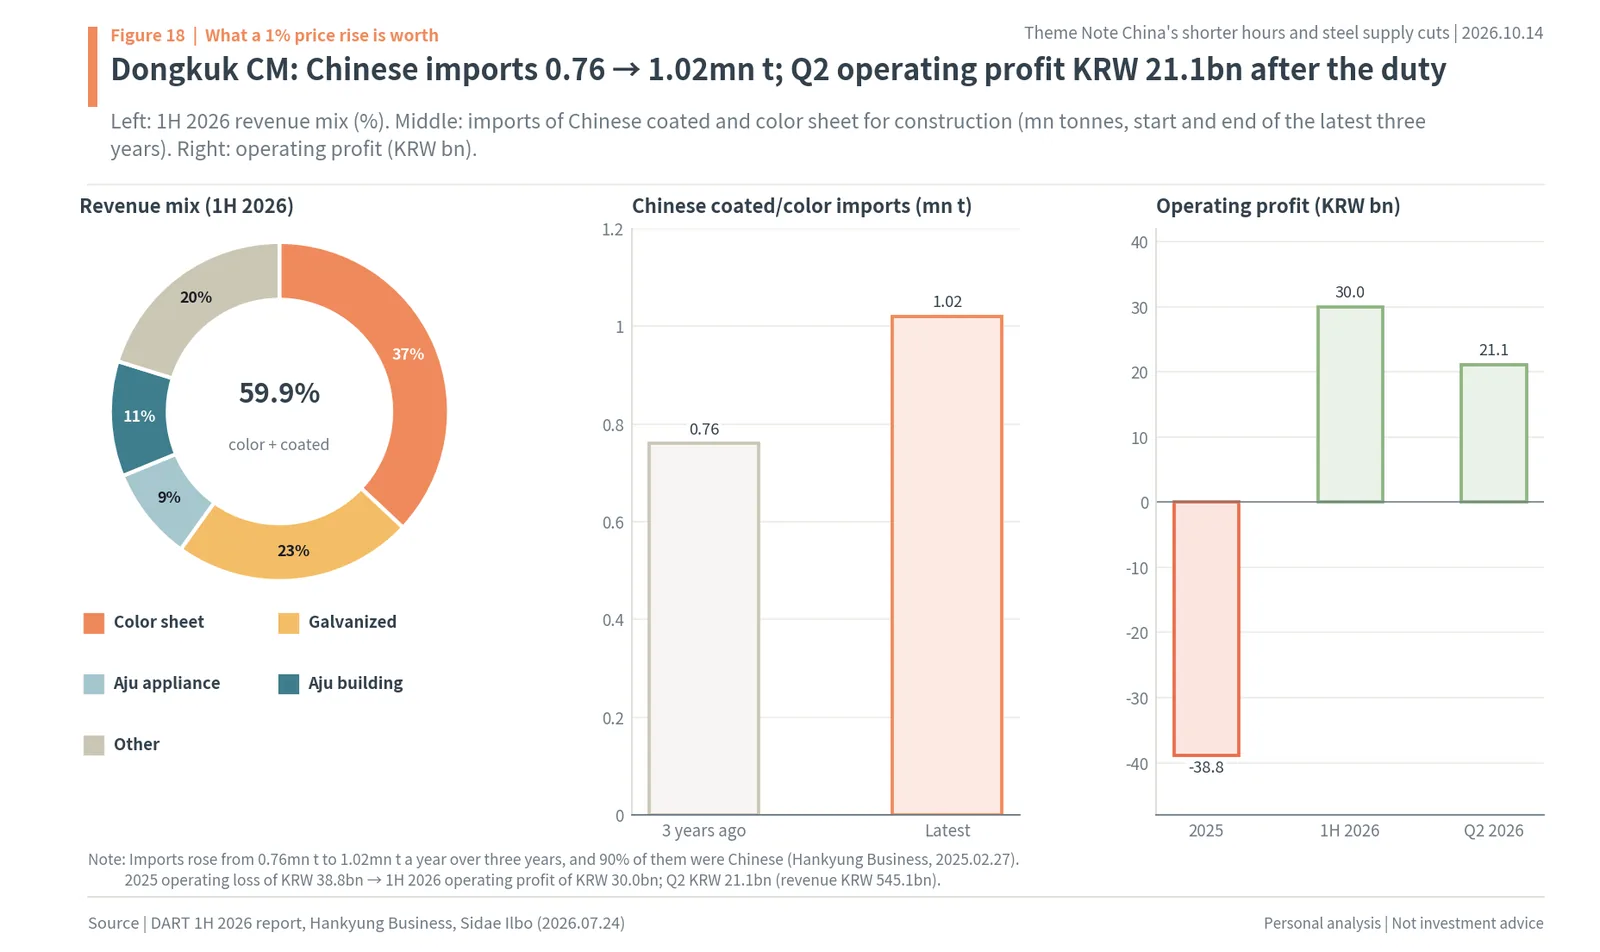
Dongkuk CM was spun off from Dongkuk Steel in June 2023 with the cold-rolled and color sheet business. As the left side of Figure 18 shows, 37.0% of its first-half 2026 revenue came from color sheet and 22.9% from cold-rolled galvanized sheet, 59.9% combined. The rest is appliance (8.9%) and building (11.0%) sheet from its subsidiary Aju Steel, and other items. Color sheet is galvanized steel with a painted finish, used for the roofs and walls of factories and warehouses and for appliance exteriors.
This market was hit hardest by Chinese imports. Hankyung Business reported in February 2025 that imports of coated and color sheet for construction rose 34.2% over the last three years, from 760,000 tonnes to 1.02mn tonnes a year, and that 90% of the imports were Chinese. The middle chart shows those numbers. Dongkuk CM, KG Steel and SeAH CM applied for an anti-dumping investigation, and after an affirmative preliminary ruling by the commission in April, provisional duties of 22.34% to 33.67% took effect in June. Market research firm SMM counted China’s galvanized steel exports to Korea falling by about 100,000 tonnes in June.
The effect showed up in profit right away. As the right-hand chart shows, Dongkuk CM went from an operating loss of KRW 38.8bn in 2025 to an operating profit of KRW 30.0bn in the first half of 2026, and in the second quarter posted revenue of KRW 545.1bn and operating profit of KRW 21.1bn. Sidae Ilbo reported that the profitability of its domestic sales improved as provisional anti-dumping duties on Chinese coated and color sheet reduced the supply of low-priced commodity products. Dongkuk CM’s 1% price rise is worth KRW 27.7bn, 18.3% of its KRW 151.3bn market cap. For a company whose revenue is 18.3 times its market cap, a small move in prices moves profit and valuation a lot. The final ruling on coated and color sheet, due in October, is the next milestone.
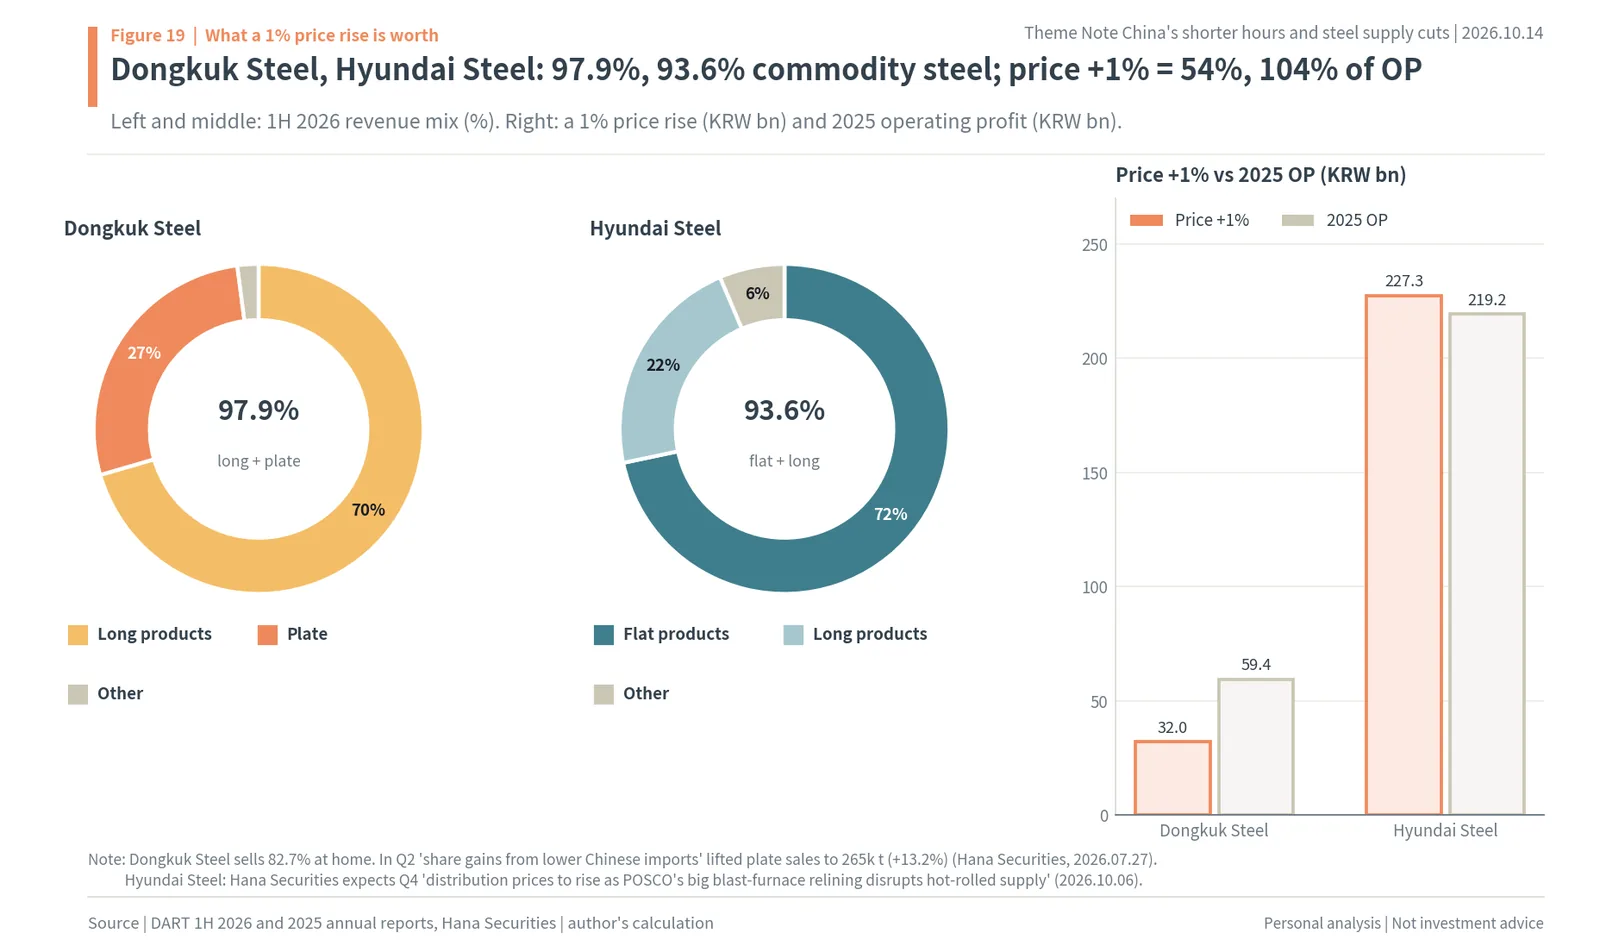
Dongkuk Steel is the post-split company that took rebar, sections and plate in June 2023. As the left side of Figure 19 shows, 70.5% of its first-half 2026 revenue came from long products and 27.43% from plate, 97.9% combined, and 82.7% of revenue is domestic. Chinese H-beams carry anti-dumping duties of 28.23% to 32.72%, with a five-year extension recommended on September 17, and Chinese plate has carried 27.91% to 34.10% since the August 2025 final ruling. Hana Securities said Dongkuk Steel’s second-quarter operating profit of KRW 45.6bn beat market expectations (KRW 33.7bn), and that “market share gains from lower Chinese imports” lifted plate sales to 265,000 tonnes (+13.2% year on year). Quarterly operating profit went from KRW 21.4bn in the first quarter to KRW 45.6bn in the second. A 1% price rise is worth KRW 32.0bn, 7.2% of its KRW 443.5bn (about $331mn) market cap and 54% of its 2025 operating profit of KRW 59.4bn. Hana Securities’ target price is KRW 14,000 (about $10.5), against an October 14 close of KRW 8,940 (about $6.7).
Hyundai Steel is a steelmaker with both blast furnaces and electric arc furnaces. As the middle chart shows, 71.7% of its first-half 2026 revenue came from flat products and 21.9% from long products, 93.6% combined. Hot-rolled, plate, cold-rolled, rebar and H-beams are all products covered by this round of anti-dumping cases or made from them. As the right-hand chart shows, a 1% price rise (KRW 227.3bn) is larger than its 2025 operating profit (KRW 219.2bn), at 104% of operating profit. Of the eight companies, its profit swings the most with price. Hana Securities expects “distribution prices to rise on hot-rolled supply disruptions from POSCO’s large-scale blast furnace relining” in the fourth quarter, and forecasts fourth-quarter sales of 4.5mn tonnes and operating profit of KRW 156.4bn. Shinhan Securities sees 2027 operating profit at KRW 693.8bn. A 1% price rise is 6.0% of its KRW 3.7698tn (about $2.82bn) market cap.
The three companies have three things in common. First, almost everything they sell is commodity steel that competes head-on with Chinese imports. Second, each of those products carries an anti-dumping duty or faces a ruling. Third, a 1% price rise is 6% or more of their market cap, yet their shares are down 21.9%, 7.2% and 5.8% since the anti-involution meeting. They are the companies first in line in Korea to fill the gap left as China makes and exports less, and that share is not yet in their share prices.
Each company also has a different number to watch first. For Dongkuk CM, it is the October final ruling on coated and color sheet and whether quarterly operating profit stays positive after that. For Dongkuk Steel, it is the H-beam duty extension, whether plate sales keep growing, and long-product utilization. For Hyundai Steel, it is whether flat-product distribution prices rise while hot-rolled supply drops out during the relining of POSCO’s Gwangyang No. 2 blast furnace in the fourth quarter. As these three numbers are confirmed one by one, the sequence in which the 1% price lever passes to profit, and profit to share prices, begins.
KG Steel, Hyundai BNG Steel, SeAH Besteel Holdings, TCC Steel and POSCO Holdings: same tailwind, smaller lever
The yardstick for picking the three was the size of a 1% price rise and how much the share price reflects it. The other five companies get the same tailwind. China making and exporting less and Korea building a duty wall applies to all eight. What differs is how much valuation moves when prices move, and how much of the tailwind the share price already holds. This chapter looks at the five in order of their lever.
KG Steel, formerly Dongbu Steel, makes cold-rolled, coated, color and tinplate sheet. Its 2025 revenue was KRW 3.1934tn and operating profit KRW 150.7bn. A 1% price rise is worth KRW 31.9bn, 5.7% of its KRW 556.0bn (about $415mn) market cap and 21% of 2025 operating profit. It applied for the anti-dumping case on Chinese coated and color sheet together with Dongkuk CM, and Shinhan Securities, which sees 2027 as the first year that fully reflects the duties, expects prices to rise 3% or more and operating profit to reach KRW 169.8bn. Exports were 53.1% of sales in the second quarter, so the gain from higher domestic prices applies to just under half of revenue. Its share price is down 11.5% in this episode.
Hyundai BNG Steel was the first Korean maker of stainless cold-rolled steel, which made up 91.3% of its first-half 2026 revenue. Its 2025 revenue was KRW 741.3bn and operating profit KRW 25.9bn. In its half-year report the company described the Korean stainless market as highly competitive because of the “continued inflow of low-priced imports, including from China”. On the Chinese side, Tsingshan and two other producers jointly cut more than 300,000 tonnes of 200-series stainless in October 2025, and China’s stainless exports fell 17.6% in the first half of 2026. A 1% price rise is worth KRW 7.4bn, 4.4% of its KRW 169.5bn market cap and 29% of 2025 operating profit. Its share price is down 6.4% in this episode.
SeAH Besteel Holdings is the holding company for SeAH Besteel, Korea’s top special steel bar maker, and SeAH Changwon Integrated Special Steel, which makes stainless and special alloys. Its 2025 revenue was KRW 3.6516tn and operating profit KRW 98.4bn. Of Korea’s 2.75mn tonnes of special steel bar demand, 650,000 tonnes (24%) are Chinese, 90% of imports are Chinese, and SeAH Besteel sells 1.6mn tonnes at home. A preliminary ruling of 25.08% to 27.96% on Chinese special steel bars came on September 17, and Hanwha Investment & Securities sees 2027 operating profit at KRW 195.0bn (+41.9%). A 1% price rise is worth KRW 36.5bn, 2.4% of its KRW 1.5492tn market cap and 37% of 2025 operating profit. But its share price has already risen 40.5% in this episode, pricing in the anti-dumping hopes first.
TCC Steel makes tinplate and chrome-coated can steel (TFS) for food cans, which together are 70% of revenue. Its 2025 revenue was KRW 611.5bn, with an operating loss of KRW 10.9bn. Chinese tinplate imports rose from 29,000 tonnes in 2022 to 47,000 tonnes in 2023, and the commission opened a dumping investigation into Chinese tinplate on July 23, 2026, with a final ruling due in April 2027. A 1% price rise is worth KRW 6.1bn, 1.6% of its KRW 374.6bn market cap. Its share price is down 14.9% in this episode.
POSCO Holdings is Korea’s largest steelmaker and a holding company that also owns lithium and battery materials businesses. Its 2025 steel segment revenue (after intra-group eliminations) was KRW 37.2849tn, 54.0% of consolidated revenue, and 50.6% in the first half of 2026. Its carbon steel selling price rose from KRW 920,000 per tonne in the first quarter to KRW 962,000 in the second, and Hana Securities, citing “tighter regulation of Chinese steel imports”, sees a high likelihood of better results next year as well and set a target price of KRW 740,000 (about $553). A 1% price rise is worth KRW 372.8bn, the largest of the eight and 20% of 2025 consolidated operating profit of KRW 1.8271tn, but with a market cap of KRW 24.4856tn it is 1.5% of valuation. In the 2016 episode it rose 91.1%, the most of the six stocks; in this episode it is up 12.0%.
Setting the five beside the three makes the yardstick’s meaning clear. The tailwind from China’s cuts and the duty wall blows on all eight, but how much market cap feels a 1% price rise ranges more than twelvefold, from 18.3% at Dongkuk CM to 1.5% at POSCO Holdings. And the share prices of SeAH Besteel Holdings (+40.5%), which already holds the tailwind, and Dongkuk CM (-21.9%), which does not yet, point in opposite directions. The companies that catch the same wind with the biggest sail, at the lowest price, are Dongkuk CM, Dongkuk Steel and Hyundai Steel.
Eight signals to watch: China’s hours, crude steel, exports, mill profits and Korean steel prices
This report’s chain is “China works less → makes less → exports less → Korean prices rise”. The author tracks whether that chain holds through eight numbers. Figure 20 draws them as gauges. A needle in the green zone means China’s supply cuts are continuing, and the gray text at the top is when the next reading comes out.
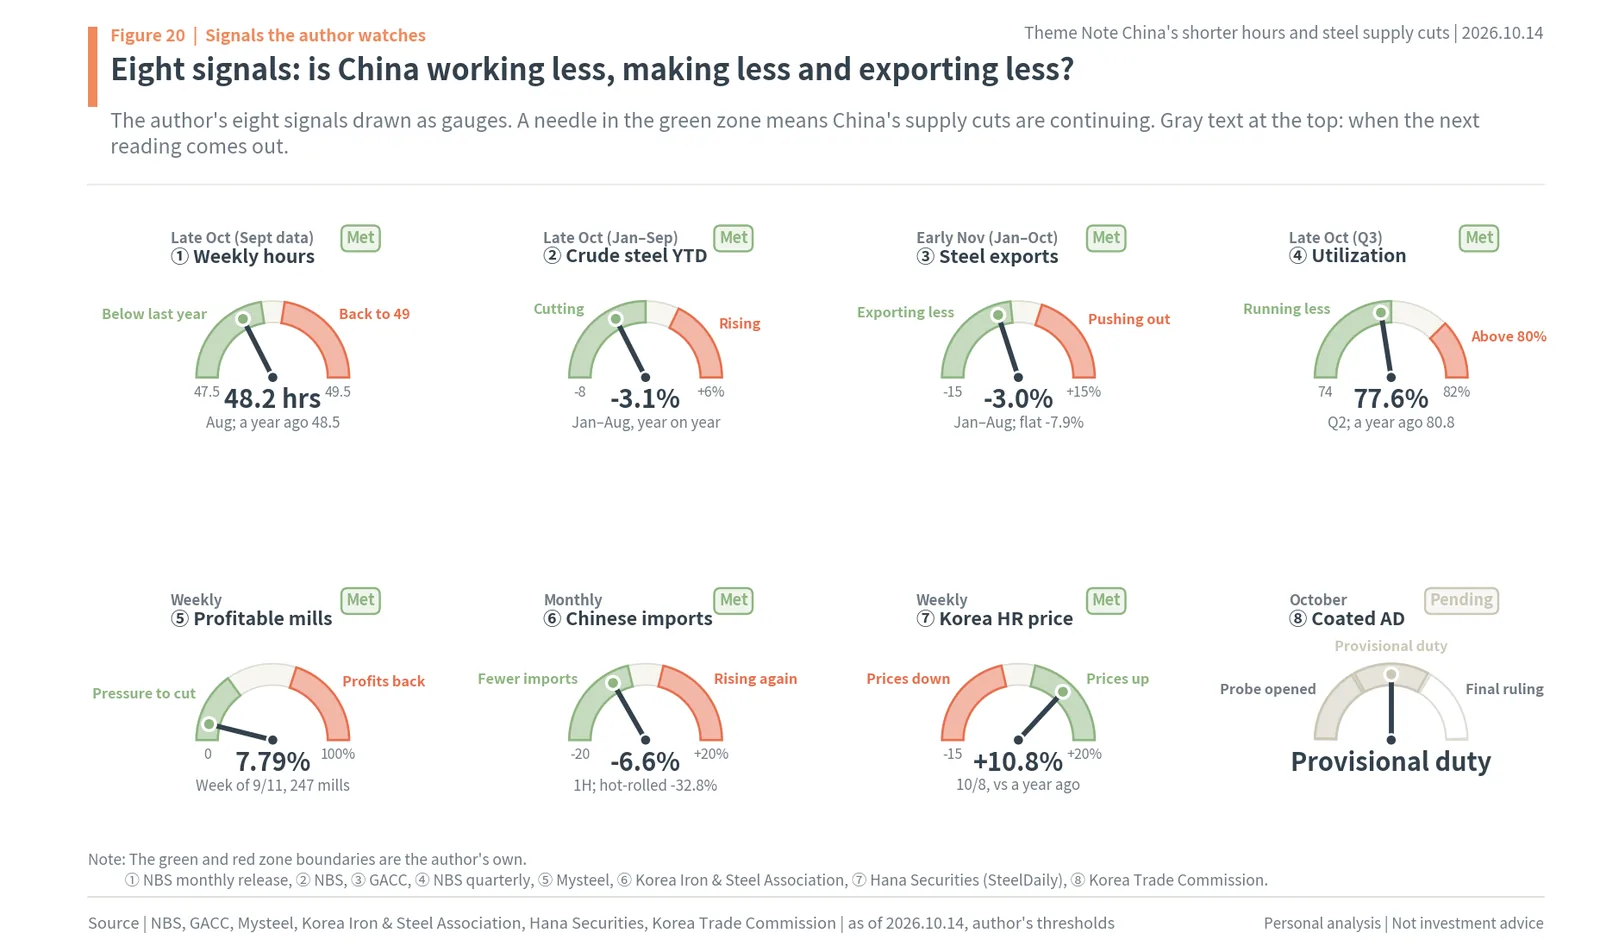
The first is China’s weekly working hours: 48.2 hours in August, shorter than the same month a year earlier (48.5 hours). The September value comes with the NBS national economy release in late October. The second is China’s year-to-date crude steel output: -3.1% for January to August, with January to September also due in late October. The third is China’s year-to-date steel exports: -3.0% for January to August, flat products -7.9%, with January to October due from customs in early November. The fourth is China’s steel utilization: 77.6% in the second quarter, below a year earlier (80.8%), with the third-quarter value due in late October alongside third-quarter GDP.
The fifth is the share of profitable mills: 7.79% of 247 mills in the week of September 11. The lower it is, the greater the pressure to cut. Mysteel publishes it weekly. The sixth is Korea’s imports of Chinese steel: -6.6% in the first half, hot-rolled -32.8%, published monthly by the Korea Iron & Steel Association. The seventh is Korea’s hot-rolled distribution price: 10.8% higher than a year earlier on October 8, published weekly by SteelDaily. The eighth is the anti-dumping case on coated and color sheet: it has passed the investigation and provisional duty stages, and the October final ruling remains.
The eight numbers follow the order of the chain. Working hours and utilization are the cause: they are the first to show whether factories are running less. Crude steel output and steel exports are the volume: they show whether factories running less really make and export less. The share of profitable mills tells whether pressure remains for that volume to keep shrinking. Korea’s imports of Chinese steel and its hot-rolled distribution price are the arrival: they show whether the volume China cut turns into prices in the Korean market. The final anti-dumping ruling is the wall: it tells whether the reduced volume is kept from coming back in another way. If all eight are green from cause to arrival, the chain is holding without a break.
Besides these eight numbers there are scheduled events. According to Hana Securities, POSCO’s Gwangyang Works No. 2 blast furnace goes into relining from November, and three hot-rolled mills at Gwangyang go into maintenance. Provisional duties on special steel bars are expected around mid-November, with the final ruling in February 2027. The US-China trade truce has been extended to January 10, 2027, and the EU Forced Labour Regulation applies from December 14, 2027.
The author’s judgment is this. China’s falling working hours are a number in which the government’s crackdown on involution and factories’ shrinking orders overlap, and factories running less are making and exporting less steel first. Korea has built an anti-dumping wall on top of that, and domestic prices have started to rise. In the same scene in 2016, steel stocks pulled far ahead of the KOSPI within a year, but this time steel stocks are still near the starting line. The author sees Dongkuk CM, Dongkuk Steel and Hyundai Steel, where a 1% price rise is biggest against market cap, as the ones set to collect what is left of China’s cuts, and checks every month whether the eight signals above stay in the green.
Data and methods: average working hours, the equal-weight steel basket and the 1% price rise
The numbers in this report come from only two places. One is sourced facts (NBS and Chinese customs releases, press reports, DART filings and broker reports); the other is values the author calculated from KRX prices and filed figures. The calculation methods are gathered here.
Working hours are the NBS “average weekly working hours of enterprise employees nationwide” from the monthly national economy releases, collected from February 2023 to August 2026. January values are not in the monthly releases, so only January 2025 (49.1 hours) uses the Reuters and Trading Economics value. The March to August average is the simple average of the six months from March to August of each year, and the multiple of the drop is (2025 average – 2026 average) ÷ (2024 average – 2025 average). “The end of nine straight years of increases” follows the summaries by HK01 and the Economic Observer. The 48.6 hours for 2025 and 49.0 hours for 2023 and 2024 that the press uses as annual values are the December values in the NBS annual releases.
Spending per National Day trip is total domestic travel spending over the holiday, as published by the Ministry of Culture and Tourism, divided by person-trips. 2026 is a 7-day holiday with 826mn person-trips and CNY 738.375bn; 2025 is an 8-day holiday (National Day and Mid-Autumn Festival) with 888mn person-trips and CNY 809.006bn.
The steel basket holds its stocks in equal weights, rebalanced daily. A stock with zero trading volume on a given day is dropped from that day’s average. The 2016 basket is six stocks: POSCO Holdings, Hyundai Steel, Dongkuk Steel (the pre-split company, today’s Dongkuk Holdings), SeAH Besteel Holdings, Hyundai BNG Steel and TCC Steel. KG Steel is left out because, as Dongbu Steel in 2016, it went through a capital reduction and workout that broke its adjusted price series. The current basket is eight stocks: POSCO Holdings, Hyundai Steel, Dongkuk Steel (the post-split company), KG Steel, SeAH Besteel Holdings, Dongkuk CM, Hyundai BNG Steel and TCC Steel. Prices are daily closes from the KRX Data System from January 2, 2015 to October 14, 2026, using adjusted prices that reflect base-price adjustments through KRX daily returns.
The 2016 episode starts at the close of November 10, 2015 (President Xi’s first mention of supply-side reform) and the current episode at the close of July 1, 2025 (the anti-involution meeting of the Central Financial and Economic Affairs Commission). The two episodes are aligned by trading-day count, and today (October 14, 2026) is trading day 313 of the current episode. Day 313 of the 2016 episode is February 16, 2017. The end of the 2016 episode is set at December 28, 2017 (trading day 524). Steel ÷ KOSPI × 100 is the basket value divided by the KOSPI value on the same day.
A 1% price rise is 1% of 2025 revenue (DART 2025 annual reports). It means operating profit grows by that much assuming costs and volumes stay the same; in reality, raw material prices and volumes move too. POSCO Holdings uses steel segment revenue after intra-group eliminations (KRW 37.2849tn), and the other seven companies use consolidated revenue. Market cap is the October 14, 2026 KRX close times listed shares. A 1% price rise ÷ 2025 operating profit is calculated only for the six companies with a 2025 operating profit. The 3% amounts borrow Shinhan Securities’ estimate for KG Steel of “a selling price rise of 3% or more from anti-dumping duties” and apply the same rate to the three companies.
China’s crude steel, steel exports, utilization and producer prices are NBS and customs figures as reported by Argus, Caixin, Mysteel, SteelOrbis and GMK. Crude steel output for 2016 and steel exports for 2016, 2018 and 2019 are left out of the charts because no same-basis values were found. The destinations of China’s 2025 steel exports are SMM data, and “Other” is the total minus the five countries. Korea’s anti-dumping duty rates follow reports of Korea Trade Commission rulings by Aju Business Daily, Segye Ilbo, Money Today and Financial News, and Hanwha Investment & Securities materials. Dollar conversions use KRW 1,339.1 per dollar (Yahoo Finance, October 14, 2026).
Wrap-up: China works less and makes less steel; Dongkuk CM, Dongkuk Steel and Hyundai Steel have yet to rise
Maochaedung’s take. Weekly working hours of China’s enterprise employees rose for nine years from 2016 and then turned down; from March to August this year every month was 0.3 to 0.4 hours shorter than a year earlier, taking the March to August average from 48.70 hours in 2023 to 48.15 hours in 2026. Since July 2024 the government has moved to stop involution-style competition and ban illegal overtime, and in July 2025 it decided to retire outdated capacity, while factories cut overtime first as orders shrank. So second-quarter industrial utilization was 73.0% and steel 77.6%, 3.2 points lower than a year earlier; crude steel fell 4.4% in 2025 and another 3.1% in January to August this year; steel exports under licensing fell 3.0% in January to August (flat products -7.9%); and with only 7.79% of mills profitable, the industry declared its own output cuts on September 15. Korea issued final anti-dumping rulings on plate and hot-rolled steel and put provisional duties on coated and color sheet, so first-half hot-rolled imports fell 32.8% and domestic distribution prices rose (rebar +20.4%, hot-rolled +10.8%). In the same scene in 2016, six Korean steel stocks rose 43.3% in 313 trading days (KOSPI +4.3%), but this time the 313 days have brought +5.9% (KOSPI +94.5%), still near the starting line. The author sees Dongkuk CM, Dongkuk Steel and Hyundai Steel, where a 1% price rise is the biggest against market cap at 18.3%, 7.2% and 6.0% and whose shares are at -21.9%, -7.2% and -5.8%, as the ones set to collect what is left of China’s cuts.
China’s working hours, steel output cuts and Korean steel stocks FAQ
Q. Are China’s working hours really falling?
Yes. The NBS average weekly working hours of urban enterprise employees rose for nine years from 2016 to peaks of 49.0 hours in December 2023 and December 2024 and 49.1 hours in January 2025, then fell to 48.2 hours in August 2026. Every month from March to August 2026 was 0.3 to 0.4 hours shorter than a year earlier, and the March to August average fell from 48.70 hours in 2023 to 48.15 hours in 2026.
Q. Why are China’s working hours falling?
Two forces point the same way. The government has moved against involution-style competition since July 2024, said working hours must not be illegally extended in March 2025, and decided to retire outdated capacity on July 1, 2025. At the same time orders have shrunk: Q2 2026 GDP growth was 4.3%, August retail sales grew 0.4%, and overtime above the 44-hour legal week fell 7.2% on the March to August average.
Q. How does China’s shorter working week affect steel?
Steel is cut first. China’s steel utilization was 77.6% in Q2 2026, 3.2 percentage points below a year earlier; crude steel fell 4.4% to 961mn tonnes in 2025 and another 3.1% in January to August 2026; and steel exports, which hit a record 119mn tonnes in 2025, fell 3.0% under export licensing. Only 7.79% of 247 mills were profitable in the week of September 11, and CISA announced self-imposed output cuts on September 15.
Q. How did Korean steel stocks do in China’s 2016 supply-side reform?
Six Korean steel stocks in equal weights rose 43.3% in the first 313 trading days after November 10, 2015, while the KOSPI rose 4.3%; POSCO Holdings rose 91.1% over the whole episode to December 28, 2017. In the 313 trading days since July 1, 2025, eight steel stocks are up 5.9% while the KOSPI is up 94.5% (author’s calculation from KRX adjusted prices).
Q. Which Korean steel stocks gain most from higher steel prices?
With costs unchanged, a 1% price rise adds 1% of 2025 revenue to operating profit. That is KRW 27.7bn, or 18.3% of market cap, at Dongkuk CM; 7.2% at Dongkuk Steel; and 6.0% at Hyundai Steel, where it is also 104% of 2025 operating profit. Their shares are down 21.9%, 7.2% and 5.8% since July 1, 2025, while POSCO Holdings’ ratio is 1.5% and SeAH Besteel Holdings has already risen 40.5% (author’s calculation).
Sources
- China National Bureau of Statistics, monthly national economy releases (weekly hours of enterprise employees, 2023.02 to 2026.08), quarterly industrial capacity utilization and GDP (https://www.stats.gov.cn/sj/zxfb/202609/t20260915_1965307.html and others), 2023.03 to 2026.09
- HK01, 48.6 hours a week in 2025 ends nine straight years of increases (link), 2026.01.28
- Economic Observer (republished by Huxiu), falling working hours and interview with Dong Baohua (link), 2026.06.29
- Xinhua, Politburo meeting on preventing involution-style vicious competition (link), 2024.07.30
- General Offices of the CPC Central Committee and the State Council, special action plan to boost consumption (link), 2025.03.16
- People’s Daily Online, sixth meeting of the Central Financial and Economic Affairs Commission (link), 2025.07.01
- State Council, approval of the 15th Five-Year plan to expand consumption, Guohan [2026] No. 66 (link), 2026.07.13
- Reuters, Chinese companies cutting overtime (link), 2025.04.09
- Trading Economics, China youth unemployment rate (link), accessed 2026.10.14
- Argus, Mysteel, SteelOrbis (citing NBS and customs), China crude steel output and steel exports (https://www.mysteel.net/news/5141007-nbs-chinas-crude-steel-output-over-jan-aug-falls-31-yoy, https://www.mysteel.net/news/5140089-gacc-chinas-steel-exports-fall-to-75-million-tonnes-over-january-august), 2026.09
- GMK Center, China’s steel export licensing from 2026 (link), 2025.12.12
- Tonghuashun, CISA initiative on self-imposed output and inventory cuts (link), 2026.09.15
- State Council, Document No. 6 [2016] on resolving steel overcapacity (link), 2016.02.04
- Fastmarkets, 2017 review of China’s steel capacity cuts (link), 2017.12
- POSCO Newsroom, 2017 results (link), 2018.01.24
- Aju Business Daily, final anti-dumping ruling on Chinese plate (link), 2025.08.28
- Segye Ilbo, final anti-dumping ruling on Japanese and Chinese hot-rolled steel (link), 2026.02.23
- Money Today, status of anti-dumping cases on Chinese steel (link), 2026.09.23
- Steel & Metal News (Korea Iron & Steel Association data), first-half steel imports (link), 2026.07.24
- Hana Securities, Steel & Metals Weekly (Korean distribution prices) (link), 2026.10.12
- Sidae Ilbo, Dongkuk CM returns to profit in Q2 (link), 2026.07.24
- DART, 2025 annual reports and 2026 half-year reports of POSCO Holdings, Hyundai Steel, Dongkuk Steel, KG Steel, SeAH Besteel Holdings, Dongkuk CM, Hyundai BNG Steel and TCC Steel
- NBS Department of Population and Employment Statistics, answer on the coverage of the enterprise working-hours survey (link), 2025.03.04
- China Labor Law (2018 revision, Guangdong provincial government copy) (link)
- Xinhua, full text of the 2026 Government Work Report (link), 2026.03.13
- China News Service, Henan notice on paid staggered leave (link), 2026.08.05
- DLA Piper, When flexibility turns costly (link), 2026.04.10
- eucrim, EU Forced Labour Regulation 2024/3015 (link), 2025.01.10
- China Ministry of Culture and Tourism, 2026 and 2025 National Day holiday travel data (link), 2026.10.09
- NBS, 2025 average urban wages (link), 2026.05.15
- NBS, Q2 2026 industrial capacity utilization (link), 2026.07.15
- Reuters (republished by mining.com), NDRC controls on steel output in the 15th Five-Year Plan (link), 2025.12.29
- PV Tech, eight polysilicon producers’ pricing pact (link), 2026.08
- Herald Economy (SMM data), China’s steel exports to Korea (link), 2026.02.03
- Hankyung Business, imports of Chinese coated and color sheet (link), 2025.02.27
- Hanwha Investment & Securities, preliminary anti-dumping ruling on special steel bars (link), 2026.09.21
- Eugene Investment & Securities, Steel Weekly (link), 2026.09.23
- Hana Securities company reports on POSCO Holdings (2026.10.06), Hyundai Steel (2026.10.06) and Dongkuk Steel (2026.07.27); Shinhan Securities company reports on Hyundai Steel (2026.10.12) and KG Steel (2026.07.30) (Naver Finance research)
- Photo: Zhangzj cet, The Main Plant Area of Panzhihua Iron and Steel Company (CC BY-SA 4.0, https://commons.wikimedia.org/wiki/File:The_Main_Plant_Area_of_Panzhihua_Iron_and_Steel_Company.jpg), Wikimedia Commons
- Photo: Steve Jurvetson, Electronics factory in Shenzhen (CC BY 2.0, https://commons.wikimedia.org/wiki/File:Electronics_factory_in_Shenzhen.jpg), Wikimedia Commons
- KRX Data System adjusted prices and KOSPI (closes 2015.01.02 to 2026.10.14), author’s calculation; Yahoo Finance KRW per dollar (2026.10.14)
Disclaimer
This post records the author’s personal analysis and views based on publicly available information and does not recommend any particular product or company. It does not recommend buying or selling any financial investment product and is not an investment advisory or quasi-investment advisory service.
Figures are as published at the time of writing. The ratios of a 1% price rise to market cap and operating profit, the 3% amounts, the steel basket returns and the dollar conversions were calculated by the author from public data and market prices and are not confirmed forecasts. “Author’s calculation” marks the author’s own calculations and assumptions, not confirmed facts.
Author’s interests: not disclosed
Responsibility for decisions and their outcomes lies with the reader.
As of: October 14, 2026
Was this note useful?
Thanks. Your answer helps decide what to cover next.
Korea market snapshot · Oct 23, 2026
New to Korean stocks? Start here for the basics.
Most read
1France Protests 2026: Why Students Are Blocking Schools and Which Stocks Benefit (Munich Re, SCOR)
Get the Saturday note on Korean stocks
One email every Saturday with the week’s new research on Korean listed companies and links to the updated data pages. Built from DART filings and KRX data. Free; unsubscribe in one click. See past issues