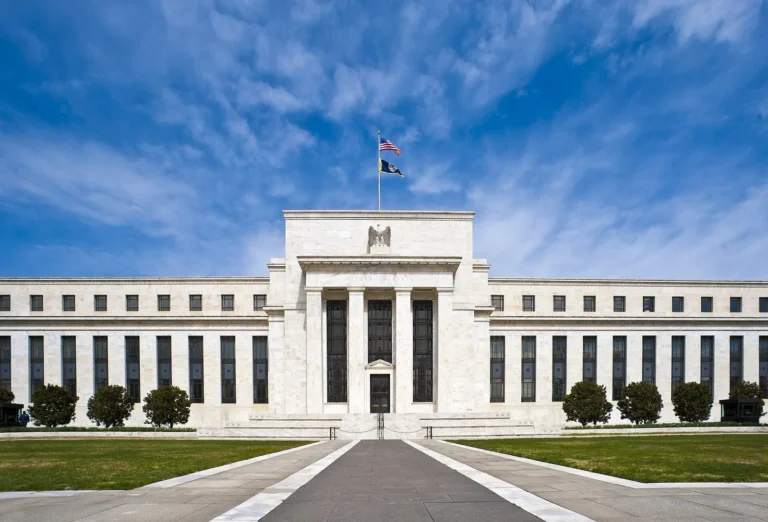
KOSPI Crash 7.57%: AI Fear Belongs to Chips, but Hanwha Ocean (042660.KS) and Korean Shipbuilders Were Sold Too, a Fear Zone at Grade 1
AI fear belongs to chips, but the KOSPI crash of October 15, 2026 took Korea’s shipbuilders down too. The KOSPI fell 7.57% to 5,554.22 on US inflation and AI doubts, and Hanwha Ocean fell 7.42% even though foreigners were net buyers of the four big shipbuilders. This report checks the sell-off against 19 global indexes, Korea’s 46.9% concentration in two chip stocks, the Korea-US rate gap and the won, Hanwha Ocean’s dollar revenue, and a Shipbuilding Expectation Index the author built with the same formula as the K-Expectation Index 2.0. Numbers as of October 15, 2026.
- The KOSPI fell 7.57% to 5,554.22 and 20.7% in seven trading days, with circuit breakers in both the KOSPI and KOSDAQ, after US September CPI of 3.7% lifted October Fed hike odds from 22.1% to 33.2% and Gartner warned of $3.5tn of AI assets at risk of impairment.
- Foreigners sold KRW 3.77tn (about $2.8bn) today and KRW 17.99tn in seven trading days; abroad, chip-heavy markets averaged -4.95% and chip-light markets -0.24%, but Samsung Electronics and SK hynix are 46.9% of the KOSPI.
- Hanwha Ocean fell 7.42% to KRW 62,400 (about $46.4) even though foreigners were net buyers of KRW 12bn across the four shipbuilders; its trading value was only 39% of its 120-day average, so buyers vanished rather than sellers piling in.
- A real US hike widens the rate gap and weakens the won (USD/KRW +18.6% in 2022), and a 10% rise in USD/KRW adds KRW 330.56bn (about $246mn) to Hanwha Ocean’s pre-tax profit; after the September Fed hike, shipbuilders rose 2.83% to 6.58% while chips fell.
- On the author’s Shipbuilding Expectation Index, Hanwha Ocean is at 30.5, Grade 1 while the market-wide K-Expectation Index is 61.2 (Grade 8); buying the four shipbuilders at Grade 1 returned an average of 19.4% six months later.
Key takeaways
- US consumer prices rose 3.7% in September (forecast 3.6%), lifting the odds of an October Fed hike from 22.1% to 33.2%, and a Gartner warning on AI impairments landed alongside signs that Anthropic’s growth is slowing. Foreigners sold a net KRW 3.77tn (about $2.8bn) of KOSPI stocks, and the index fell 7.57% to 5,554.22, down 20.7% in seven trading days.
- Overseas, markets fell in line with their chip weight (chip- and AI-heavy markets averaged -4.95%, chip-light markets -0.24%). In Korea, Samsung Electronics and SK hynix make up 46.9% of the KOSPI’s market cap, so the whole index was dragged down, and even shipbuilders, which have nothing to do with AI, fell 4% to 7%. Hanwha Ocean fell 7.42%, almost exactly as much as the KOSPI, yet foreigners were net buyers of KRW 12bn across the four big shipbuilders.
- If US rates actually rise, the rate gap widens and the won weakens (USD/KRW +18.6% in 2022), which helps shipbuilders that are paid in dollars. On the author’s Shipbuilding Expectation Index, Hanwha Ocean scores 30.5, Grade 1 (the bottom). The author sees now as a fear zone for non-AI exporters such as shipbuilders.
As of: October 15, 2026
Topics covered: today’s plunge and the market’s circuit breakers, US consumer prices and Treasury yields, doubts about AI returns (Gartner, Anthropic, CoreWeave), foreign selling, forced liquidation and the National Pension Service, a comparison of 19 global indexes, the weight of the two chip giants and their share of the fall, the Korea-US rate gap and past USD/KRW episodes, shipbuilders’ dollar revenue and FX sensitivity, shipbuilders’ trading flows today, where the money went in 2026, the design, results and track record of the Shipbuilding Expectation Index (a stock-level version of the K-Expectation Index), dates to watch, and how the numbers were calculated
Reference data: Korean share prices, market caps, net buying by investor type, PBR and foreign ownership come from the Korea Exchange (KRX, regular-session close on October 15). The KRX publishes every day how much foreigners, retail investors and institutions bought and sold in each stock. Long price histories are Naver Finance adjusted prices; overseas indexes, stocks and exchange rates are Yahoo Finance (US on October 14; Asia and Europe on October 15, with Europe intraday in the Korean afternoon); US Treasury yields are the Treasury’s daily yield curve; policy rates come from the Fed and the Bank of Korea; long-run USD/KRW is the Fed’s H.10 release; margin loans and forced liquidation come from the Korea Financial Investment Association (KOFIA); analyst consensus is WiseReport (as of October 14); and company numbers come from DART, Korea’s electronic disclosure system, and from articles citing company IR.

The photo shows offshore drilling rigs under construction at the Daewoo Shipbuilding & Marine Engineering yard (now Hanwha Ocean) in Okpo, Geoje (taken in July 2010). This report asks why shares of this shipyard, which has nothing to do with AI, were sold along with today’s AI scare.
Summary: the KOSPI crash, AI fear in chips and fear selling in Korean shipbuilders
This report looks at the KOSPI crash of October 15, 2026, based on public data and the author’s calculations. It asks one question. Was the KOSPI plunge on October 15 selling with a reason, or fear? The author’s answer is that it depends on the stock. The chip sell-off has a reason, doubts about AI returns, but the fall in shipbuilders alongside them is fear selling without a reason, and that makes now a fear zone for non-AI exporters such as shipbuilders.
Some background first. The KOSPI is Korea’s main stock index, and the KOSDAQ is its smaller, tech-heavy second market. The Bank of Korea (BOK) sets Korea’s base rate at meetings of its Monetary Policy Board. The “rate gap” in this report is the BOK base rate minus the upper end of the US policy rate range. Korea counts large sums in units of 100 million won (eok) and one trillion won (jo); this report shows them as KRW bn and KRW tn (10 eok = KRW 1bn). Dollar figures use KRW 1,344.6 per dollar, the October 15, 2026 Seoul close.
The chain runs like this. First, US consumer prices rose 3.7% in September, above forecasts, and the probability that the Fed raises rates at its October 27-28 meeting rose from 22.1% to 33.2%. The 1-year Treasury yield rose from 4.48% to 4.53% and the 2-year from 4.79% to 4.82%. Second, on the same day Gartner warned that more than $3.5tn of AI infrastructure assets could face impairment by 2030, and the market read Anthropic’s quarter-on-quarter revenue growth as having slowed from about 140% to 45%. In the US, CoreWeave fell 15.46% and the Philadelphia Semiconductor Index 4.30%. Third, foreigners sold a net KRW 3.77tn of KOSPI stocks today and KRW 17.99tn (about $13.4bn) over the seven trading days since October 6, while daily forced liquidation of margin positions swelled from KRW 6.4bn on October 8 to KRW 89.3bn on October 14.
Fourth, overseas markets fell in line with their chip weight. Markets heavy in chips and AI (Korea, Japan, Taiwan, US tech) averaged -4.95%, while chip-light markets (Europe, India, Australia, the Dow and others) averaged -0.24%. India’s Sensex rose 1.82% and Britain’s FTSE 100 0.48%; even within Japan, the Nikkei 225 fell 4.90% but the TOPIX only 2.38%. Fifth, in Korea, Samsung Electronics and SK hynix together make up 46.9% of the KOSPI’s market cap, and they accounted for 67.8% of the KRW 375.9tn (about $280bn) of market value lost today. Yet 789 of the KOSPI’s 919 stocks fell, and shipbuilders, which have nothing to do with AI, fell too: Hanwha Ocean -7.42%, and the four big shipbuilders -5.18% on average.
Sixth, if US rates actually rise, this fear works in shipbuilders’ favor. In 2018, when the Korea-US rate gap widened in the US’s favor, USD/KRW rose 6.6%; in 2022 it rose 18.6%. Hanwha Ocean has an order backlog of $33.77bn, exports made up 86.9% of its first-half revenue, and a 10% rise in USD/KRW adds KRW 330.56bn (about $246mn) to its pre-tax profit (2025 annual report). Seventh, foreigners sold KRW 2,731.3bn of the two chip stocks today but were net buyers of KRW 12bn across the four shipbuilders. Hanwha Ocean’s trading value was KRW 65bn, 39% of its 120-day average. It was not that sellers piled in; the buyers disappeared.
Eighth, this year the money went only to chips. Through June 22, SK hynix rose 331.2% and Samsung Electronics 175.1%, while Hanwha Ocean rose 1.6%. Trading value this year was KRW 2,711.5tn in the two chip stocks and KRW 123.1tn in the four shipbuilders, a gap of 22.0 times. That is why the market-wide K-Expectation Index is still at Grade 8 (61.2), held up by the money and margin debt that piled into chips. Ninth, measured on the Shipbuilding Expectation Index, which applies the same formula to ten stock-level inputs, Hanwha Ocean scores 30.5, Grade 1 (the bottom). Buying the four shipbuilders on days they were at Grade 1 returned an average of 19.4% six months later, and 72% of those cases rose.
The author’s view is this. The author sees now as a fear zone for non-AI exporters such as shipbuilders. The dates to watch are the BOK rate decision on October 22, Hanwha Ocean’s third-quarter results on October 27, the FOMC decision early on October 29 (Korea time), and US October consumer prices on November 10. The report goes through, in order, today’s plunge, the two triggers, foreigners and forced liquidation, the global comparison, Korea’s concentration in chips, the rate gap and the won, shipbuilders’ dollar revenue, shipbuilders’ trading today, where the money went, the Shipbuilding Expectation Index, the author’s view and dates, and how the numbers were calculated.
1. The KOSPI crash on October 15, 2026: -7.57%, -20.7% in seven days and a circuit breaker
The biggest one-day drop since July 28
On October 15 the KOSPI closed at 5,554.22, down 454.59 points (7.57%). It opened 5.59% lower at 5,673.01 and at one point fell to 5,450.81 (-9.29%). The KOSDAQ fell 63.06 points (7.65%) to 760.82. Both the point drop and the percentage drop were the largest since July 28 (-10.84%) (Yonhap). The KOSPI has fallen for seven straight trading days since October 6, its first seven-day losing streak since September 2024. From 7,003.74 on October 2, it has lost 1,449.52 points, or 20.7%. It now sits 39.1% below its record close of 9,114.55 on June 22.
Every market safeguard went off in a single day. A sell-side “sidecar” was triggered at 9:07 a.m. on the KOSPI and at 9:12 a.m. on the KOSDAQ, and level-1 circuit breakers hit the KOSDAQ at 12:23 p.m. (757.88, -8.01%) and the KOSPI at 12:38 p.m. (5,528.05, -8.00%), halting trading for 20 minutes each. It was the KOSPI’s tenth circuit breaker this year and the first time both markets halted on the same day since July 29 (Edaily). A circuit breaker halts trading for 20 minutes once an index has been down more than 8% from the previous day for one minute. A sidecar pauses only program-trading orders, for five minutes, when futures move sharply.
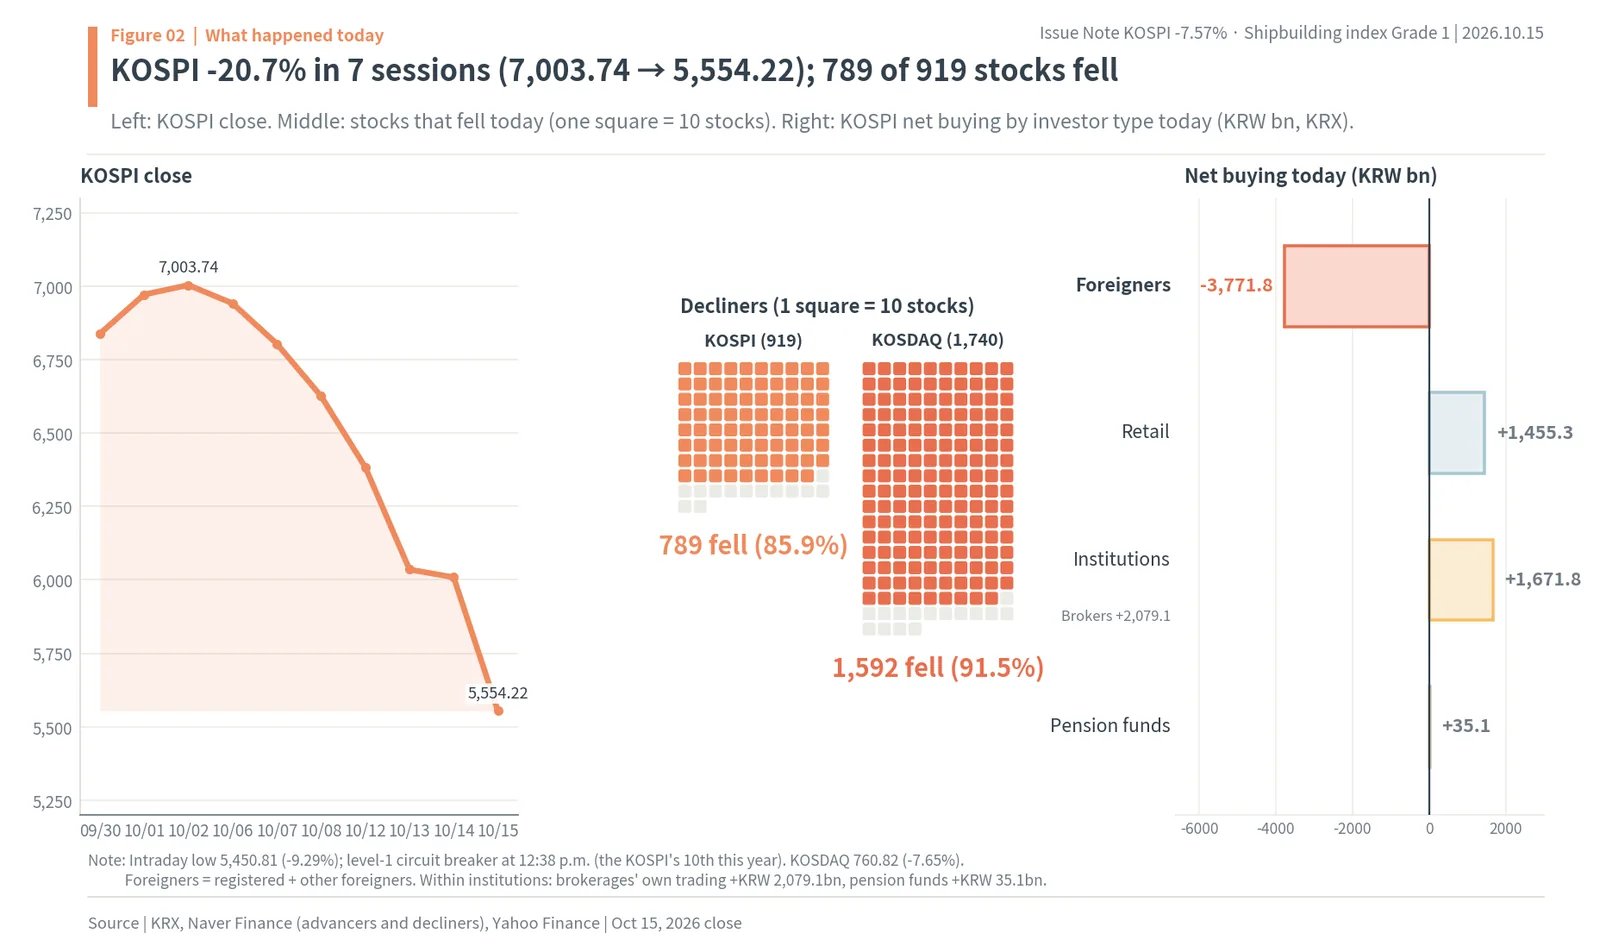
The left of Figure 2 shows KOSPI closes from September 30 to today. From 7,003.74 on October 2 it fell every day to 5,554.22. The middle shows how many of the KOSPI’s 919 stocks fell today (one square = 10 stocks). 115 rose (including two that hit the daily upper limit) and 789 fell, so 85.9% declined. On the KOSDAQ, 1,592 of 1,740 stocks (91.5%) fell. The right shows net buying on the KOSPI today by investor type. Foreigners sold KRW 3,771.8bn, while retail investors bought KRW 1,455.3bn and institutions KRW 1,671.8bn. Within institutions, brokerages trading on their own account (the “financial investment” category) bought KRW 2,079.1bn.
Goldman Sachs pointed to March 2020 and August 2011
What stands out about this drop is that it was not a one-day shock but selling that went on without a break. According to the Seoul Economic Daily, Goldman Sachs said in a report that the peak-to-trough fall in this leg far exceeds a typical seven-day correction, and that in the past 20 years the only comparable runs of selling without a rebound were early in the pandemic in March 2020 (-20.5%) and after the US credit downgrade in August 2011 (-15.1%). This time the KOSPI fell 20.80% from its intraday high of 7,044.67 on October 6 to this morning’s low.
New 52-week lows piled up too. By Financial News’ count, 79 stocks on the main KOSPI market and 143 on the KOSDAQ hit intraday 52-week lows today. The list was not only chipmakers. Alongside internet and brokerage stocks such as NAVER and Kiwoom Securities were HD Hyundai Electric (power equipment), Hyundai Rotem (defense), and shipbuilders such as Hanwha Ocean, HD Korea Shipbuilding & Offshore Engineering (HD KSOE) and HD Hyundai Heavy Industries. That is exactly the question this report asks. The triggers were US inflation and AI, so why did shipbuilders, which have nothing to do with AI, hit new lows too?
2. Trigger one: US CPI 3.7% and a 33.2% chance of an October Fed hike
September CPI 3.7%, above the 3.6% forecast
The September consumer price index (CPI) released by the US Labor Department on October 14 (local time) rose 3.7% from a year earlier. That beat the market forecast of 3.6% and was faster than August’s 3.4%. Month on month, prices rose 0.6%, above the 0.5% forecast. Core CPI, which excludes food and energy, rose 0.3% on the month and 2.6% on the year, also above forecasts of 0.2% and 2.5% (News1). Gasoline prices jumped 9.1% in a month and made up more than half of the overall rise, and increases spread to toys, used cars and housing. With Brent crude above $100 a barrel amid Middle East tensions, the market took the numbers as a sign that inflation was spreading again.
When consumer prices come in above forecast, the Federal Reserve raises rates to make money more expensive and hold down demand. The US policy rate is now 3.75-4.00%. According to the Seoul Economic Daily, CME FedWatch put the probability of a hike at the October 27-28 Federal Open Market Committee (FOMC) meeting at 33.2%, up from 22.1% the day before, while the probability of a hold fell from 77.9% to 66.8%. This is the number behind the “fear of higher rates” in this report. It is not a decision; the odds rose.
Short-term yields rose, and the 10-year actually fell

The left of Figure 3 overlays the US Treasury’s daily yield curve for October 13 and 14. The middle shows how many bp (0.01 percentage point) each maturity moved in a day. The 6-month yield rose from 4.34% to 4.37%, the 1-year from 4.48% to 4.53% and the 2-year from 4.79% to 4.82%. The 10-year, by contrast, fell from 5.21% to 5.19% and the 30-year from 5.56% to 5.52%. Short-term rates follow Fed decisions, while long-term rates also carry the growth outlook and demand for safe assets. The fear of a hike showed up at the short end, while long yields fell as money from stock sales moved into Treasuries (News1, citing CNBC). Intraday, the 10-year briefly rose to 5.304% and the 2-year to 4.916% before coming back as stocks fell (iNews24).
The right shows weekly 3-month, 2-year and 10-year yields since October 2025. The 10-year fell as low as 4.38% in June, then climbed to a 2026 high of 5.31%, and now stands at 5.19%. The level of rates is already high. If rates stay high, the interest burden grows for AI infrastructure companies that borrow to build data centers. That is how the inflation scare meshed at once with the second trigger, doubts about AI returns.
3. Trigger two: Gartner’s $3.5tn AI impairment warning and Anthropic’s slower growth
Gartner: $3.5tn at risk of impairment by 2030
On the same day, research firm Gartner estimated that hyperscalers (large data-center operators) will spend about $7tn on AI infrastructure in 2026-2030, while AI revenue from data centers may reach only $3.6tn at most. If investment continues at the current pace, more than $3.5tn of assets could face impairment by 2030, and more than 80% of neoclouds such as CoreWeave (companies that buy GPUs and rent them out to AI firms) may not survive as independent businesses, it said (Yonhap). Gartner also calculated that meeting a minimum 12% return on invested capital would require cumulative revenue of $8.5tn by 2030 (Seoul Economic Daily).
On top of that came a reading that Anthropic, the maker of Claude, had fallen short of expectations. Anthropic’s third-quarter revenue was $16.8bn, up from $4.7bn in the first quarter and $11.6bn in the second, and it turned a profit with an 11% adjusted operating margin (Digital Daily, citing Reuters). But the spotlight fell on its quarter-on-quarter growth slowing from about 140% in the second quarter to 45% in the third (Aju Business Daily). When a company’s growth slows, the question returns of how long the current pace of investment can last. The market reacted less to the fact that revenue grew than to the fact that growth slowed.
In the US, debt-built AI infrastructure fell hardest

The left of Figure 4 shows one-day moves on October 14 in major US stocks and indexes. Companies that borrow to build data centers fell hardest: CoreWeave -15.46%, Nebius -10.08% and Oracle -8.83%. AMD (-5.73%), Intel (-4.56%), the Philadelphia Semiconductor Index (-4.30%), Micron (-4.10%) and Nvidia (-3.16%) followed. The Philadelphia Semiconductor Index fell for a sixth straight session (News1, citing Reuters). The Dow, by contrast, was nearly flat at -0.09%. CoreWeave’s unsecured bonds due 2032 fell below 78 cents on the dollar, a price range usually classed as distressed, and their yield jumped to around 15% (Korea Economic Daily).
The middle and right show Anthropic’s quarterly revenue and the size of investment and revenue in Gartner’s outlook to 2030. Revenue is clearly growing fast, but there is a wide gap between $7tn of investment and $3.6tn of revenue. If that gap is not closed, the losses fall first on heavily indebted infrastructure companies and then on the companies that sell them chips and memory. Korea’s Samsung Electronics and SK hynix sit at the center of that supply chain. This chain explains why chips fell.
Japan looked the same. The Nikkei 225 fell 4.90%, dragged down by AI and chip stocks such as SoftBank Group (-9.33%), Tokyo Electron (-7.78%), Advantest (-14.96%) and Kioxia (-12.32%). The TOPIX, which covers all of Japan’s listed stocks, fell only 2.38% (Etoday, Yahoo Finance). Even within one country, the AI-heavy index fell twice as much as the broad one.
4. Foreign investors sold KRW 17.99tn of Korean stocks in seven days as forced liquidation rose
KRW 17.99tn in seven trading days, KRW 207.9tn this year
Once the two triggers were pulled, foreigners sold the KOSPI. By KRX investor-type data, foreigners sold a net KRW 3.77tn (KRW 3,771.8bn) today. That is the sum of registered foreigners and “other foreigners,” and it is a final figure, larger than the roughly KRW 3.6tn in articles right after the close. Foreigners have been net sellers for eight straight trading days since October 2, and the seven trading days from October 6 to 15, when the KOSPI fell, add up to KRW 17.99tn. Daily net selling was KRW 1.76tn on October 6, KRW 2.62tn on the 7th, KRW 2.08tn on the 8th, KRW 2.01tn on the 12th, KRW 4.58tn on the 13th, KRW 1.18tn on the 14th, and KRW 3.77tn today. So far this year foreigners have sold KRW 207.92tn (about $155bn) of KOSPI stocks, while retail investors bought KRW 101.63tn (author’s tally, KRX).

The left of Figure 5 shows foreigners’ daily net buying over these seven trading days. Every bar points down. The middle shows monthly foreign and retail net buying from December 2025 to this month. Foreigners sold heavily in February (KRW 21.06tn), March (KRW 35.75tn), May (KRW 44.46tn) and June (KRW 48.43tn), and they sold even in June, when the index hit its record. Foreign selling did not suddenly start this week; it sits on top of a trend that has run all year.
In one year, five times what they sold in 22 years
Seen over a long period, the number carries different weight. By KRX investor data, foreigners’ net selling on the KOSPI over the 22 years from 2004 to 2025 adds up to KRW 40.4tn. Along the way there were years of heavy selling, such as 2007 (KRW 27.2tn) and the 2008 financial crisis (KRW 34.6tn), and years of heavy buying, such as 2009 (+KRW 30.4tn) and 2010 (+KRW 21.4tn). Cumulative foreign net buying peaked at +KRW 18.0tn on July 14, 2017. This year alone, through October 15, foreigners sold KRW 207.9tn: 6.0 times 2008, the financial-crisis year, and more than five times the previous 22 years combined. Cumulative foreign net buying since 2004 stands at -KRW 248.3tn today, the lowest of any day in the series (author’s calculation).
Most of this selling came from the two chip stocks. This year foreigners sold a net KRW 88.9tn of Samsung Electronics and KRW 91.1tn of SK hynix. The combined KRW 180.1tn is 86.6% of foreigners’ net KOSPI selling this year (author’s calculation). Foreign ownership fell from 52.34% on January 2 to 46.16% at Samsung Electronics and from 53.84% to 49.03% at SK hynix. Retail investors, by contrast, bought KRW 91.6tn of the two. Korea’s flows this year come down to one line: foreigners sell memory and retail investors buy it. Shipbuilders sat beside this big flow. Foreigners were in fact net buyers of Hanwha Ocean this year, by KRW 637bn.
Shares bought on borrowed money were sold by force
The right of Figure 5 shows forced liquidation as compiled by KOFIA. Forced liquidation happens when the collateral value of shares bought with money borrowed from a brokerage (margin loans, or purchases not yet paid for) falls below a set level, and the broker sells them at market regardless of the owner’s wishes. Daily forced liquidation grew from KRW 6.4bn on October 8 to KRW 27.1bn on the 12th, KRW 59.4bn on the 13th and KRW 89.3bn on the 14th. On the 14th, forced sales equaled 7.2% of unsettled purchase balances. Margin loan balances fell from KRW 34.29tn on the 12th to KRW 33.71tn on the 14th (Newsis, KOFIA). The biggest day for forced liquidation this year was June 9, at KRW 169.8bn. In a market carrying a lot of debt, a falling index sets off forced selling that drags the index down further. KOFIA publishes forced liquidation a day late, so today’s figure is not yet available.
The National Pension Service, the supposed backstop, sold KRW 9tn this year
At its fund management committee meeting on January 26, the National Pension Service (NPS), Korea’s state pension fund, raised its target weight for domestic stocks from 14.4% to 14.9% and suspended until the end of June the rebalancing that mechanically sells when the weight exceeds its allowed range. On May 28 it raised its 2026 target weight for domestic stocks to 20.8%, and it resumed rebalancing on July 1 (Korea.kr, Newsis). At a parliamentary audit on October 14, NPS chairman Kim Sung-joo said that without the suspension the fund “would have sold KRW 800bn of stock a day and dealt the market a serious shock” (Kookmin Ilbo). Even so, by KRX data, pension funds were net sellers of KRW 9.03tn of KOSPI stocks this year. Today pension funds bought only KRW 35.1bn. On a day when foreigners sold more than KRW 3tn, the buyers were retail investors and brokerages’ own trading (financial investment, KRW 2.08tn), and on the retail side there was debt.
It is also worth looking at how large the NPS’s domestic stock weight actually got. Domestic stocks in the NPS fund grew to KRW 543.64tn, or 29.4%, at the end of May (Money Today) and KRW 543.20tn, or 29.13%, at the end of June (Korea Financial Newspaper), then fell to KRW 418.6tn, or 24.9%, at the end of July (NPS Investment Management). Because the weight far above the 20.8% target came from rising share prices, pension funds sold a net KRW 217.8bn on July 1, the first day rebalancing resumed (Kyunghyang Shinmun). The NPS rules are a point of contention in this week’s parliamentary audits, but by the numbers, the money that moved the market this year was not the pension funds’ KRW 9.03tn of net selling but foreigners’ KRW 207.9tn.
The conclusion of this section is simple. Foreign selling began with chips as its target, but in a market where the buyers are thin and mixed with debt, selling spreads into dumping that does not tell one stock from another. As the next section shows, overseas markets did not move that way.
5. Global markets: chip-heavy indexes -4.95%, chip-light indexes -0.24%
Chip- and AI-heavy markets -4.95% on average, chip-light markets -0.24%
US inflation and AI doubts reached every market in the world at the same time. Yet the size of the fall differed widely by country. This report splits 19 indexes into markets with a large chip and AI weight (Philadelphia Semiconductor, Nasdaq, KOSPI, KOSDAQ, Nikkei 225, Taiwan’s TAIEX), a middle group (S&P 500, Shenzhen Component), and markets with a small weight (Dow, Shanghai Composite, Hong Kong’s Hang Seng, Indonesia, Singapore, Australia, India and four European indexes). The one-day average change was -4.95% for the chip-heavy group, -1.77% for the middle group and -0.24% for the chip-light group (author’s calculation; US on October 14, Asia and Europe on October 15). The numbers show that the trigger was chips and AI.

Figure 6 lines up the one-day change of the 19 indexes from the biggest fall down. Korea’s KOSDAQ (-7.65%) and KOSPI (-7.57%) are at the top, followed by Japan’s Nikkei 225 (-4.90%), the US Philadelphia Semiconductor Index (-4.30%) and Taiwan’s TAIEX (-3.41%). China’s Shenzhen Component fell 2.43%, the Nasdaq 1.88%, the Shanghai Composite 1.59%, Indonesia 1.33%, the S&P 500 1.11% and Hong Kong’s Hang Seng 1.03%. Below that, markets barely moved: the Euro Stoxx 50 -0.52%, Singapore -0.49%, Germany’s DAX -0.20%, the Dow -0.09% and Australia -0.09%, while France’s CAC 40 rose 0.35%, Britain’s FTSE 100 0.48% and India’s Sensex 1.82%. The European indexes are intraday values in the Korean afternoon and may differ slightly at the close.
Hit by the same US rates, the Dow barely moved
What matters in this comparison is that if the fear of US rates had really dragged down all stocks, the Dow, Europe and India should have fallen too. But the Dow was -0.09% and Britain +0.48%. Commentary said the FTSE 100 held up because of its small tech weight (Sharecast). The rate fear concentrated on stocks such as AI and chips that pull future earnings forward. The same difference showed up within countries. In Japan, the Nikkei 225, with its large weight in chip and AI stocks, fell 4.90%, but the TOPIX, which holds all stocks, fell 2.38%. In Taiwan, TSMC itself fell 2.01% while the TAIEX fell 3.41%. The US-listed Korea ETF, EWY, had already fallen 4.04% the night before.
The next day’s direction in the US points the same way. As of the Korean evening, S&P 500 futures were -0.22% and Nasdaq 100 futures -0.97%, with the tech index weaker than the broad one (Yahoo Finance, intraday values). Sharecast, reporting on the UK market, headlined its London open story “FTSE edges up despite Asian tech selloff” (Hargreaves Lansdown). Among markets that saw the same news on the same day, those with little tech barely wobbled, and only those like Korea, Japan and Taiwan, which hold much of the AI chip supply chain in their indexes, were shaken hard. That EWY had already fallen 4.04% on the night of October 14 means the basket of Korean stocks was sold wholesale abroad before the Korean market even opened.
Stretching to seven trading days gives the same picture. From October 2 to today, the KOSPI fell 20.7%, the KOSDAQ 14.8%, the Philadelphia Semiconductor Index 11.1%, the Shenzhen Component 8.3%, the Nikkei 225 5.7% and Taiwan’s TAIEX 3.1%. Over the same stretch the S&P 500 was flat (0.0%), while the Dow rose 0.9%, Britain 3.0% and India 3.1%. The world sold AI and chips, not stocks as a whole. So why did Korea fall all the way into the KOSDAQ and stocks that are not chips? The answer, in the next section, lies in how the Korean market is built.
6. Samsung Electronics and SK hynix are 46.9% of the KOSPI, so the whole index fell
Two stocks are 46.9% of the KOSPI; in June, 57.1%
The common-share market caps of Samsung Electronics and SK hynix together are 46.9% of the KOSPI’s total market cap today (49.7% including preferred shares, KRX). On December 1, 2025 the figure was 30.6%, but as memory profits exploded this year it rose to 57.1% on June 25. Because the KOSPI is weighted by market cap, a 1% move in these two stocks moves the index by nearly 0.5%. Buying the KOSPI has effectively become buying memory chips.
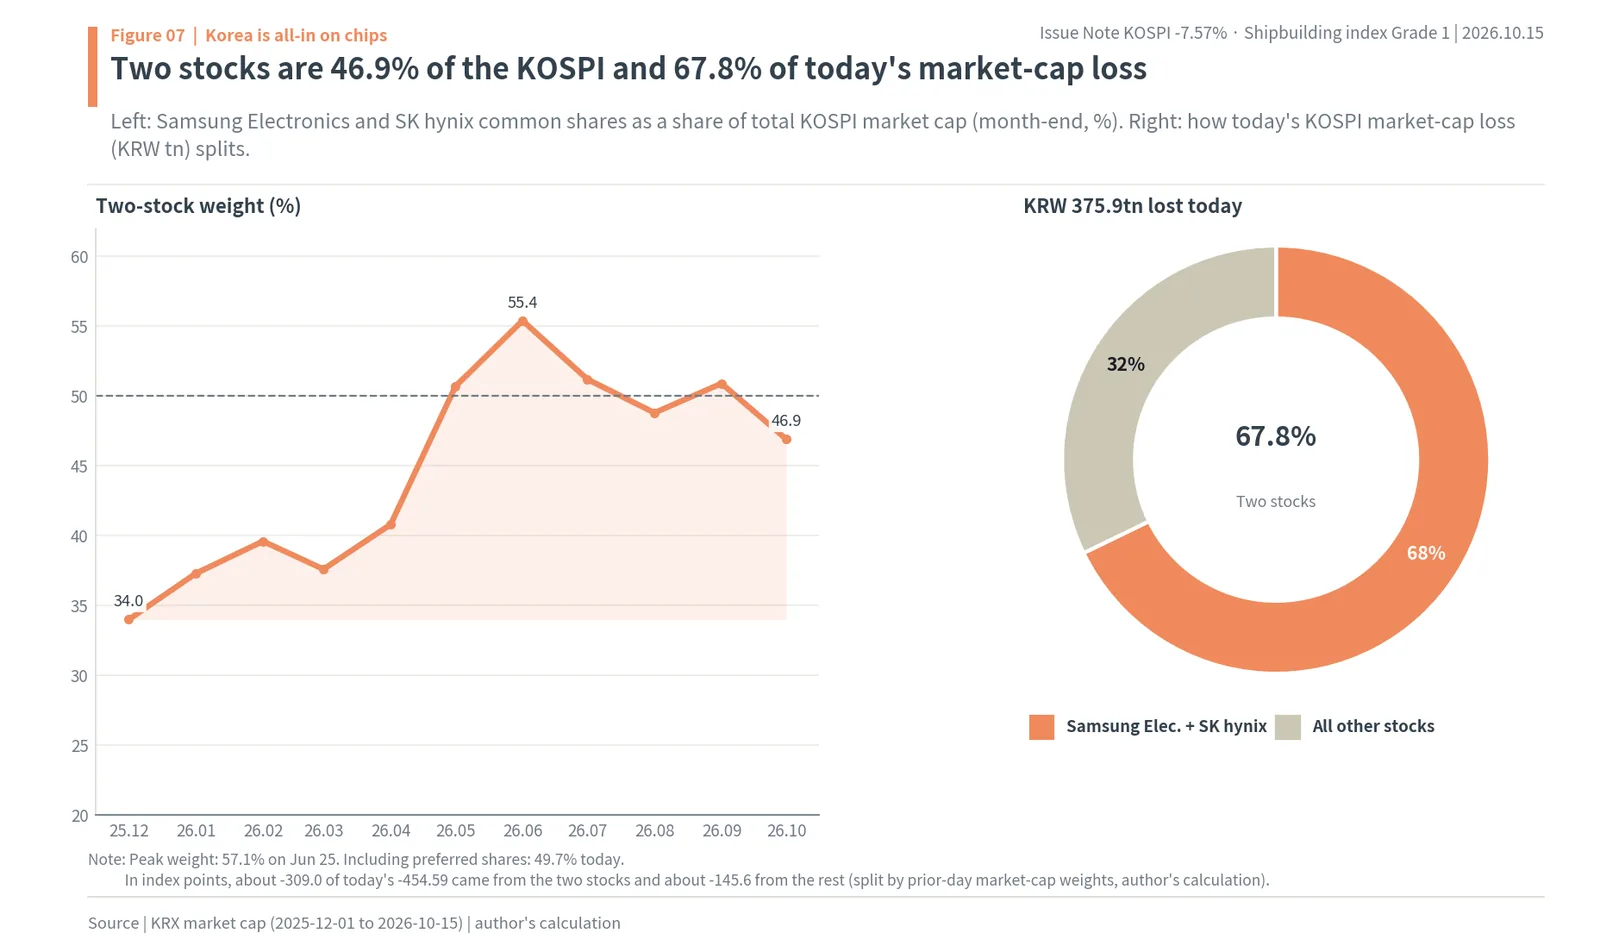
The left of Figure 7 shows the two stocks’ weight at each month-end. It rose from 34.0% at the end of December 2025 to 50.7% in May 2026 and 55.4% in June, then came back down to 46.9% this month. The right splits the KRW 375.9tn of KOSPI market cap lost today between the two stocks and the rest. The two stocks alone lost KRW 254.9tn (about $190bn), 67.8% of the total decline. In index terms, about -309.0 of today’s -454.59 points came from the two stocks and about -145.6 points from all the other stocks (author’s calculation, split by the previous day’s market-cap weights). When AI fear hits chips, two-thirds of the index falls at once.
Yet 789 of 919 stocks fell
That the two stocks dragged the index down can be put down to composition. The problem is everything else. Today 789 (85.9%) of the KOSPI’s 919 stocks fell, and 1,592 (91.5%) of the KOSDAQ’s 1,740. Almost every sector fell, including those with no link to chips.
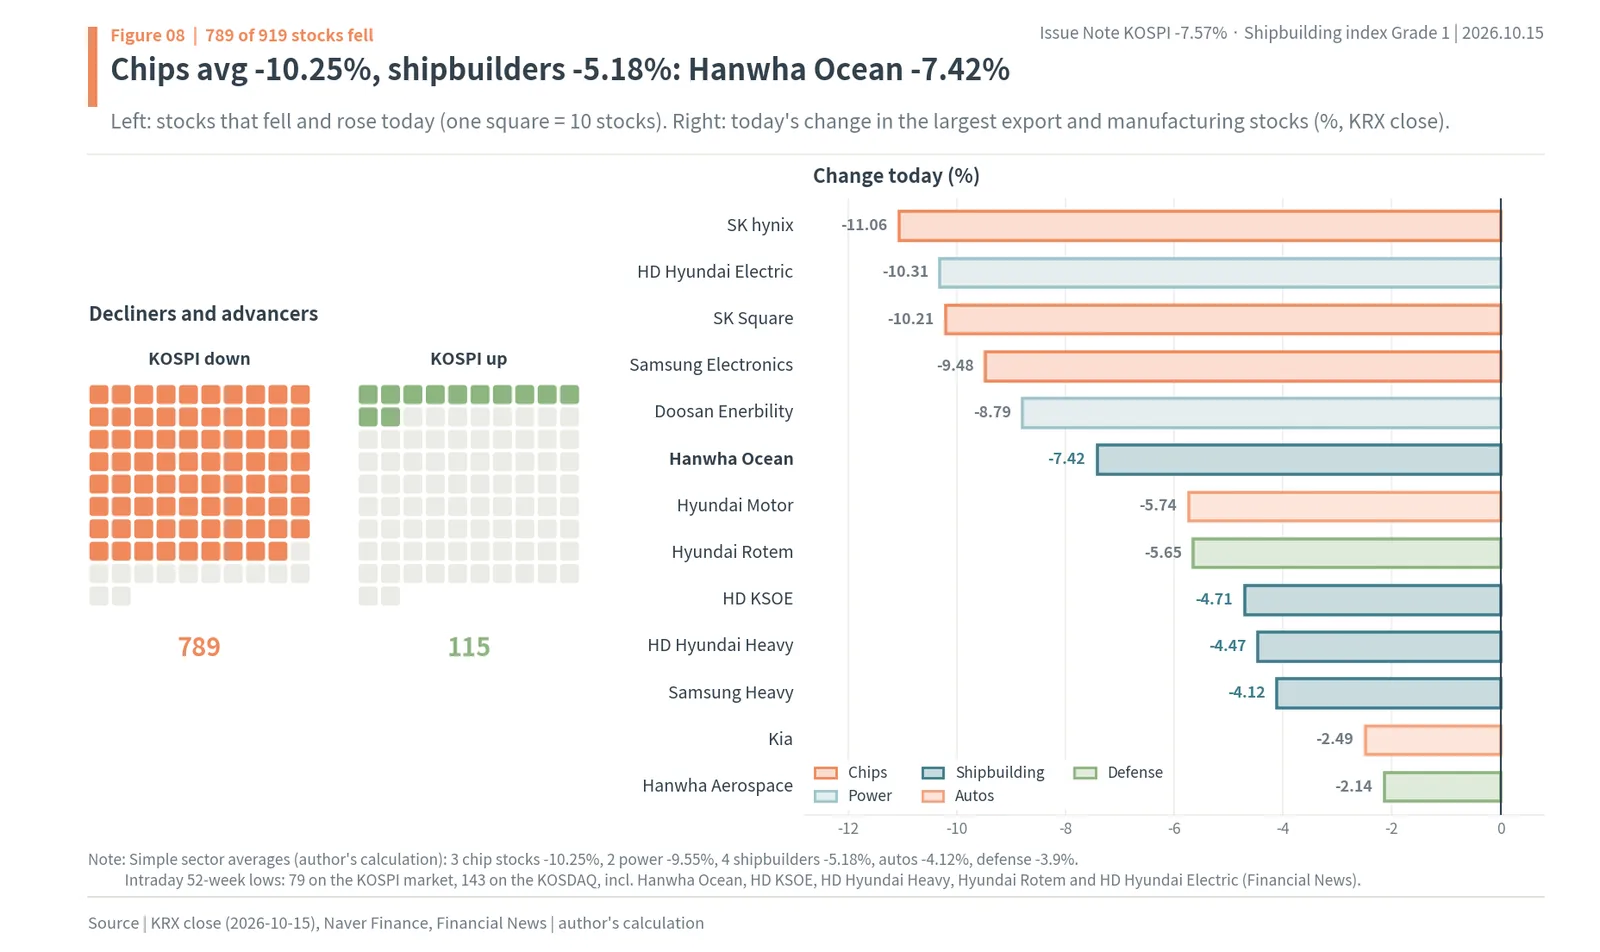
The left of Figure 8 shows how many stocks rose and fell today. The right shows today’s change in the largest stocks by market cap. SK hynix (-11.06%), HD Hyundai Electric (-10.31%), SK Square (-10.21%), Samsung Electronics (-9.48%) and Doosan Enerbility (-8.79%) fell the most. That power equipment and nuclear stocks, long grouped as beneficiaries of AI data-center power demand, fell as much as chips can be explained by the AI chain. Next came Hanwha Ocean at -7.42%. Though Hanwha Ocean has no direct link to AI, it fell almost as much as the KOSPI’s -7.57%. Hyundai Motor (-5.74%), Hyundai Rotem (-5.65%), HD KSOE (-4.71%), HD Hyundai Heavy Industries (-4.47%), Samsung Heavy Industries (-4.12%), Kia (-2.49%) and Hanwha Aerospace (-2.14%) all fell as well.
By sector, the three chip stocks (Samsung Electronics, SK hynix, SK Square) averaged -10.25%, the two power stocks -9.55%, the four shipbuilders -5.18%, the two automakers -4.12% and the two defense stocks -3.90% (simple averages, author’s calculation). On a day when the Dow and Europe held up, traditional Korean exporters such as autos, shipbuilders and defense fell 4% to 7%. With chips making up half the market, when foreigners sell “Korea,” every stock in the basket gets sold with it. But inside the basket were stocks that should have moved opposite to this trigger. The next section explains why: the link between rates and the exchange rate.
7. The Korea-US rate gap and the won: USD/KRW +6.6% in 2018, +18.6% in 2022
Today was only “doubt,” and the won moved KRW 6.3
The fear of higher US rates normally works to weaken the Korean won, because money flows to where it earns more interest. The higher the US policy rate is relative to Korea’s, the more money sells won and buys dollars to put into US assets, and the dollar’s price (USD/KRW) rises accordingly. This report calls the BOK base rate minus the upper end of the US policy rate range the “rate gap.” The US is now at 3.75-4.00% and Korea at 3.00%, so the gap is -1.00pp (the US is one point higher).
USD/KRW closed today at KRW 1,344.6 in the Seoul foreign exchange market, up KRW 6.3 from the day before. Intraday it rose as high as KRW 1,350.7 (Newspim). That is a small move for a day when foreigners sold KRW 3.77tn of stocks. Today was not a day when the US raised rates but a day when the odds that it “might” rose. The probability of an October FOMC hike rose from 22.1% to 33.2% (Seoul Economic Daily), but two out of three still expect a hold. If the BOK holds on October 22 and the Fed raises by 0.25pp on October 28 (early October 29 in Korea), the gap becomes -1.25pp (JoongAng Ilbo presented the same calculation).
When the gap widened in the US’s favor, the dollar rose

The left of Figure 9 shows the monthly rate gap (bars) and the monthly average USD/KRW (line) since 2015. The right shows USD/KRW changes in four periods when the gap moved sharply. In 2018, the Fed raised rates while the BOK stayed at 1.50%, the gap widened from 0 to -0.75pp, and USD/KRW rose 6.6%, from KRW 1,070.5 on March 21 to KRW 1,141.7 on October 26. In 2022, the Fed raised rates quickly from 0.25-0.50% to 3.00-3.25%, the gap moved 1.5pp from +0.75pp to -0.75pp, and USD/KRW rose 18.6%, from KRW 1,214.3 to KRW 1,440.5 on September 28. That day’s Seoul close of KRW 1,439.9 was the highest in 13 years and six months, since the global financial crisis (Etoday).
Conversely, when the gap narrowed, the won strengthened. This year, when the BOK raised its base rate twice, on July 16 and August 27, from 2.50% to 3.00%, the gap narrowed from -1.25pp to -0.75pp, and USD/KRW fell 7.2%, from KRW 1,488.4 on July 15 to KRW 1,381.3 on August 27. The won’s 8.81% appreciation in July was the largest since March 2009 (Kyungje Ilbo). Then, when the Fed raised rates for the first time in three years and two months and the gap widened back to -1.00pp, the Seoul close on September 17 jumped KRW 13.6 in a day to KRW 1,382.2 (JoongAng Ilbo). For each 1pp move in the gap toward the US, the exchange rate moved 6.0% to 14.4% in these four periods (author’s calculation, period change ÷ change in the gap).
In sum, the chain runs: US inflation is high → the Fed raises rates → the Korea-US rate gap widens in the US’s favor → the dollar strengthens and the won weakens. Today only “doubt” appeared at the first link of this chain, so the won moved just KRW 6.3. If doubt turns into a decision, the next links move. And a weaker won increases won revenue in an export-driven country like Korea, especially for companies paid in dollars. Shipbuilders are the prime example.
8. Hanwha Ocean is paid in dollars: a 10% USD/KRW rise adds KRW 330.56bn to pre-tax profit
A $33.77bn backlog, with 86.9% of revenue from exports
Shipbuilders sign contracts before they build ships, and prices are mostly set in dollars. Costs are largely in won: labor at Korean yards and domestic steel and equipment. So even if the same ship sells for the same dollars, a higher USD/KRW means larger revenue and profit in won. Hanwha Ocean’s order backlog at the end of June was 153 ships worth $33.77bn on a delivery basis, including 57 LNG carriers worth $14.46bn (Financial News, company IR). Of first-half revenue of KRW 9.04tn, exports were KRW 7.85tn, or 86.9% (author’s calculation, DART half-year report). Industry estimates put Hanwha Ocean’s FX exposure at 75%, more than double HD Hyundai Heavy Industries’ 34% (ChosunBiz).
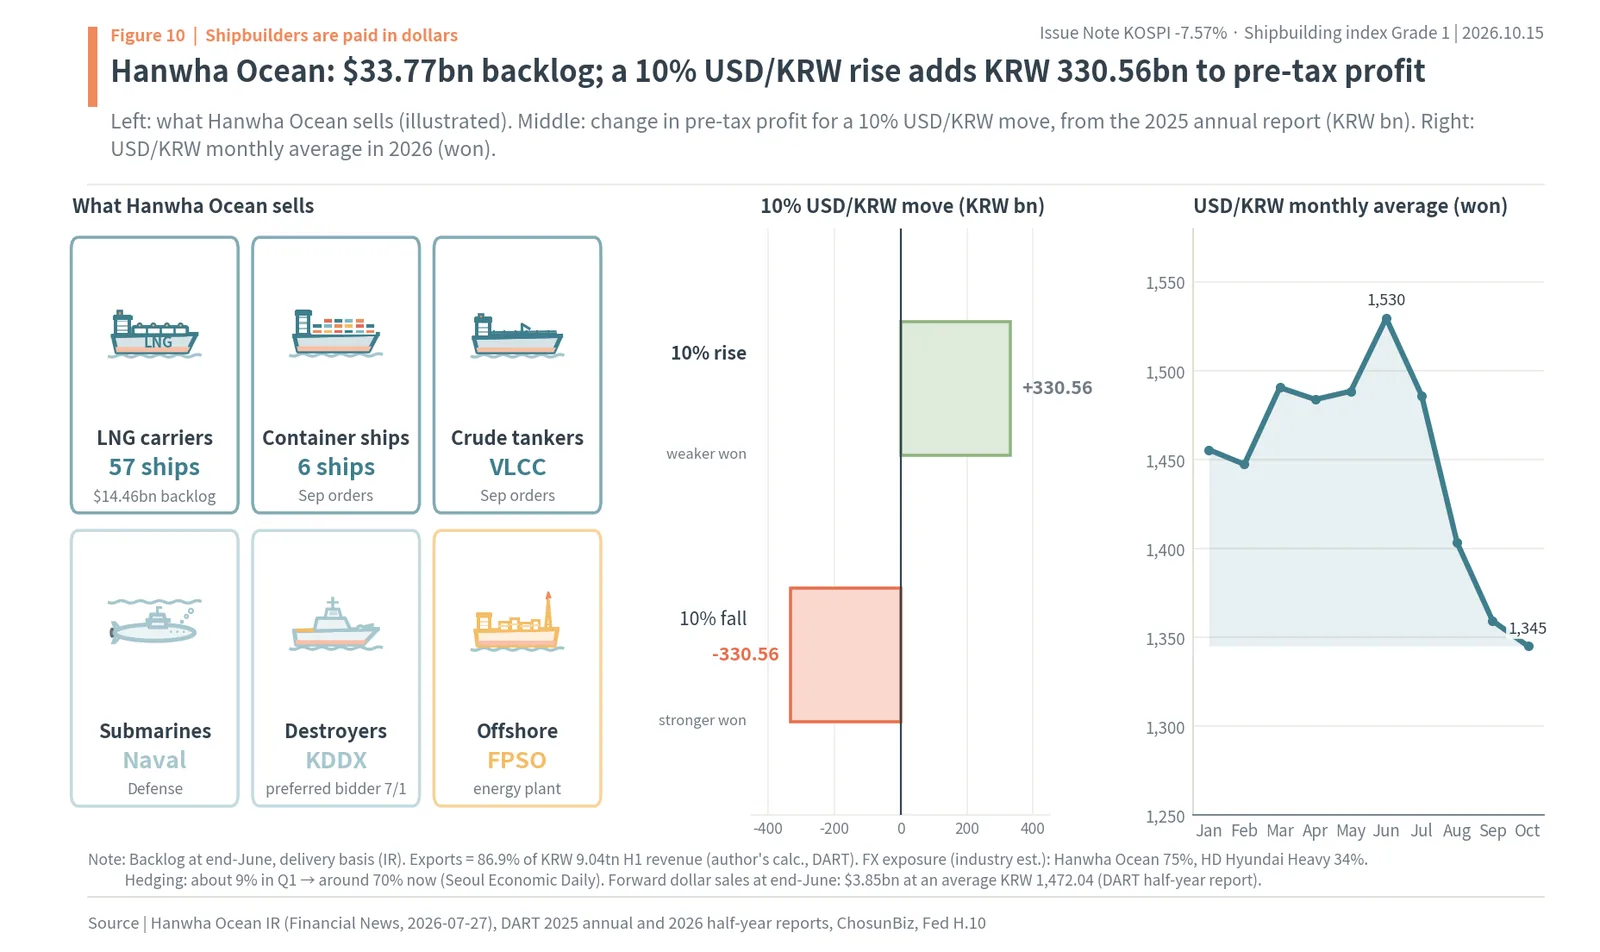
The left of Figure 10 illustrates what Hanwha Ocean sells: merchant ships such as LNG carriers, very large crude carriers (VLCCs) and container ships; naval ships such as submarines and destroyers; and offshore production units (FPSOs). The middle shows the FX sensitivity disclosed in the 2025 annual report. A 10% rise in USD/KRW adds KRW 330.56bn to pre-tax profit, and a 10% fall takes away the same amount. That equals 39% of 2025 pre-tax profit of KRW 842.4bn (author’s calculation, WiseReport results). The right shows USD/KRW this year. It rose into the KRW 1,541 range at the end of June, fell quickly in July and August after the BOK hikes, and is now KRW 1,344.
When the won strengthened this summer, shipbuilders’ profit estimates were cut
This sensitivity was borne out this year. In the first half, when USD/KRW was high, Hanwha Ocean posted record quarterly results in the second quarter, with revenue of KRW 5.44tn and operating profit of KRW 736.1bn (+98%), and Yuanta Securities noted that the results included “FX gains under a limited hedging policy” (Korea Economic Daily). Conversely, as the won strengthened from August, brokerages cut their third-quarter estimates. Edaily calculated that if the third-quarter average exchange rate came in KRW 100 below the second quarter’s, Hanwha Ocean’s operating margin would fall 3.9 percentage points. IBK Securities, forecasting third-quarter operating profit of KRW 472.6bn, cited the sharp fall in USD/KRW since August. That a stronger won cuts shipbuilders’ profits means, in reverse, that a weaker won raises them.
The day after the Fed actually hiked, shipbuilders rose and chips fell
This chain actually worked once, a month ago. On September 16 (local time) the Fed raised its policy rate from 3.50-3.75% to 3.75-4.00%, its first hike in three years and two months, since July 2023. The next day, September 17, USD/KRW rose KRW 13.6 to KRW 1,382.2 in Seoul (JoongAng Ilbo). On KRX closes that day, all four shipbuilders rose (Hanwha Ocean +2.83%, HD KSOE +4.81%, Samsung Heavy Industries +6.44% and HD Hyundai Heavy Industries +6.58%) while chips fell (Samsung Electronics -0.39%, SK hynix -0.80%). The KOSPI was nearly flat at -0.04% (author’s calculation). Etoday’s midday market headline that day said the KOSPI held the 6,760 line despite KRW 1.5tn of foreign selling, with shipbuilding and defense strong. On the day a rate hike became a “decision” rather than a “doubt,” the market put shipbuilders on the winning side of rates. Today was the opposite: on a day of doubt, not decision, shipbuilders were sold in one bundle with chips.
Hanwha Ocean’s hedge ratio was low, at about 9%, in the first quarter, and was raised to around 70% as the exchange rate fell (Seoul Economic Daily). At the end of June it had sold $3.85bn forward at an average of KRW 1,472.04 (DART half-year report). New ship contracts and the unhedged portion follow the exchange rate as it moves. Joining this to the chain in Section 7 gives: US rates actually rise → the rate gap widens → the won weakens → shipbuilders’ won revenue and profit from dollar sales rise. If today’s fear proves right, that is, if the US really does raise rates, shipbuilders are on the side that gains.
9. Why Hanwha Ocean stock fell 7.42%: buyers vanished, foreigners did not sell
Hanwha Ocean -7.42%, almost the same as the KOSPI’s -7.57%
Look at the two triggers again. By the chain in Sections 7 and 8, fear of higher US rates gives shipbuilders no reason to suffer. Doubts about AI returns are a problem of the data-center and chip chain, with no direct link to companies that build ships. Yet today Hanwha Ocean fell 7.42% to a KRX close of KRW 62,400 (about $46.4). That is almost the same as the KOSPI’s -7.57%. Intraday it fell to KRW 61,300, a new 52-week low (Financial News). HD KSOE fell 4.71%, HD Hyundai Heavy Industries 4.47% and Samsung Heavy Industries 4.12%, for a four-shipbuilder average of -5.18%. Over the seven trading days since October 2, Hanwha Ocean fell 20.8%, the same as the KOSPI’s 20.7%. Though shipbuilders are not AI, they moved in one bundle with the whole market.

The left of Figure 11 shows weekly closes with the first trading day of 2026 set to 100. Samsung Electronics and SK hynix doubled or tripled through June and then came down, while shipbuilders kept falling from their January-April highs. The right shows returns by period. From the first trading day of this year to today, Hanwha Ocean is -45.6%, HD KSOE -33.2%, Samsung Heavy Industries -24.8% and HD Hyundai Heavy Industries -30.1%, while Samsung Electronics is +63.4% and SK hynix +86.4%. Since October 2 alone, Hanwha Ocean is -20.8%, SK hynix -31.5% and Samsung Electronics -23.9%. Shipbuilders, which have not gained at all this year, fell this week at the same pace as chips, which gained sharply.
Foreigners did not sell shipbuilders; there were no buyers
Looking at today’s trading stock by stock makes the picture clearer. By KRX investor data, foreigners sold KRW 1,539.8bn of Samsung Electronics and KRW 1,191.5bn of SK hynix, KRW 2,731.3bn in the two stocks alone. On the same day foreigners sold KRW 2bn of Hanwha Ocean, KRW 4bn of HD KSOE and KRW 7.4bn of Samsung Heavy Industries, and bought KRW 25.4bn of HD Hyundai Heavy Industries. Across the four shipbuilders, foreigners were actually net buyers of KRW 12bn. Yet the shares fell 4% to 7%.
The answer lies in trading value. Hanwha Ocean’s trading value today was KRW 65bn, 39% of its average of KRW 165.4bn over the previous 120 trading days. The stock did not fall because sellers piled in; on a day when the whole market was collapsing, buyers left their seats, so even small sales pushed the price down. Today, retail investors were net sellers of KRW 10.4bn of Hanwha Ocean and pension funds of KRW 3.2bn. The author sees this not as selling with a reason but as what fear looks like. Regardless of the business, people do not buy because the price is falling, and they sell because it is falling.
The company’s numbers have not changed
Over the same period, Hanwha Ocean’s business numbers are unchanged. The average target price of 22 brokerages is KRW 131,682 (about $97.9) as of October 14, and the 2026 consensus is KRW 2.23tn of operating profit and earnings per share (EPS) of KRW 6,480 (about $4.82). At today’s close, the forward PER is 9.6 times, based on 2026 EPS of KRW 6,480 (author’s calculation). The third-quarter operating profit consensus is KRW 552bn (WiseReport). The Clarksons Newbuilding Price Index, a benchmark for new ship prices, rose from 184.29 at the end of January to 186.59 at the end of September, so ship prices have not fallen (Aju Business Daily, Yonhap). In September, too, Hanwha Ocean won KRW 2.89tn of orders for six container ships plus VLGCs, VLCCs and LNG carriers (Seoul Economic Daily). KB Securities, citing the concentration of flows in chips as the reason for shipbuilders’ weakness in August, still said that the fundamentals of the shipbuilding industry itself remained solid (Etoday). What changed is the market’s mood, not the company’s numbers.
10. Where the money went in 2026: KRW 2,711.5tn in two chip stocks, KRW 123.1tn in shipbuilders
Through June 22, SK hynix +331.2%, Hanwha Ocean +1.6%
This year’s rise in Korean stocks was almost entirely memory chips. From the first trading day to June 22, when the KOSPI hit its record, SK hynix rose 331.2%, Samsung Electronics 175.1% and SK Square 402.6%. Over the same period Hanwha Ocean rose 1.6%, HD KSOE 1.0% and Samsung Heavy Industries 8.5%. Since June 22, SK hynix is -56.8%, Samsung Electronics -40.6% and Hanwha Ocean -46.4%. Shipbuilders got no share on the way up, but they fell together on the way down.

The left of Figure 12 shows monthly trading value in 2026 (KRW tn). Trading value in Samsung Electronics and SK hynix grew from KRW 169.5tn in January to KRW 387.4tn in May and KRW 532.0tn in June. Hanwha Ocean’s peak was KRW 9.2tn in January; it then shrank to the KRW 4-5tn range, and to KRW 1.1tn in September and KRW 0.6tn in October (through the 15th). Adding up trading value from January 2 to today gives KRW 2,711.5tn for the two chip stocks and KRW 123.1tn for the four shipbuilders, a gap of 22.0 times. The middle and right show foreign and retail net buying by stock this year. Foreigners sold KRW 180.1tn of the two chip stocks and retail investors took KRW 91.6tn. On the shipbuilding side, foreign net buying was small in scale: Hanwha Ocean +KRW 637bn, HD KSOE +KRW 269.8bn, Samsung Heavy Industries -KRW 519.7bn and HD Hyundai Heavy Industries -KRW 58.4bn. Both buying and selling crowded into chips.
Expectations for shipbuilders had already drained away in the first half
Expectations for shipbuilders were cut one after another during the chip rally. Hanwha Ocean hit its 2026 high close of KRW 149,900 on January 13 on news of a split-off at the Hanwha group (Asia Economy). On April 8, Hanwha Systems transferred 13,281,250 Hanwha Ocean shares through a price return swap (PRS, a contract that passes the share price gain or loss to a counterparty) and raised about KRW 1.7tn, at a reference price of KRW 128,000 (Dealsite, DART). On July 6, Germany’s TKMS was chosen for the Canadian submarine program, which had raised hopes of a deal worth up to KRW 60tn, and Hanwha Ocean fell 22.7% the next day (Alpha Economy). Meanwhile, articles saying foreigners had moved from shipbuilding into large-cap chip and AI stocks ran in April (Daily Hankook), May (Edaily), July (Newsis) and August (KB Securities), and on September 1 a Chosun Ilbo headline said shipbuilding, defense and nuclear stocks had been pushed out of the KOSPI top 10 as chips swept it.
So shipbuilders had already lost their expectations before this AI scare arrived. The share price is 44.2% below its 200-day average and 58.4% below its high of the past year (author’s calculation). Trading dried up. Chips carried high expectations all year until this scare broke them, but shipbuilders, with few expectations left to break, were sold along with them. The market-wide K-Expectation Index is at Grade 8 (high) because the money and debt concentrated in chips keep its inputs high. To see where shipbuilders stand, they have to be measured on their own. The next section does that.

The photo shows HD Hyundai Heavy Industries’ shipyard in Ulsan (taken in July 2023). The goliath cranes at a shipyard build ships paid for in dollars, not AI data centers. Yet this week the stock market put the two in the same basket and sold them.
11. The Shipbuilding Expectation Index: Hanwha Ocean 30.5, Grade 1 of 10
Why the market-wide K-Expectation Index is at Grade 8
The author’s K-Expectation Index 2.0 converts ten market-wide inputs, such as the KOSPI’s PBR, investor deposits, margin loans, trading value, the US VIX and USD/KRW, into their position (percentile) within the previous three years, combines them into a score of 0 to 100, and splits that into ten grades. Grade 1 means fear and cheap prices; Grade 10 means overheating. Its value on October 15 is 61.2, Grade 8 (high). The area scores are price 74.2, money 88.6, debt 69.7, heat 59.7 and fear 61.4. The KOSPI’s PBR sits at the 74.2% position of its past three years, and margin loans ÷ deposits at the 73.5% position. The money and debt that flowed into chips this year still hold the market-wide inputs high. This number is the position of the Korean market as a whole, not of shipbuilders. So the author rebuilt the same idea for single stocks.
The same formula, ten stock-level inputs
The Shipbuilding Expectation Index carries the K-Expectation Index 2.0 formula over as it is. For each input, it finds what percentile today’s value sits at within that stock’s previous 756 trading days (three years), oriented so that more expectation means a higher score. The ten inputs are grouped into five areas. The price area is PBR (share price ÷ book value per share) and the share price versus its 200-day average; the foreigner area is foreign ownership and 60-day foreign net buying ÷ market cap; the retail and institution area is 60-day retail and institutional net buying ÷ market cap; the heat area is 20-day average trading value ÷ market cap (turnover) and the trading surge (20-day ÷ 120-day average trading value); and the fear area is 20-day volatility (higher volatility, lower score) and the share price versus its one-year high. The average of the ten inputs is the base score, and how far the five area scores diverge (standard deviation ÷ 20.8) becomes a multiplier that sets how far the final score moves away from 50. The more the areas agree, the more the score is pulled toward 50; when they diverge widely, it is pulled less. The grade cutoffs come from splitting the values of four stocks, Hanwha Ocean, HD KSOE, Samsung Heavy Industries and HD Hyundai Heavy Industries, over the whole period since 2017 into ten equal parts (36.0, 42.5, 46.5, 50.0, 53.4, 57.7, 62.0, 66.0, 72.0).
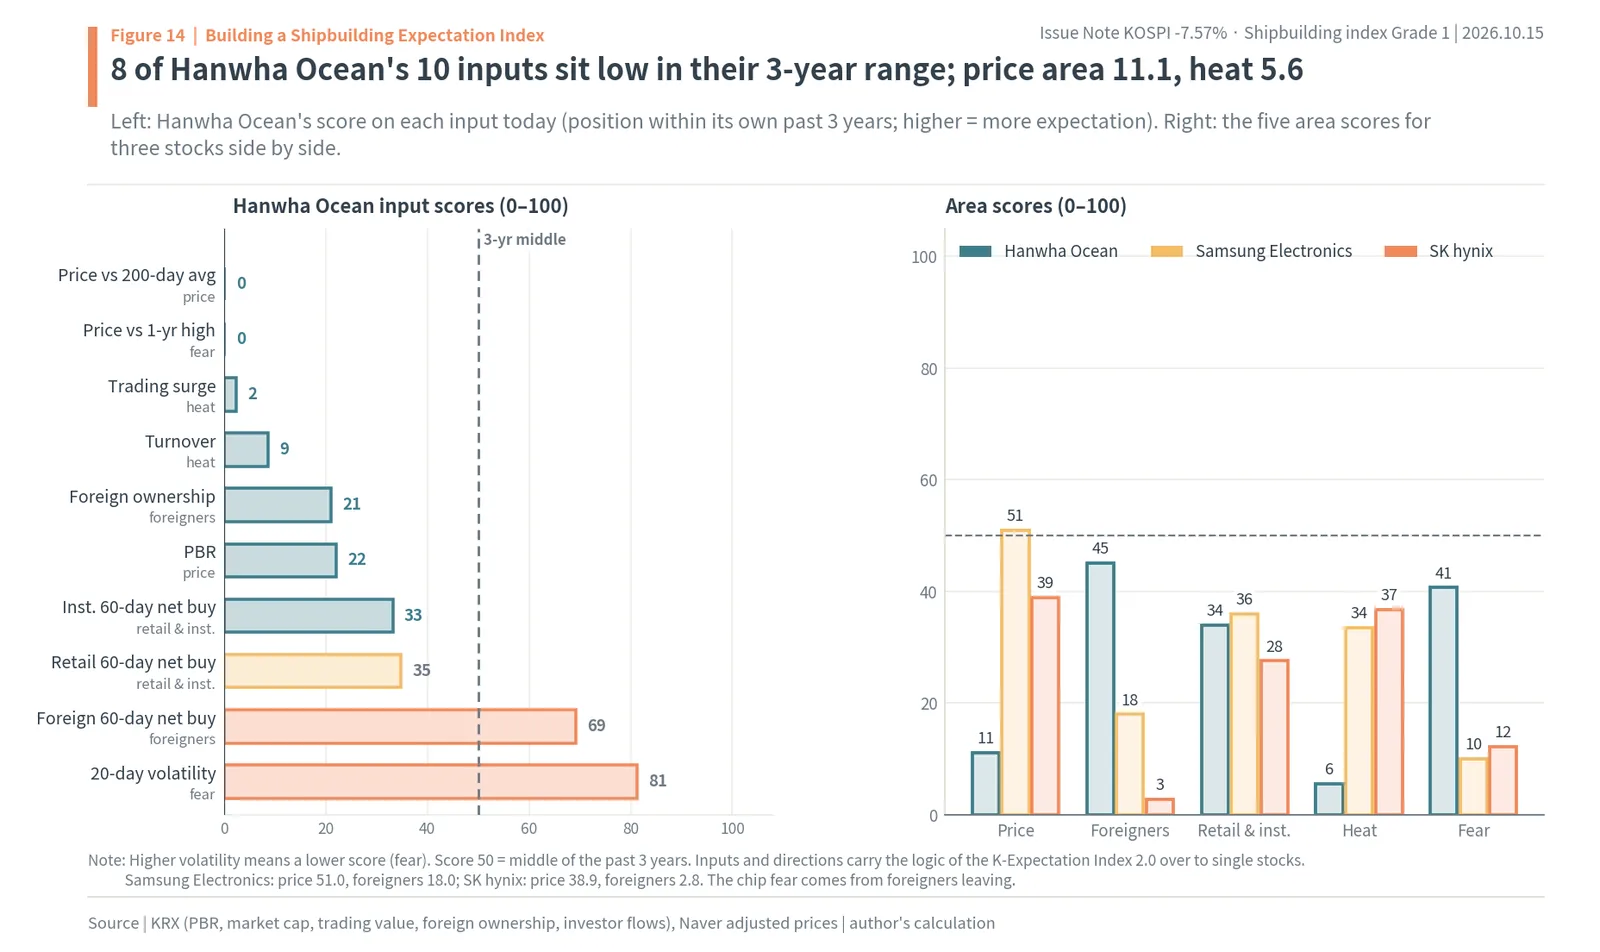
The left of Figure 14 shows Hanwha Ocean’s score on each input today: price versus 200-day average 0, price versus one-year high 0, trading surge 2, turnover 9, foreign ownership 21, PBR 22, institutional net buying 33 and retail net buying 35. Eight of the ten inputs sit in the bottom third of the past three years. Only foreign 60-day net buying (69) and volatility (81, meaning volatility is on the low side of the past three years) are high. The right sets the five area scores side by side for Hanwha Ocean, Samsung Electronics and SK hynix. Hanwha Ocean’s price area is 11.1 and its heat area 5.6: a fear of the “cheap and nobody is looking” kind. Samsung Electronics (price 51.0, heat 33.5) and SK hynix (price 38.9, heat 36.8) still have prices and trading in the middle, while their foreigner areas (18.0 and 2.8) and fear areas (10.1 and 12.2) are at the bottom. The chip fear is the fear of shaking as foreigners leave; the shipbuilding fear is the fear of a stock whose price has already fallen and whose buyers have already gone.
Hanwha Ocean at 30.5, Grade 1: only 7.1% of days in three years of history were lower

Today Hanwha Ocean’s Shipbuilding Expectation Index is 30.5, Grade 1 (the bottom). It is the base score of 27.3 with its distance from 50 scaled by a dispersion multiplier of 0.859. Only 7.1% of the days with an index value were lower than today, and the lowest was 22.2 on January 28, 2022. Figure 15 shows Hanwha Ocean’s share price (top) and its Shipbuilding Expectation Index (bottom, with grade bands) since 2019. The index was 58.7 (Grade 7) on January 13, the day of this year’s share price high; 46.9 (Grade 4) on June 22, the day of the KOSPI’s record; and 30.9 on October 2. On the same June 22, Samsung Electronics was at 77.3 and SK hynix at 75.1, both Grade 10 (overheated). When chips were overheated, shipbuilders were in the middle; now shipbuilders are at the bottom. The observation that buying flowed to chips and not to shipbuilders shows up in the index as well.
Other shipbuilders are low too: Samsung Heavy Industries 29.7 (Grade 1), HD KSOE 38.8 (Grade 2) and HD Hyundai Heavy Industries 40.4 (Grade 2). The two chip stocks have also dropped to Grade 1 in this plunge (Samsung Electronics 34.3, SK hynix 30.1), but as shown above, the substance differs. The chip fear has a reason, the AI investment chain; the shipbuilding fear, as Sections 7 to 9 showed, has none.
Buying on Grade 1 days returned an average of 19.4% six months later

Figure 16 is a report card by grade. For the four shipbuilders from July 2017 to April 2026, it counts the average return six months (126 trading days) later if you had bought a stock on a day it was at a given grade. There were 461 Grade 1 cases (stock-days), with an average return of +19.4% six months later, a median of +13.4%, and 72% of cases rising. That beat buying on any day (average +16.1%, 61% rising). Splitting the period sometimes makes the difference clearer. From July 2017 to June 2021, buying on Grade 1-2 days returned an average of +20.0% six months later and buying on Grade 9-10 days -17.8%: the lower the grade, the clearly better the result. In the shipbuilding boom from July 2021, every grade rose sharply, and even Grades 9-10 returned +30.5%. The chart on the right shows the two periods side by side by grade. The author thinks now is closer to the 2017-2021 report card, because the boom’s expectations have already burned out once.

Figure 17 gathers today’s grades as gauges. The market-wide K-Expectation Index is at Grade 8, but looking at shipbuilders alone, Hanwha Ocean and Samsung Heavy Industries are at Grade 1 and HD KSOE and HD Hyundai Heavy Industries (HD HHI in the gauges) at Grade 2. The author sees now as a fear zone for non-AI exporters such as shipbuilders. For the market as a whole to cool fully, chip expectations have to come down further, but shipbuilders are already in the bottom grades.
12. The author’s view: a fear zone for Korean shipbuilders, and dates to watch
The nine steps again, one line each
Here is the chain of this report once more. ① US consumer prices rose 3.7% in September, above the 3.6% forecast, lifting the odds of an October Fed hike from 22.1% to 33.2%. ② On the same day, Gartner’s AI impairment warning and Anthropic’s slowing growth deepened doubts about AI returns. ③ Foreigners sold KRW 3.77tn of KOSPI stocks today and KRW 17.99tn over seven trading days. ④ If US rates actually rise, the Korea-US rate gap widens and USD/KRW rises (+6.6% in 2018, +18.6% in 2022). ⑤ A weaker won is good news for shipbuilders paid in dollars (a 10% rise in USD/KRW → +KRW 330.56bn of pre-tax profit at Hanwha Ocean). ⑥ The chip fall can be understood through the AI chain (Samsung Electronics -9.48%, SK hynix -11.06%). ⑦ In Korea, two stocks are 46.9% of the KOSPI, so the index fell with them; abroad, chip-heavy markets averaged -4.95% and chip-light markets -0.24%. ⑧ Yet shipbuilders fell 4% to 7% as trading dried up, even on a day when foreigners were net buyers of KRW 12bn. ⑨ On the Shipbuilding Expectation Index, Hanwha Ocean is at Grade 1, the bottom zone.
The author sees now as a fear zone for non-AI exporters such as shipbuilders. AI fear belonged to chips, and rate fear is a link that would actually work in shipbuilders’ favor. Shipbuilders were sold along with chips not because of their business numbers but because of the market’s makeup (all-in on chips), debt (forced liquidation), and the vacuum left when buyers disappeared.
Dates to watch

Figure 18 shows the schedule for the next two months. On October 22 the Bank of Korea’s Monetary Policy Board sets the base rate; all ten experts surveyed by Etoday expect a hold. On October 27 Hanwha Ocean reports third-quarter results and holds a conference call at 2 p.m. (DART). The third-quarter operating profit consensus is KRW 552bn (about $411mn). The US FOMC meets on October 27-28, with the result early on October 29 Korea time. A hike there would widen the Korea-US rate gap to -1.25pp. US October consumer prices come out on November 10, followed by the BOK’s last rate meeting of the year on November 26 and the FOMC on December 8-9.
The author watches three signals. First, whether the Fed actually raises rates in October and USD/KRW climbs above its September 17 level (KRW 1,382.2). Second, how the order backlog and FX effects show up in Hanwha Ocean’s third-quarter results. Third, whether the Shipbuilding Expectation Index climbs out of Grade 1, and whether Hanwha Ocean’s trading value returns toward its 120-day average (KRW 165.4bn). When the buyers come back, the fear zone ends. By “fear zone” the author does not mean the stock will rise tomorrow. It means prices and trading are already near the bottom of their past three years, so the stock is less shaken by selling unrelated to the company’s numbers and is positioned to react strongly to real events such as a rate hike or earnings.
13. Data and methods: how the market, flow, FX and index numbers were calculated
Share prices and closes
October 15 closes for Korean stocks are KRX regular-session closes. KRX market cap divided by shares outstanding matched Yahoo Finance’s KRX closes (Hanwha Ocean KRW 62,400, HD KSOE KRW 263,000, Samsung Electronics KRW 210,000, SK hynix KRW 1,262,000). Some articles and Naver quotes show values that include after-hours trading on Nextrade, Korea’s alternative trading venue (Hanwha Ocean KRW 62,100, -7.86%), but this report uses KRX regular-session closes. Long price histories since July 2014 are Naver Finance adjusted prices, with the most recent two years replaced by KRX regular-session closes. Changes and period returns divide one close by another. 2026 returns start from the January 2 close.
Overseas indexes are Yahoo Finance closes. US indexes and stocks are for October 14 (local time), Asia for the October 15 close, and the four European indexes are intraday values on the evening of October 15 Korea time and may differ at the close. The TOPIX’s -2.38% is from Etoday (citing MarketWatch). The grouping into chip- and AI-heavy, middle and chip-light markets is the author’s classification, and group averages are simple averages.
Flows and market cap
Net buying by investor type is KRX investor-type trading (in won), and foreigners are registered foreigners plus other foreigners. Today’s foreign figure of KRW 3,771.8bn is the final count after the close and differs from the roughly KRW 3.6tn in articles right after the close. The two-stock weight is the common-share market cap of Samsung Electronics and SK hynix ÷ total KOSPI market cap (KRX). The two stocks’ share of today’s index drop (-309.0 points) is an approximation: the two stocks’ market-cap decline divided by the previous day’s KOSPI market cap, multiplied by the previous day’s index. Forced liquidation and margin loans are KOFIA data, published a day late. Trading value and net buying by stock add up KRX daily data from January 2 to October 15, 2026.
Rate gap and exchange rate
The rate gap is the BOK base rate minus the upper end of the US policy rate range (month-end, from Fed and BOK sources). The long-run USD/KRW series is the monthly average of the Fed’s H.10 (New York noon rate), and period changes use H.10 daily values. 2018 is KRW 1,070.5 on March 21 → KRW 1,141.7 on October 26; 2022 is KRW 1,214.3 on March 17 → KRW 1,440.5 on September 28; summer 2026 is KRW 1,488.4 on July 15 → KRW 1,381.3 on August 27; and September 2026 is KRW 1,367.7 on September 16 → KRW 1,388.0 on September 18. The change per 1pp of gap is the period change divided by the change in the gap (author’s calculation). Seoul closes are from articles (today KRW 1,344.6, Newspim), and the dollar conversions in this report use that rate. Hanwha Ocean’s FX sensitivity (+KRW 330.56bn of pre-tax profit for a 10% rise in USD/KRW) comes from the consolidated notes to the 2025 annual report; the 2026 half-year report has no sensitivity table. The 39% of pre-tax profit divides by 2025 pre-tax profit of KRW 842.4bn (WiseReport).
Shipbuilding Expectation Index
The inputs and directions of the Shipbuilding Expectation Index were set in advance by carrying the logic of K-Expectation Index 2.0 over to single stocks: PBR (KRX), share price versus 200-day average, foreign ownership (KRX), 60-day foreign, retail and institutional net buying ÷ market cap (KRX), 20-day average trading value ÷ market cap, 20-day ÷ 120-day average trading value, the 20-day standard deviation of daily returns (annualized; higher means a lower score), and share price versus the high of the previous 252 trading days. Each input is converted to a percentile within that stock’s previous 756 trading days (minimum 378), the average of the ten inputs is the base score, and the standard deviation of the five area scores ÷ 20.8 (the median for the four shipbuilders over the whole period) is the multiplier. Grade cutoffs are the deciles of the index for the four shipbuilders over the whole period. Hanwha Ocean’s shares were suspended from July 2016 to October 2017, so there are no values for that period. HD Hyundai Heavy Industries listed in September 2021, so its index starts in 2023.
The inputs were also tested. If, as with K-Expectation Index 2.0, only inputs whose higher scores were followed by lower six-month returns in both periods (July 2017-June 2021 and July 2021-April 2026) are kept, only two remain: foreign 60-day net buying and volatility. That is because in the shipbuilding boom after 2021, higher price and trading inputs went with higher returns. An index built from those two inputs alone gives uneven six-month returns by grade (Grade 1 +22.2%, Grade 9 +21.5%, Grade 10 +7.8%), which makes it hard to use as a gauge of high and low expectations. So this report keeps the ten inputs chosen for their meaning and discloses the test results here (the two-input version puts Hanwha Ocean at 61.0). The six-month returns in the grade report card are averages across all stock-days of the four shipbuilders, so many periods overlap.
Market-wide K-Expectation Index and consensus
The market-wide K-Expectation Index 2.0 value for October 15 (61.2, Grade 8) is the author’s stockkit calculation; deposits and margin data are published a day late by KOFIA, so the previous day’s values are used. Consensus is WiseReport as of October 14 (22 brokerages, average target price KRW 131,682, 2026 EPS KRW 6,480, third-quarter operating profit KRW 552bn). The forward PER of 9.6 times is today’s close of KRW 62,400 ÷ 2026 EPS of KRW 6,480. Hanwha Ocean’s $33.77bn order backlog is the company IR figure on a delivery basis; the KRW 33.01tn balance in the DART half-year report excludes the portion already booked as revenue, so the two differ.
KOSPI crash and Korean shipbuilders FAQ
Q. Why did the KOSPI crash on October 15, 2026?
Two triggers hit at once. US September consumer prices rose 3.7% against a 3.6% forecast, lifting the odds of an October Fed hike from 22.1% to 33.2%, and doubts about AI returns grew after Gartner warned that more than $3.5tn of AI infrastructure assets could face impairment by 2030. Foreigners sold a net KRW 3.77tn of KOSPI stocks, and the index fell 7.57% to 5,554.22, with circuit breakers in both the KOSPI and the KOSDAQ.
Q. Why did the KOSPI fall more than other stock markets?
Samsung Electronics and SK hynix make up 46.9% of KOSPI market cap, so a scare aimed at AI chips drags the whole index. Chip- and AI-heavy markets averaged -4.95% and chip-light markets -0.24%, and the two stocks accounted for 67.8% of the KRW 375.9tn of KOSPI market value lost that day.
Q. Why did Hanwha Ocean stock fall?
Not because of its business. Hanwha Ocean fell 7.42% to KRW 62,400 while foreigners were net buyers of KRW 12bn across the four big shipbuilders. Its trading value was KRW 65bn, 39% of its 120-day average, so buyers disappeared rather than sellers piling in. The consensus target price of KRW 131,682 and 2026 EPS of KRW 6,480 (a forward PER of 9.6 times) were unchanged.
Q. How does a US rate hike affect Korean shipbuilders?
A US hike widens the Korea-US rate gap, which has weakened the won in the past (USD/KRW rose 6.6% in 2018 and 18.6% in 2022). Shipbuilders are paid mostly in dollars, and a 10% rise in USD/KRW adds KRW 330.56bn to Hanwha Ocean’s pre-tax profit. On September 17, the day after the Fed’s last hike, the four shipbuilders rose 2.83% to 6.58% while chips fell.
Q. What is the Shipbuilding Expectation Index?
It is the author’s stock-level version of the K-Expectation Index 2.0. Ten inputs, including PBR, price versus the 200-day average, foreign ownership, 60-day flows, turnover, volatility and price versus the one-year high, are ranked within each stock’s past three years and combined into a 0 to 100 score with ten grades. Hanwha Ocean scores 30.5, Grade 1, and buying the four shipbuilders at Grade 1 returned an average of 19.4% six months later between July 2017 and April 2026.
Sources
- Yonhap, “US, Japan and Taiwan fell 1.9-4.9%… why did the KOSPI fall twice as much?” (link), 2026.10.15
- Yonhap, Foreigners sell nearly KRW 18tn of KOSPI stocks this month (link), 2026.10.15
- Edaily, KOSPI closes down 7%, circuit breakers in both markets (link), 2026.10.15
- MBN, KOSPI and KOSDAQ close down more than 7% (link), 2026.10.15
- Seoul Economic Daily, Goldman compares the KOSPI’s selling without a rebound to the pandemic and the US downgrade (link), 2026.10.15
- Financial News, 52-week lows pile up in shipbuilding, power equipment and defense (link), 2026.10.15
- Newsis, KRW 270bn of forced liquidation as margin investors are hit by the plunge (link), 2026.10.15
- News1, October rate hike talk rises as US inflation picks up again (link), 2026.10.15
- News1, US Treasury yields turn lower (link), 2026.10.15
- iNews24, US September consumer prices up 3.7% (link), 2026.10.15
- Seoul Economic Daily, AI and advanced-economy debt under strain (CME FedWatch 22.1% → 33.2%) (link), 2026.10.15
- US Bureau of Labor Statistics, Consumer Price Index: September 2026 (link), 2026.10.14
- US Department of the Treasury, Daily Treasury Par Yield Curve Rates (link), 2026.10.14
- Federal Reserve, FOMC statement (link), 2026.09.16; FOMC calendar (link)
- Seoul Economic Daily, Gartner sees $3.5tn of AI investment assets at risk of impairment by 2030 (link), 2026.10.15
- Digital Daily, Anthropic third-quarter revenue $16.8bn (link), 2026.10.15
- Aju Business Daily, market close: KOSPI falls 7.6% (Anthropic growth 140% → 45%) (link), 2026.10.15
- News1, Philadelphia Semiconductor Index falls 4.30% (link), 2026.10.15
- Korea Economic Daily, CoreWeave bonds fall to distressed prices (link), 2026.10.15
- Etoday, Asian markets close (Nikkei, TOPIX) (link), 2026.10.15
- Hargreaves Lansdown (Sharecast), London open: FTSE edges up despite Asian tech selloff (link), 2026.10.15
- Kookmin Ilbo, NPS chairman answers criticism for not selling Samsung and SK hynix (link), 2026.10.15
- Korea.kr policy briefing, fifth NPS Fund Management Committee meeting of 2026 (link), 2026.05.28; Newsis, first committee meeting suspends rebalancing (link), 2026.01.26
- Newspim, USD/KRW closes at KRW 1,344.6 (link), 2026.10.15
- Etoday, KOSPI holds the 6,760 line despite KRW 1.5tn of foreign selling, shipbuilding and defense strong (link), 2026.09.17
- JoongAng Ilbo, USD/KRW at KRW 1,382.2 after the Fed hike (link), 2026.09.17
- Etoday, USD/KRW at KRW 1,439.9, highest in 13 years and six months (link), 2022.09.28
- Kyungje Ilbo, won appreciates 8.81% in July (link), 2026.08.02
- Etoday, rate poll: BOK expected to hold in October (link), 2026.10.15
- Bank of Korea, base rate history (link); Federal Reserve H.10 and H.15 (DBnomics mirror)
- Financial News, Hanwha Ocean second-quarter operating profit KRW 736.1bn (backlog $33.77bn) (link), 2026.07.27
- Korea Economic Daily, why Hanwha Ocean’s target prices slipped after an earnings surprise (link), 2026.07.29
- ChosunBiz, profit forecasts for HD Hyundai Heavy Industries and Hanwha Ocean cut as the won strengthens (link), 2026.10.06
- Edaily editorial, operating margins if the exchange rate falls KRW 100 (link), 2026.10.07
- Seoul Economic Daily, Hanwha Ocean hedge ratio at 70% (link), 2026.10.09
- Korea Economic Daily, IBK sees Hanwha Ocean’s LNG carrier revenue share falling from 70% to 40% (link), 2026.10.15
- Etoday, shipbuilders hit by FX and flows (KB Securities) (link), 2026.08.26
- Seoul Economic Daily, Hanwha Ocean September orders KRW 2.89tn (link), 2026.09.30
- Aju Business Daily, January Clarksons Newbuilding Price Index 184.29 (link), 2026.02.06; Yonhap, Korea’s ship orders rebound in September (186.59) (link), 2026.10.07
- Asia Economy, Hanwha group stocks rise on split-off (link), 2026.01.15
- Dealsite, Hanwha Ocean PRS reference price KRW 128,000 (link), 2026.09.30; DART, Hanwha Aerospace large shareholding report (link), 2026.04.08
- Alpha Economy, Hanwha Ocean plunges after losing the Canadian submarine bid (link), 2026.07.07
- Daily Hankook, foreigners sell shipbuilders for chips (link), 2026.04.21; Chosun Ilbo, chips sweep the KOSPI top 10 as shipbuilding, defense and nuclear are pushed out (link), 2026.09.01
- DART, Hanwha Ocean 2025 annual report (FX sensitivity) (link), 2026.03.17; 2026 half-year report (link), 2026.08.12; IR event notice (link), 2026.10.13
- WiseReport, Hanwha Ocean consensus (link), as of 2026.10.14
- KRX Data System (closes, market cap, investor flows, PBR, foreign ownership), Naver Finance (adjusted prices, advancers and decliners), Yahoo Finance (overseas indexes, stocks, exchange rates), KOFIA (credit, forced liquidation), 2026.10.15
- Photos: Offshore drilling platforms under construction (KJRSeattle, CC BY-SA 4.0) (link); Hyundai Heavy Industries Ulsan shipyard from Jujeon Beacon Mound (Wvdp, CC0) (link), Wikimedia Commons
Was this note useful?
Thanks. Your answer helps decide what to cover next.
Korea market snapshot · Oct 23, 2026
New to Korean stocks? Start here for the basics.
Most read
1France Protests 2026: Why Students Are Blocking Schools and Which Stocks Benefit (Munich Re, SCOR)
Get the Saturday note on Korean stocks
One email every Saturday with the week’s new research on Korean listed companies and links to the updated data pages. Built from DART filings and KRX data. Free; unsubscribe in one click. See past issues