Korean Solar Stocks Forecast: Why OCI Holdings (010060.KS) and Hanwha Solutions (009830.KS) Jumped, and Who Gets Paid by the US Price Floor
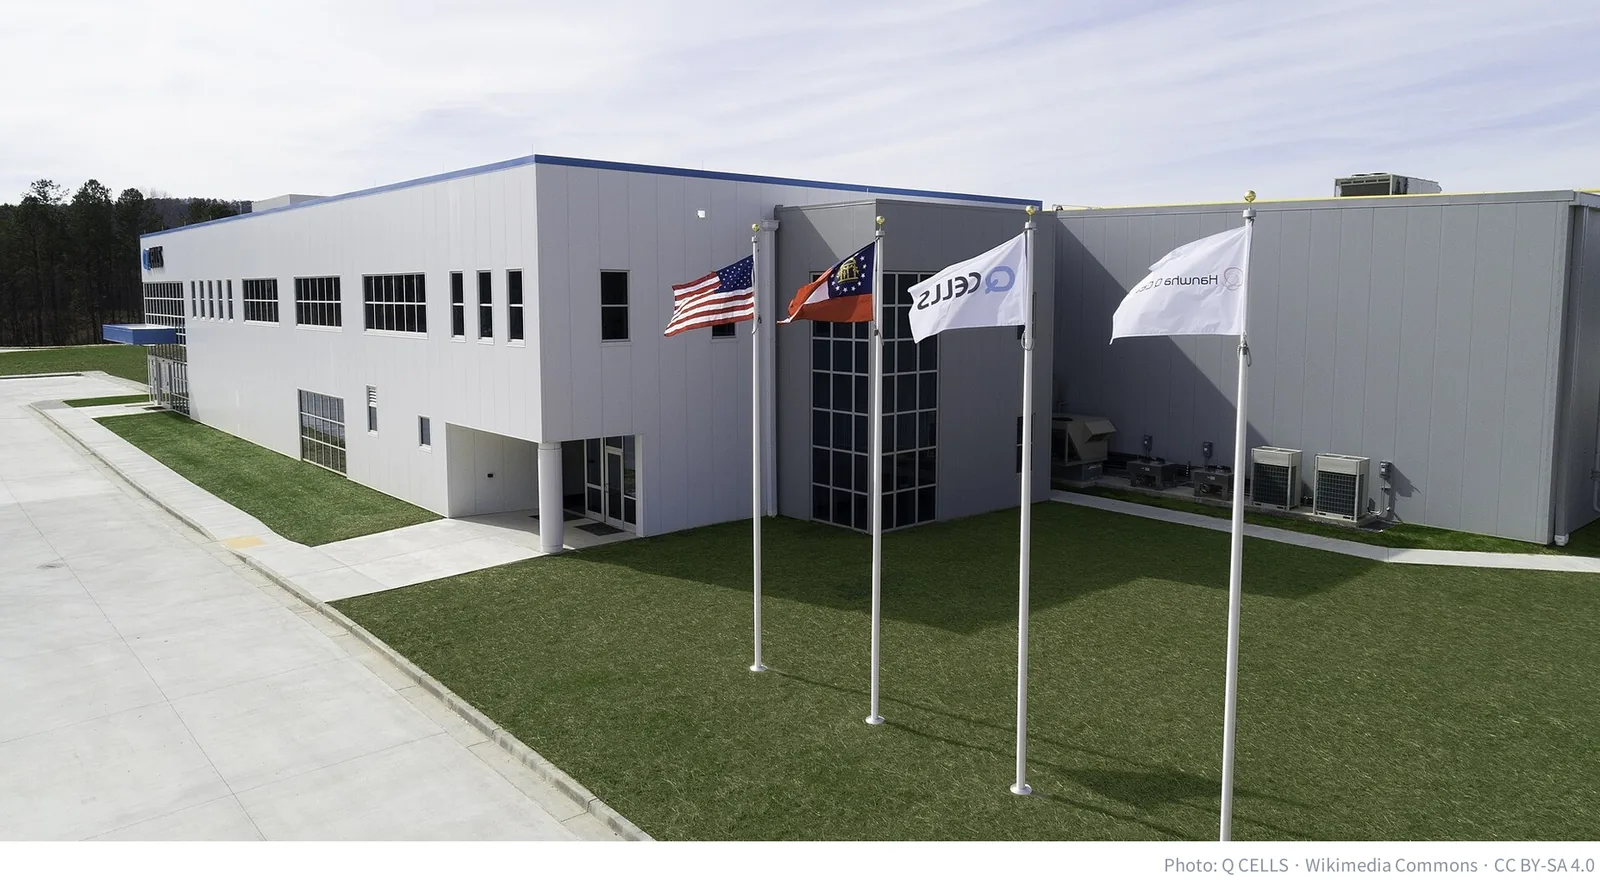
In January 2018, the United States put a safeguard tariff on imported solar cells and modules: 30% in the first year, stepping down 5 percentage points a year for four years, with the first 2.5GW of cells exempt. Four months later, in May 2018, Hanwha Q CELLS said it would build a module plant in Georgia with more than 1.6GW of yearly capacity. CleanTechnica called the move an “obvious direct response” to the January tariff. That plant, in Dalton, has run since 2019, and its module capacity has since grown to 5.1GW a year.
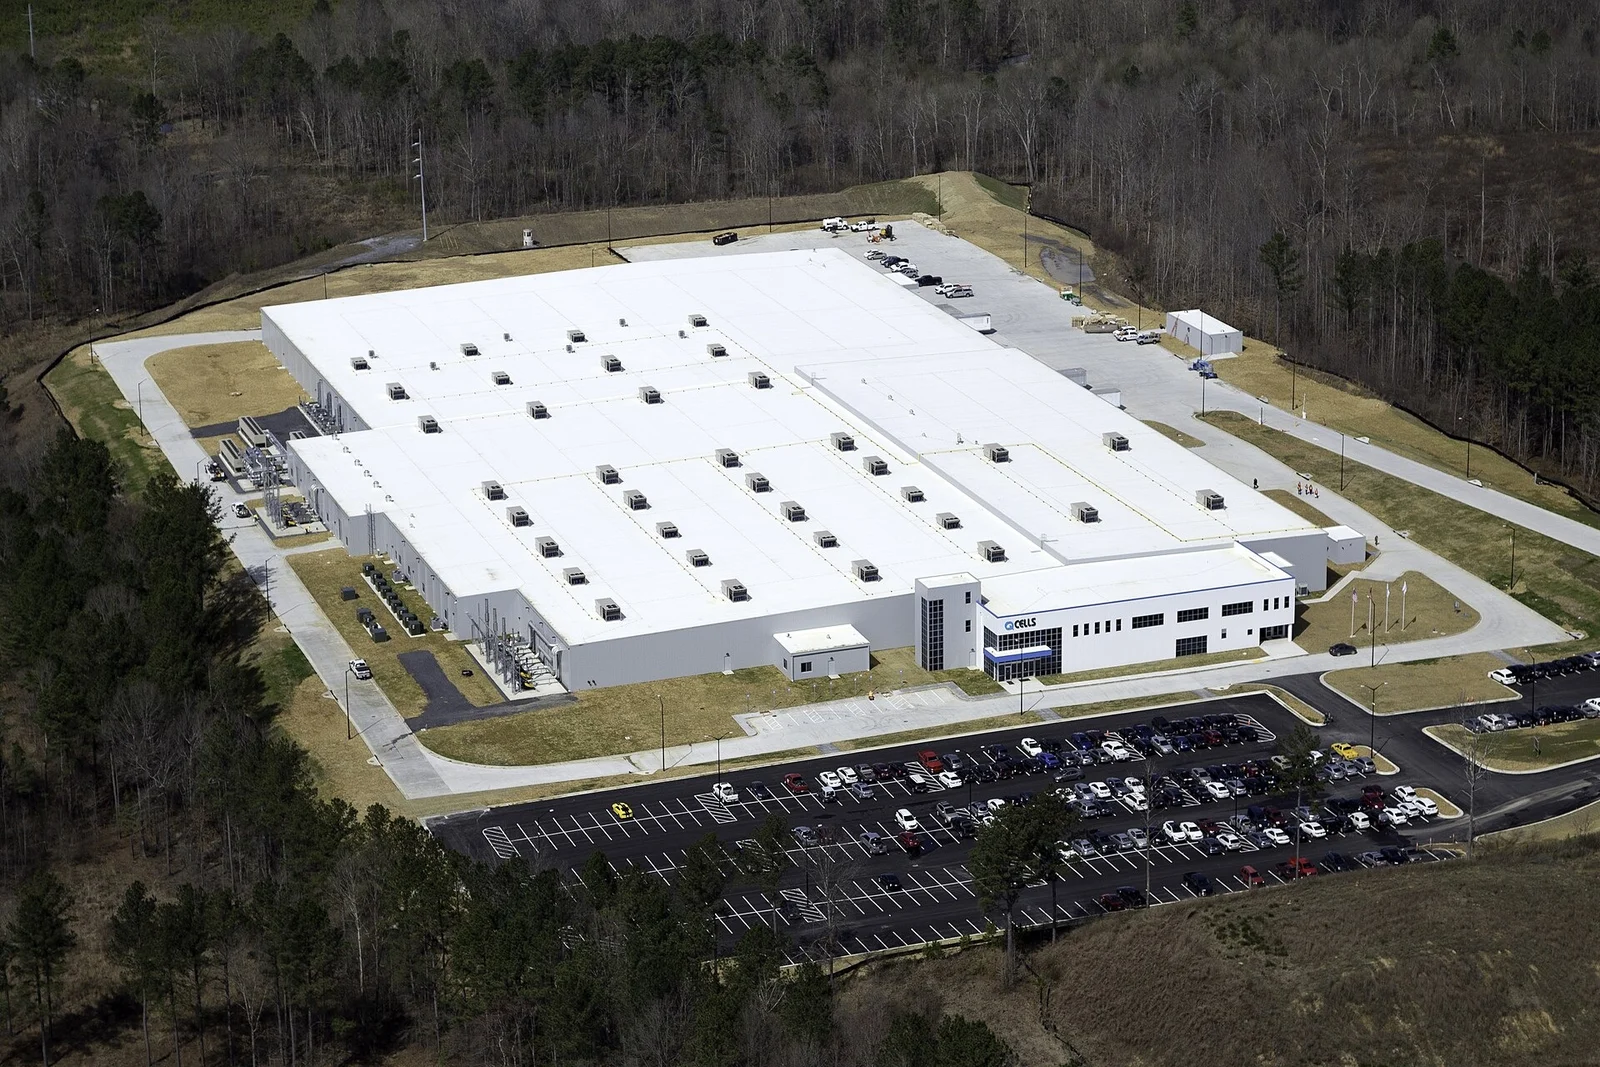
Eight years later, in July 2026, Hanwha Qcells began making ingots, wafers and cells as well in Cartersville, Georgia. Together the two sites give it 3.3GW each of ingot, wafer and cell capacity and 8.6GW of module capacity in the US: every step after polysilicon, on American soil. The story of the past eight years has been simple. The higher the trade wall, the more the factory inside it gets paid.
So what about this time? On October 19, 2026, Korea’s KOSPI opened 3.17% lower and closed at 5,768.01, up 1.76% and at the day’s high. The same day OCI Holdings (010060.KS) rose 9.66%, Hanwha Solutions (009830.KS) 7.95% and HD Hyundai Energy Solutions (322000.KS) 6.57%. This report asks three questions. Why did solar stocks rise more than the market? Is it a one-day story or something that lasts? And if it lasts, who gets paid, and how much of it is already in the share prices?
As of: October 19, 2026. Share prices are Korea Exchange (KRX) adjusted regular-session closes; intraday paths are Naver Finance one-minute prices; investor flows are KRX data by investor type, which Korea publishes every day; consensus is WiseReport as of October 16. US stocks and the exchange rate are Yahoo Finance closes (US stocks October 16; KRW 1,329.9 per dollar on October 19, 2026, used for every dollar conversion here). China’s measure follows pv magazine and Xinhua (October 16); the US proclamation follows the White House text of August 6; company figures follow Etoday (October 2), The Korea Herald (August 6), Herald Economy (June 9) and DART, Korea’s electronic disclosure system. Numbers the author calculated are marked as such.
Korean terms used here: the KOSPI is the main board of the Korea Exchange and the KOSDAQ its tech-heavy second board; Korean stocks have a daily price limit of ±30%. 억원 (eok won) figures are converted to KRW billions (KRW bn) and 조원 to KRW trillions.
1. Of the three stocks’ 8.06% gain, the market accounted for only 1.2 percentage points
A few terms first
Beta is how much a stock’s daily move has tracked the KOSPI’s daily move: a beta of 0.5 means the stock rises about 1% on average when the KOSPI rises 2%. Excess return is the stock’s return minus the KOSPI’s over the same period, in percentage points (%p). Forward EPS is the earnings per share analysts expect for a coming year, and the forward P/E is today’s price divided by it.
On trade: a minimum import price (MIP) is a floor below which a product cannot be imported. Anti-dumping duties apply when exporters are found to sell below home-market prices, and countervailing duties when they are found to receive government subsidies. FEOC means “foreign entity of concern”; US tax law withholds credits when parts or capital from such entities, including Chinese ones, exceed a threshold. The AMPC (advanced manufacturing production credit) pays US makers of cells, wafers and other parts a credit for every unit they produce. A long-term contract (LTA) fixes volumes and price terms years ahead.
The shape of the day: a 3% drop at the open, a close at the high
October 19 was a roller coaster. After US tech and chip stocks fell sharply on Friday, the KOSPI opened at 5,488.41, down 3.17%. It turned positive around 10 a.m., slipped back to about 5,638 on foreign selling around 11:10, then extended its gain through the afternoon to close at 5,768.01 (+1.76%), the day’s high: a 5.1% move from open to close. Lee Kyung-min of Daishin Securities put the rebound down to bargain buying after a steep fall, fading foreign selling and a clear rebound outside AI chips. Pharmaceuticals (+5.77%), metals (+4.98%) and chemicals (+3.56%) led the KOSPI sectors, and battery makers Samsung SDI (+11.70%) and LG Energy Solution (+7.20%) led the large caps.
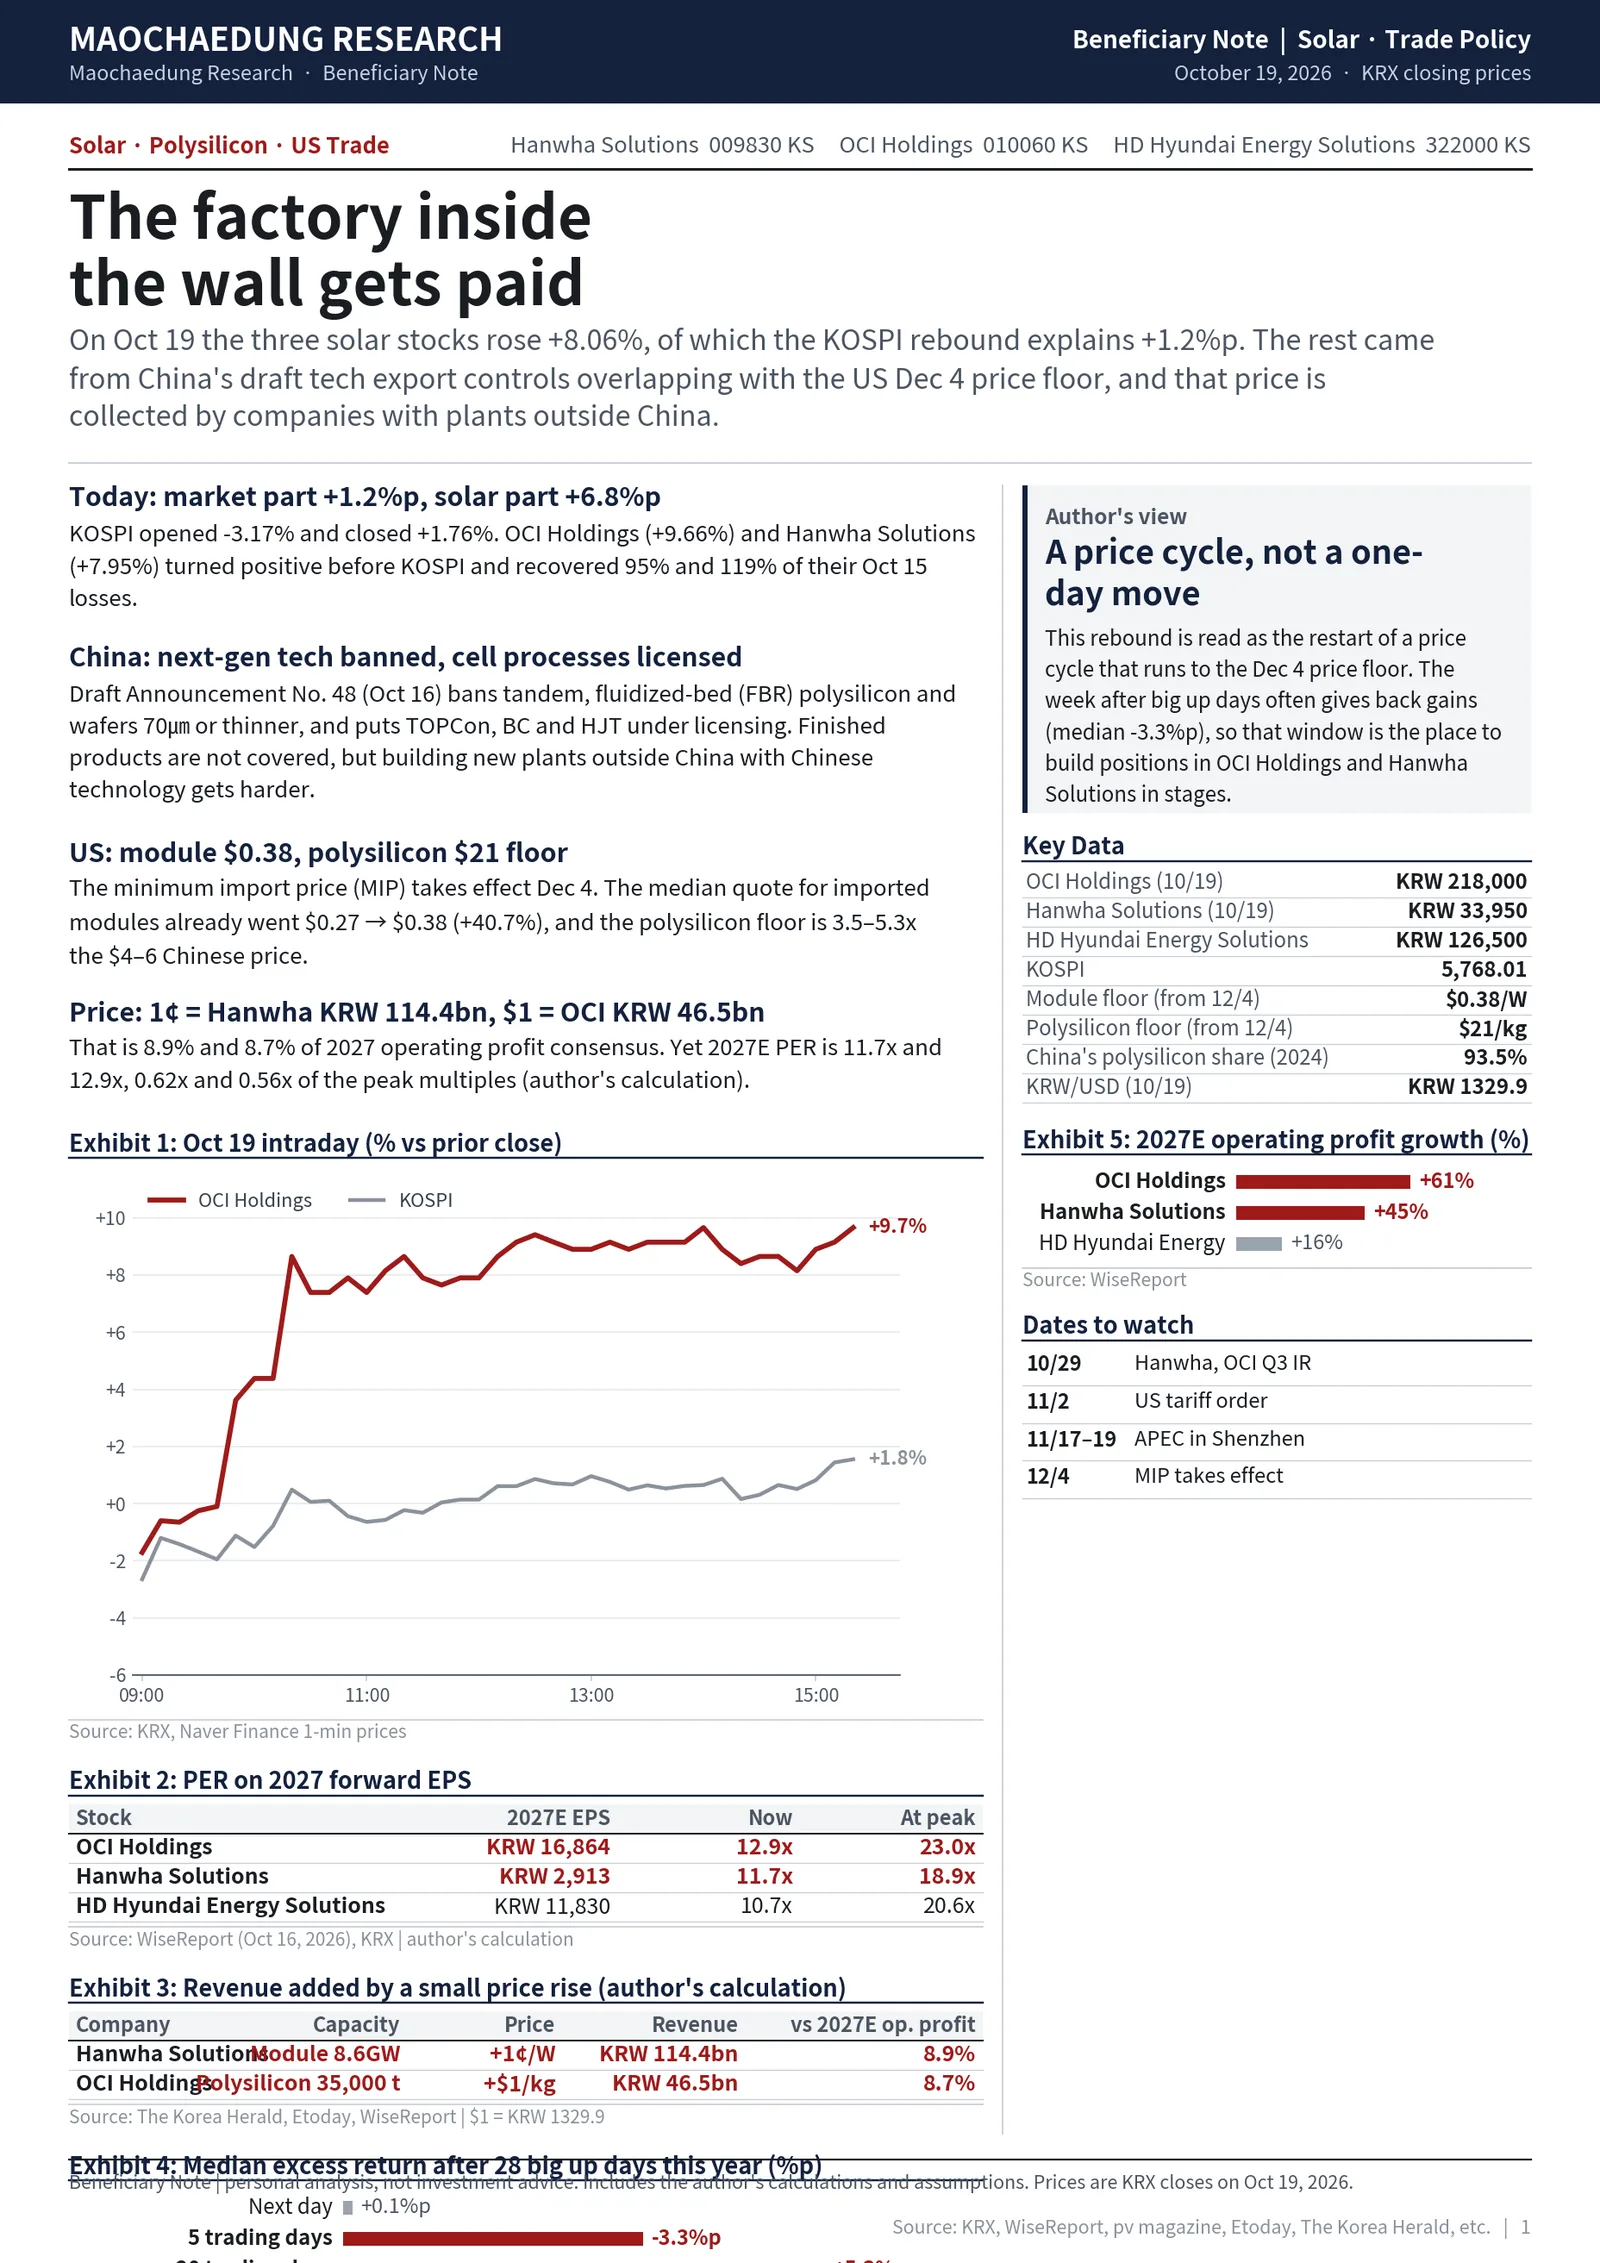
The three solar stocks moved far more. OCI Holdings opened at KRW 190,900 (-3.97%) and closed at KRW 218,000 (about $164, +9.66%). Hanwha Solutions went from KRW 30,700 (-2.38%) to KRW 33,950 (about $25.5, +7.95%). HD Hyundai Energy Solutions went from KRW 112,800 (-4.97%) to KRW 126,500 (about $95, +6.57%). From open to close that is +14.2%, +10.6% and +12.1%. The equal-weighted average of the three, +8.06%, was 4.6 times the KOSPI’s gain.
The order was different too. On a five-minute grid, OCI Holdings crossed above the previous close at 9:35 a.m. and Hanwha Solutions at 9:50; the KOSPI did not turn positive until 10:20. At 10:00 sharp OCI Holdings was already up 4.38% while the KOSPI was still down 1.52%. Buying came into solar before the market turned.
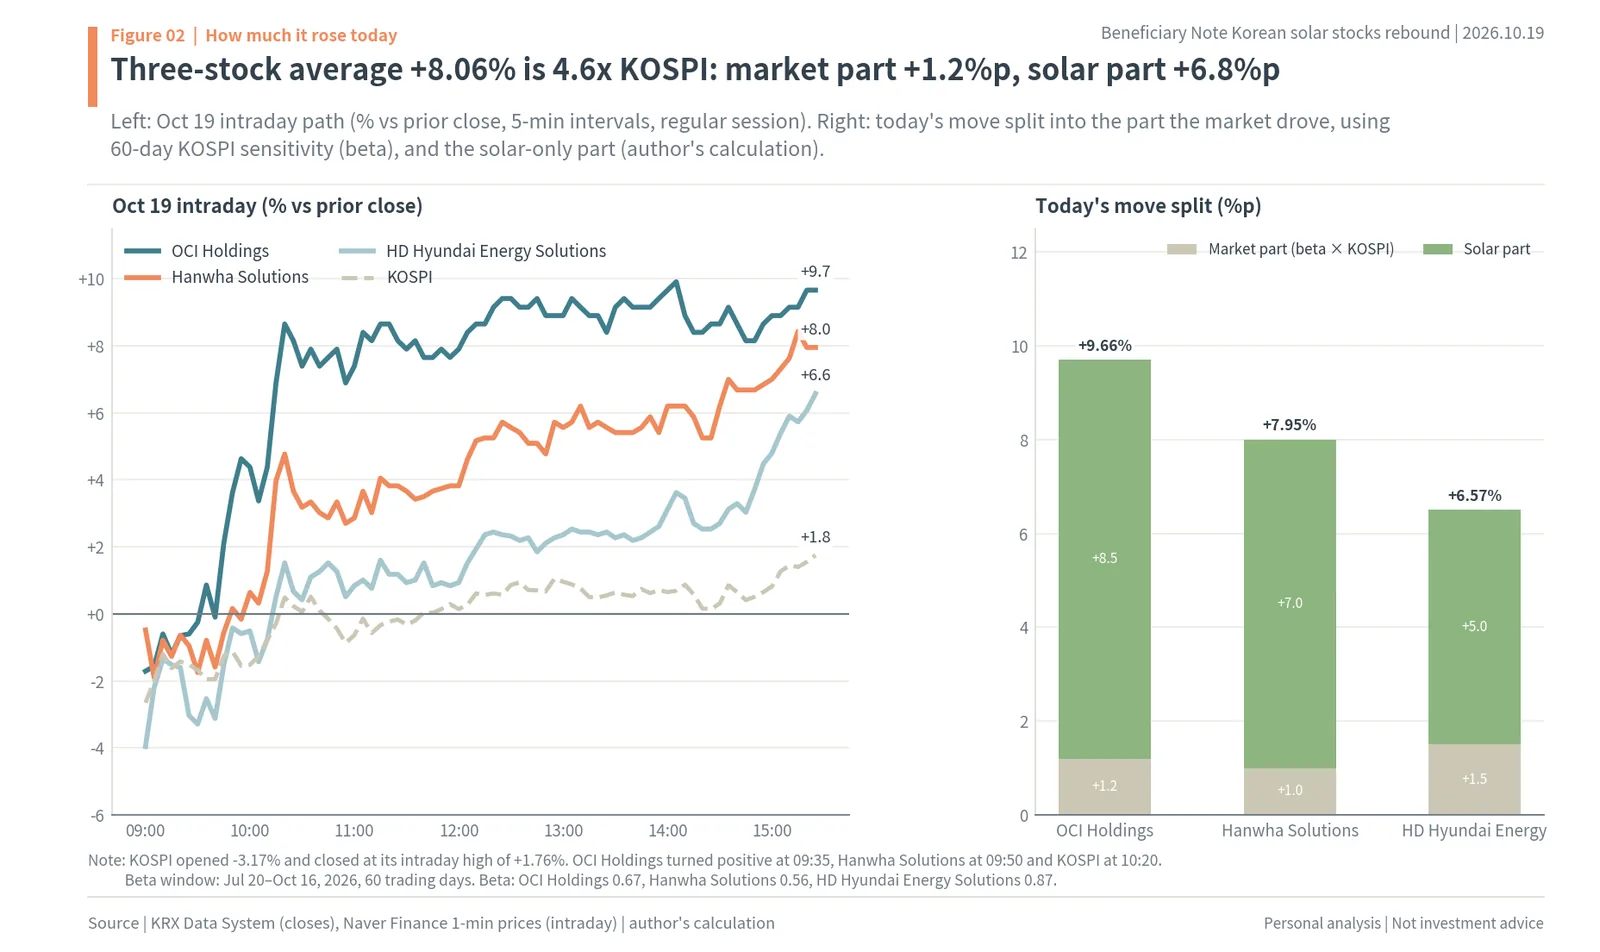
As Figure 2 shows, the three stocks’ average of +8.06% was 4.6 times the KOSPI, with a market part of +1.2%p and a solar part of +6.8%p. The left panel is the intraday path. The right panel splits the day’s gain in two. Over the last 60 trading days (July 20 to October 16), the betas to the KOSPI were 0.67 for OCI Holdings, 0.56 for Hanwha Solutions and 0.87 for HD Hyundai Energy Solutions. Beta times the KOSPI’s 1.76% gain is the part the market lifted; the rest belongs to the stock. The market part was only +1.2%p for OCI Holdings, +1.0%p for Hanwha Solutions and +1.5%p for HD Hyundai Energy Solutions, and the solar part was +8.5%p, +7.0%p and +5.0%p (author’s calculation). By the same method, Jusung Engineering, whose sales are mostly chip equipment, had a market part of +2.2%p and a stock part of -2.7%p: it moved apart from solar.
The news through the day
Solar news came in from morning to afternoon. At 6 a.m., Chosun Biz reported that Hanwha Qcells’ US unit had kept Chinese investors out of a bond deal. At 7:56 a.m., IBK Investment & Securities published a note arguing that the US price floor and China’s technology controls together favor companies with US production and their own technology (via Etoday). At 3:20 p.m., News1 carried the industry view that China’s export controls would do little direct harm in Korea and could help some non-Chinese makers. Bargain buying and fading foreign selling lifted the whole market, but what moved solar ahead of the market was China’s announcement of the previous Friday and how it was read.
Who won back the October 15 crash first?
To understand the day you have to go back four days. On October 15 the KOSPI fell 7.57%. HD Hyundai Energy Solutions fell 15.64%, OCI Holdings 14.40% and Hanwha Solutions 9.60%. Over the next two sessions (October 16 and 19) OCI Holdings gained 16.0% and Hanwha Solutions 12.6%, against 3.8% for the KOSPI.

As Figure 3 shows, Hanwha Solutions won back 119% of its October 15 drop and OCI Holdings 95%, against 47% for the KOSPI. Hanwha Solutions is now above its October 14 close (KRW 33,350) and OCI Holdings nearly back to it (KRW 219,500). HD Hyundai Energy Solutions regained 38%, Shinsung E&G 41% and Jusung Engineering 14%. Within solar, the companies with US factories (Hanwha Solutions) and non-Chinese polysilicon (OCI Holdings) recovered more than twice as fast as the market.
Who bought?
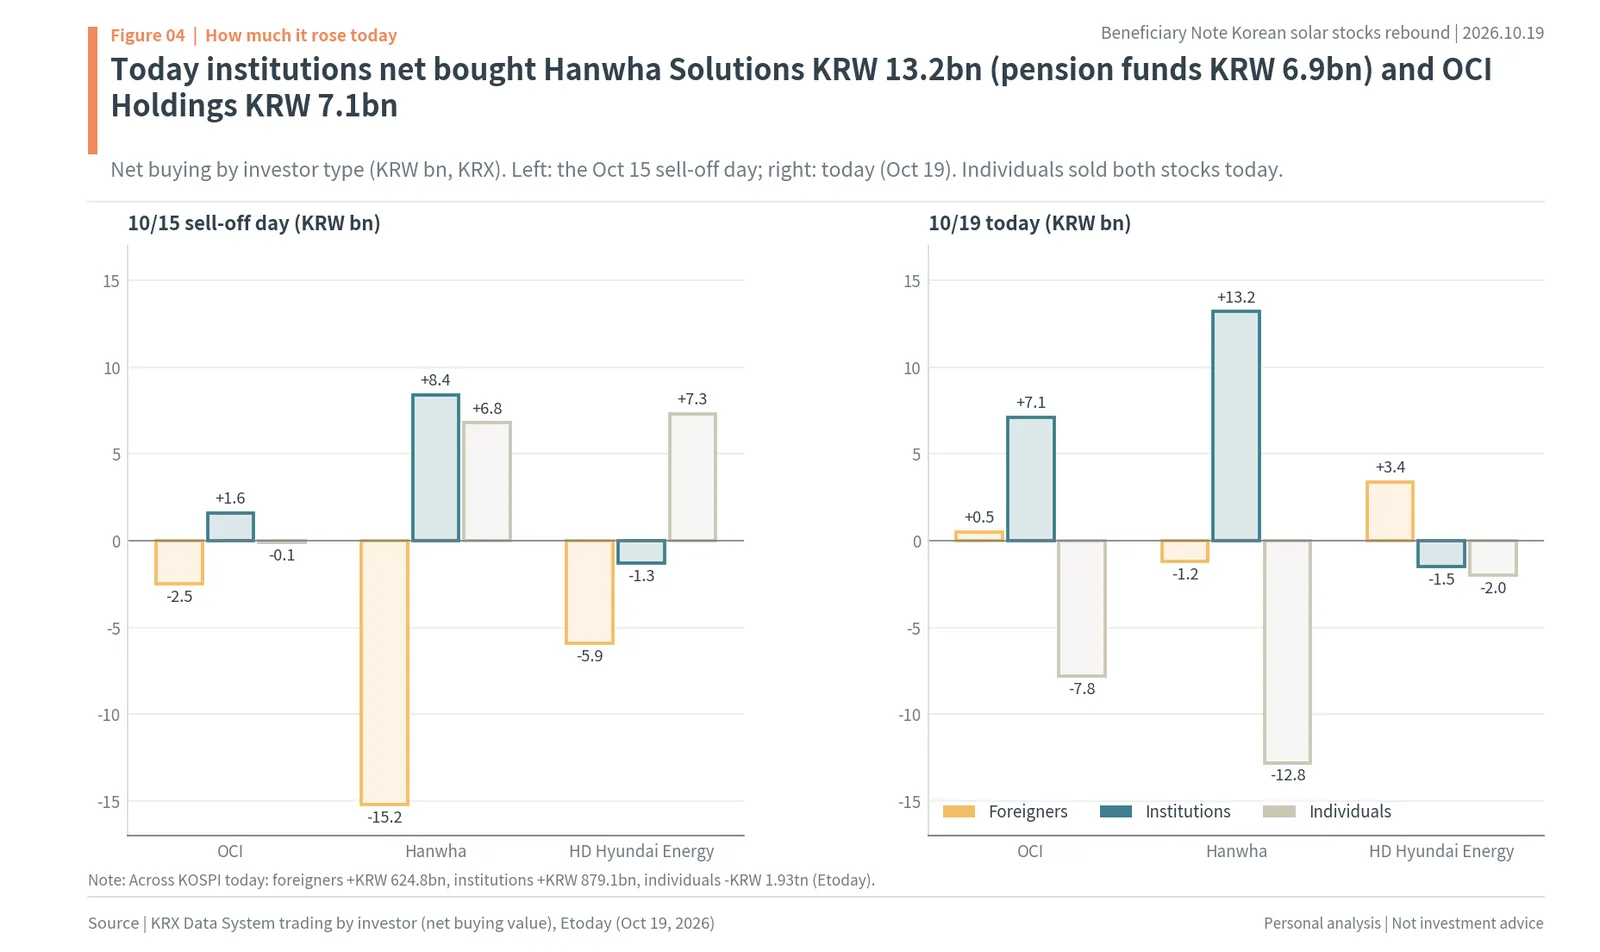
As Figure 4 shows, institutions net bought KRW 13.2bn of Hanwha Solutions (including KRW 6.9bn by pension funds) and KRW 7.1bn of OCI Holdings on October 19. Individuals net sold KRW 12.8bn and KRW 7.8bn of the two; foreign investors were small at -KRW 1.2bn and +KRW 0.5bn, and bought KRW 3.4bn of HD Hyundai Energy Solutions. On the October 15 crash, foreigners sold KRW 15.2bn of Hanwha Solutions while institutions took KRW 8.4bn and individuals KRW 6.8bn, so in three sessions the main buyer switched from individuals to institutions and pension funds. In between, on October 16, foreigners (+KRW 3.0bn) and institutions (+KRW 3.8bn) bought OCI Holdings while individuals sold KRW 7.0bn, and foreigners sold KRW 5.5bn of HD Hyundai Energy Solutions. Institutional money moved first toward the direct winners of the US floor and China’s controls. Across the KOSPI, foreigners bought a net KRW 624.8bn on October 19, institutions KRW 879.1bn, and individuals sold KRW 1.93tn.
This year’s path: well above January, about 40% below the peak
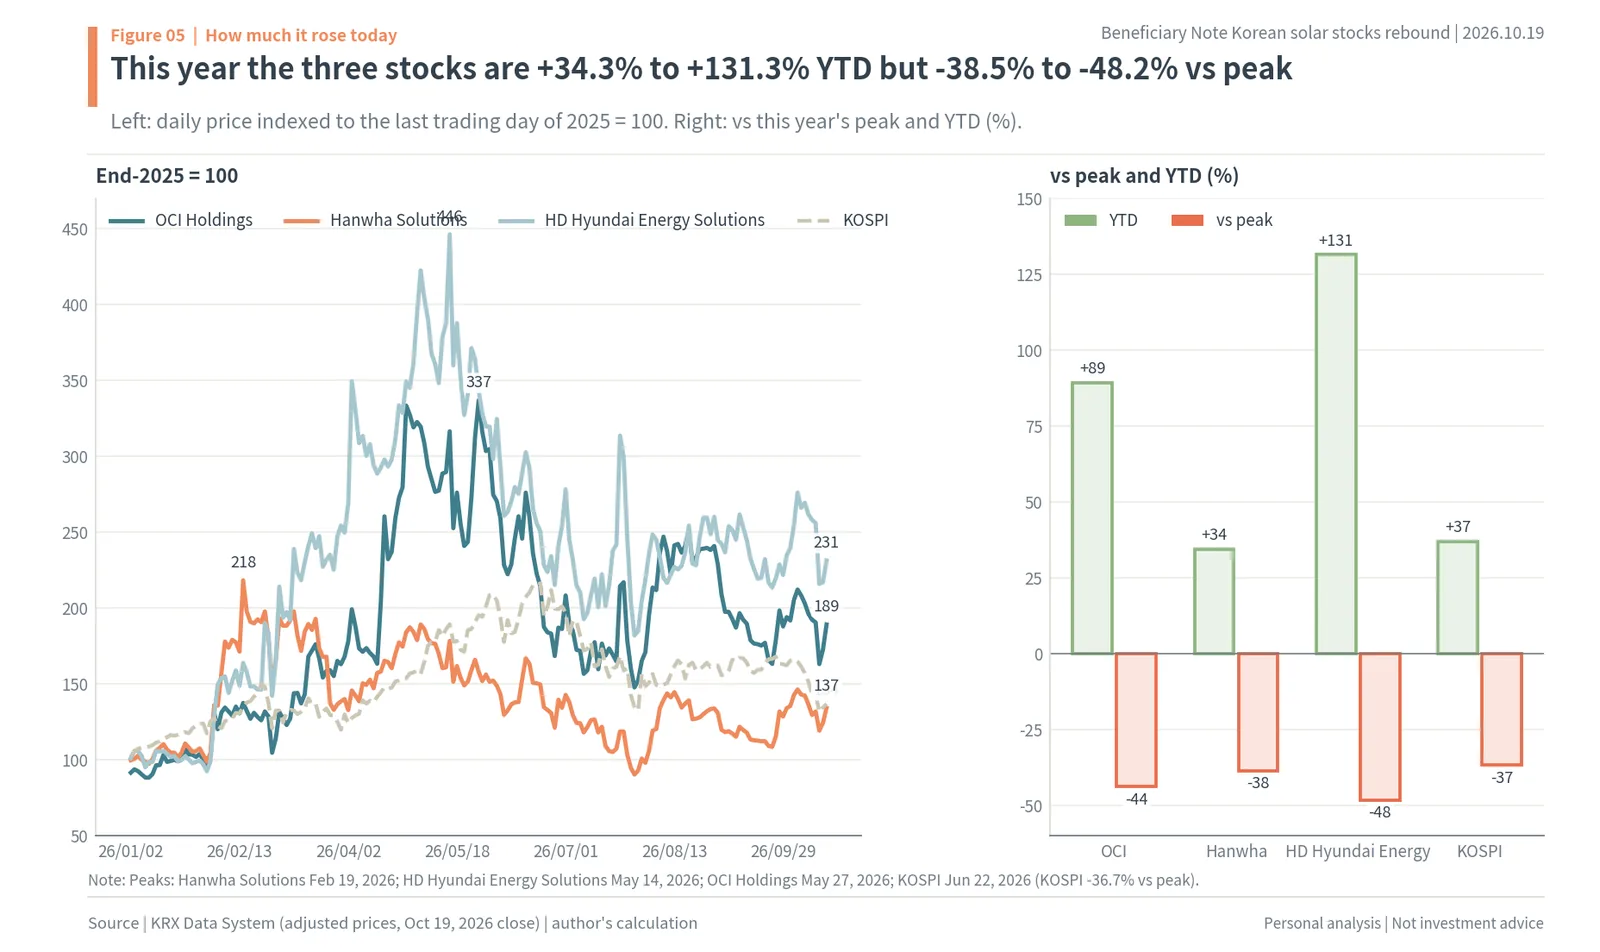
As Figure 5 shows, the three stocks are up 34.3% to 131.3% this year but 38.5% to 48.2% below their peaks. Against the last close of 2025, Hanwha Solutions is up 34.3%, roughly in line with the KOSPI (+36.9%), while OCI Holdings (+89.2%) and HD Hyundai Energy Solutions (+131.3%) are far ahead. But the peaks are behind them: Hanwha Solutions on February 19, HD Hyundai Energy Solutions on May 14 and OCI Holdings on May 27, and today’s prices are 38.5%, 48.2% and 43.8% below them. The KOSPI is also 36.7% below its June 22 peak of 9,114.55. The three stocks came into October 19 after a big rise and a big correction.
2. China moves to shut the export door on next-generation solar technology

From polysilicon to module in five steps
A solar panel is made in five steps. Polysilicon is silicon purified to very high levels, in gray chunks or rods; it is the raw material. An ingot is polysilicon melted and grown into a single long crystal. A wafer is an ingot sliced into sheets a little thicker than paper. A cell is a wafer coated with layers and electrodes that turn light into electricity. A module is dozens of cells wired together under glass in an aluminum frame, the panel you see on roofs and fields.
Thin wafers cut more sheets from the same polysilicon and lower cost; the fluidized-bed (FBR) process grows polysilicon as small granules rather than rods and uses less power. Both are ways to make things cheaper. TOPCon, BC (back contact) and HJT (heterojunction) are today’s main high-efficiency silicon cell processes. A perovskite tandem cell adds a thin layer of a different material, perovskite, on top of a silicon cell to turn light that silicon cannot use into power; it is the next generation.
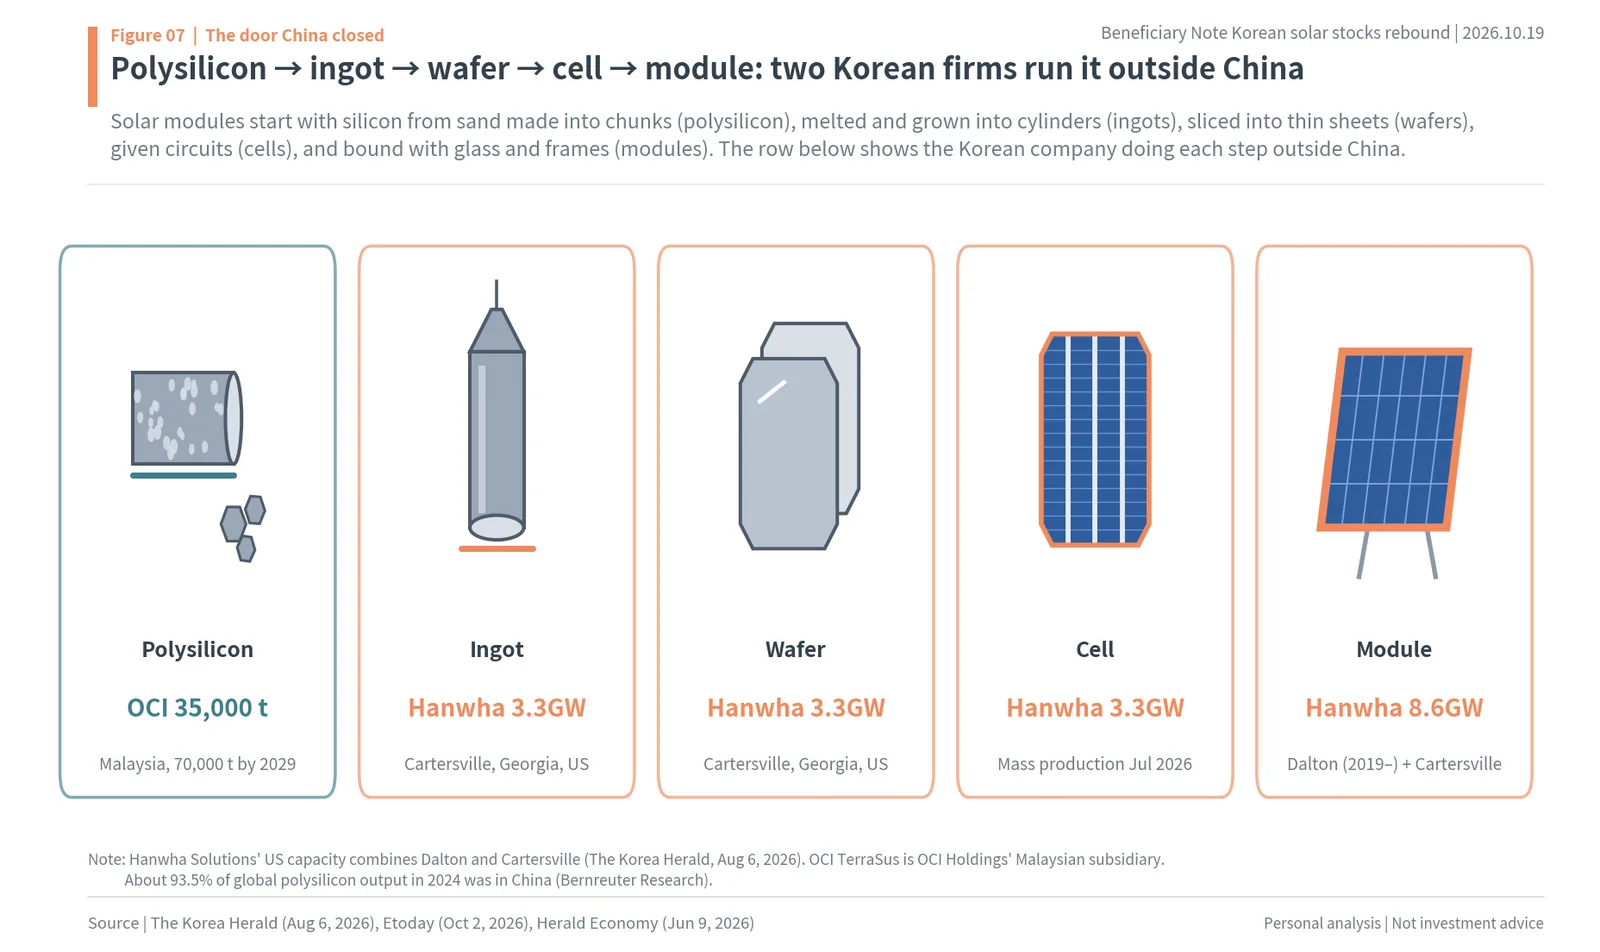
As Figure 7 shows, two Korean companies own this chain outside China. OCI Holdings’ Malaysian unit OCI TerraSus makes 35,000 tonnes a year of non-Chinese polysilicon and plans to double that to 70,000 tonnes by 2029. Hanwha Solutions’ Hanwha Qcells makes 3.3GW each of ingots, wafers and cells and 8.6GW of modules in Georgia. At the other end, about 93.5% of the world’s polysilicon was made in China in 2024 (Bernreuter Research). Most of the world’s solar supply chain stands on Chinese technology and equipment.
Announcement No. 48 of October 16: what China wants to block
On October 16, China’s Ministry of Commerce (MOFCOM) and Ministry of Science and Technology published a draft (Joint Announcement No. 48 of 2026) adding 12 solar technologies to its catalogue of technologies prohibited or restricted from export. It is part of a revision adding 40 technologies (14 prohibited, 26 restricted) across solar, AI and biomedicine. A MOFCOM spokesperson said the measure targets no particular country and that technologies below the thresholds, and equipment not listed, can still be exported freely. pv magazine’s summary, by stage:
Proposed export bans cover next-generation technology: processes and equipment for perovskite-silicon tandem cells on wafers of at least 182mm with efficiency of 30% or more; perovskite slot-die coating at least 1.1m wide; large-area perovskite modules of 1 m² or more; cold-hydrogenation fluidized-bed trichlorosilane lines of at least 250,000 tonnes a year and silane fluidized-bed lines of at least 20,000 tonnes; and wafers no thicker than 70µm, with edge passivation for thin cells.
Proposed restrictions, requiring permission, cover today’s main technology: engineering of polysilicon plants of 30,000 tonnes a year or more, advanced crystal pulling and wafer cutting, and high-efficiency TOPCon, BC and HJT cell processes.
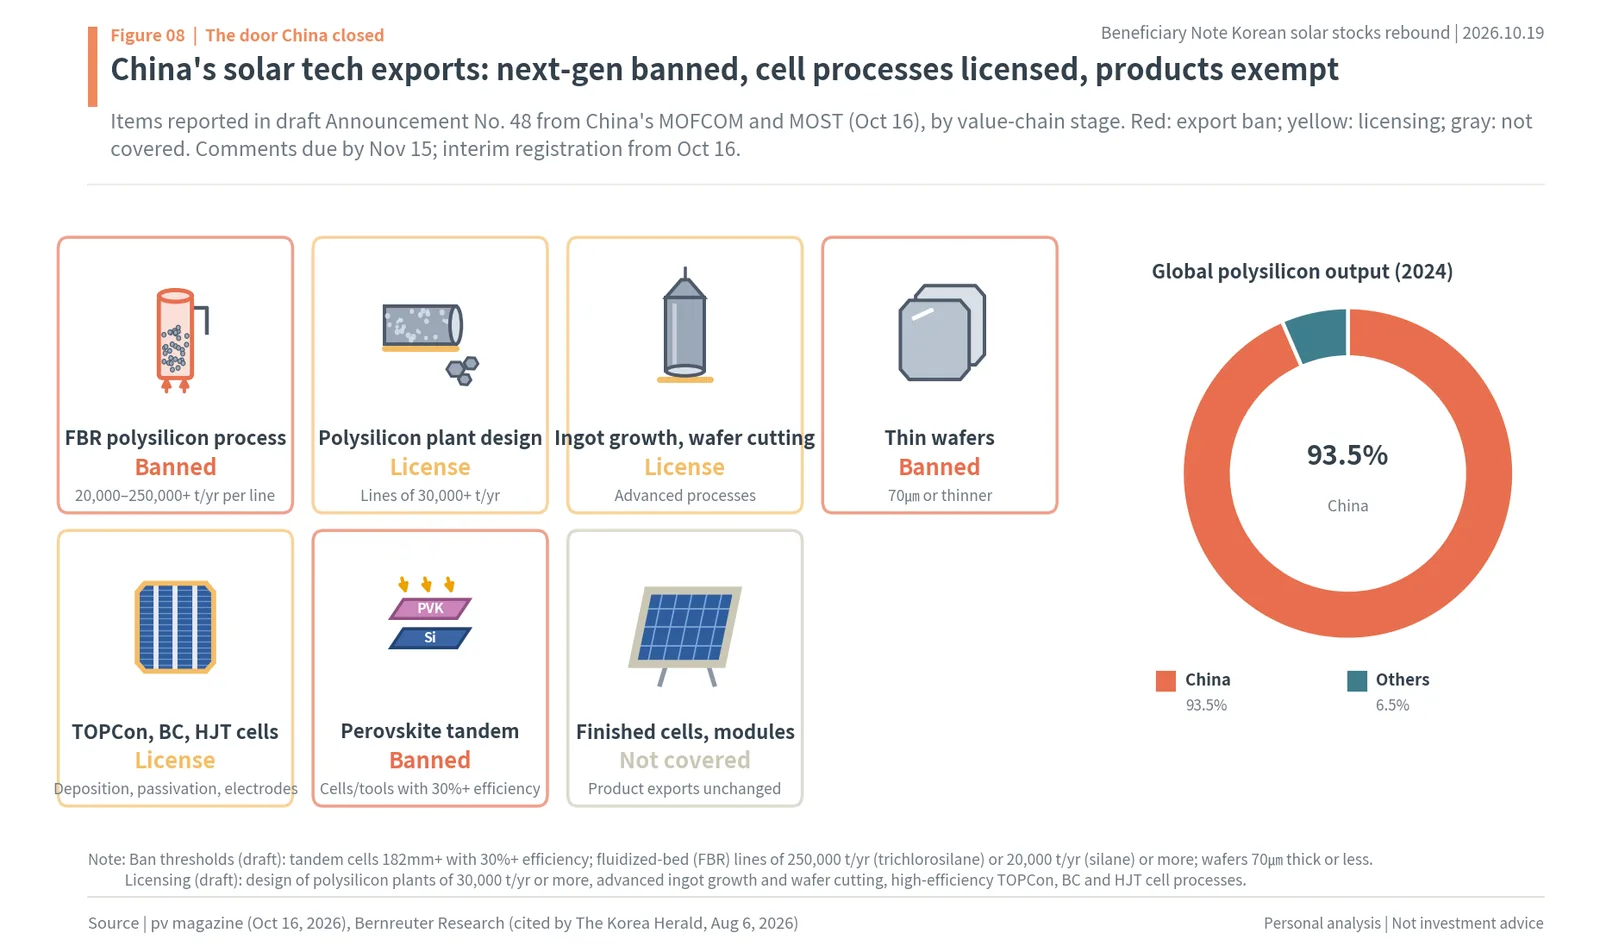
As Figure 8 shows, next-generation technology is banned, cell processes need permission and finished products are not covered. Finished cells and modules are outside the list, so Chinese companies can keep selling panels. What gets blocked is technology licensing, installing and commissioning overseas production lines, equipment exports and on-site technical support. From October 16, even before the list is final, such deals must first be registered in MOFCOM’s online system; public comment runs until November 15.
Why this is worth money to Korean companies
Companies building new solar plants outside China have often bought Chinese equipment and brought in Chinese engineers. pv magazine judged that the measure could delay overseas solar manufacturing projects and raise their cost in the short term. The chain is simple. The road to new plants outside China built on Chinese technology narrows. As new plants are delayed, output from plants already running outside China becomes scarcer. The companies that own those plants get paid.
Korean industry reads it the same way. News1 reported on the afternoon of October 19 that Korean solar makers, which already have their own technology and an early hold on the US market, expect little direct impact, and it named Hanwha Solutions’ Qcells division, OCI Holdings, Germany’s Wacker and America’s Hemlock as non-Chinese companies with their own technology. That morning, Lee Dong-wook of IBK Investment & Securities argued that the US minimum import price and China’s technology controls together raise the value of companies with US production and their own technology: US production gives pricing power, and while latecomers are delayed, Hanwha Solutions gains time to develop next-generation technology such as tandem cells. In his words, if production sites decide access to the market, proprietary technology decides how long the profits from that market last.
The same News1 article also described the nature of the move. The world solar market is already split between a US market that shuts China out and a non-US market China dominates, and China’s controls are a tit-for-tat for US chip controls. An industry source read them as Beijing refusing to hand its technology to global companies that hide their Chinese roots to get into the US. The US blocks Chinese products with prices and tariffs; China blocks the detour of entering the US with Chinese technology. When both countries close the same door from opposite sides, the non-Chinese plants already inside get a bigger share. Hanwha Qcells said it closed all its Chinese plants in the first half of 2024 and uses Jincheon in Korea as a real manufacturing base (pv magazine USA, June 23), so little of its production is blocked by these controls. The order on Friday, October 16, the day of the announcement, was already the same: OCI Holdings +5.80%, Hanwha Solutions +4.31%, HD Hyundai Energy Solutions +0.51% (KOSPI +2.05%). On the following Monday morning, OCI Holdings and Hanwha Solutions turned positive before the KOSPI.
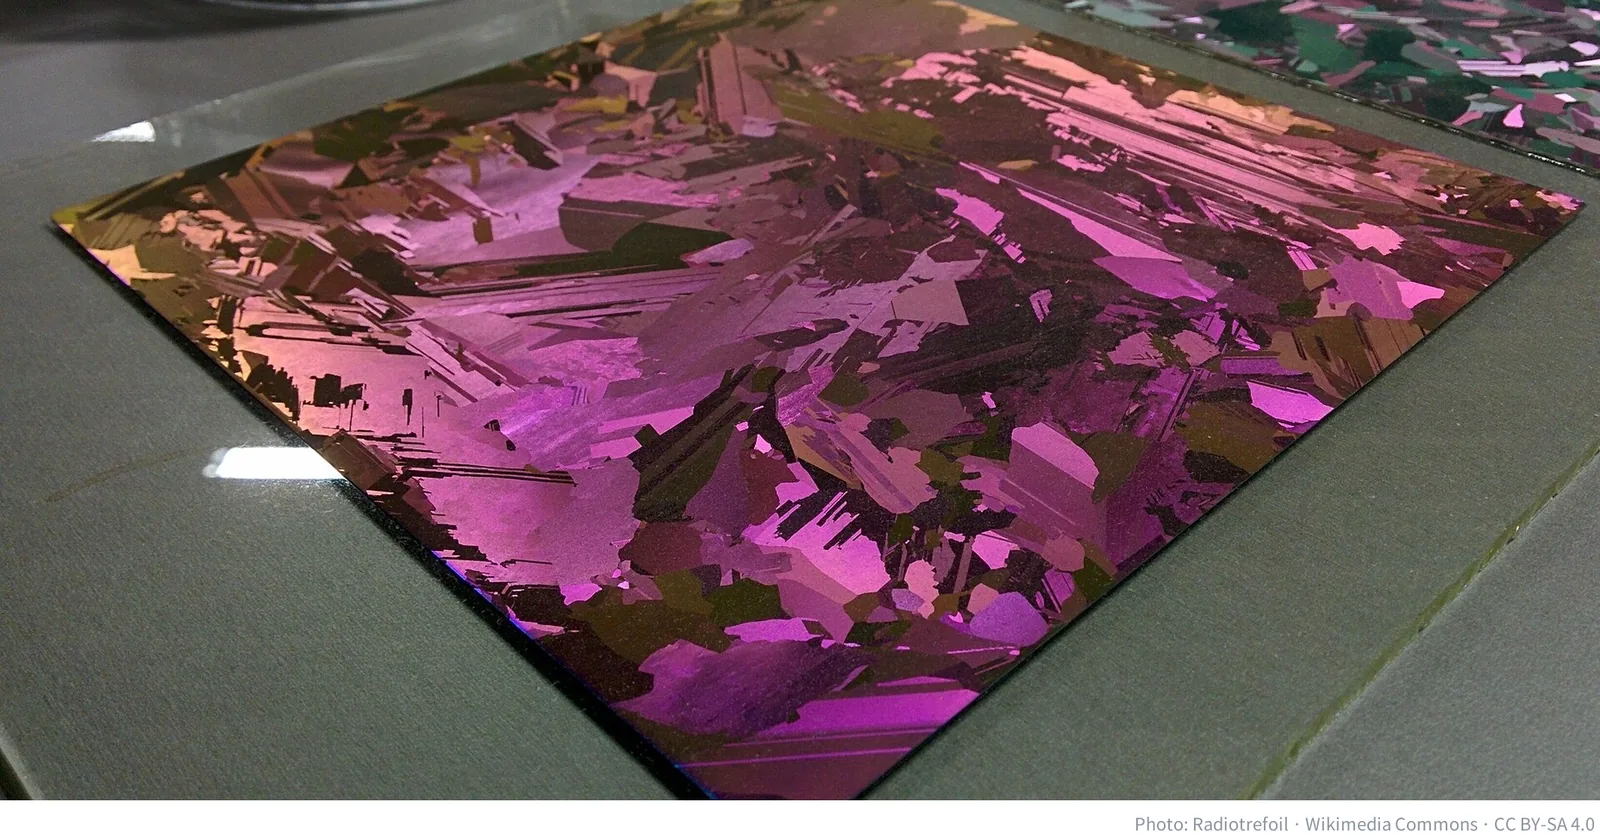
It is worth noting that fluidized-bed polysilicon and thin wafers are on the ban side. Both make polysilicon and wafers cheaper and with less power. If a company that wants to make polysilicon outside China cannot buy this technology from China, the cost of non-Chinese polysilicon will not fall easily. For OCI TerraSus, already making 35,000 tonnes a year outside China, new rivals arrive later and at higher cost.
3. From December 4, the US puts a floor under imported solar prices
A wall raised one layer at a time

As Figure 10 shows, the US has added layers to its wall since August, and China shut its technology door on October 16. The top row is the US. After the July 4 construction-start deadline for tax credits passed, President Trump signed a Section 232 proclamation on polysilicon and its derivatives on August 6. On September 11 the Commerce Department finalized anti-dumping and countervailing duties on cells and modules from India, Indonesia and Laos, and on October 14 the US International Trade Commission (USITC) made its final injury finding. The duty orders are due November 2, and the minimum import price starts December 4.
The middle row is China and US-China relations. On May 15, after the Beijing summit of May 14-15 spread hopes of a thaw, the three stocks fell 18.2% in a day. The Washington summit of September 24 extended the trade truce to January 10, 2027, but solar and batteries were left off the list of goods getting friendlier tariffs. Then came China’s draft export controls on October 16. The bottom row is Korean companies: Hanwha Qcells’ Solar Hub completed in June, OCI Holdings’ sold-out long-term contracts and expansion decision on July 23, and Hanwha Qcells’ KRW 405.78bn capital injection into its US unit on September 30; both companies report third-quarter results on October 29.
The minimum import price: $0.38 per watt for modules, $21 per kilogram for polysilicon

The highest layer of the wall is the Section 232 minimum import price. The proclamation opens by noting that America’s share of world polysilicon capacity fell from 50% in 2005 to under 2% in 2024; the aim is to pull the raw material back to the US and its allies. President Trump signed it on August 6 (US time), and it applies from 12:01 a.m. US Eastern time on December 4. The White House text sets floors of $21 per kg for polysilicon, $100 per kg for ingots and wafers, $0.22 per watt for cells and $0.38 per watt for modules. If the declared price is below the floor, the importer pays the difference as duty. On top comes a 15% ad valorem tariff, capped at 15% including existing duties for Korea, Japan, the EU, Taiwan and others; products from countries such as China and Vietnam that already pay anti-dumping and countervailing duties get the 15% on top of those (Anza). Contracts with fixed terms signed before the proclamation are exempt, stockpiling triggers import restrictions on the company and its affiliates, and there are separate anti-circumvention rules. Companies that start building polysilicon, ingot, wafer or cell plants in the US by January 20, 2029 can import the needed equipment and covered products duty-free. Imports from outside the wall cannot go below the floor, while the door stays open for companies building inside it. A module imported at a declared $0.27 per watt, for example, owes the $0.11 gap to the $0.38 floor as duty. For buyers there is no longer a way to import modules below $0.38; for US-made modules, prices up to about that level become possible.
Market prices moved before the rule. According to Anza, a US solar procurement platform, the median price of imported modules was $0.27 per watt on August 5, just before the proclamation, and after suppliers repriced, the median quote for delivery after December 4 is $0.38, 40.7% higher. Anza added that December 4 is only the effective date, not a deadline developers can wait for. Etoday listed the reasons: suppliers stopped selling cheaply, an anti-stockpiling clause was added, and US installations rose. The Solar Energy Industries Association (SEIA) puts second-quarter US installations at 11.4GW, up 45% on a year earlier, as AI data-center power demand met the tax-credit construction deadline.

As Figure 12 shows, US module quotes rose from $0.27 to $0.38 (+40.7%), and the polysilicon floor of $21 compares with $4-6 for Chinese material. The left panel is US module prices: the median quote is already at the December 4 floor of $0.38. The right panel is polysilicon: Chinese polysilicon trades at $4-6 per kg, so the US floor of $21 is 3.5 to 5.3 times that (author’s calculation). OCI TerraSus said it is negotiating with new customers at $21 or more, right around the floor.
A worked example: one 100MW solar farm
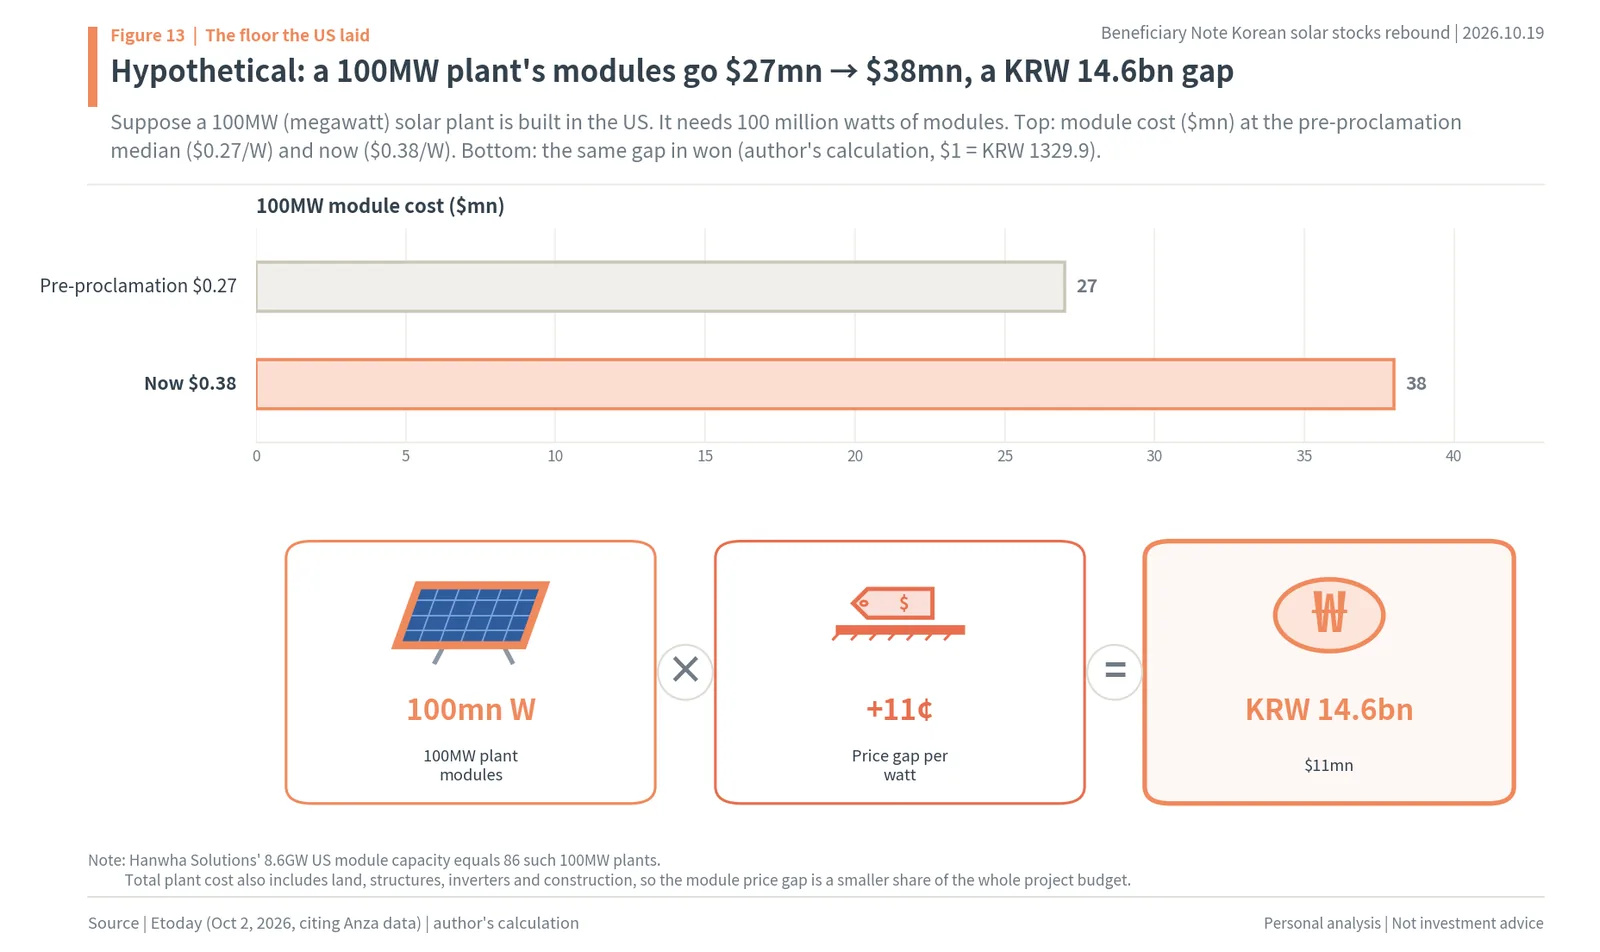
As Figure 13 shows, the module bill for a 100MW farm goes from $27mn to $38mn, a gap of KRW 14.6bn. Suppose someone builds a 100-megawatt solar farm in the US; it needs 100 million watts of modules. At the pre-proclamation median of $0.27 per watt the modules cost $27mn; at today’s median quote of $0.38 they cost $38mn. The 11-cent gap is $11mn per farm, about KRW 14.6bn (author’s calculation at KRW 1,329.9 per dollar).
Developers still have to build. To get tax credits, projects must be running by the end of 2027, and projects that started construction after 2025 lose the credit if parts from foreign entities of concern exceed the limit. So developers must find non-Chinese modules within the deadline even as prices rise. For sellers, a market has opened in which the same module fetches 11 cents more per watt. Hanwha Solutions’ 8.6GW of US module capacity is enough for 86 such farms.
Duty orders and tax-credit deadlines
Other US decisions follow in October and November. On October 14, the USITC found that solar cells and modules from India, Indonesia and Laos materially injured US industry. The anti-dumping rates Commerce set on September 11 are 123.04% for India, 94.36% for Indonesia and 65.43% for Laos, and with countervailing duties the top combined rates are 249%, 268% and 219%. The orders to collect them are due November 2. The lead petitioners include First Solar, Hanwha Qcells USA and Mission Solar, an OCI affiliate. Commerce data show cell imports from the three countries rose from 232 million watts in 2022 to 2 billion watts in 2024; production that moved to escape earlier duties is now being hit again. Tim Brightbill, the petitioners’ lawyer, said Ethiopia has become the third-largest source of US solar imports, up more than 3,000% in the past 12 months, and Commerce opened an Ethiopia circumvention probe on July 17, with a preliminary ruling due around December 10. Each time a gap opens in the wall, it is closed again. For companies already inside, that also means fewer rivals selling cheaply in the same market over time.
The tax-credit timetable also pulls demand forward. Under the US tax law passed in July 2025 (OBBBA), solar projects must have started construction by July 4, 2026, or, if they started later, be in service by December 31, 2027 to get credits. Projects that started after 2025 also lose the credit if parts or support from foreign entities of concern exceed the threshold. When Hanwha Qcells’ US unit sold a $300mn green bond at 5.5% in late September, it kept investors from mainland China, Hong Kong and others out of the primary deal for the same reason, the law’s “prohibited foreign entity” rule (IFR; Chosun Biz, October 19). US developers have to build with non-Chinese parts, and fast, by the end of 2027.
Put the three together and the chain is clear. The floor blocks cheap imports, the duty orders block detours, and the tax-credit deadline pulls demand forward to the end of 2027. That demand goes to US factories and non-Chinese raw material.
4. The two companies with factories outside China get paid first
Hanwha Solutions: 3.3GW of cells and 8.6GW of modules on US soil
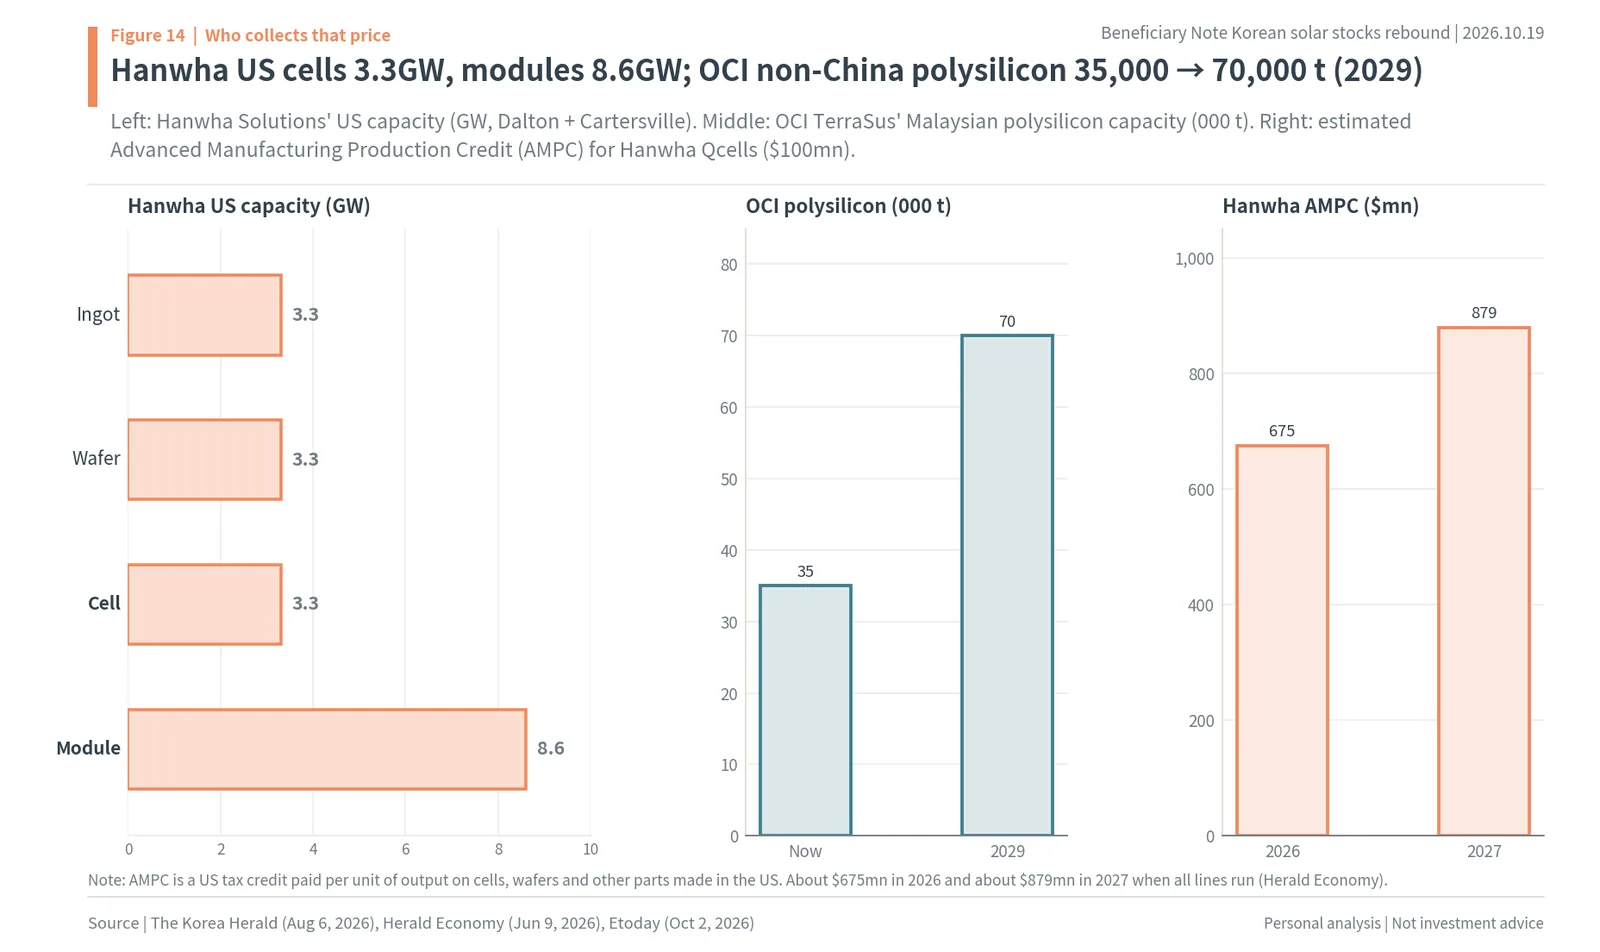
As Figure 14 shows, Hanwha has 3.3GW of US cells and 8.6GW of modules, and OCI’s non-Chinese polysilicon grows from 35,000 to 70,000 tonnes by 2029. More than 80% of Hanwha Solutions’ sales are in the US. The Cartersville ingot, wafer and cell lines added in July 2026 to the Dalton module plant running since 2019 make it the only base in the US doing every step after polysilicon. The 8.6GW of modules is Cartersville’s 3.5GW plus Dalton’s 5.1GW (MTN). On September 30, Hanwha Solutions disclosed a KRW 405.78bn capital injection into its US unit, HANWHA Q CELLS USA, whose assets of KRW 6.564tn are 19.8% of the group’s consolidated assets. US-made cells and wafers earn a production credit, the AMPC. Herald Economy put Hanwha Qcells’ AMPC at about $675mn in 2026 and about $879mn in 2027, when all lines run. At KRW 1,329.9 per dollar, that is about KRW 897.7bn and KRW 1,168.9bn, and the 2027 credit is a sum equal to 91% of 2027 consensus operating profit of KRW 1,285.0bn (author’s calculation). US-made cells earn the floor price on sales and the credit on every unit produced: the same factory gets paid twice.
US-made cells and modules are not imports, so they avoid the minimum import price and import tariffs. When the floor lifts the price of imports, US-made modules in the same market no longer need to sell below it. As Etoday put it, local production gains room to raise prices. Hanwha Qcells still buys polysilicon, and The Korea Herald quoted an industry source saying higher raw-material costs inevitably flow through to panel makers. Selling prices and raw-material costs rise together, and the core of this structure is that the seller of the raw material (OCI) and the seller of the panels (Hanwha) are both outside China.
OCI Holdings: 35,000 tonnes of non-Chinese polysilicon

OCI Holdings’ Malaysian unit OCI TerraSus makes 35,000 tonnes a year of non-Chinese polysilicon. Chinese polysilicon trades at $4-6 per kg, while OCI TerraSus says it is negotiating with new customers at $21 or more. With the US floor at $21, the price of non-Chinese polysilicon in the US market is being set around the floor. In its July 23 second-quarter results, OCI Holdings returned to an operating profit of KRW 108.1bn and said long-term contracts with new US customers had sold out its existing capacity, deciding to add 35,000 tonnes. Chairman Lee Woo-hyun said Malaysian polysilicon and Vietnamese wafers are completely sold out through 2028-2029, and the company plans 70,000 tonnes of polysilicon and 11.5GW of wafers by 2029 (MTN). Analysts’ titles point the same way: Hana Securities titled its July 24 note “2027-29 volumes sold out; entering a major upcycle,” and Kiwoom Securities’ October 15 note, “Time to look up to space,” covered demand from space solar.
The high share of long-term contracts is a matter of timing. Samsung Securities’ Cho Hyun-ryul noted that OCI Holdings’ price increases reach earnings with a lag because of those contracts. Today’s higher prices show up in the next contracts before they show up in today’s profit.
How much a small price move is worth
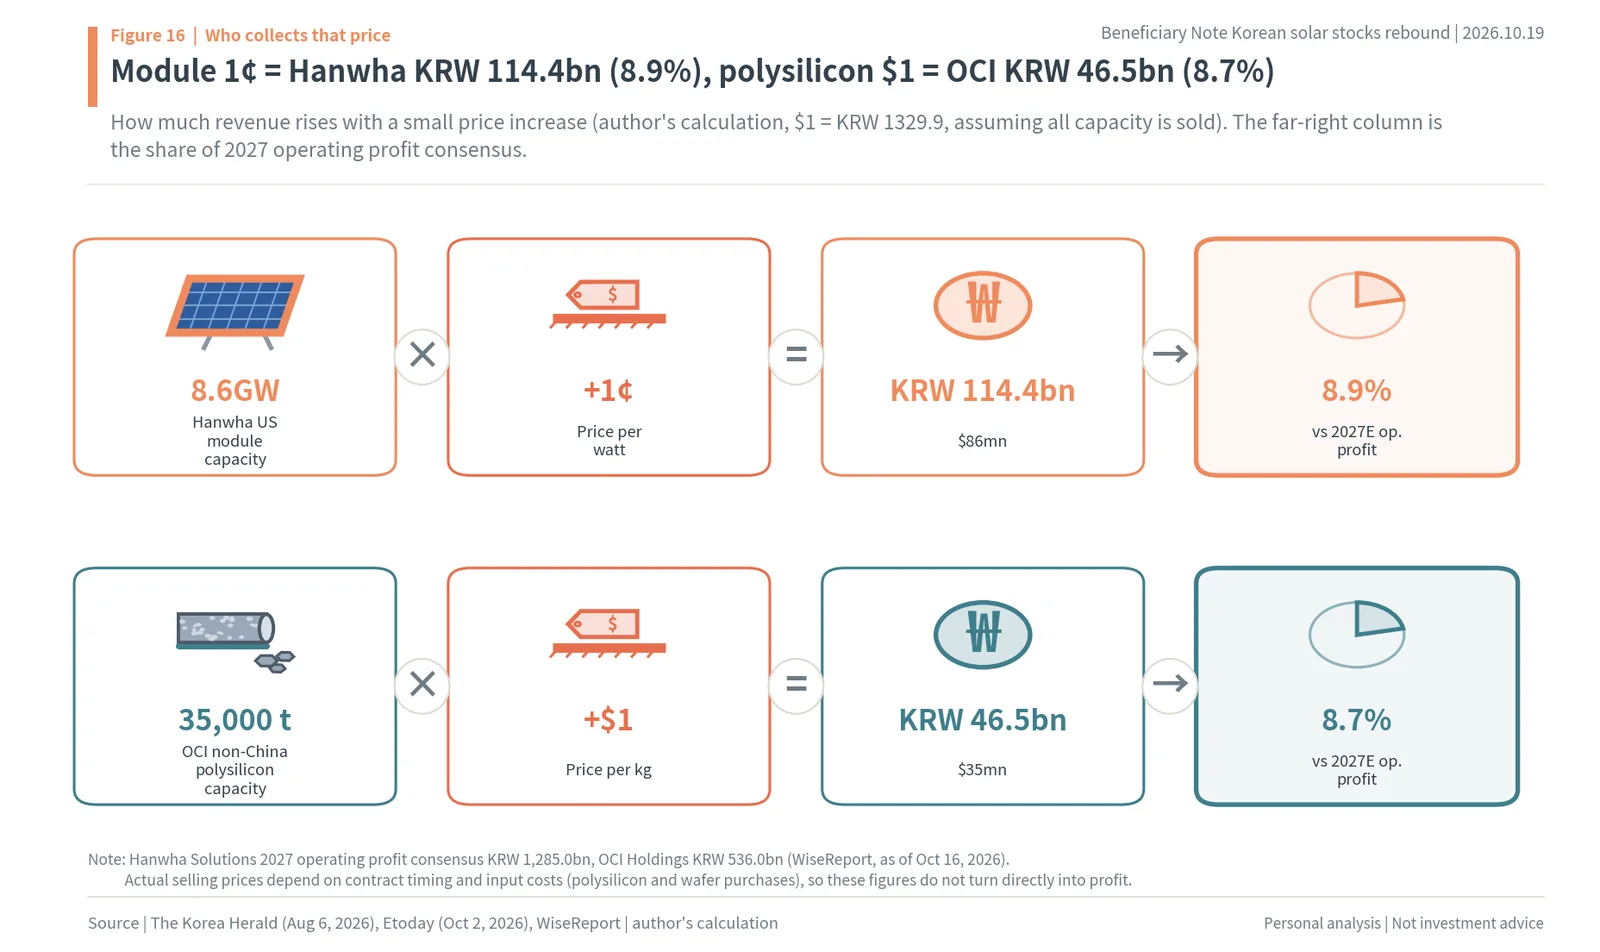
As Figure 16 shows, one cent per watt is worth KRW 114.4bn (8.9%) to Hanwha, and one dollar per kilogram KRW 46.5bn (8.7%) to OCI. Assuming full capacity is sold, the author calculated how much sales rise for a small price increase. Hanwha Solutions’ 8.6GW of US modules is 8.6 billion watts; one cent more per watt is $86mn, about KRW 114.4bn at KRW 1,329.9 per dollar, or 8.9% of 2027 consensus operating profit of KRW 1,285.0bn. OCI Holdings’ 35,000 tonnes is 35 million kg; one dollar more per kg is $35mn, about KRW 46.5bn, or 8.7% of 2027 consensus operating profit of KRW 536.0bn.
The point is size. The median quote for imported modules has already risen 11 cents, from $0.27 before the proclamation to $0.38. For a company where one cent is close to 9% of profit, 11 cents is not small. For polysilicon, the gap between Chinese material at $4-6 and the US floor of $21 is $15-17. This is sales at full capacity, and it shows how sensitive both companies’ profits are to price. Hana Securities made the same kind of estimate on September 28: $0.08 more per watt on Hanwha Qcells’ 8.4GW of US modules adds about KRW 1tn of yearly sales, and $5 more per kg on OCI’s 35,000 tonnes about KRW 250bn (via the Korea Economic Daily). The scale matches the author’s.
Consensus already expects a big 2027
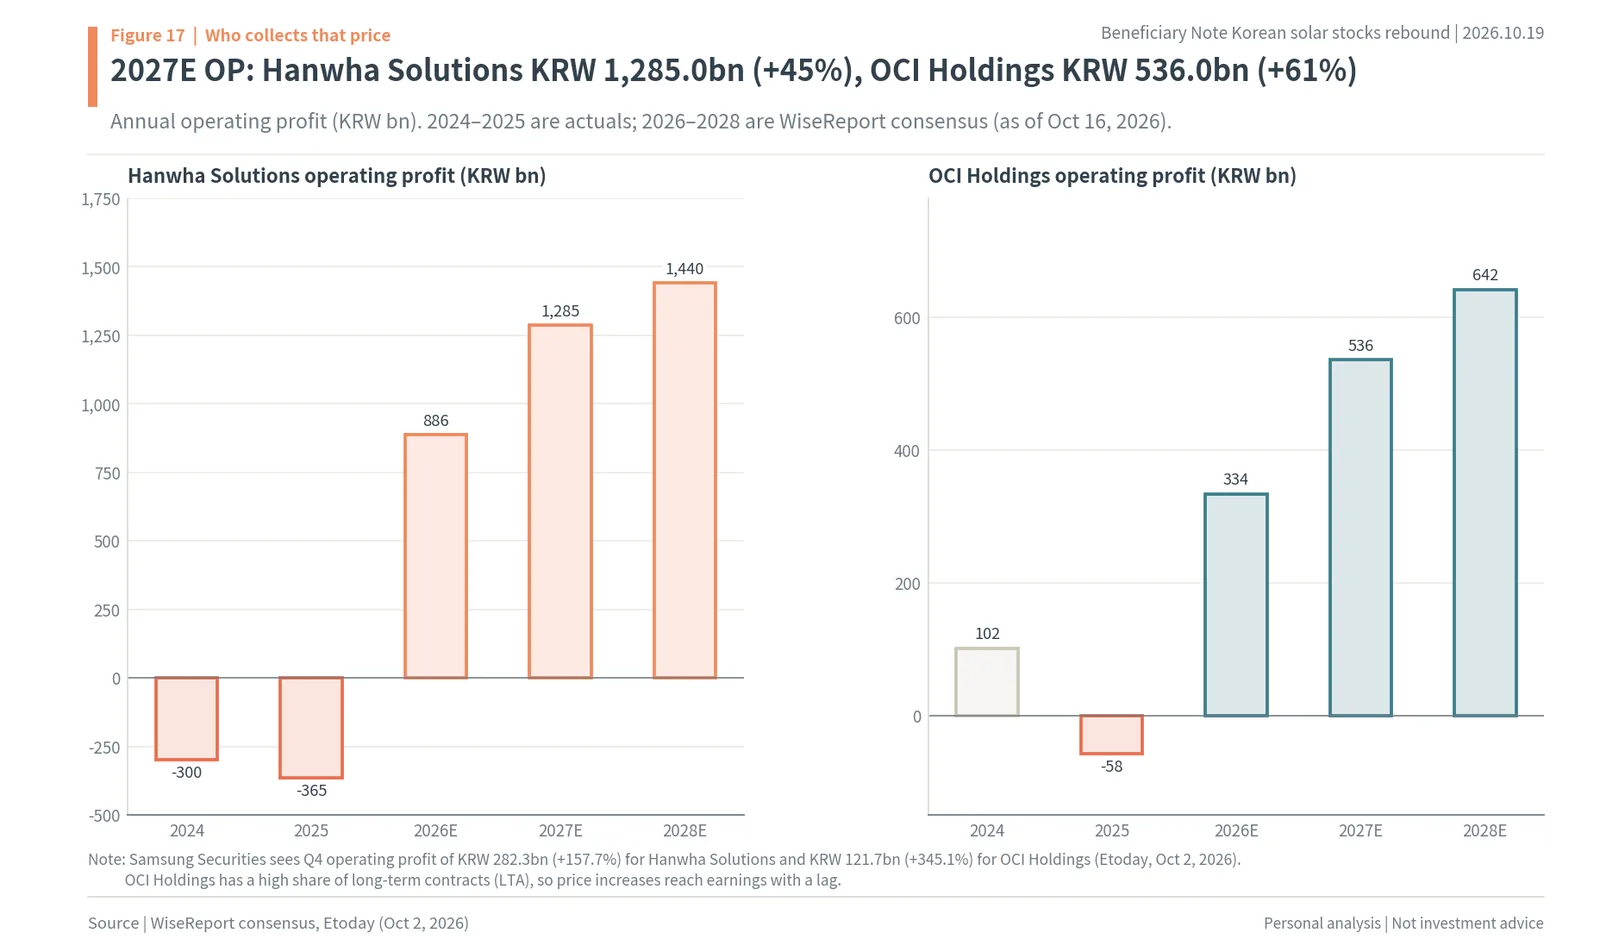
As Figure 17 shows, 2027E operating profit is KRW 1,285.0bn for Hanwha Solutions (+45%) and KRW 536.0bn for OCI Holdings (+61%). Hanwha Solutions lost KRW 300.2bn in 2024 and KRW 364.8bn in 2025 at the operating level; consensus has it turning to KRW 886.5bn in 2026, KRW 1,285.0bn in 2027 and KRW 1,440.3bn in 2028. OCI Holdings goes from -KRW 57.6bn in 2025 to KRW 333.5bn in 2026, KRW 536.0bn in 2027 and KRW 641.6bn in 2028. Samsung Securities expects fourth-quarter operating profit alone of KRW 282.3bn for Hanwha Solutions (+157.7% year on year) and KRW 121.7bn for OCI Holdings (+345.1%). December 4 falls in the middle of that quarter.
By quarter: climbing off the bottom
By quarter, both companies are past the bottom. Hanwha Solutions went from -KRW 489.7bn in the fourth quarter of 2025 to KRW 92.6bn in the first quarter of 2026 and KRW 306.5bn in the second. Third-quarter consensus is KRW 209.0bn, and Samsung Securities sees KRW 282.3bn in the fourth. OCI Holdings went from -KRW 80.3bn and -KRW 53.3bn in the second and third quarters of 2025 to KRW 27.3bn in the fourth, then KRW 10.9bn and KRW 108.1bn in the first two quarters of 2026. Third-quarter consensus is KRW 100.3bn, and Samsung Securities’ fourth-quarter estimate is KRW 121.7bn. The third quarter comes before the floor, and OCI’s long-term contracts bring prices in late, so this story shows up in profits from the fourth quarter and next year.
OCI Holdings has another line of demand. On April 15 its shares jumped 24.93% on a report that OCI TerraSus was negotiating long-term polysilicon supply terms with SpaceX (about KRW 1tn, likely three to five years, not final; Korea Economic Daily). Kiwoom Securities wrote on October 15 that SpaceX plans to start launching orbital computing satellites in 2027 and scale to gigawatts from 2028.
5. The shares price 2027 profits at about half the peak multiple
Dividing the peak and today by the same EPS
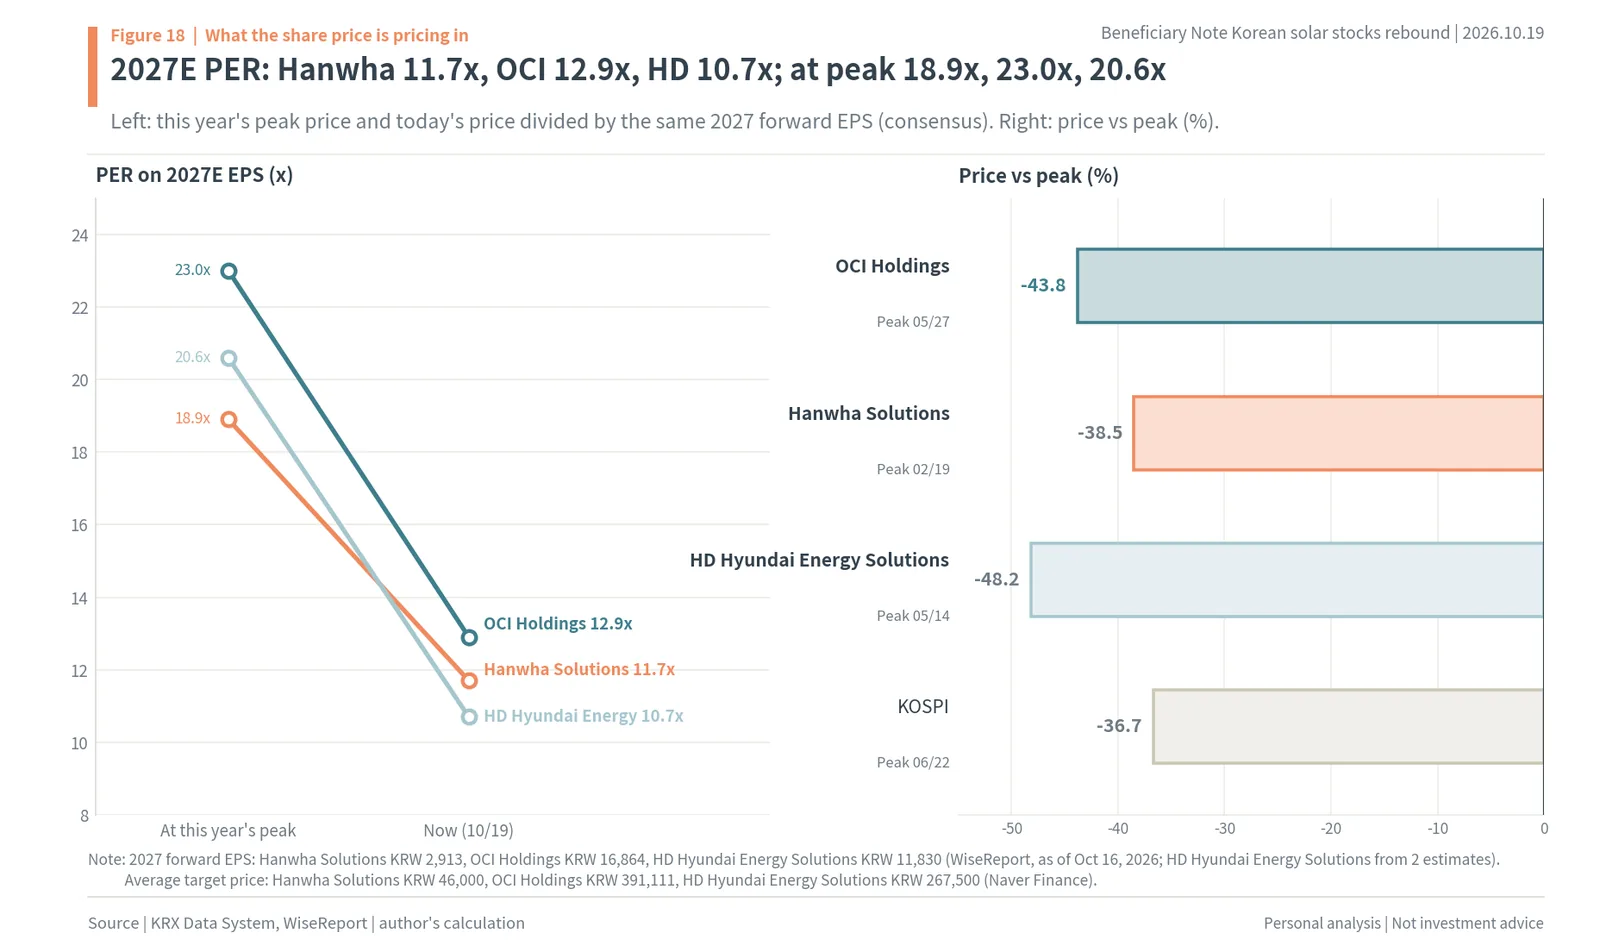
As Figure 18 shows, 2027E P/Es are Hanwha 11.7x, OCI 12.9x and HD 10.7x, against 18.9x, 23.0x and 20.6x at the peak. 2027 forward EPS (WiseReport consensus, October 16) is KRW 2,913 for Hanwha Solutions, KRW 16,864 for OCI Holdings and KRW 11,830 for HD Hyundai Energy Solutions. Today’s close divided by that EPS is 11.7x (on EPS of KRW 2,913), 12.9x (on EPS of KRW 16,864) and 10.7x (on EPS of KRW 11,830). On 2026 EPS they are 16.3x (KRW 2,084), 24.6x (KRW 8,848) and 12.4x (KRW 10,214).
The author also divided this year’s peak prices by today’s 2027 EPS: 18.9x for Hanwha Solutions, 23.0x for OCI Holdings and 20.6x for HD Hyundai Energy Solutions. The forecasts at the peak were different, but on the same yardstick, today’s prices value the 2027 profit outlook at 0.62 (Hanwha), 0.56 (OCI) and 0.52 (HD Hyundai Energy) times the peak multiple. The profit outlook is unchanged, and the multiple has nearly halved; over the same time the KOSPI fell 36.7% from its June 22 peak, so the whole market cut multiples.
If the multiple only returns halfway
The author kept 2027 EPS fixed and changed only the multiple. If it returns halfway between today and this year’s peak, Hanwha Solutions at 15.3x (on EPS of KRW 2,913) is KRW 44,600, 31% above today, and OCI Holdings at 17.9x (on EPS of KRW 16,864) is KRW 301,900, up 38%. At the full peak multiple, Hanwha Solutions would be KRW 55,100 (+62%) and OCI Holdings KRW 387,900 (+78%) (author’s calculation). These are not price targets; they translate into won how much less the shares price in while the profit outlook stays the same. What fills that gap is the December 4 floor and fourth-quarter results.
On book value, 2026 year-end estimated BPS puts the P/B at 0.77x for Hanwha Solutions (BPS KRW 44,309), 1.00x for OCI Holdings (KRW 217,923) and 2.66x for HD Hyundai Energy Solutions (KRW 47,494). Hanwha Solutions, expected to earn over KRW 1tn of operating profit in 2027, trades below book; OCI Holdings trades around book.
The average analyst target (Naver Finance, October 16) is KRW 46,000 for Hanwha Solutions (about $35), KRW 391,111 for OCI Holdings (about $294) and KRW 267,500 for HD Hyundai Energy Solutions (about $201), 35%, 79% and 111% above today’s close. HD Hyundai Energy Solutions is covered by only two analysts, so its figure carries less weight.
HD Hyundai Energy Solutions is cheaper but moves on different news
HD Hyundai Energy Solutions has the lowest multiple of the three (10.7x), regained only 38% of its October 15 drop, and had the smallest solar part on the day (+5.0%p). The reason is where its factory is. It makes 400MW of cells and 1.2GW of modules in Eumseong, Korea, and its US entity in California is a sales office. US sales were KRW 65.8bn in the second quarter, 40% of revenue (Kyobo Securities). Its 2025 annual report lists main suppliers including ZHONGHUAN HONG KONG for wafers, DMEGC for outside cells and NEW EAST SOLAR for ODM modules. Modules made in Korea and sold in the US face the Section 232 tariff (15% cap for Korea including existing duties) and the minimum import price, with no exemption for building US plants. It sits on the side that crosses the wall, not inside it. On August 7, when news of the Section 232 signing lifted Hanwha Solutions (+11.5%) and OCI Holdings (+11.7%), HD Hyundai Energy Solutions alone fell 4.6%, consistent with that difference. Its rise this year came from Korea’s renewable energy policy, oil prices and US demand ahead of tax-credit deadlines. The first in line for this story are the two companies with US cells and non-Chinese polysilicon, so in this report HD Hyundai Energy Solutions is a stock to watch on Korean renewable policy and oil, not the US floor.
Compared with US solar stocks
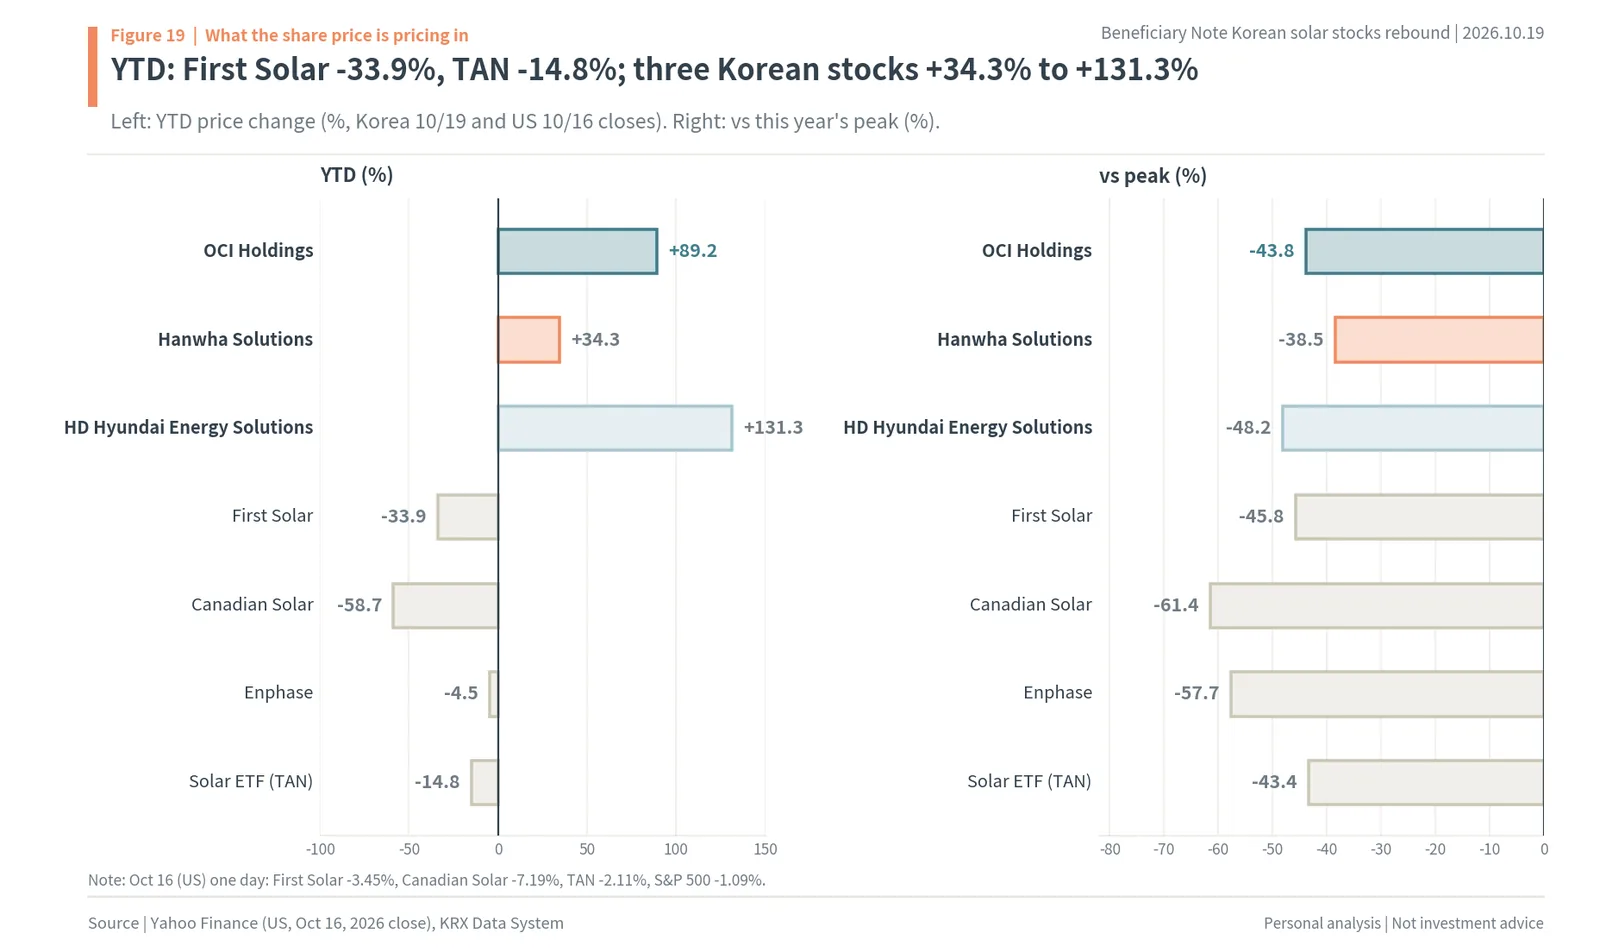
As Figure 19 shows, First Solar is down 33.9% this year and the TAN ETF 14.8%, against +34.3% to +131.3% for the three Korean stocks. Thin-film maker First Solar is 33.9% below its January level, Canadian Solar, with a large production base in China, 58.7%, and the Invesco Solar ETF (TAN) 14.8%. On October 16 (US) First Solar fell 3.45%, Canadian Solar 7.19% and TAN 2.11%, with the S&P 500 down 1.09%. On the day of China’s announcement, the US stock with the biggest Chinese base fell most, and three days later the Korean companies with plants outside China rose most. First Solar makes cadmium telluride (CdTe) thin-film modules rather than silicon ones, which Anza considers outside the Section 232 tariff codes. The direct share of the silicon floor goes to companies making silicon cells in the US, such as Hanwha Qcells.
6. This year, a week after a big up day usually gave some back; a month later the trend resumed
28 big up days
October 19 is not the first such day this year. The author picked every day from January 2 to October 16, 2026 when the equal-weighted basket of the three stocks beat the KOSPI by more than 6%p. There were 28, and on those days the basket beat the KOSPI by 11.0%p on average. On the 19 days it lagged by more than 6%p, the average was -8.9%p. These stocks often move 10% in a day, and October 19’s +6.3%p (basket +8.06%, KOSPI +1.76%) only just clears this year’s bar. The biggest down days, such as the US-China thaw (May 15) and the oil slump (July 27), were days when the story that had lifted them reversed. These stocks rise hard when a story arrives and fall hard when the same story turns, so knowing the dates the stories depend on is the trading calendar. This chapter supplies the numbers for it.

As Figure 20 shows, the median excess return after this year’s 28 big up days was -3.3%p after five trading days and +5.3%p after 20. The next day was a coin toss (median +0.1%p, 50% positive). After five trading days the median was -3.3%p, with only 43% positive. After 20 trading days the median was +5.3%p and 59% were positive. The averages were +0.6%p, -0.6%p and +2.7%p.
The right panel plots each day’s five-day result (across) against its 20-day result (up). Early-year big days such as February 4 (basket +29.3%) and March 6 (+20.7%) were still more than 20%p ahead a month later. A big day near the peak, May 14 (+11.7%), was followed by -18.5%p after a week and -30.6%p after a month. The same kind of jump played out differently depending on whether profit expectations were just starting to build or already at the top.
Split by period, the difference is sharper. The 13 big days from January to April had a median 20-day excess return of +18.4%p, with 10 positive; the 14 from May to September had a median of -7.9%p, with only 6 positive. January to April is when the stocks climbed from the year’s lows to their peaks, and May to September is when they came down from the peaks (May 14 and 27). Where the jump happened decided the next month.
October 19 (+6.3%p over the KOSPI) is the 29th big up day this year. The closest match in drivers is September 28: US prices and US-China relations together, with the three stocks up 9.8% on a day the KOSPI fell 2.7%. The five-day excess return after it was +12.0%p.
Which does today look like? As the previous chapter showed, the stocks are 38.5% to 48.2% below their peaks, and the 2027 outlook is unchanged while the multiple is about half the peak. That is closer to the early-year days: a jump from a low multiple as profit expectations build again. And whatever the setting, the week right after a big day often gave some back.
Big days with reported causes
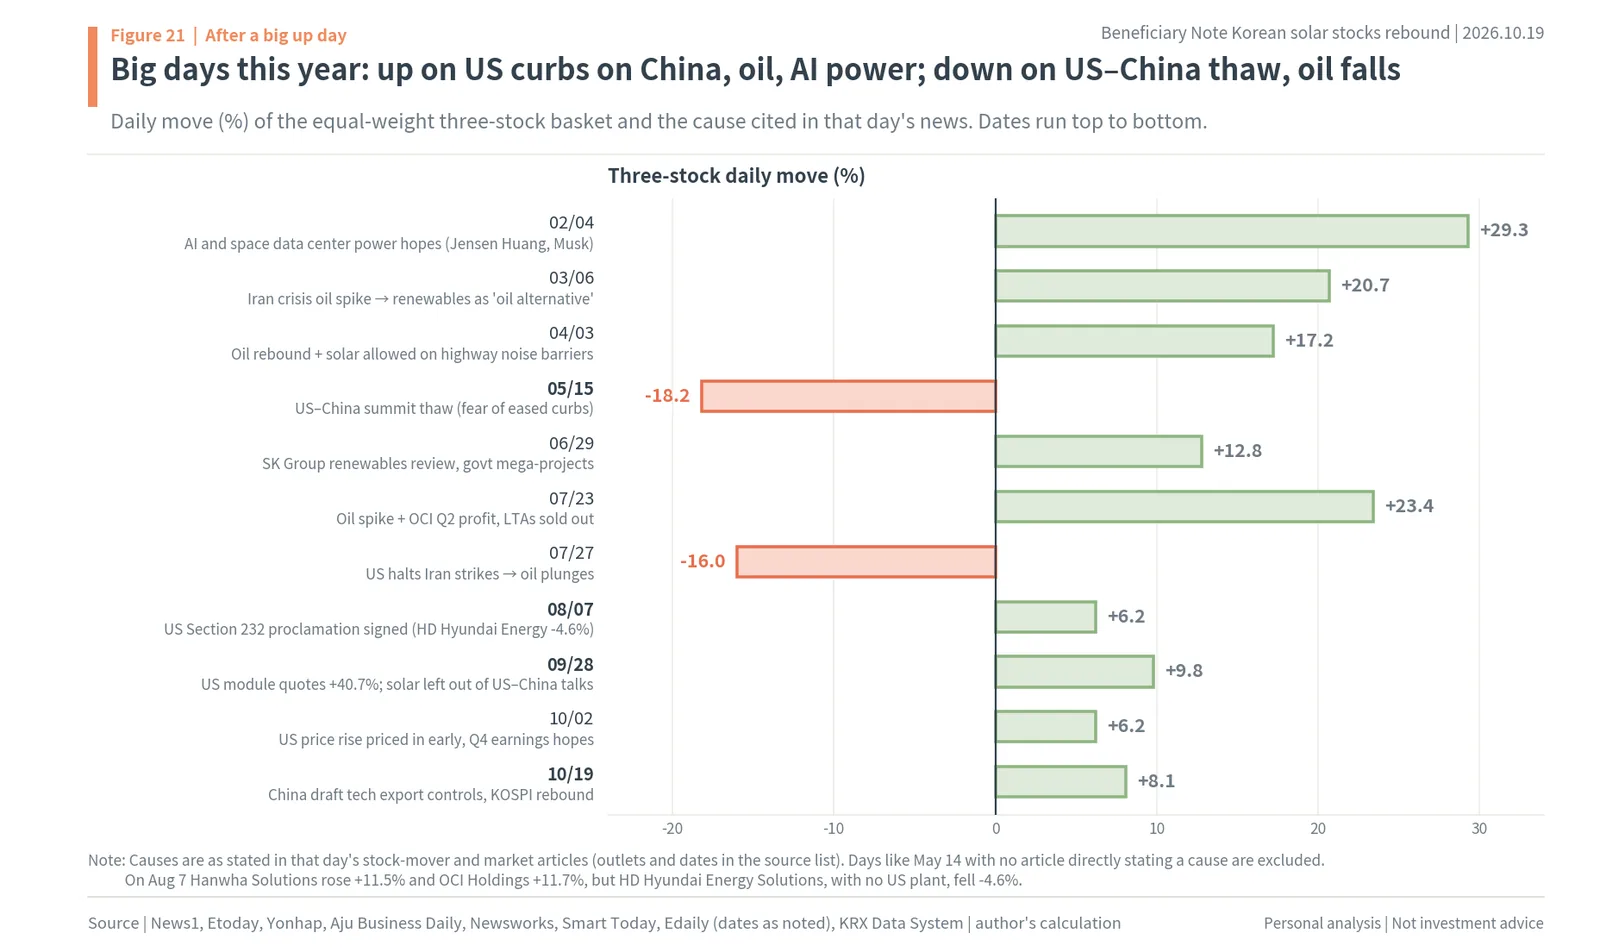
As Figure 21 shows, this year’s big days rose on US curbs on China, oil and AI power, and fell on a US-China thaw and falling oil. On February 4 (basket +29.3%), remarks by Nvidia’s Jensen Huang and Elon Musk spread hopes for power demand from AI and space data centers. On March 6 (+20.7%) and April 3 (+17.2%), the Iran conflict sent oil higher and renewables were bought as an alternative to oil; April 3 also brought deregulation allowing solar panels on highway noise barriers. June 29 (+12.8%) had a report that SK Group was considering renewable investment and the government’s mega-project announcement, and July 23 (+23.4%) combined an oil spike with OCI Holdings’ sold-out long-term contracts.
The day US policy moved the stocks directly was August 7 (+6.2%): on news of the Section 232 signing the day before, Hanwha Solutions rose 11.5% and OCI Holdings 11.7%, while HD Hyundai Energy Solutions, with no US plant, fell 4.6%. September 28 (+9.8%) combined the report that US import module quotes had risen 40.7% with solar being left off the friendly-tariff list at the September 24 US-China summit. October 2 (+6.2%) brought price pass-through and fourth-quarter hopes, and October 19 (+8.1%) China’s draft export controls plus the KOSPI rebound.
The big down days were the same stories in reverse. May 15 (-18.2%) was the worry, after the Beijing US-China summit, that US curbs on China might ease; July 27 (-16.0%) was oil falling as the US paused its strikes on Iran. Four forces move these stocks: US curbs on China, US-China relations, oil, and AI power demand. The dates ahead sit on the same four.
7. The author’s view: not a one-day story but a price cycle that runs to December 4
The view
The author sees this rebound not as a one-day story but as the restart of a price cycle that runs to the December 4 floor, and sees the pullbacks in the week after a big up day as a place to buy in stages.
Three links lead there. First, most of the day’s gain came from solar, not the market: a market part of +1.2%p and a solar part of +6.8%p, with OCI Holdings and Hanwha Solutions turning positive before the KOSPI. Second, what drove that part is not one-day news but rules with dates: China’s controls take comments until November 15 with interim registration already in force, the US minimum import price starts December 4, the duty orders come November 2, and the tax-credit in-service deadline is the end of 2027. Third, the price those rules raise matters a lot for both companies’ profits: one cent per watt is 8.9% of Hanwha Solutions’ 2027 consensus operating profit and one dollar per kg of polysilicon 8.7% of OCI Holdings’. Yet the shares price 2027 profits at only 0.62 and 0.56 times the peak multiple.
First in line for the floor is OCI Holdings, then Hanwha Solutions. For OCI Holdings, one dollar of polysilicon is 8.7% of profit, 2027 operating profit growth (+61%) is higher, and the multiple is lower at 0.56 times the peak; if China blocks fluidized-bed polysilicon technology, new non-Chinese rivals arrive late. Hanwha Solutions takes the floor directly with 3.3GW of US cells and 8.6GW of modules, and its AMPC grows to about $879mn in 2027. HD Hyundai Energy Solutions has the lowest multiple, but its link to this US-China story is not as direct.
The author’s calendar runs like this. October 20 to 26 are the five trading days after a big day, when this year’s pattern says pullbacks are common; use that window to buy in stages. October 29’s results are less about third-quarter numbers than about fourth-quarter prices and the terms of new long-term contracts. November 2’s duty orders and the final Chinese list after November 15 show whether the walls go up as planned, and November 17-19 in Shenzhen is the biggest date. After that, the remaining driver until December 4 is the floor itself.
Set entries by the timetable. After this year’s 28 big up days, the median five-day excess return was -3.3%p and the 20-day +5.3%p. Rather than chasing a day like October 19, buying in stages on the next week’s pullbacks fits this year’s numbers.
Eight signals the author watches
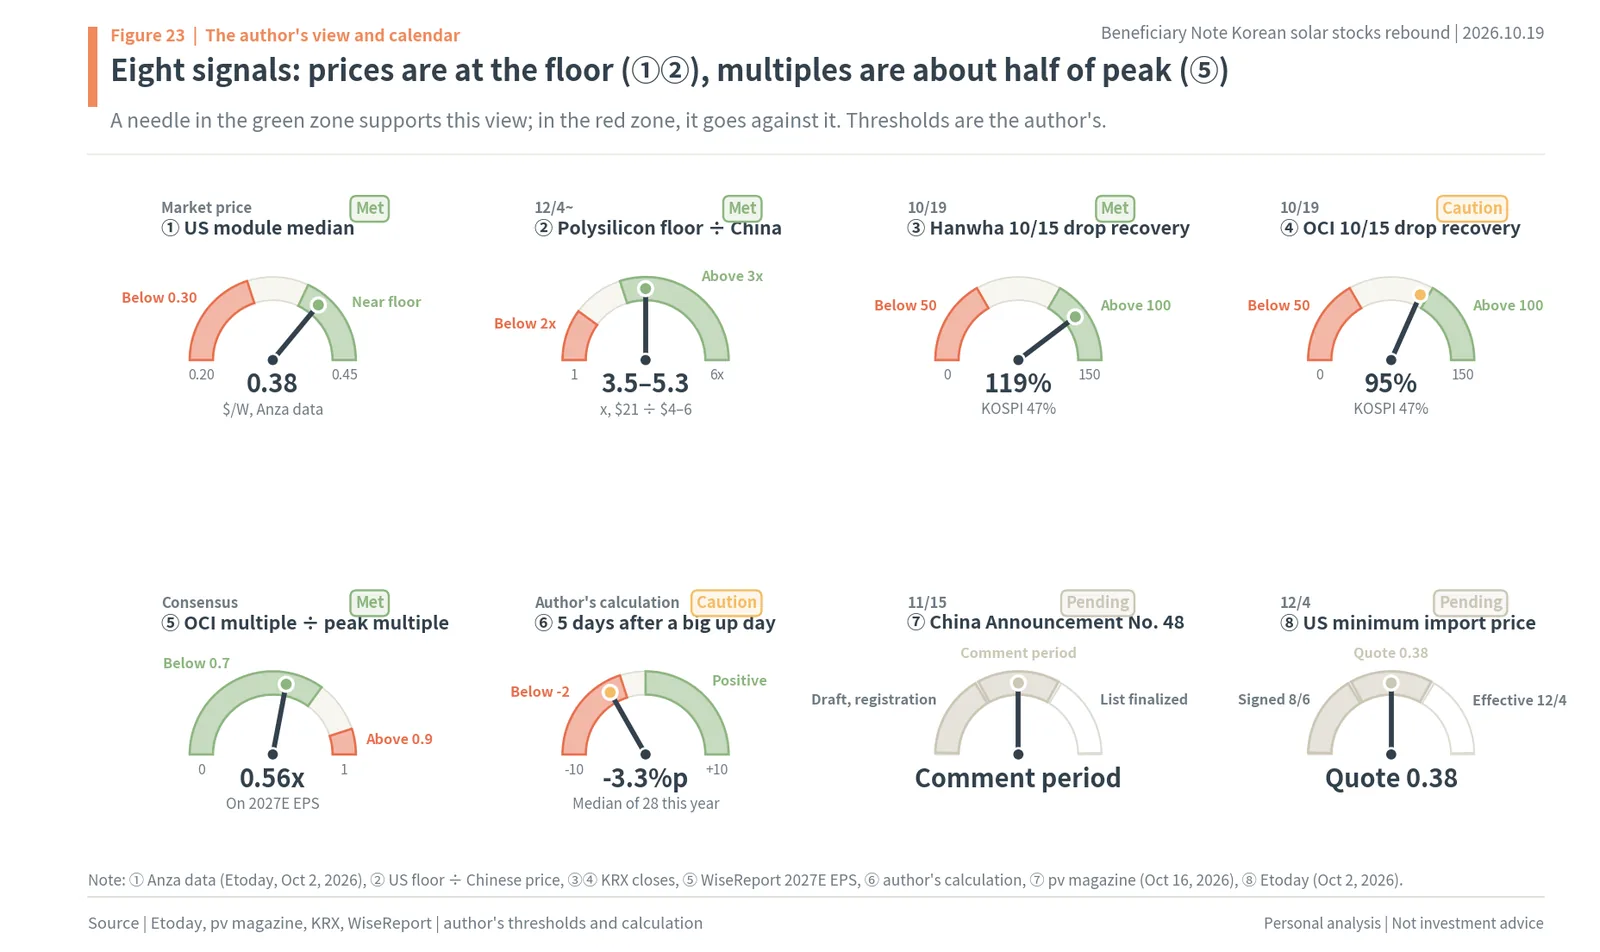
As Figure 23 shows, prices have reached the floor (①②) and the multiple is about half the peak (⑤). A needle in the green zone supports this view; in the red zone it argues against it. ① The median quote for imported US modules is $0.38 per watt, the same as the December 4 floor. ② The $21 polysilicon floor is 3.5 to 5.3 times the Chinese price. ③④ Recovery from the October 15 drop is 119% for Hanwha Solutions and 95% for OCI Holdings, faster than the KOSPI (47%). ⑤ OCI Holdings’ multiple on 2027 EPS is 0.56 times the peak. ⑥ The median five-day excess return of -3.3%p after big days says not to rush. ⑦ China’s Announcement No. 48 is at the draft and interim-registration stage, and the list becomes final after comments close on November 15. ⑧ After the August 6 signing, US import module quotes reached the floor first; only the December 4 start remains.
The numbers to check most often are ① and ⑥: whether US module prices hold near the floor, and whether the week after today’s jump gives some back as this year’s pattern suggests. ⑦ and ⑧ move a step at a time on fixed dates.
Numbers that will test the view
Four numbers will test this view. First, how much OCI Holdings says on October 29 about the prices and start dates of its new long-term contracts; when contracts near $21 start to hit sales underpins its 2027 operating profit of KRW 536.0bn. Second, whether Hanwha Solutions’ US module prices hold near the floor; one cent is 8.9% of its 2027 operating profit. Third, whether China’s list is finalized as drafted after November 15; if fluidized-bed polysilicon and thin wafers stay on the ban list, new plants outside China are delayed. Fourth, whether the US and China touch solar in Shenzhen on November 17-19; if it is left out as in September, the cycle to December 4 holds.
Dates to watch
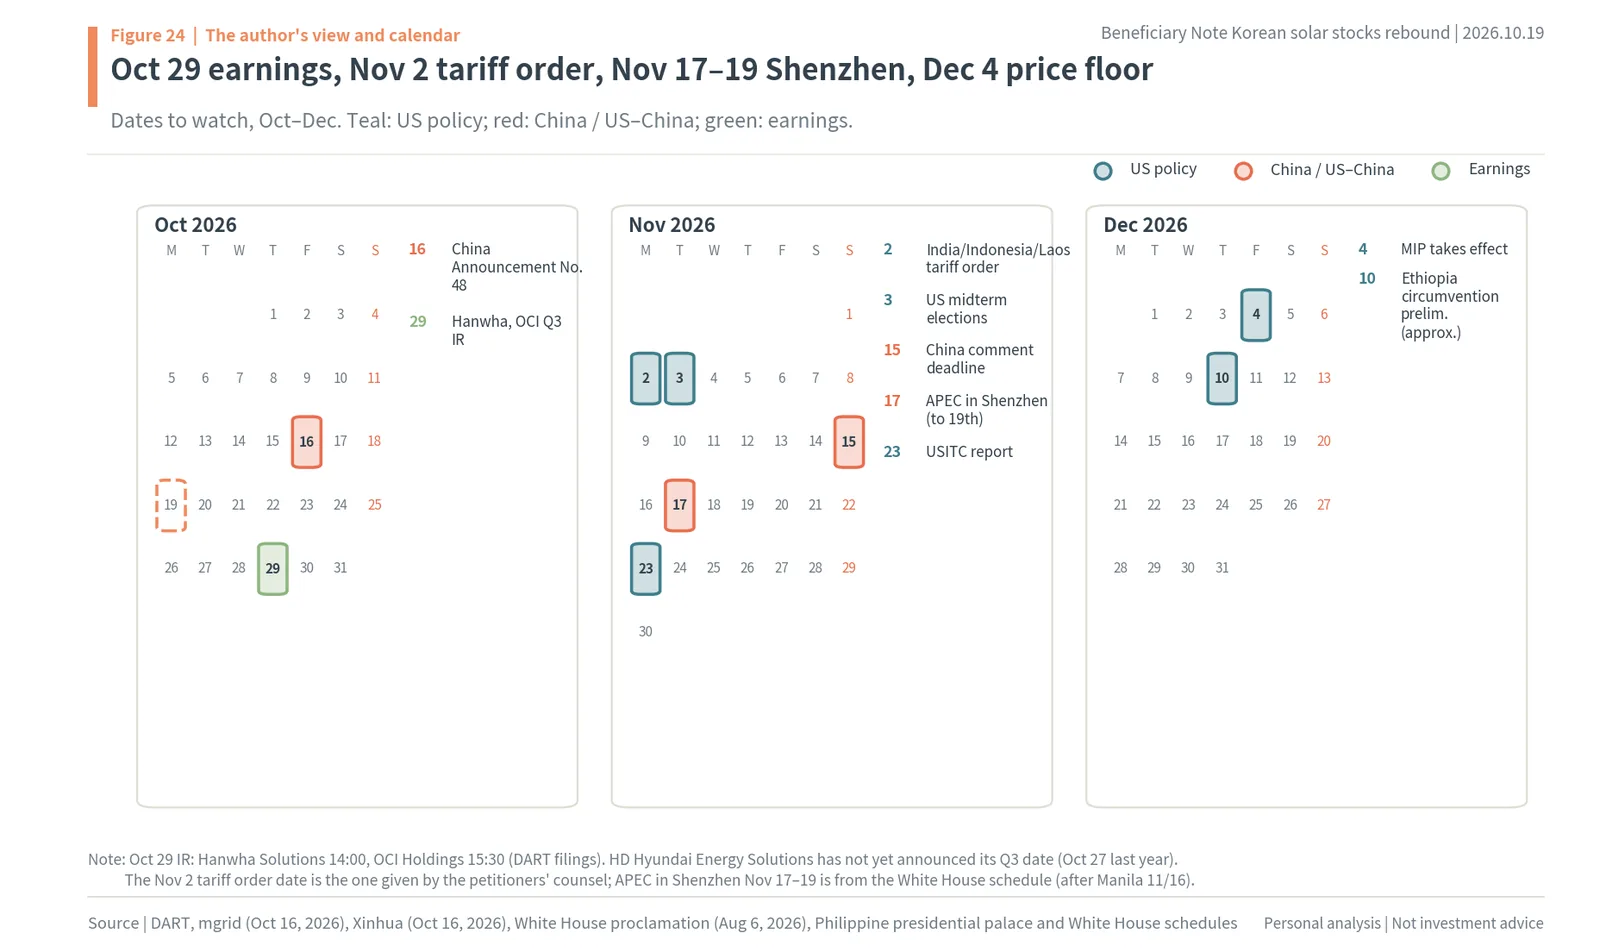
As Figure 24 shows, the dates come in order: results on October 29, duty orders on November 2, Shenzhen on November 17-19 and the floor on December 4. On October 29, Hanwha Solutions (2 p.m.) and OCI Holdings (3:30 p.m.) report third-quarter results. WiseReport’s third-quarter operating profit consensus is KRW 209.0bn for Hanwha Solutions, KRW 100.3bn for OCI Holdings and KRW 34.8bn for HD Hyundai Energy Solutions. The third quarter comes before the floor, so prices reach profits in size from the fourth quarter; Samsung Securities expects fourth-quarter operating profit of KRW 282.3bn for Hanwha Solutions and KRW 121.7bn for OCI Holdings.
November is crowded with US and Chinese dates: duty orders on cells and modules from India, Indonesia and Laos on November 2, the US midterm elections on November 3, the end of comments on China’s technology list on November 15, the APEC summit in Shenzhen on November 17-19 and the USITC report on November 23, followed by the minimum import price and 15% tariff on December 4. A preliminary ruling in the Ethiopia circumvention probe comes around December 10.
The biggest date is Shenzhen. After the Beijing summit in May, hopes of a thaw cut the three stocks 18.2% in a day; after solar was left out at the Washington summit in September, the next big day (September 28) was +9.8%. In September the US agreed friendlier tariffs only on about $30bn of non-sensitive goods, and solar and batteries were not on the list (Korea Economic Daily). That list is what to watch in Shenzhen. The US-China trade truce ends January 10, 2027. If solar is left out again in Shenzhen, the floor cycle runs on to December 4.

The American plant built four months after a tariff eight years ago now stands inside a wall raised from both sides, by China and by the US. Whether the story of the factory inside the wall getting paid holds again will show first in Shenzhen on November 17-19 and then at the December 4 floor.
Maochaedung’s summary. Of the three Korean solar stocks’ 8.06% gain on October 19, the KOSPI rebound accounted for 1.2%p, and the remaining 6.8%p came from supply rules that piled up within a week. On October 16 China drafted a ban on exporting next-generation solar technology, and from December 4 the US puts a floor of $0.38 per watt under modules and $21 per kg under polysilicon. Companies that already have factories outside China get that price. Hanwha Solutions earns both the price and production credits on US-made cells, and OCI Holdings signs new contracts near $21 for non-Chinese polysilicon. 2027 consensus operating profit is up 45% and 61%, yet the shares price that at 0.62 and 0.56 times the peak multiple. The author sees the pullbacks in the week after a big day as a place to buy OCI Holdings and Hanwha Solutions in stages, and November 17-19 in Shenzhen as the biggest date. The higher the wall, the more the factory inside it gets paid.
8. How the numbers were counted
The numbers in this report come from two places only: figures taken from articles, reports and filings carry a source, and figures the author calculated are marked as such.
Prices are KRX adjusted regular-session closes. The Naver Finance app shows prices that include Nextrade evening trading, so on the evening of October 19 it showed KRW 216,000 for OCI Holdings and KRW 33,700 for Hanwha Solutions; this report uses the regular-session closes (KRW 218,000 and KRW 33,950). Intraday paths use Naver Finance one-minute prices thinned to five minutes, with minutes without trades (such as the closing auction) filled by the previous price.
The split of the day’s move uses KOSPI betas from daily returns over the last 60 trading days (July 20 to October 16, 2026). Beta = covariance of the stock’s and the KOSPI’s returns ÷ variance of the KOSPI’s returns. Market part = beta × the KOSPI’s 1.76% gain; solar part = the stock’s gain − market part. Betas change with the window, so a different period gives somewhat different parts.
Recovery from October 15 = (October 19 close − October 15 close) ÷ (October 14 close − October 15 close). A value above 1 means the stock regained more than it lost, closing above October 14.
The big-day study covers January 2 to October 16, 2026 and picks the 28 days when the equal-weighted basket of Hanwha Solutions, OCI Holdings and HD Hyundai Energy Solutions beat the KOSPI by more than 6%p. Excess return is the basket’s cumulative return minus the KOSPI’s over 1, 5 and 20 trading days from that day’s close. September 28 lacks 20 trading days and is left out of the 20-day figures (27 days). Nearby days (such as February 4-6) overlap. The period split uses January-April (13 days) and May-September (14 days).
Valuations divide by WiseReport annual consensus EPS (October 16). Forward P/E = October 19 close ÷ that year’s EPS. The “peak multiple” divides this year’s highest close by today’s 2027 EPS; it is the author’s same-yardstick comparison, not the consensus multiple at the time. HD Hyundai Energy Solutions’ consensus has two estimates. Multiple scenarios keep 2027 EPS fixed: the midpoint multiple = (today’s 2027E P/E + peak multiple) ÷ 2, rounded to one decimal, and price = 2027E EPS × that multiple, rounded to KRW 100. They are not targets.
Investor flows are KRX net purchases by value, rounded to KRW 0.1bn; institutions include financial investment, insurance, investment trusts, private funds, banks, other financials and pension funds, and foreigners include other foreigners.
Price sensitivity is the change in sales at full capacity: Hanwha Solutions = 8.6GW of US modules × $0.01 per watt = $86mn; OCI Holdings = 35,000 tonnes of polysilicon × $1 per kg = $35mn, converted at KRW 1,329.9 per dollar (Yahoo Finance, October 19). The share of operating profit divides that by 2027 consensus operating profit. Raw-material costs, contract lags and exchange-rate moves are not included. The AMPC in won multiplies Herald Economy’s dollar estimates ($675mn in 2026, $879mn in 2027) by the same rate; the comparison with operating profit is one of size only. Quarterly operating profit strings together WiseReport quarterly actuals (2Q25 to 2Q26), third-quarter consensus (collected October 16) and Samsung Securities’ fourth-quarter estimates (Etoday, October 2); since they come from different sources, they are joined only in text.
US stocks are Yahoo Finance closes (US October 16). Year-to-date uses the last close of 2025 and “vs peak” the highest close of 2026.
Korean solar stocks: frequently asked questions
Q. Why did Korean solar stocks rise on October 19, 2026?
OCI Holdings rose 9.66%, Hanwha Solutions 7.95% and HD Hyundai Energy Solutions 6.57%, an average of 8.06% against 1.76% for the KOSPI. Using 60-day betas, the market lifted the three by only about 1.2 percentage points; the other 6.8 points came from solar news: China’s October 16 draft ban on exporting next-generation solar technology, the USITC’s final injury ruling on Indian, Indonesian and Laotian solar imports, and the US minimum import price starting December 4.
Q. What is the US minimum import price on solar products?
A Section 232 proclamation signed on August 6, 2026 sets floors of $21 per kg for polysilicon, $100 per kg for ingots and wafers, $0.22 per watt for cells and $0.38 per watt for modules from December 4. Importers pay any gap below the floor as duty, plus a 15% tariff capped at 15% including existing duties for Korea, Japan, the EU and Taiwan. Anza says the median quote for imported modules has already risen from $0.27 to $0.38 per watt.
Q. What did China ban in its October 16 solar export control draft?
China’s Joint Announcement No. 48 of 2026 adds 12 solar technologies to its export ban and restriction list. Proposed bans cover perovskite-silicon tandem cells, large fluidized-bed polysilicon processes and wafers 70 micrometres or thinner; TOPCon, BC and HJT cell processes and large polysilicon plant engineering would need permission. Finished cells and modules are not covered. Comments close November 15.
Q. Which Korean solar stocks benefit most from the US price floor?
The two companies with factories outside China. Hanwha Solutions makes 3.3GW of cells and 8.6GW of modules in Georgia, and one cent more per watt is about KRW 114.4bn, 8.9% of 2027 consensus operating profit. OCI Holdings’ Malaysian unit makes 35,000 tonnes of non-Chinese polysilicon, and one dollar more per kg is about KRW 46.5bn, 8.7% of 2027 consensus. HD Hyundai Energy Solutions makes modules in Korea and pays the US tariff rather than collecting the floor.
Q. Are Hanwha Solutions and OCI Holdings shares expensive after the rally?
On 2027 consensus EPS, Hanwha Solutions trades at 11.7 times (EPS KRW 2,913) and OCI Holdings at 12.9 times (EPS KRW 16,864). This year’s peak prices on the same EPS were 18.9 and 23.0 times, so the shares price 2027 profits at 0.62 and 0.56 times the peak multiple. A return halfway to the peak multiple would mean KRW 44,600 and KRW 301,900 (author’s calculation, not targets).
Q. What dates matter next for Korean solar stocks?
October 29 (Hanwha Solutions and OCI Holdings third-quarter results), November 2 (US duty orders on India, Indonesia and Laos), November 15 (end of comments on China’s list), November 17 to 19 (APEC in Shenzhen, where US-China relations come up) and December 4 (US minimum import price takes effect). After this year’s 28 big up days, the median five-day excess return was -3.3 percentage points and the 20-day +5.3.
Sources
- CleanTechnica, Hanwha Q CELLS Korea To Build Solar Manufacturing Facility In Georgia, US (link), May 31, 2018
- solar.com, South Korea’s Q CELLS to Open Georgia Solar Factory (link), 2018
- The Korea Herald, US polysilicon curbs leave Korean solar firms caught in crossfire (link), Aug 6, 2026
- Herald Economy, Hanwha Qcells completes Solar Hub (link), Jun 9, 2026
- Etoday, KOSPI and KOSDAQ close at the day’s high (link), Oct 19, 2026
- OhmyNews, KOSPI from a 3% drop to +1.76% (link), Oct 19, 2026
- pv magazine, China proposes ban on exports of perovskite, tandem solar manufacturing technology (link), Oct 16, 2026
- Xinhua, MOFCOM and MOST Joint Announcement No. 48 of 2026 (link), Oct 16, 2026
- News1, China’s solar export controls: little impact, says industry (link), Oct 19, 2026
- Etoday, IBK: after production bases, technology independence; Hanwha Solutions benefits (link), Oct 19, 2026
- Etoday, US solar rules a green light for Hanwha Solutions and OCI Holdings earnings (link), Oct 2, 2026
- White House, Adjusting Imports of Polysilicon and Its Derivatives into the United States (link), Aug 6, 2026
- Anza, Section 232 solar tariffs add new price floor on modules (link), Aug 10, 2026
- PV Tech, Price of solar modules imported to US up more than 40% (link), Sep 23, 2026
- pv magazine, Department of Commerce finalizes trade duties on solar imports from India, Indonesia and Laos (link), Sep 14, 2026
- mgrid, ITC locks in solar duties of up to 268% (link), Oct 16, 2026
- pv magazine USA, USITC finds material injury from solar imports from India, Indonesia and Laos (link), Oct 16, 2026
- pv magazine USA, petition naming Korean cell makers, with Hanwha Qcells’ statement on its China plants (link), Jun 23, 2026
- IFR, Chinese investors left out of Hanwha Q Cells bond (link), issue of Sep 26 to Oct 2, 2026; Chosun Biz report, Oct 19, 2026
- BDO, How the OBBBA Transforms the Energy Tax Credit Transfer Market (link)
- Korea Economic Daily, Korean solar and battery stocks gain after a hollow US-China summit (link), Sep 28, 2026
- Yonhap, Solar stocks jump on US module and polysilicon prices (link), Sep 28, 2026
- News1, Hanwha Solutions up 33% in five sessions (link), Aug 8, 2026
- Aju Business Daily and Newsworks on the May 15 sell-off (https://www.ajunews.com/view/20260515151118398, https://www.newsworks.co.kr/news/articleView.html?idxno=840935), May 15, 2026
- Big-day causes: News2day (Feb 4), News1 (Mar 6, Jun 29, Jul 27), Etoday (Apr 3), Smart Today and MTN (Jul 23)
- DART filings: Hanwha Solutions and OCI Holdings IR notices (Oct 7 and Oct 8, 2026), Hanwha Solutions’ capital injection into its US unit (Sep 30, 2026), HD Hyundai Energy Solutions 2025 annual report
- Kyobo Securities on HD Hyundai Energy Solutions (Jul 27, 2026); Hana Securities (Jul 24, 2026) and Kiwoom Securities (Oct 15, 2026) notes on OCI Holdings
- WiseReport consensus (Oct 16, 2026), Naver Finance analyst targets
- KRX adjusted prices and investor flows (Oct 19, 2026 close), Naver Finance one-minute prices, Yahoo Finance (US stocks Oct 16 close; exchange rate Oct 19), author’s calculations
- Photos: Q CELLS (CC BY-SA 4.0), EditQ (CC BY-SA 4.0), Radiotrefoil (CC BY-SA 4.0), Tony Webster (CC BY 2.0), Warut Roonguthai (CC BY-SA 3.0), Sarah Swenty/USFWS (CC BY 2.0), via Wikimedia Commons
Disclaimer
Was this note useful?
Thanks. Your answer helps decide what to cover next.
Korea market snapshot · Oct 23, 2026
New to Korean stocks? Start here for the basics.
Most read
1France Protests 2026: Why Students Are Blocking Schools and Which Stocks Benefit (Munich Re, SCOR)
Get the Saturday note on Korean stocks
One email every Saturday with the week’s new research on Korean listed companies and links to the updated data pages. Built from DART filings and KRX data. Free; unsubscribe in one click. See past issues