SK hynix (000660.KS) KRW 100 Trillion Shareholder Return: Why the Buyback Price Matters More Than the $75bn Size
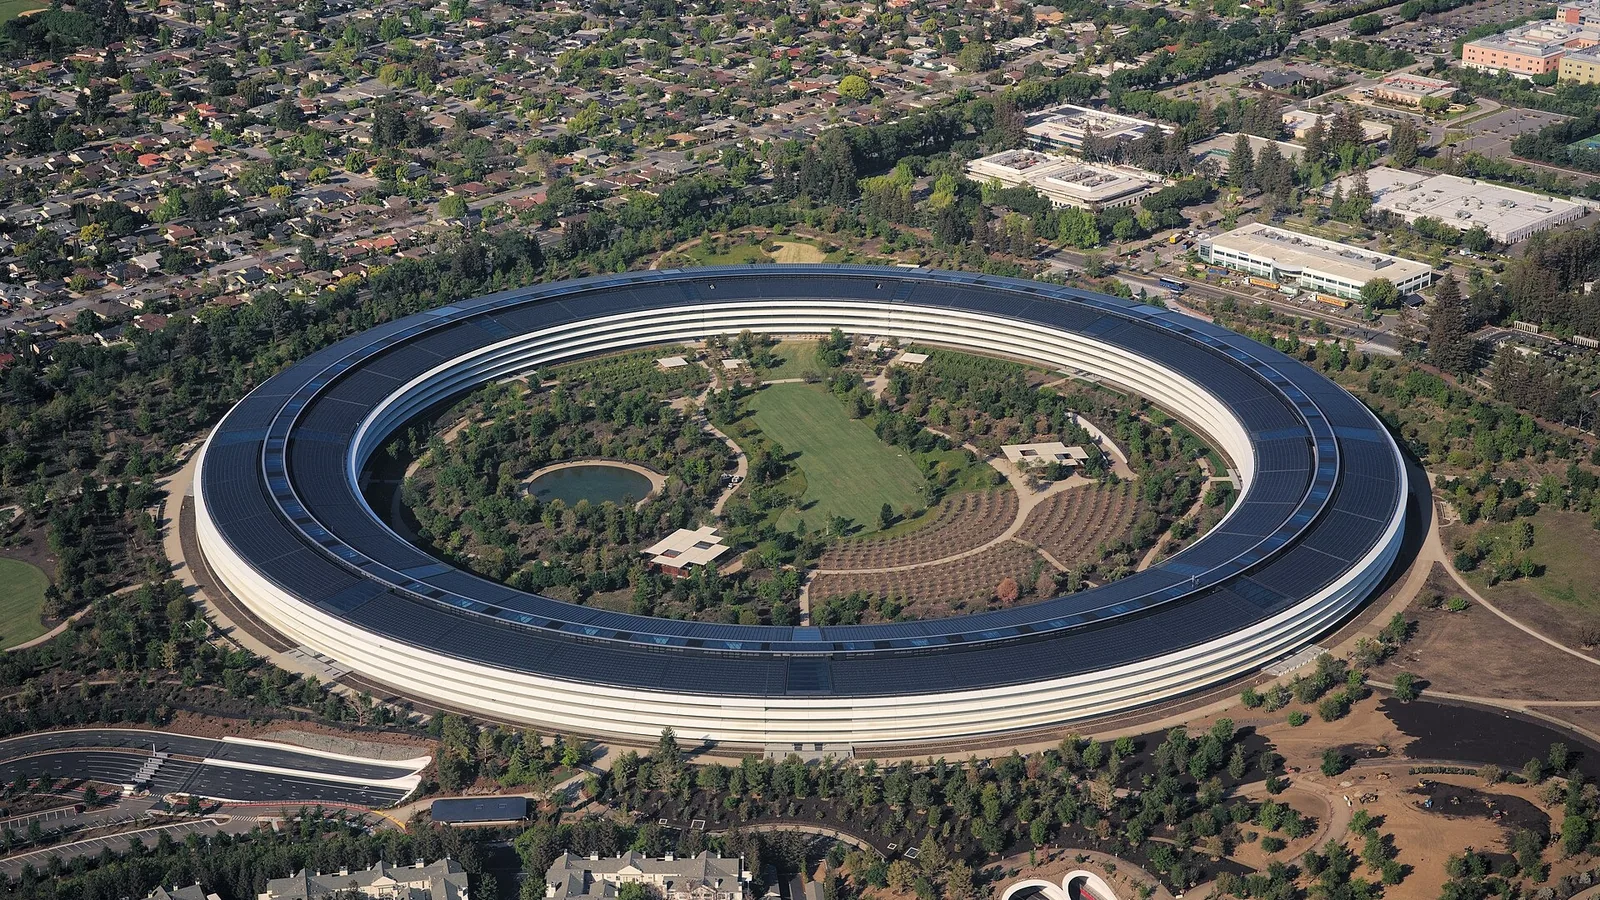
After the market closed on May 1, 2018, Apple reported its second-quarter results and announced that its board had approved a new $100bn share buyback. Chief financial officer Luca Maestri wrote in the press release that “our Board has approved a new $100 billion share repurchase authorization,” and in the same sentence said the quarterly dividend would rise 16%. The stock rose 4.1% in after-hours trading to $176.07 (AFP). U.S. companies announced $173.6bn of buybacks that month, a monthly record, and Apple’s was the largest (TrimTabs). Since the end of 2012 Apple has bought back more than $880bn of its own stock and cut its share count by more than 44%. Someone who held one share from the start now owns an 80% larger slice of the company (Motley Fool, September 2026).
What Apple’s case shows is not the size of the money but how far that money shrank the share count. A dividend is finished the moment it is paid, but a share bought and cancelled stays behind as a larger slice for the remaining shareholders.
So what should be read this time? On October 28, 2026, SK hynix announced, together with its third-quarter results, a shareholder return of about KRW 100tn (about $74.7bn) for fiscal 2026: cash dividends of at least KRW 30tn and share buybacks for cancellation of at least KRW 60tn. Who receives this money, and where does its value come from? The conclusion of this report fits in one sentence: the price at which the company buys matters more than how much it returns. The share price is below half of its June peak, and market cap is 2.7 years of estimated 2027 operating profit. That this return arrives at a point where the same KRW 10tn buys and cancels 26% more shares than in August matters more than the headline figure of KRW 100tn.
This report is the English edition of the author’s Korean note on SK hynix’s KRW 100tn shareholder return.
As of: October 28, 2026 (Korean stocks are KRX regular-session closes on October 28; results and the return plan come from the SK hynix Newsroom and filings as reported; broker estimates are WISEreport consensus as of October 28). Dollar figures in parentheses use KRW 1,338.2 per dollar, the October 28, 2026 rate. Numbers the author calculated are marked as such.
Some Korea-specific background. The KOSPI is the main board of the Korea Exchange (KRX) and its benchmark index; tickers ending in .KS trade there. The KRX publishes each stock’s net buying by investor type (foreigners, institutions including pension funds, and retail investors) every trading day, which is how this report can say who bought and who sold. DART is the Financial Supervisory Service’s electronic disclosure system, where Korean companies file their reports. Korea counts large sums in jo (one trillion won) and eok (100 million won); this report shows them as KRW tn and KRW bn. Charts that the Korean edition drew in units of 10,000 won or 10,000 shares appear here in KRW thousand (written “k”) and millions of shares, and amounts in units of 100 million dollars appear as $bn.
Topics covered: key terms; October 28 at a glance; who bought; KRW 100tn of revenue in one quarter; how the KRW 100tn is built; the Kioxia special dividend; dividend per share over time; how the policy changed; how big it is; against U.S. big tech; three ways to hand back money; who gets the dividends; the money that reaches SK Square; the separate-taxation threshold; the dollars that leave; where the money comes from; how much profit the price pays for; the price it buys at; the shares that disappear; a 100-share holder’s arithmetic; the August buyback at today’s price; P/E after cancellation; 2018 versus 2026; can it be repeated; prices and volumes; Samsung Electronics; affected sectors and stocks; the case against; signals and dates; common questions; basis of calculation.
Key terms: buyback and cancellation, fiscal-year return, record date, payout ratio and net cash
This report rests on a few unfamiliar terms. Laying them out first makes the numbers that follow much easier to read.
A share buyback is a company using its own money to buy its own shares in the market. If the shares merely sit in the treasury, they can be sold again at any time, so it is unclear how much has actually gone back to shareholders. Cancellation is the step that retires those shares for good. After cancellation the share count falls, and the same profit is divided among fewer shares. That is why “buy and cancel” counts as a shareholder return. In this announcement SK hynix said that of the KRW 20tn of new buybacks, only KRW 10tn will be cancelled and the remaining roughly KRW 10tn will be used for share-based pay such as employee bonuses. Shares given to employees come back onto the market, so the company left this portion out of the KRW 100tn.
A fiscal-year return is the total handed back on the basis of one year’s results. SK hynix’s fiscal 2026 runs from January to December 2026. Dividends on that year’s results are paid quarterly, and the final year-end dividend is paid the following spring. So “KRW 100tn for fiscal 2026” already includes the first- and second-quarter dividends paid in June and September, the KRW 40tn buyback approved in August and completed on October 21, the third-quarter dividend and buyback set now, and a fourth-quarter amount not yet decided.
The record date determines which shareholders receive a dividend. The record date for the third-quarter dividend is November 30, and since Korean trades settle two days after purchase, buyers through November 26 receive it. The payout ratio is the share of net profit paid out as dividends. Under the separate taxation of dividend income that took effect in 2026, this ratio decides which firms count as “high-dividend companies.” Net cash is cash and equivalents minus borrowings. At the end of September SK hynix held KRW 114.5tn of cash and KRW 15.8tn of borrowings, for net cash of KRW 98.7tn.
The P/E ratio is the share price divided by earnings per share. The ratio this report uses often, market cap divided by operating profit, shows how many years of operating profit it would take to pay for the whole company at today’s price. The smaller it is, the cheaper the stock is relative to its profit. Finally, there is one hypothetical example. It assumes an individual with no other financial income holds 100 SK hynix shares and calculates how much the dividend and the cancellation each change that person’s stake.
On October 28, one third of the KOSPI’s added market cap came from SK hynix
To give the conclusion first: SK hynix and Samsung Electronics produced three quarters of the KOSPI’s gain that day, and the holding companies that own SK hynix shares rose even more. SK hynix disclosed its third-quarter results and return plan at around 8:40 a.m., before the open. The KOSPI opened 2.23% higher at 5,763.85, and at 9:54:24 a.m., with KOSPI 200 futures holding 5.17% higher, a buy sidecar was triggered, a five-minute pause on program buying that the exchange imposes when futures swing sharply. It was the second day in a row. The index crossed 6,000 in the afternoon and closed 6.63% higher at 6,012.44, its first close above 6,000 in ten trading days, with an intraday high of 6,032.28 (Herald Economy).
By Korea Exchange market cap, the KOSPI added KRW 314.5tn (about $235.0bn) that day. SK hynix alone accounted for KRW 106.7tn of it, or 33.9%. Samsung Electronics, including preferred shares, added KRW 132.2tn, and all other KOSPI stocks together added KRW 75.6tn (author’s calculation). The two companies’ shares combined come to 75.9%.
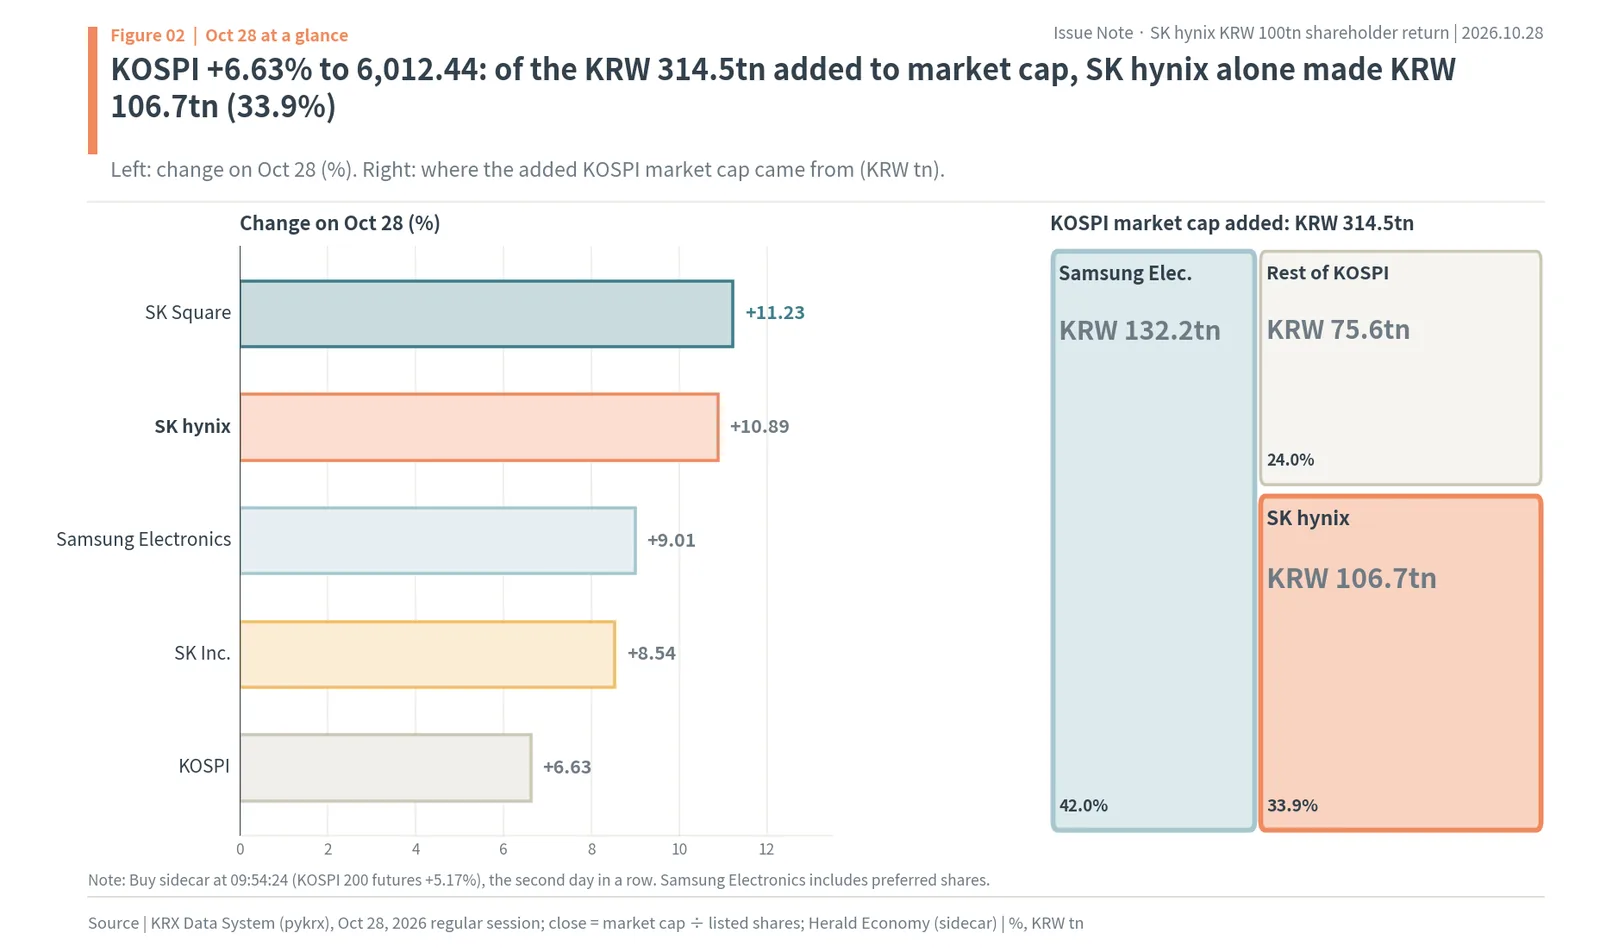
The left side of the chart is the day’s change. SK hynix rose 10.89% to close at KRW 1,487,000 (about $1,111), after touching KRW 1,495,000 intraday. SK Square, which owns 20% of SK hynix, rose 11.23%, and SK Inc., SK Square’s largest shareholder, rose 8.54%. Samsung Electronics also gained 9.01% to KRW 242,000. One fifth of SK hynix’s dividend goes to SK Square, and cancellation raises SK Square’s stake; that arithmetic appears to have been priced into the holding companies too. Samsung Electronics was due to announce its own shareholder return with final results the next day, and the market placed the same expectation on it.
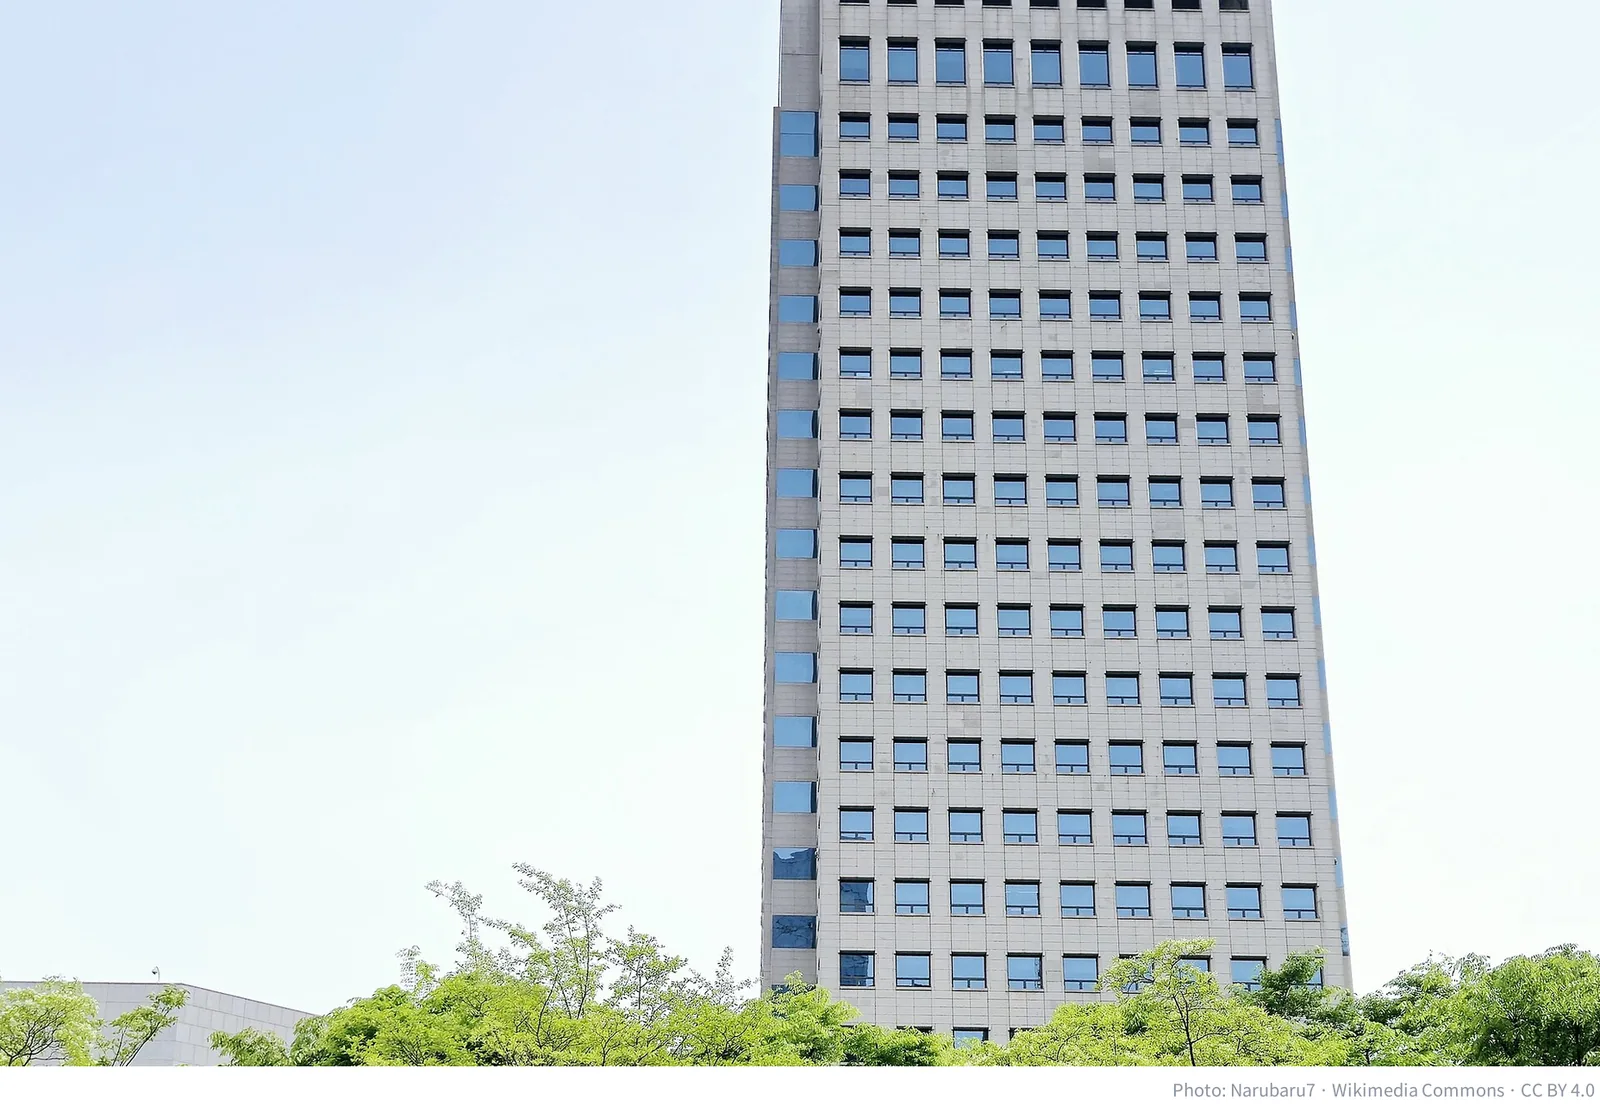
Seen through the numbers at the Korea Exchange in Yeouido, this was a day when one company’s announcement of results and returns lifted the whole KOSPI. Of the KOSPI’s KRW 4,969tn market cap, SK hynix is KRW 1,086tn, more than one fifth. What this company decides is, in effect, what the index does. The next question is who bought.
Foreigners, after a month of selling SK hynix, turned buyers that day
Across the KOSPI that day, retail investors sold KRW 1,738.1bn, while foreigners bought KRW 792.4bn and institutions KRW 932.6bn (KRX final figures). Retail investors took profits on a rising day and foreigners and institutions took the other side. In SK hynix alone, foreigners bought a net KRW 380.1bn, institutions KRW 228.5bn, and retail investors sold KRW 606.5bn.
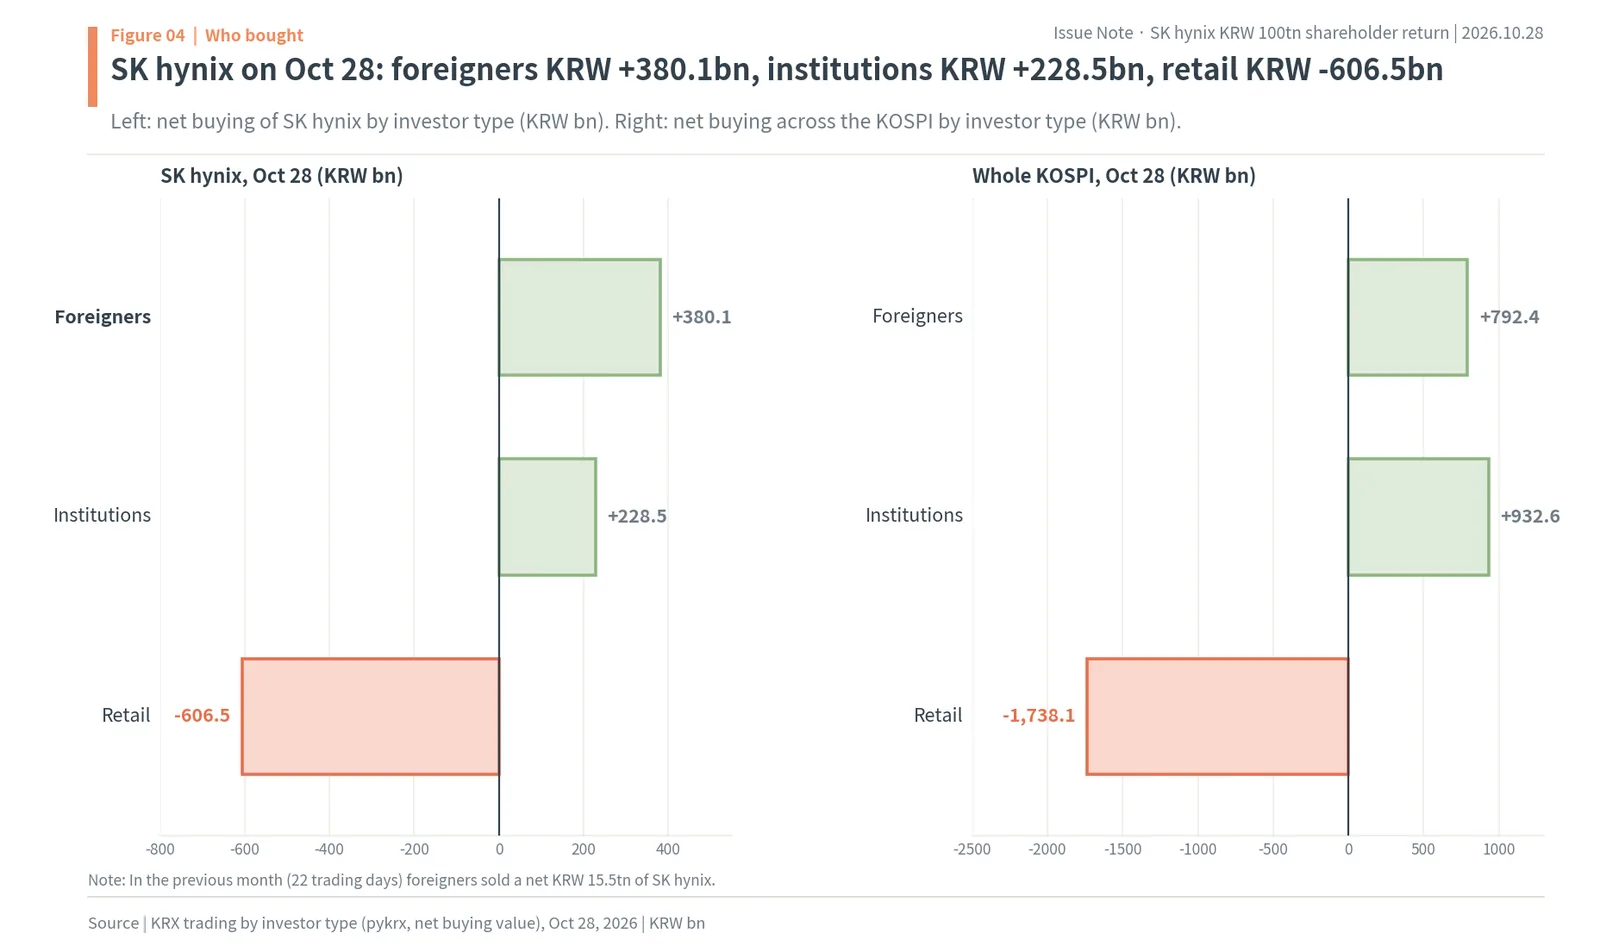
The foreign buying stands out because of what came before. Over the previous 22 trading days foreigners sold a net KRW 15.5tn of SK hynix. Foreign ownership fell from 53.83% at the start of the year to 48.61% on October 27. Foreigners who had been selling steadily bought again on the day of the return announcement. One day of trading is too early to call a change of direction, but since half of the third-quarter dividend goes to foreigners (see “who gets the dividends” below), their next trades will signal how they view this return.
KRW 100tn of revenue in one quarter, more than all of last year
The source of any return is profit. SK hynix’s third-quarter consolidated revenue was KRW 104.6155tn, operating profit KRW 83.3338tn and net profit KRW 39.7756tn (company newsroom, preliminary). It was the first time quarterly revenue topped KRW 100tn, and this single quarter’s revenue exceeded last year’s full-year revenue of KRW 97.1467tn. The operating margin was 79.7%: the company kept almost 80 won of every 100 won it sold. In short, third-quarter revenue was KRW 104.6tn (about $78.2bn) and operating profit KRW 83.3tn (about $62.3bn), a margin of 79.7%.
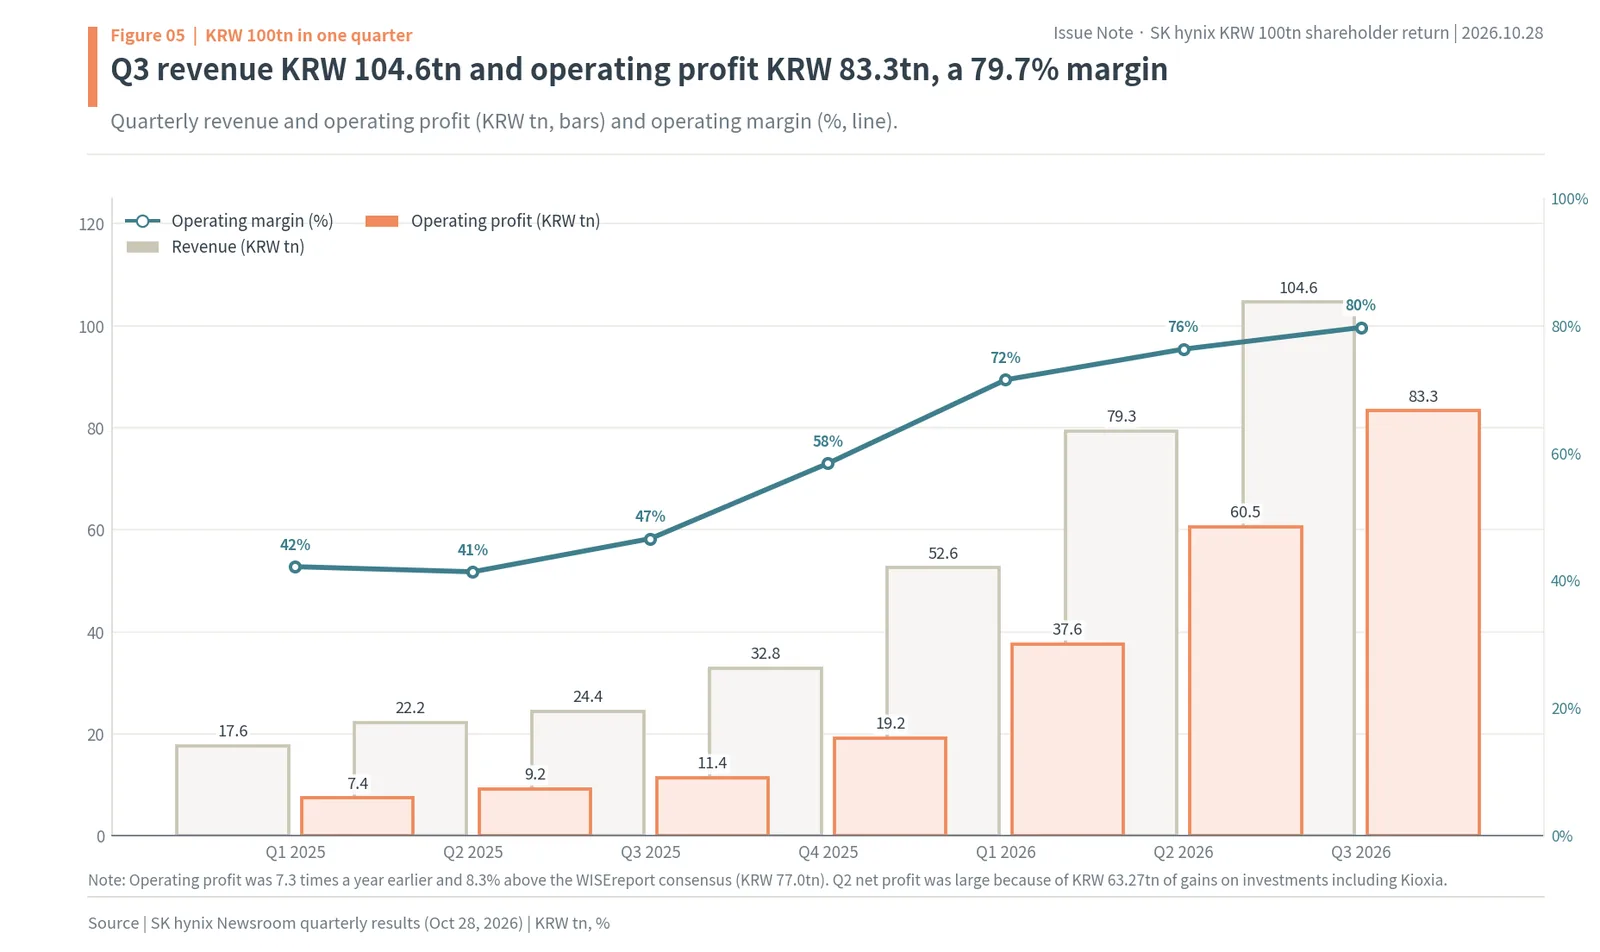
The chart shows revenue, operating profit and margin for the seven quarters from the first quarter of 2025. Operating profit was 7.3 times the KRW 11.3834tn of a year earlier and 8.3% above the WISEreport consensus (KRW 76.96tn). The margin rose from 42% in the first quarter of 2025 without a single dip. Second-quarter net profit of KRW 93.9226tn exceeded operating profit because investments including Kioxia produced a KRW 63.27tn gain (Yonhap Infomax). Third-quarter net profit fell from the second quarter because that one-off gain dropped out, not because the core business shrank.
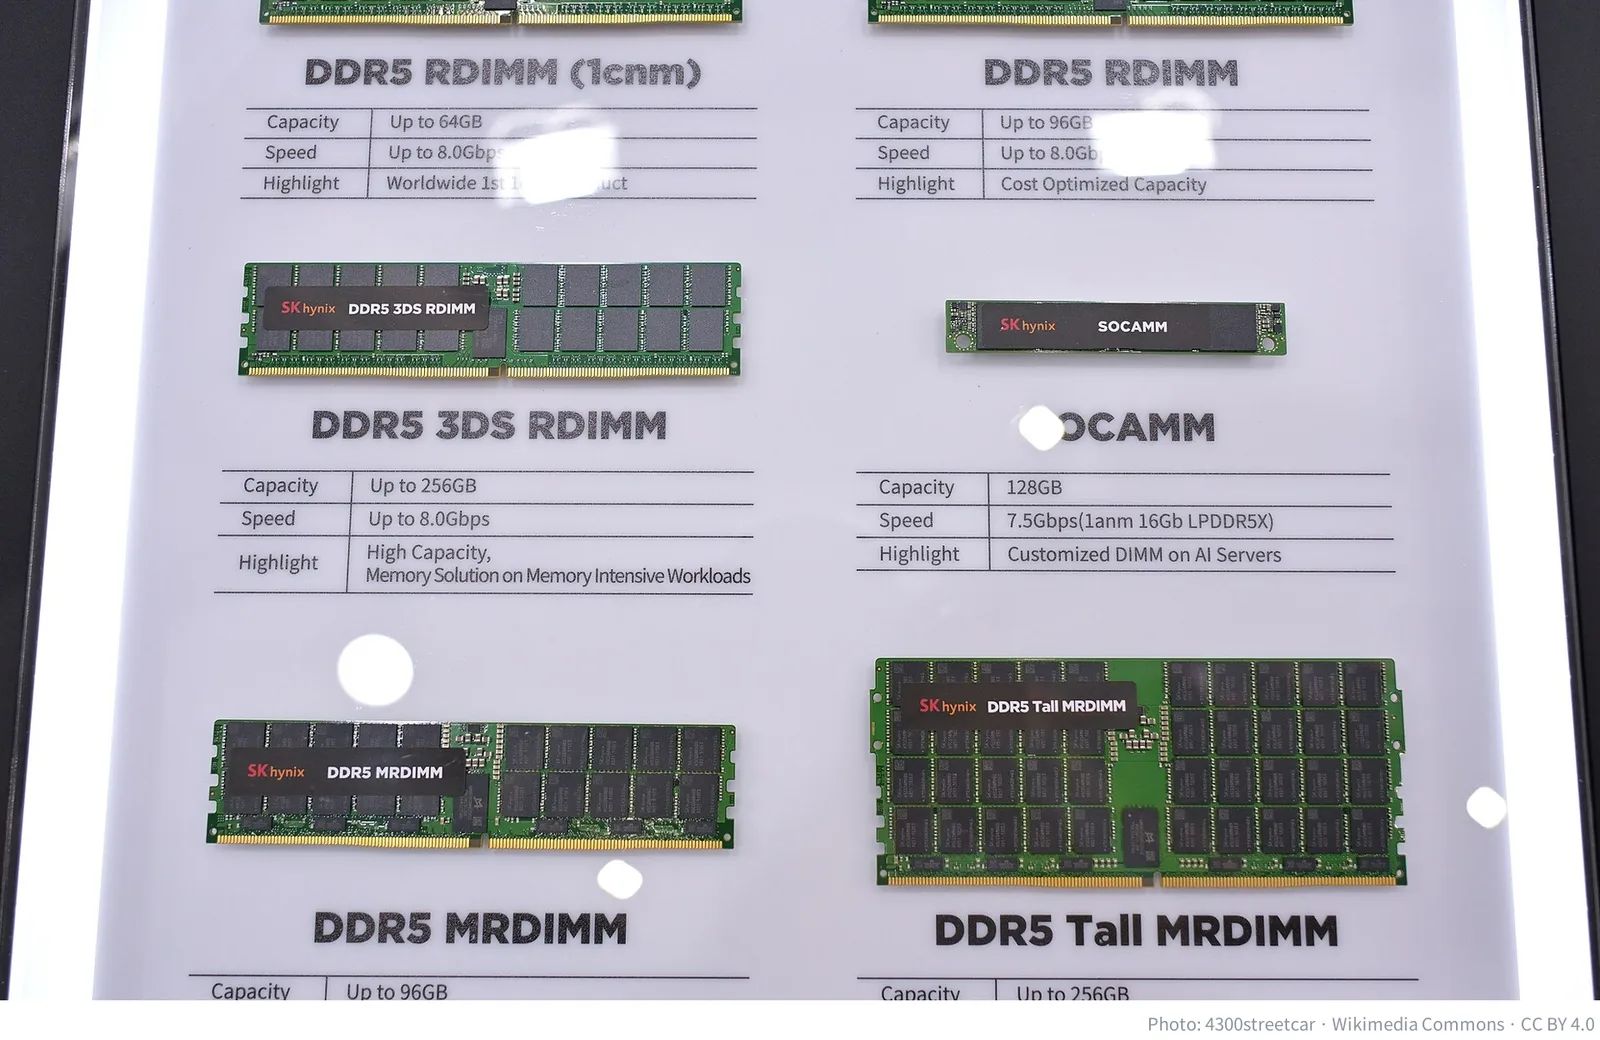
On the conference call SK hynix said that in the fourth quarter both shipments and revenue of HBM4 will overtake HBM3E. HBM (high-bandwidth memory) is stacked DRAM that sits next to AI chips. Negotiations on next year’s HBM volumes and prices are already finished, and long-term supply agreements with 14 major customers, including large cloud companies, cover more than half of 2027 and 2028 capacity (MTN, EBN). The company said DRAM and HBM are effectively sold out through 2029. Operating profit for the first three quarters of this year adds up to KRW 181.5tn. Where a company that has piled up this much profit spends the money is the subject of this announcement.
Two thirds of the KRW 100tn is money that buys shares and retires them
In the company’s own words, the plan is “cash dividends of at least KRW 30tn on a fiscal 2026 basis” and buybacks for cancellation of “at least KRW 60tn in total, including the KRW 40tn announced in August.” The two together make “a shareholder return of about KRW 100tn,” which is the name of the announcement. The company said it is honoring its pledge to return at least 50% of free cash flow (FCF), and added a principle that buybacks will continue every quarter. In short, the KRW 100tn is made up of dividends of KRW 30tn or more (about $22.4bn) and buyback-and-cancel of KRW 60tn or more (about $44.8bn), including the KRW 40tn August buyback that is already done.
Stacking the KRW 100tn into what has been decided so far and what is still to be filled shows the structure. On the dividend side, KRW 375 per share for the first quarter (KRW 265.7bn) and KRW 375 for the second (KRW 273.3bn) have been paid. The third-quarter dividend is KRW 20,000 per share (about $14.9), KRW 14.1035tn in total. Of the KRW 20,000, KRW 10,000 is an earnings dividend and KRW 10,000 is a special dividend sharing the return on the Kioxia investment, KRW 7.05tn each. To reach at least KRW 30tn, dividends from the fourth quarter on must therefore be at least KRW 15.4tn (author’s calculation). On the buyback side, the KRW 40tn approved on August 19 was fully bought by October 21, and the cancellation portion of KRW 10tn from the KRW 20tn newly set now brings the total to KRW 50tn. The remaining roughly KRW 10tn needed to reach KRW 60tn has no timing or method yet.
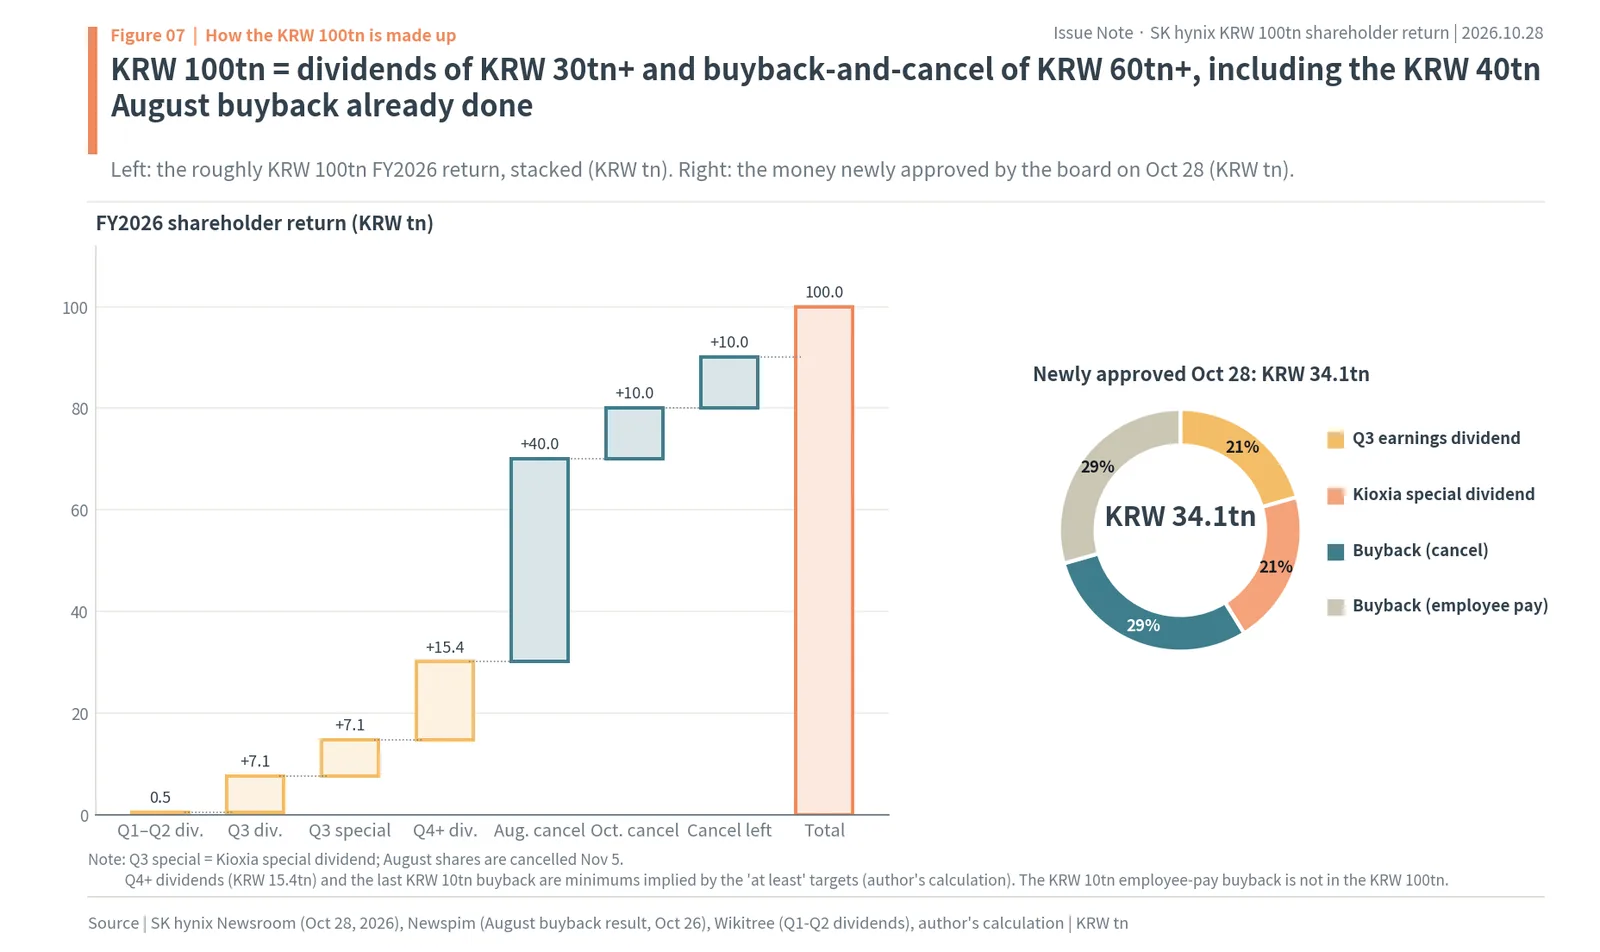
The left of the chart stacks these seven blocks, and the right shows the KRW 34.1tn (about $25.5bn) newly approved by the board on October 28: the KRW 14.1tn third-quarter dividend plus the KRW 20tn new buyback. At the October 27 close of KRW 1,341,000, the KRW 20tn buys 14.92 million shares (2.04% of shares outstanding), to be purchased on the market from October 29 to January 28, 2027 (brokers SK Securities and NH Investment & Securities, with a daily limit of 1,492,000 shares). It is worth remembering that roughly KRW 10tn of this, for employee pay, is not counted in the KRW 100tn. KRW 20tn of company cash goes out, but only half of it counts as a return to shareholders.
Half of the third-quarter dividend is money from selling Kioxia
Half of the KRW 20,000 third-quarter dividend comes from the return on the company’s investment in Kioxia, the Japanese NAND flash maker. In 2018 SK hynix put KRW 3.916tn into the consortium that bought Kioxia (then Toshiba Memory). In June this year it sold its entire stake held through a special-purpose company and booked KRW 63.27tn of investment-related gains in the second quarter (Yonhap Infomax, July 2026). CEO Kwak Noh-jung said the company has made it a principle that when a strategic investment bears fruit, most of it is shared with shareholders, and the company said it will pay most of the realized Kioxia gain through the third-quarter and year-end dividends (MTN).
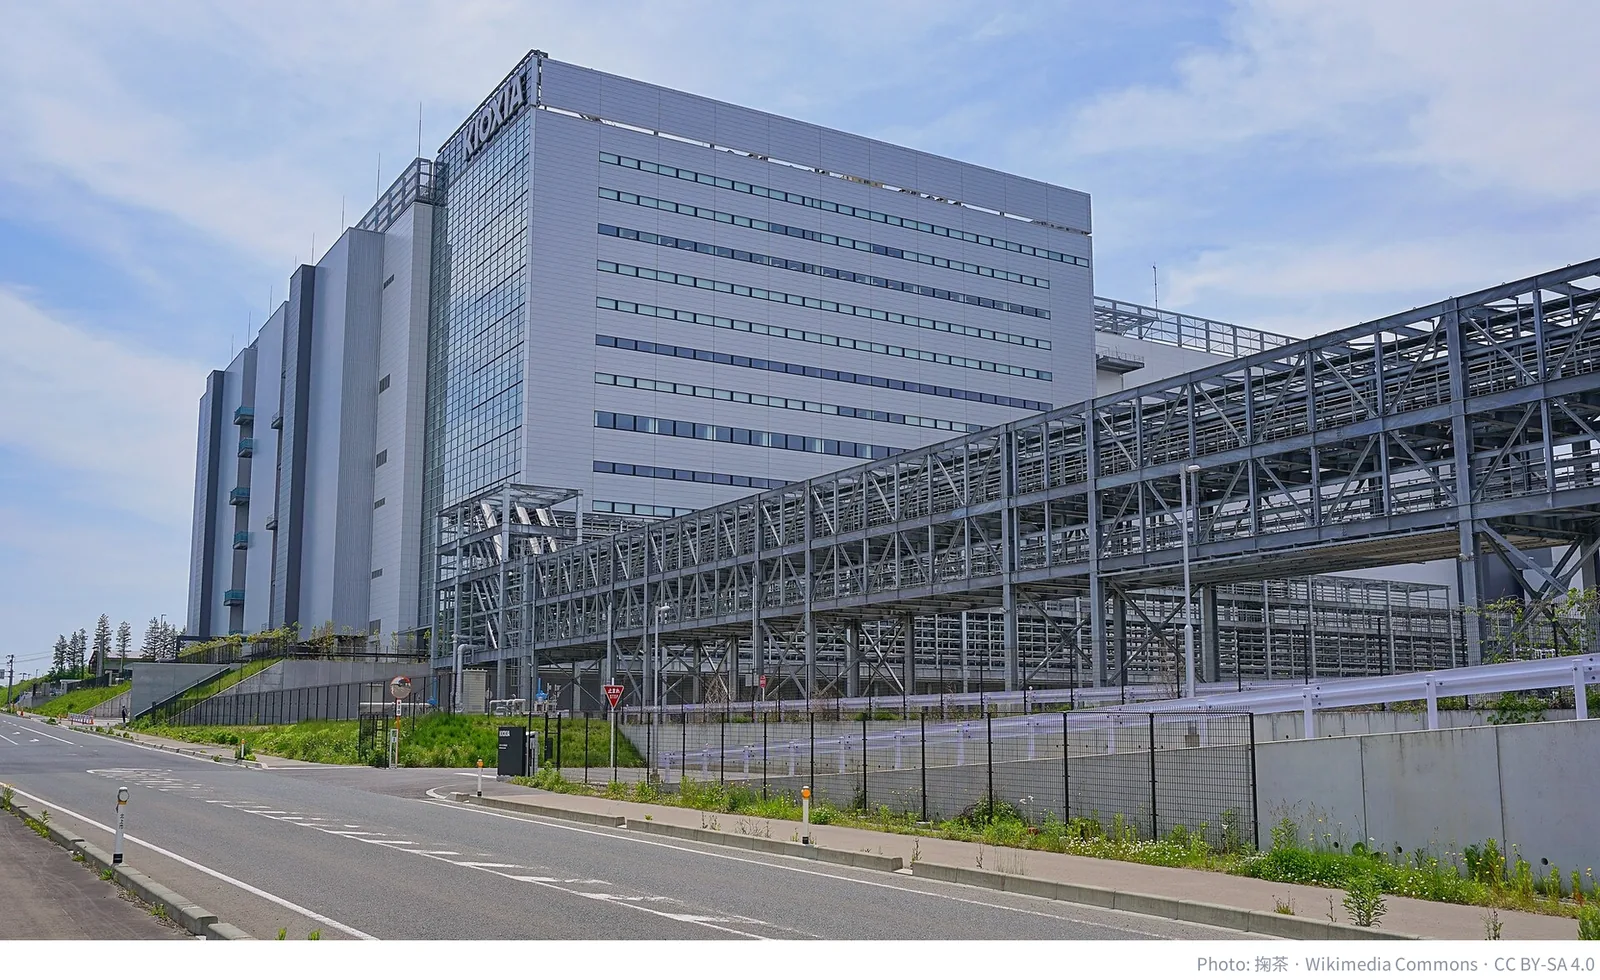
The Kioxia special dividend is not recurring money. Of the KRW 14.1tn third-quarter dividend, KRW 7.05tn is a one-time portion, and how much more Kioxia money will be in the year-end dividend has not been decided. So to gauge the floor for dividends from next year on, it is more accurate to look separately at the KRW 10,000 earnings dividend and the fixed dividend of KRW 1,500 a year set by the company in November 2024.
Dividend per share rose sevenfold in a year
For years SK hynix’s dividend per share stayed in the KRW 1,000 to 1,500 range: KRW 1,500 in 2018, KRW 1,000 in 2019, KRW 1,170 in 2020, KRW 1,540 in 2021, a fixed KRW 1,200 in 2022 and 2023, and KRW 1,500 in 2024. It rose to KRW 3,000 for the first time in 2025, and for 2026, with the fourth quarter still to come, KRW 375 each for the first two quarters plus KRW 20,000 for the third already add up to KRW 20,750. In short, dividend per share went from KRW 3,000 in 2025 to KRW 20,750 for 2026 so far.
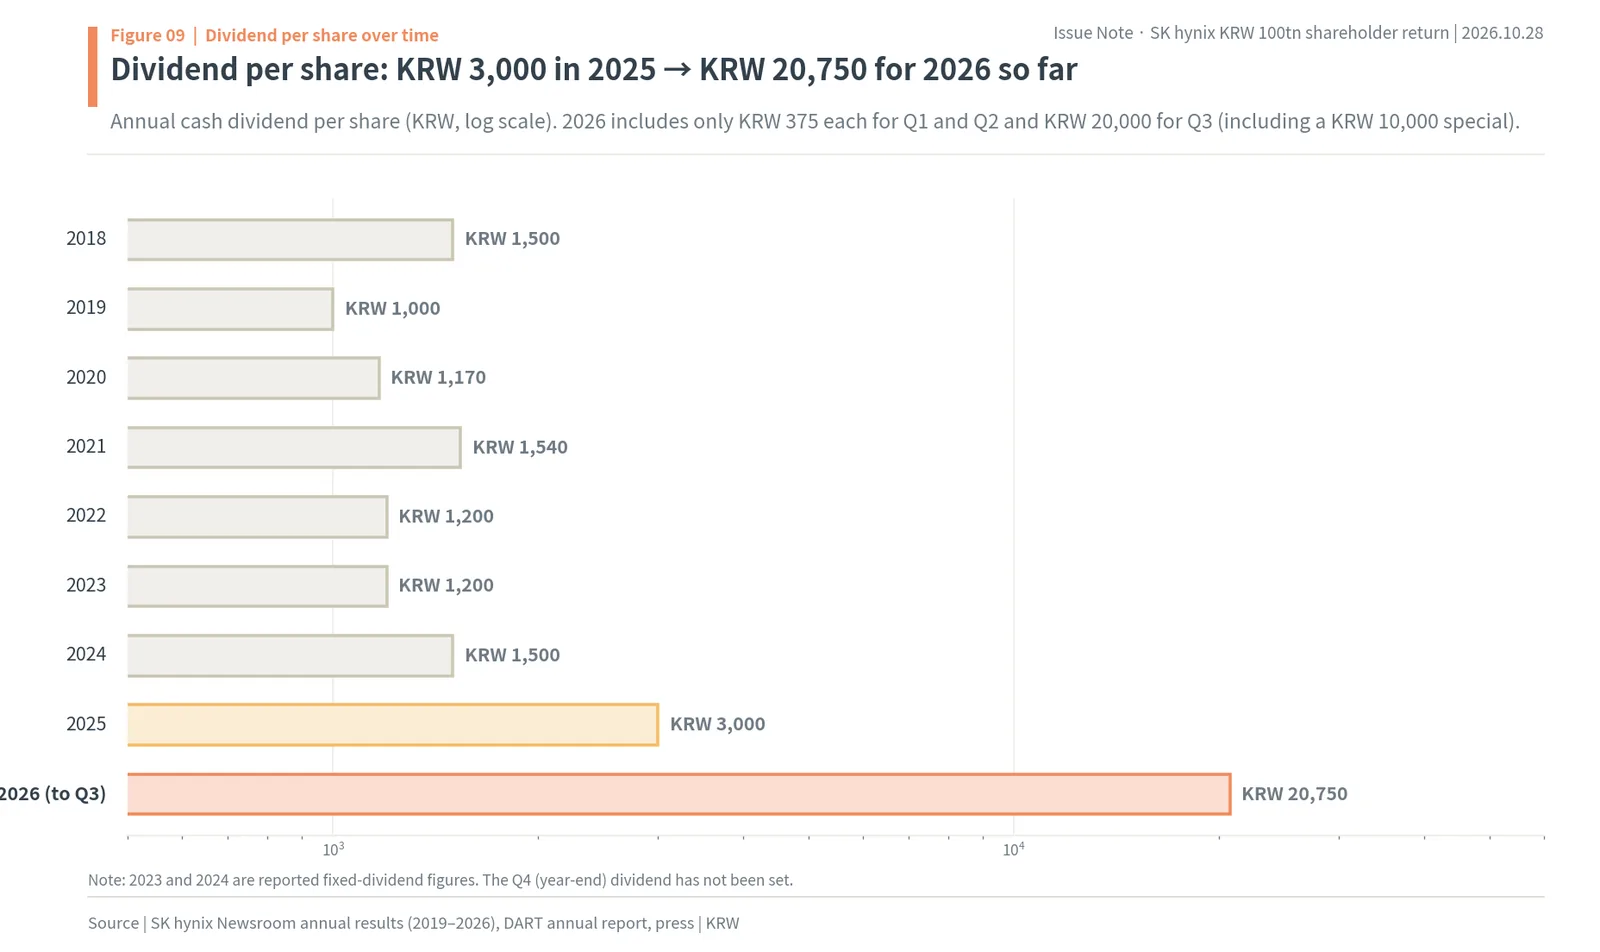
The chart uses a log scale, so differences in bar length look smaller than the real multiples. The confirmed 2026 amount alone is 6.9 times 2025, and with at least KRW 15.4tn more in fourth-quarter dividends the annual dividend per share would exceed KRW 40,000 (KRW 30tn ÷ about 705 million dividend-bearing shares, author’s calculation). Total dividends go from KRW 2.0951tn in 2025 to KRW 30tn or more in 2026, more than 14 times. Even so, the yield on the third-quarter payment alone is just over 1.34%, because the share price grew along with profit.
The return policy changed three times in two years
The KRW 100tn did not appear out of nowhere; it sits at the end of a policy revised several times over two years. In November 2024 SK hynix said it would return 50% of cumulative free cash flow over 2025 to 2027 and raise the annual fixed dividend 25%, from KRW 1,200 to KRW 1,500. At that point “50%” read more like a ceiling, with a caveat that part of annual FCF would first go to strengthening the balance sheet. Borrowings were still large then.
For fiscal 2025, under that policy, the company paid KRW 375 a quarter plus a year-end KRW 1,875, KRW 3,000 per share or KRW 2.0951tn in total, and bought and cancelled KRW 12.2tn of shares, KRW 14.3tn altogether. As a result 15.3 million shares (2.1%) were cancelled in January 2026. At this stage the company began returning money by buying and retiring shares in earnest for the first time.
In August 2026, when it approved the KRW 40tn buyback, the company changed “50% of FCF” to “at least 50%.” The ceiling became a floor. By then net cash had already swelled to tens of trillions of won and the Kioxia sale proceeds had come in. On October 28 the company fixed the whole of fiscal 2026 at dividends of at least KRW 30tn and cancellation of at least KRW 60tn, and added the principle of continuing buybacks every quarter. In two years the return went from “sharing part of profit” to “something repeated every quarter.”
The order of these changes shows that the company has been shifting the weight of its returns toward cancellation. Of the KRW 14.3tn in fiscal 2025, cancellation was a little over 85%; of the KRW 100tn in fiscal 2026, it is at least 60%. The dividend share rose because a one-off item, the Kioxia special dividend, was included. Excluding Kioxia, the company’s basic framework still leans toward large cancellations and small dividends.
KRW 100tn is seven times last year and about equal to the company’s net cash
The size of the KRW 100tn can be measured several ways. The first is against last year. SK hynix’s fiscal 2025 return was KRW 14.3tn, KRW 2.1tn of dividends plus KRW 12.2tn of buybacks (Jaekyung Ilbo, Segye Ilbo). This year is 7 times that. The second is against the company’s size. It is 9.2% of the KRW 1,086.2tn (about $811.7bn) market cap at the October 28 close, nearly a tenth of the company’s value returned to shareholders in one year. The third is against cash. It is about equal to the KRW 98.7tn (about $73.8bn) of net cash at the end of September. The fourth is against profit. It is 38.1% of WISEreport’s estimated 2026 operating profit of KRW 262.7tn. In short, KRW 100tn is 7 times last year’s KRW 14.3tn, 9.2% of market cap and about equal to net cash of KRW 98.7tn.
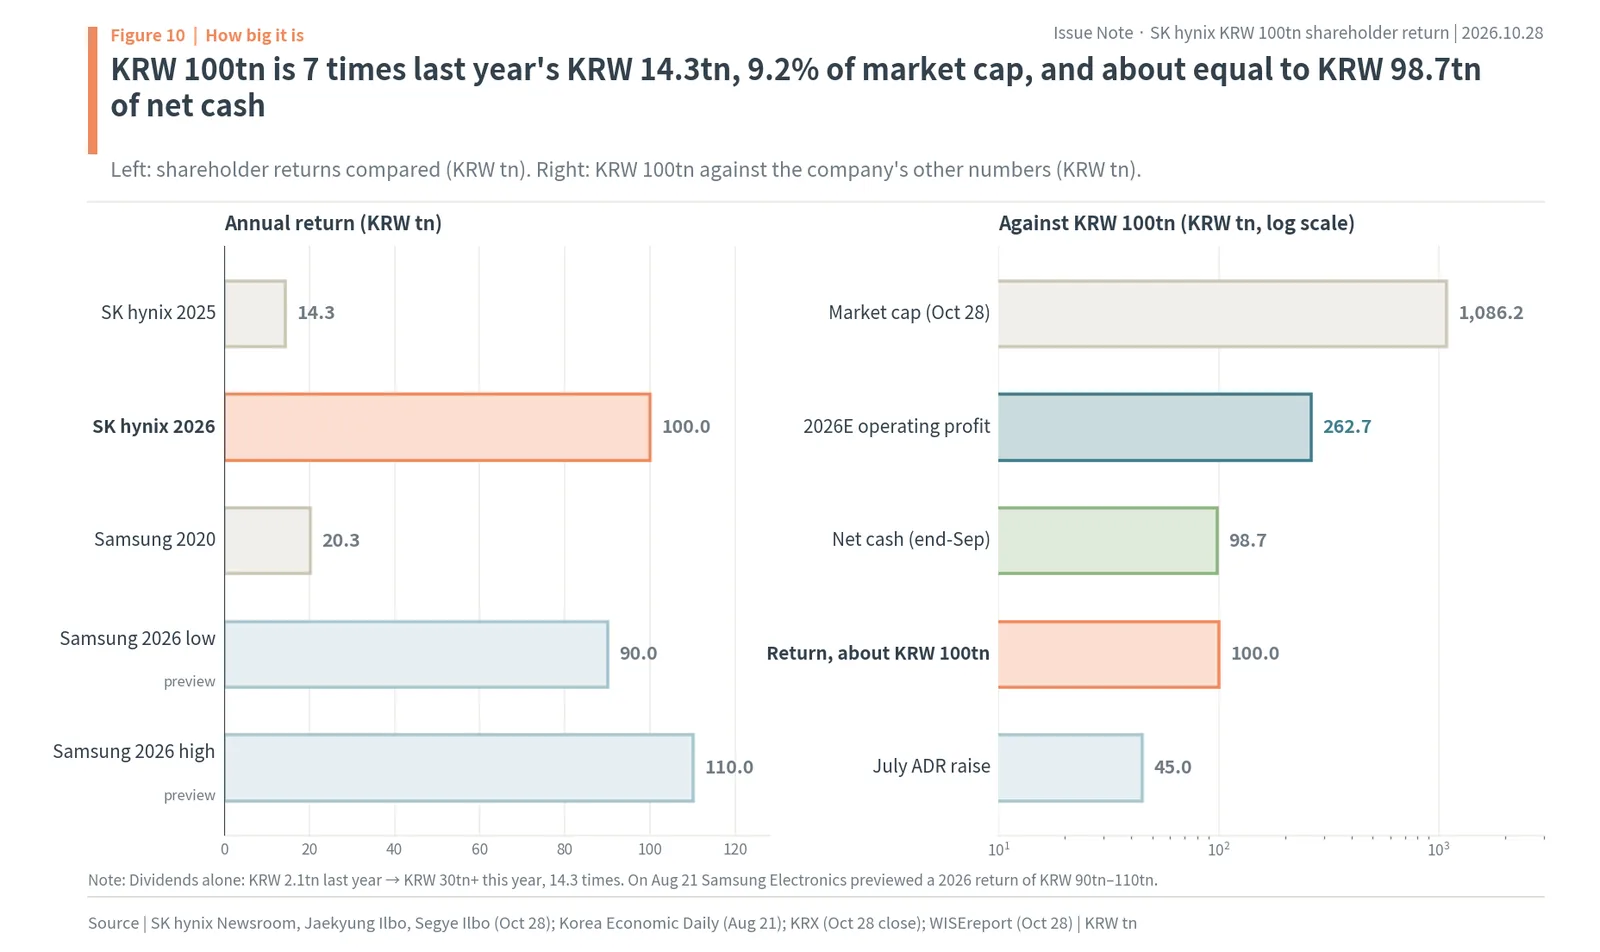
As the left of the chart shows, it is not a size never seen before among Korean listed companies. On August 21 Samsung Electronics’ board previewed a 2026 shareholder return of KRW 90tn to 110tn (Korea Economic Daily). Samsung’s previous record was KRW 20.3tn in 2020, a year with a special dividend. The two companies have put forward returns of similar size in the same year. The difference is in the structure. SK hynix set the shares first, at least KRW 30tn of dividends and at least KRW 60tn of cancellation, while Samsung gave only a range and will decide the rest at a board meeting in late January 2027. The right chart also includes the roughly KRW 45tn raised in July through the Nasdaq listing of American depositary receipts (ADRs). A company that took KRW 45tn of new money from the market three months ago has pledged to hand back more than twice that. This contrast is taken up again in “the case against.”
Against U.S. big tech, it is about the size of Apple in 2018
At the October 28 won-dollar rate of KRW 1,338.2, KRW 100tn is about $75bn (precisely $74.7bn). Setting it beside U.S. companies’ buyback authorizations gives a sense of scale. Apple authorized $100bn in 2018 and $110bn in 2024, and Nvidia added $150bn on September 28, 2026 (Morningstar/Dow Jones). In 2024 Alphabet authorized $70bn, Microsoft $60bn and Meta $50bn (the tracking site buybackstocks.com). In short, SK hynix’s about KRW 100tn is about $75bn, close in size to Apple’s $100bn authorization in 2018.
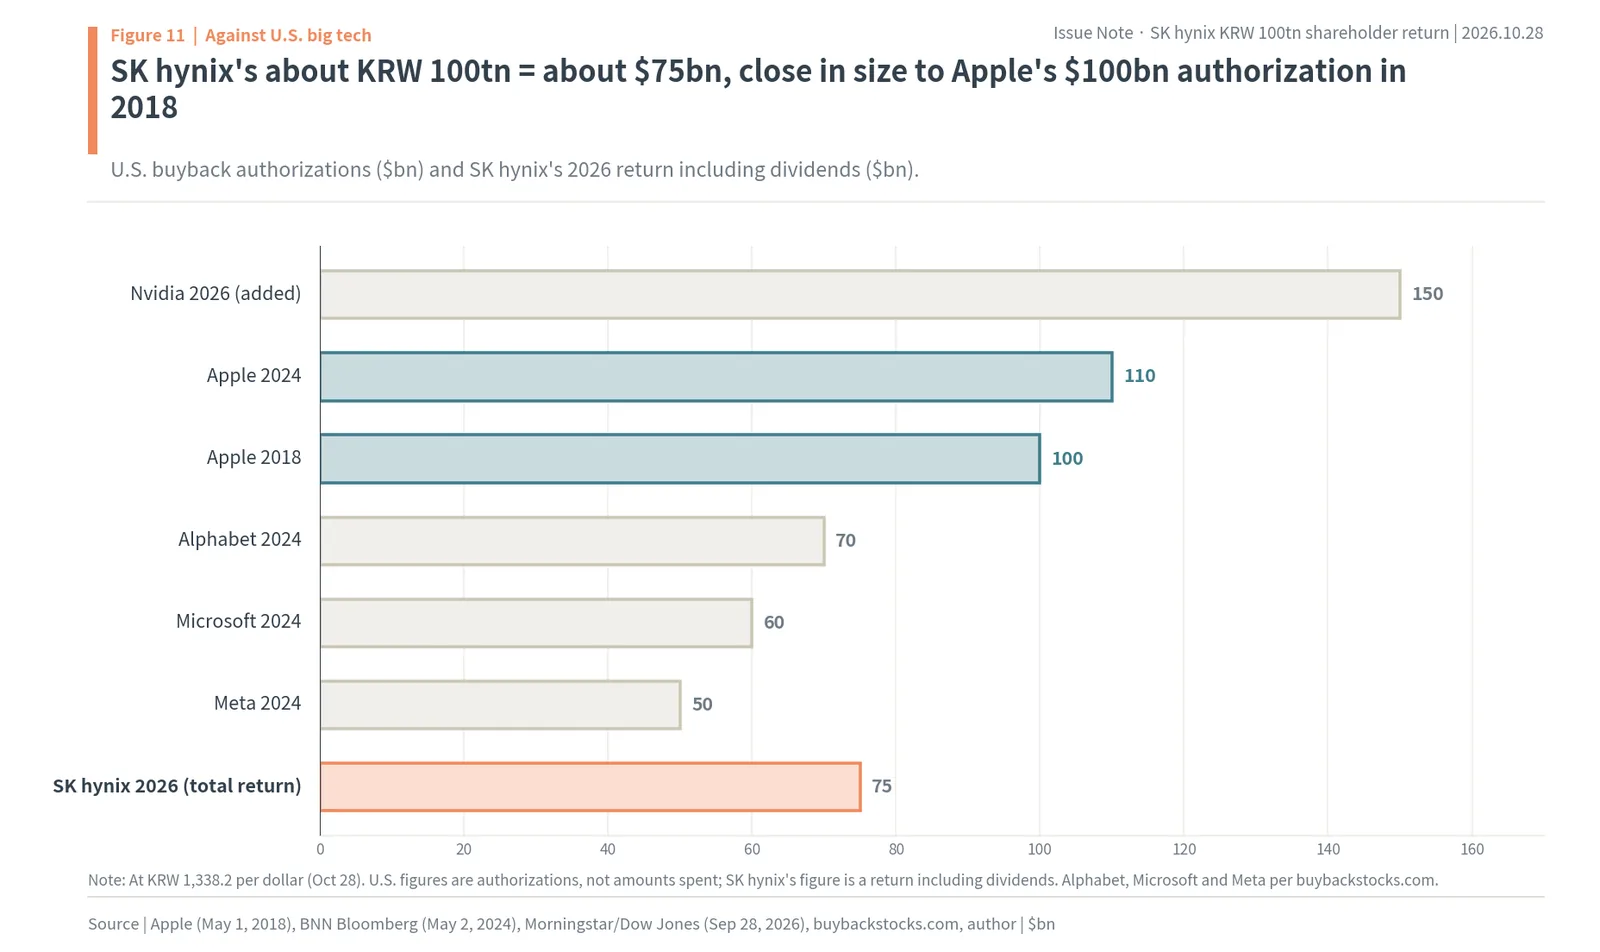
The comparison has two differences. U.S. figures are limits the board allows, and actually buying it all can take several years. SK hynix’s figure is the sum of dividends and cancellations carried out within one fiscal year. And U.S. big tech returns are mostly buybacks, with a small dividend share. In Apple’s actual fiscal 2025 return, dividends were a little over one seventh. SK hynix has set at least 30% as dividends. The same $75bn reaches shareholders in a different shape. A dividend goes into the recipient’s hands as cash and is taxed. A cancellation enlarges the remaining shares’ slice instead of paying cash. That difference is the subject of the next two chapters.
Three ways to hand back the same money: dividends, cancellation and employee shares
This announcement mixes three routes by which company cash goes out: dividends, buybacks for cancellation, and buybacks for employee pay. All three reduce company cash by the same amount, but they reach shareholders in different shapes.
A dividend hands cash to the shareholders on the record date in proportion to their shares. Part of the company’s value turns into cash and moves into shareholders’ accounts, and dividend income tax applies the moment it is received. The KRW 14.1tn third-quarter dividend is this route. In the share price, a value equal to the dividend usually drops out on the ex-dividend date. A dividend is closer to “taking money out of the company and handing it over.”
A buyback for cancellation buys shares on the market and then retires them. The company’s cash goes to the people who sold, and the remaining shareholders, without receiving cash, share the same company among fewer shares. No tax falls on the remaining shareholders right away; only the sellers pay tax on any capital gain. The KRW 40tn of August, the KRW 10tn cancellation portion now and the remaining KRW 10tn are this route. As seen earlier, the value of a cancellation depends on the price paid.
A buyback for employee pay looks the same as one for cancellation but ends differently. When the shares bought are handed to employees as bonuses, they come back onto the market. The share count does not fall. This time that portion is about KRW 10tn, 7.46 million shares at the reference price, or 1.02% of shares outstanding. That difference is why the company left it out of the KRW 100tn. Paying employees in shares instead of cash uses company cash but leaves the share count unchanged, so it cannot be counted as a return to shareholders.
Set side by side, the three routes show where the weight of this announcement lies. Counting every route by which company cash goes out, dividends of at least KRW 30tn, cancellation of at least KRW 60tn and employee shares of about KRW 10tn add up to more than KRW 100tn. Of these, only cancellation enlarges the remaining shareholders’ slice; dividends convert the slice to cash, and employee shares do not touch it directly. In fiscal 2025, cancellation was 85.3% of the KRW 14.3tn return. In fiscal 2026 the Kioxia special dividend raised the dividend share, but cancellation is still two thirds.
Half of the dividends go to foreigners and one fifth to SK Square
A dividend goes to whoever holds shares on the record date, in proportion to their holdings. Splitting the KRW 14.1tn third-quarter dividend by the current shareholder mix shows where the money goes. The calculation uses three numbers: foreign ownership of 48.61% (October 27, KRX), SK Square’s 146,100,042 shares, and the National Pension Service’s 7.50% stake (July report). The NPS is Korea’s state pension fund and one of the largest domestic investors. The 25,319,041 treasury shares the company holds receive no dividend. Everything else is grouped as “other domestic holders.” Split this way, of the KRW 14.1tn third-quarter dividend, foreigners receive KRW 7.1tn (50.4%), SK Square KRW 2.92tn and the NPS KRW 1.1tn, with KRW 2.98tn for other domestic holders (author’s calculation).
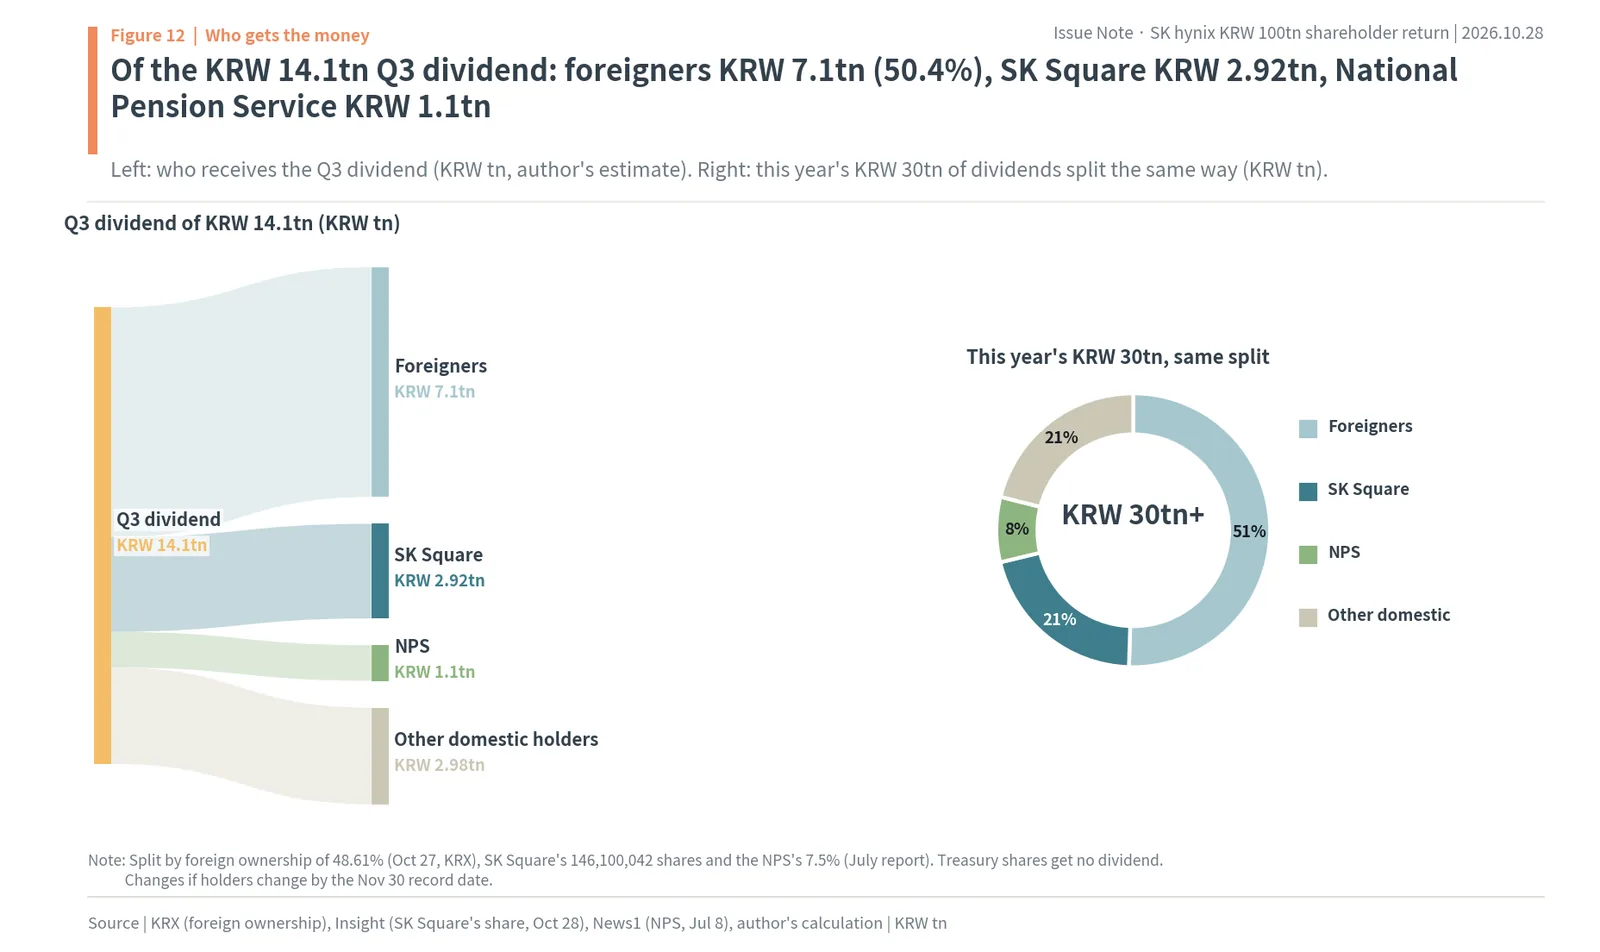
The right of the chart splits this year’s KRW 30tn of dividends the same way: KRW 15.1tn to foreigners, KRW 6.2tn to SK Square, KRW 2.3tn to the NPS and KRW 6.3tn to other domestic holders. If shareholders change by the November 30 record date the numbers change too, but the big picture does not. Half of the KRW 30tn crosses the sea, and a large part of the half that stays in Korea goes to an SK Group holding company. The stake of retail shareholders, who numbered 3,461,526 at the end of June, five times a year earlier, is inside “other domestic holders.”
This calculation shows two things. First, because the foreign share is large, there will be demand to convert won into dollars when the dividend goes abroad. The third-quarter dividend is paid within a month of the record date, so this money moves in December. Second, the larger the dividend, the more money flows upward from the bottom of the SK Group’s ownership structure.
The money that reaches SK Square flows up again toward SK Inc.
Korean business groups (chaebol) are typically controlled through a chain of holding companies. In the SK Group the chain runs from SK hynix to SK Square, its largest shareholder, and from SK Square up to SK Inc., the group’s top holding company, in which chairman Chey Tae-won holds a stake. SK Square receives KRW 2.922tn from the third-quarter dividend (the same as Insight’s calculation). SK Square has said that under its 2026 to 2028 shareholder return policy it will hand back at least 30% of its recurring dividend income through buybacks and cancellation or cash dividends. Applying that policy directly to the third-quarter dividend gives a minimum of KRW 0.88tn. Insight wrote that this is only a mechanical application of the policy, not an amount SK Square has decided. Whether the Kioxia special dividend counts as “recurring” income or as an “investment gain” has not been made clear either.
SK Square’s valuation is worth examining. At the October 28 close SK Square’s market cap was KRW 121.5tn, while the SK hynix shares it owns were worth KRW 217.3tn (about $162.4bn). With a KRW 121.5tn market cap below its KRW 217.3tn SK hynix stake, SK Square trades 44.1% below the value of its holding (author’s calculation). Holding companies commonly trade below the value of their stakes in subsidiaries, but a gap this wide also means doubt is just as large about how much of the subsidiary’s dividend will reach the holding company’s own shareholders.
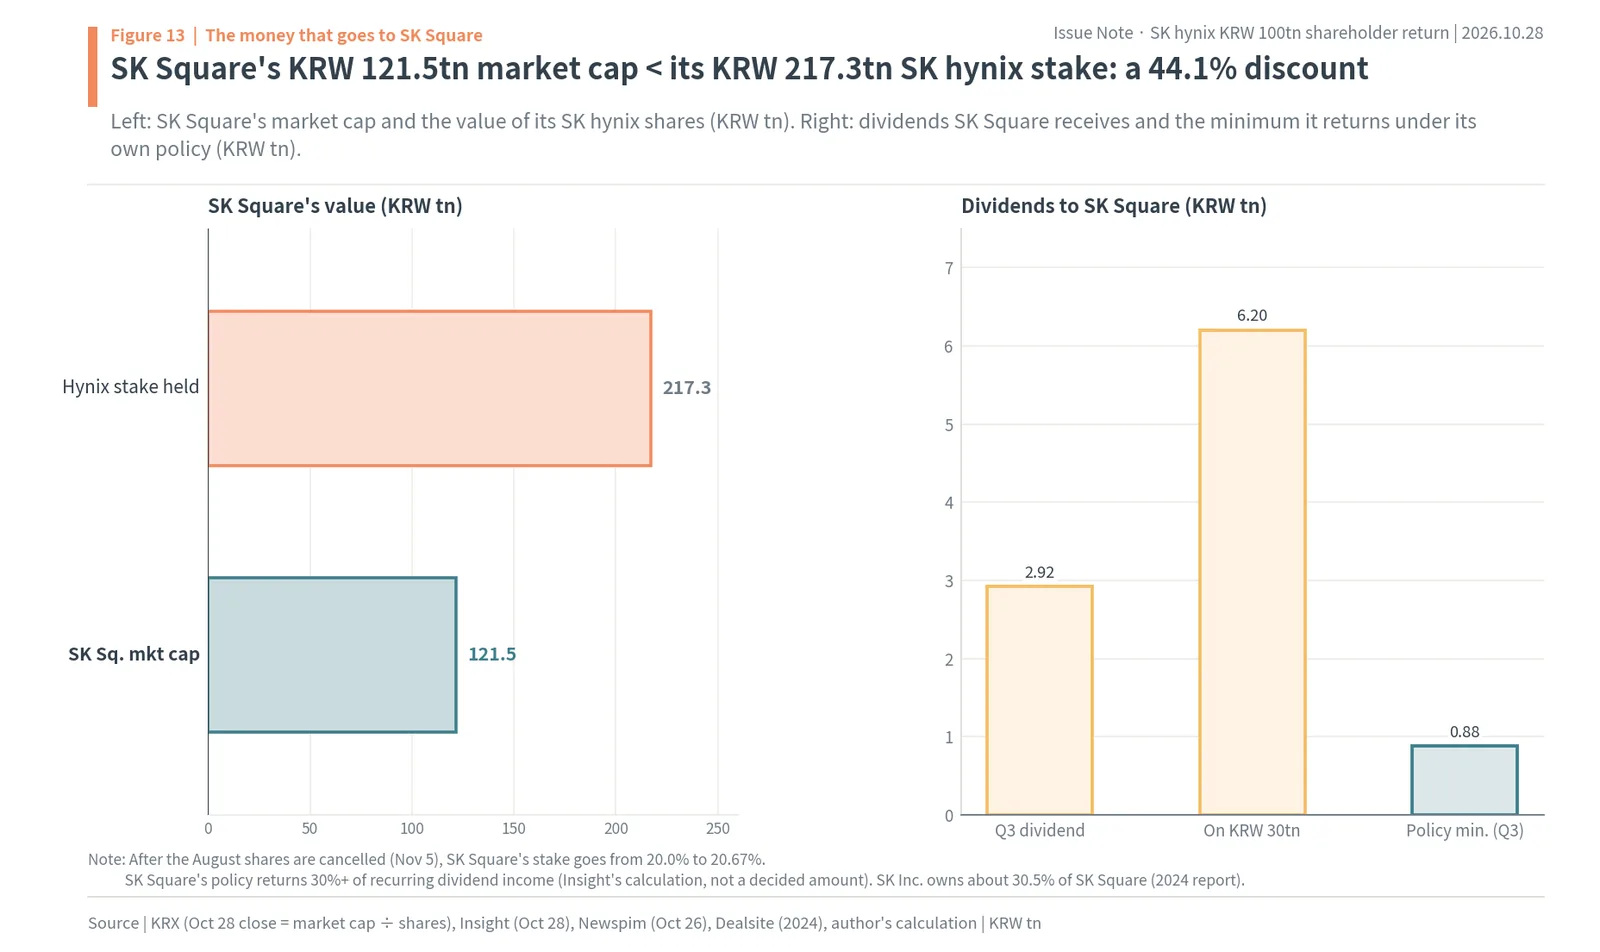
Cancellation also benefits SK Square by another route. When the 23,693,272 shares bought in August are cancelled on November 5, shares outstanding fall from 730.49 million to 706.80 million, and SK Square’s stake rises from 20.0% to 20.67%. Under Korea’s Fair Trade Act a holding company must own at least 20% of a listed subsidiary. The stake, which the July ADR share issue had pushed right up against that line, regains room through cancellation. Above it, SK Inc. owns about 30.5% of SK Square (2024 report), and chairman Chey Tae-won’s stake in SK Inc. goes from 17.76% to 15.49% after a partial sale in early November (Newsspace). On the same day Korea Ratings kept the AA+ credit ratings of SK hynix and SK Square and raised their outlook by one notch from stable (Yonhap).
Even KRW 30tn of dividends falls short of the “high-dividend company” tax threshold
Since January 2026, dividends have been eligible for separate taxation of dividend income (Restriction of Special Taxation Act, Article 104-27). Dividends received from a “high-dividend company” are taxed separately rather than combined with other income. The rates are 14% up to KRW 20mn, 20% from KRW 20mn to 300mn, 25% from KRW 300mn to 5bn, and 30% above KRW 5bn (local tax extra). The previous top rate under combined taxation was 45%. A high-dividend company is one that has not cut its dividend and has a payout ratio of 40% or more, or a payout ratio of 25% or more with dividends up at least 10%. The payout ratio is based on consolidated net profit attributable to owners (Maeil Shinmun, October 2026; Newsis, January 2026).
SK hynix has raised its dividend more than fourteenfold, so it easily clears the growth test. The sticking point is the payout ratio. WISEreport’s estimate of 2026 net profit to owners is KRW 256.1tn. KRW 30tn of dividends is 11.7% of that. Reaching 25% would take dividends of KRW 64tn (author’s calculation). In short, even KRW 30tn of dividends is only 11.7% of this year’s estimated net profit, and reaching the 25% “high-dividend company” threshold takes KRW 64tn (about $47.8bn). Profit has grown so fast that the largest dividend in the company’s history does not count as “high dividend.”
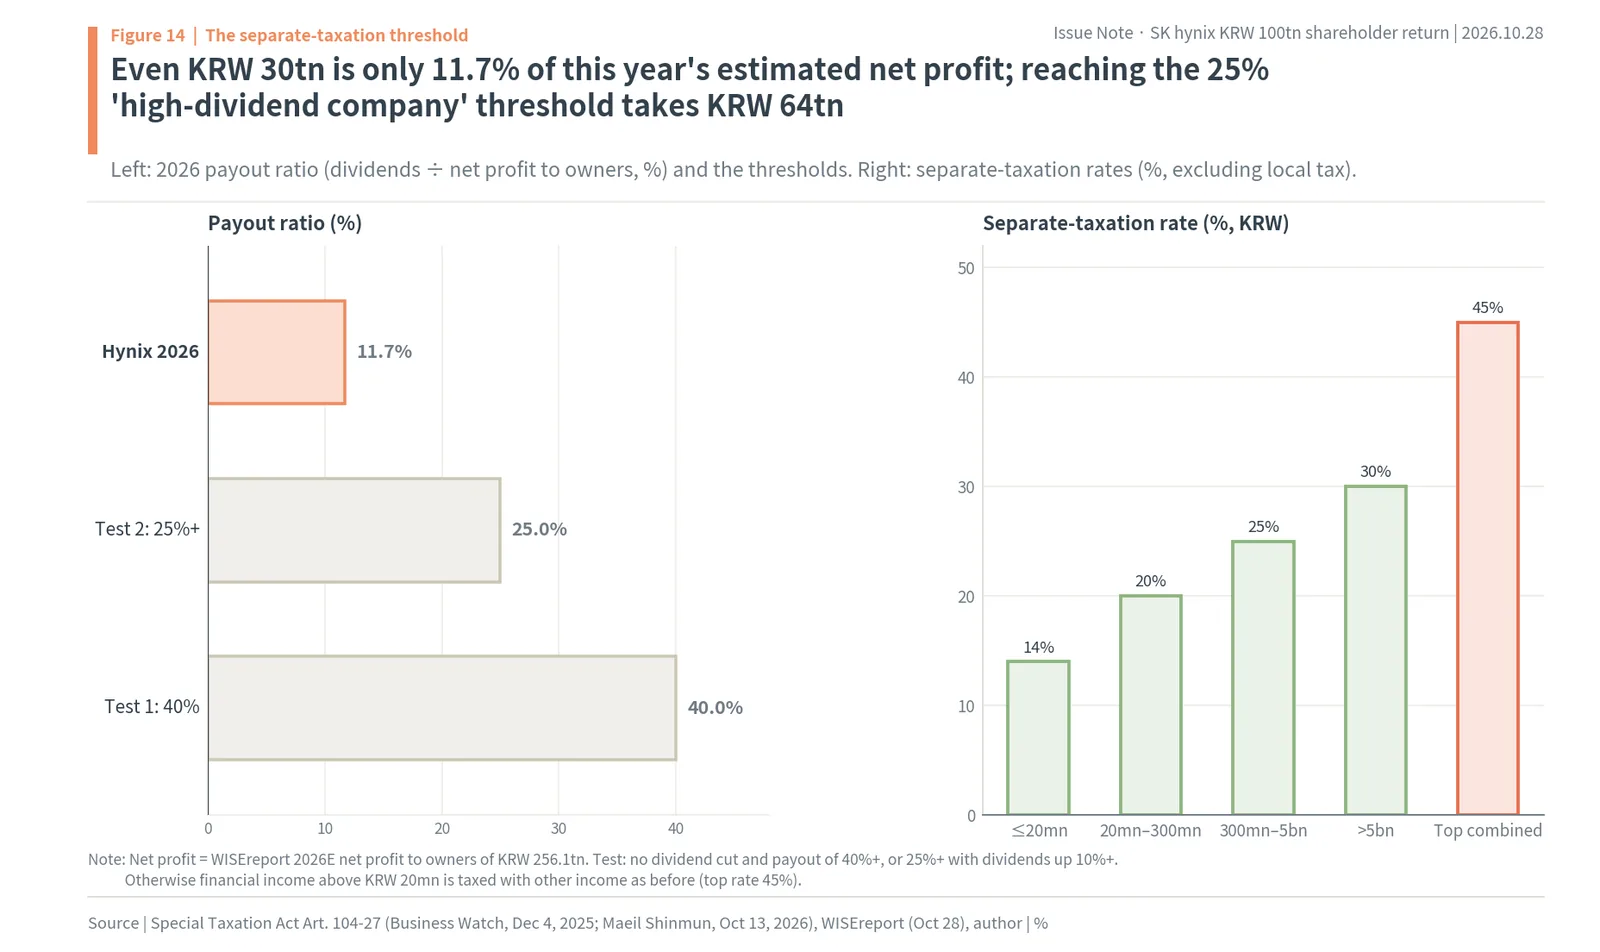
This calculation depends on the 2026 profit estimate, so the result changes if the fourth-quarter dividend rises sharply or net profit comes in below the estimate. On current numbers, though, domestic individuals who receive large SK hynix dividends, meaning those with more than KRW 20mn of financial income a year, pay tax on the excess combined with wage and business income at up to 45%. Small shareholders below KRW 20mn are done with 15.4% withholding (including local tax). By contrast, the larger slice created by cancellation is not taxed for now. Here the difference in how dividends and cancellation reach shareholders shows up in numbers.
The foreign share of the dividend is about $5.3bn
That half of the dividend goes to foreigners also leaves a small trace in the currency market. The foreign share of the third-quarter dividend, KRW 7.1tn, is about $5.3bn at the October 28 rate of KRW 1,338.2. The foreign share of this year’s KRW 30tn split the same way, KRW 15.1tn, is about $11.3bn (author’s calculation). If foreign shareholders send the dividends home rather than leaving them in won and buying Korean stocks again, there will be demand to sell won and buy dollars at payment. The third-quarter dividend is paid within a month of the November 30 record date, so this flow appears in December.
Whether this money returns to the Korean market is up to foreigners. As seen earlier, foreigners sold KRW 15.5tn of SK hynix in the month before and then bought KRW 380.1bn on the announcement day. If more traders buy before the record date to collect the dividend and sell afterward, the share price could swing around the dividend. Conversely, foreigners who believe cancellations will continue every year will stay for the shrinking share count rather than the dividend. For foreigners too, dividends and cancellation send different signals.
From SK Square’s side, the KRW 6.2tn it will receive in dividends this year is 5.1% of its KRW 121.5tn market cap. A holding company receives cash equal to more than 5% of its market cap in a year from subsidiary dividends alone. How much of this cash flows down to SK Square’s shareholders will decide whether the 44.1% holding-company discount narrows or widens. Following SK Square’s policy (at least 30% of recurring dividend income) sends down only the minimum; counting the Kioxia special dividend as an “investment gain” and returning more would widen that amount. SK Square has not yet decided.
The money comes from net cash built up over nine months
Where the KRW 100tn comes from is on the balance sheet. SK hynix’s net cash went from KRW 10.2tn at the end of 2025 to KRW 35.0tn at the end of the first quarter of 2026, KRW 69.4tn at the end of the second and KRW 98.7tn at the end of the third, nearly tenfold in nine months (company newsroom, Yonhap). Operating profit over the same first three quarters was KRW 181.5tn (about $135.6bn). In short, net cash went from KRW 10.2tn at the end of 2025 to KRW 98.7tn at the end of September, and operating profit for the first three quarters of this year was KRW 181.5tn.
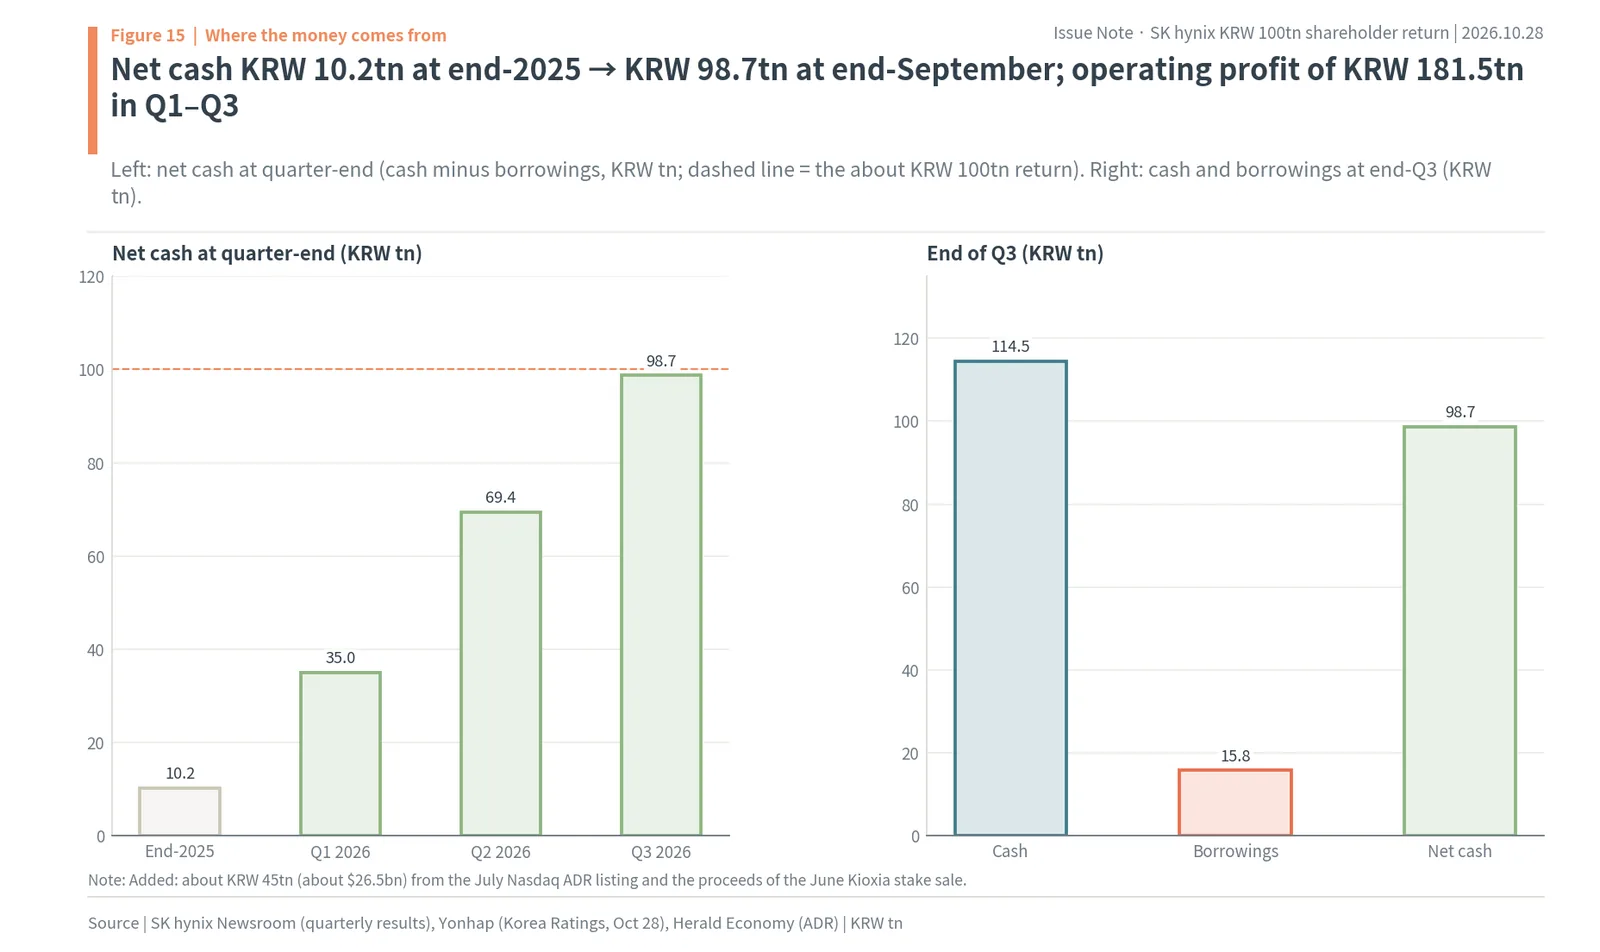
The dashed line on the left of the chart is the roughly KRW 100tn return. Net cash at the end of September reached that line. The right shows cash of KRW 114.5tn and borrowings of KRW 15.8tn at the end of the third quarter. Borrowings fell KRW 2.8tn in one quarter. Two things besides operating profit made net cash pile up so fast. In July the company issued 17.79 million new shares in its Nasdaq ADR listing, raising about KRW 45tn (about $26.5bn), and in June it sold its Kioxia stake. The ADR money has been earmarked for capital spending such as the first fab at the Yongin cluster.
Understanding this sequence shows the nature of the KRW 100tn. The company had already spent KRW 40tn buying its own shares from August through October 21. After spending that, net cash at the end of September was still KRW 98.7tn. The remaining return (fourth-quarter dividends of at least KRW 15.4tn, the KRW 10tn cancellation portion of the new buyback and the remaining KRW 10tn of cancellation) adds up to at least KRW 35.4tn, a little over one third of current net cash (author’s calculation). Fourth-quarter profit will add to that. This is not money borrowed to hand back; it is part of money already earned.
The share price does not pay for even three years of profit
Now to the central question of this report. Even the same KRW 100tn yields different results for the remaining shareholders depending on when, and at what price, it is spent. SK hynix fell from a close of KRW 2,919,000 (about $2,181) on June 22 to KRW 1,341,000 on October 27, and rose to KRW 1,487,000 on October 28. That is 49.1% below the peak. Over the same period quarterly operating profit went from KRW 60.5tn in the second quarter to KRW 83.3tn in the third, 1.38 times. Profit grew while the share price halved. That means the market sees memory profits as near a peak and likely to turn down within a few years. In short, the price is -49.1% from the KRW 2,919k peak on June 22, and market cap is 2.69 years of estimated 2027 operating profit.
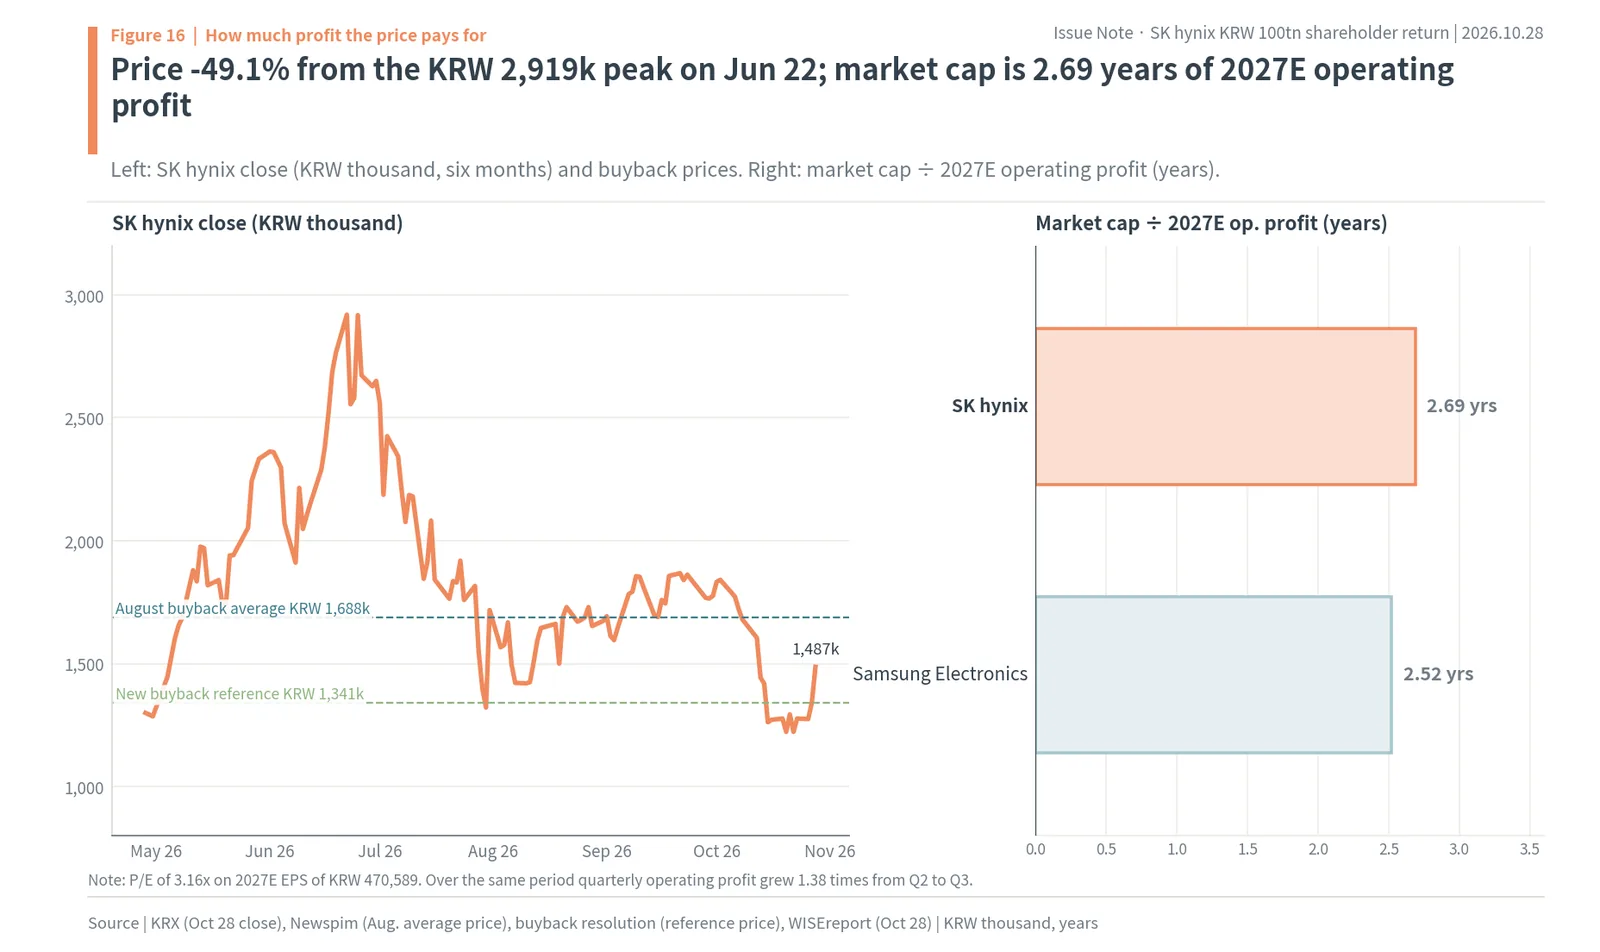
The 2.69 years on the right of the chart is the KRW 1,086.2tn market cap divided by WISEreport’s 2027 operating profit estimate of KRW 403.8tn. Samsung Electronics is similar at 2.52 years. Divided by estimated 2027 earnings per share of KRW 470,589 (about $352), the P/E is 3.16x. Brokers pointed to the same numbers. Daishin Securities analyst Ryu Hyung-geun said the 12-month forward P/E is below 3x, and KB Securities head of research Kim Dong-won called it “an undervaluation phase comparable to past financial crises” (Herald Economy). The company did not hide the same view. Chief financial officer Kim Woo-hyun said on the conference call that the share price is undervalued and does not fully reflect the profit and cash flow the company generates (Newsis, Segye Ilbo). The company is buying its own shares at a price it itself considers cheap.
The same KRW 10tn buys 26% more shares than in August
The KRW 40tn of shares bought in August came to 23,693,272 shares at an average of KRW 1,688,426 (Newspim). The reference price for the buyback set on October 28 is the October 27 close of KRW 1,341,000. KRW 10tn spent at the August average buys 5.923 million shares; at the new reference price it buys 7.457 million. In short, the same KRW 10tn bought 5.92mn shares in August and buys 7.46mn at the new reference price (+25.9%). Even at the October 28 close of KRW 1,487,000 it buys 6.725 million shares, 13.5% more than in August (author’s calculation).
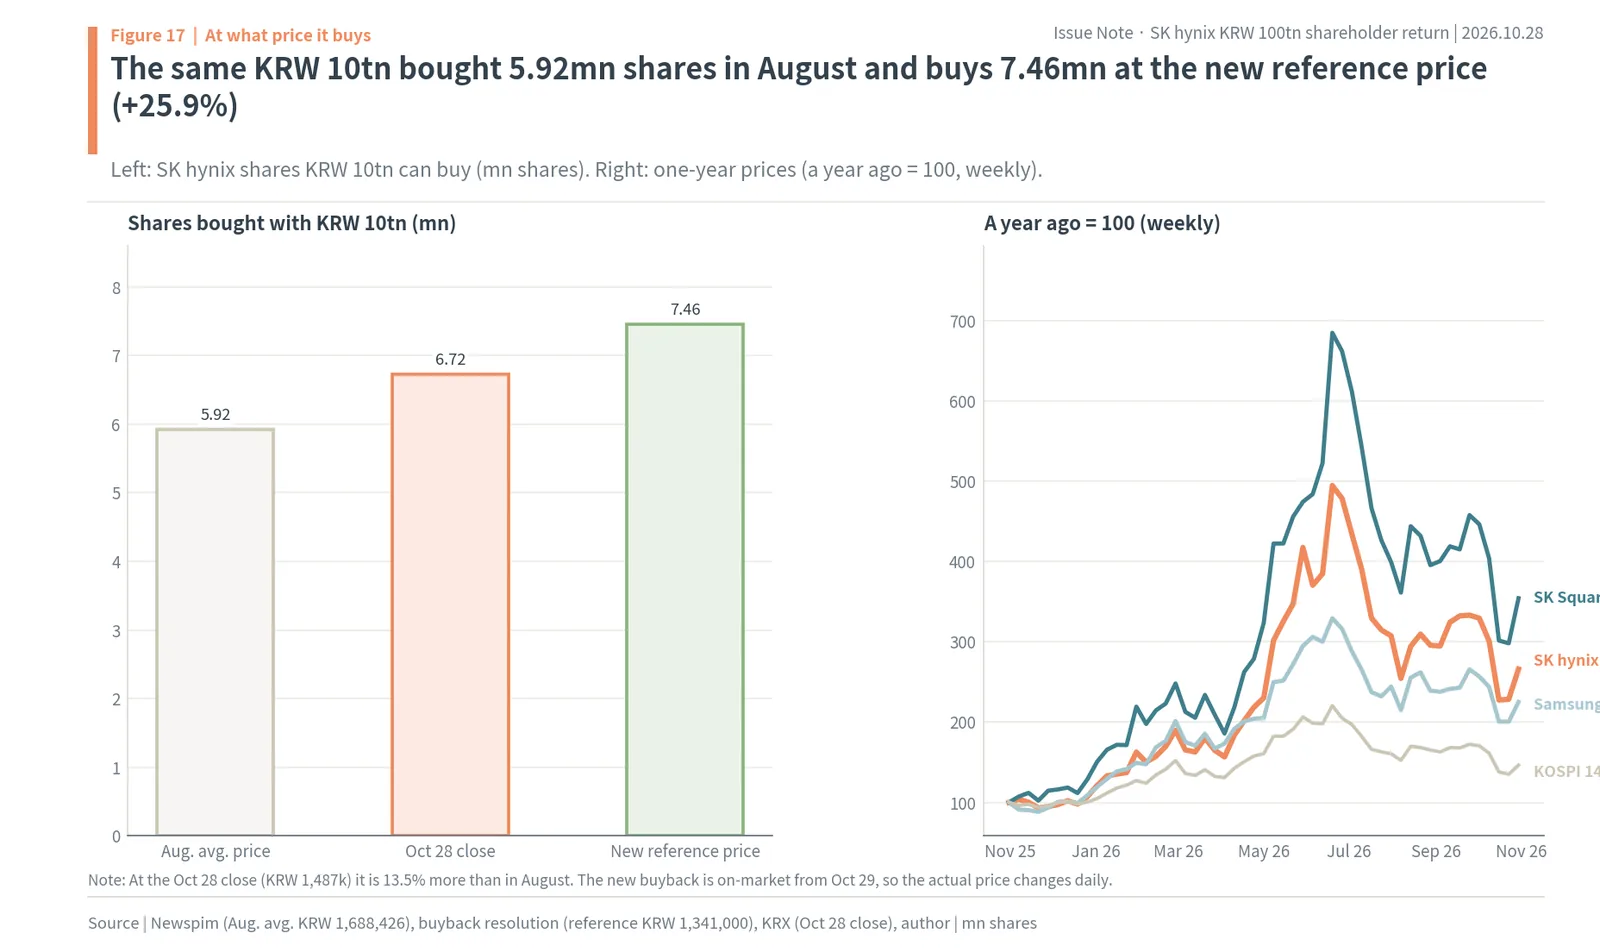
The right chart sets one year of prices to 100 a year ago. SK hynix rose as high as 494.5 in the summer and came down to 266.0, and SK Square, which owns it, traced the same shape (684.6 to 354.2). Along this path the August buyback bought at a high price and the buyback from October on buys at a low one. It costs the company a little over KRW 3tn to buy KRW 1tn of next year’s profit. Buying KRW 1tn of market cap moves the matching KRW 0.306tn of estimated 2027 net profit to owners into the remaining shareholders’ hands (author’s calculation). On this ratio, cancellation puts company money into “a position that returns more than 30% a year.”
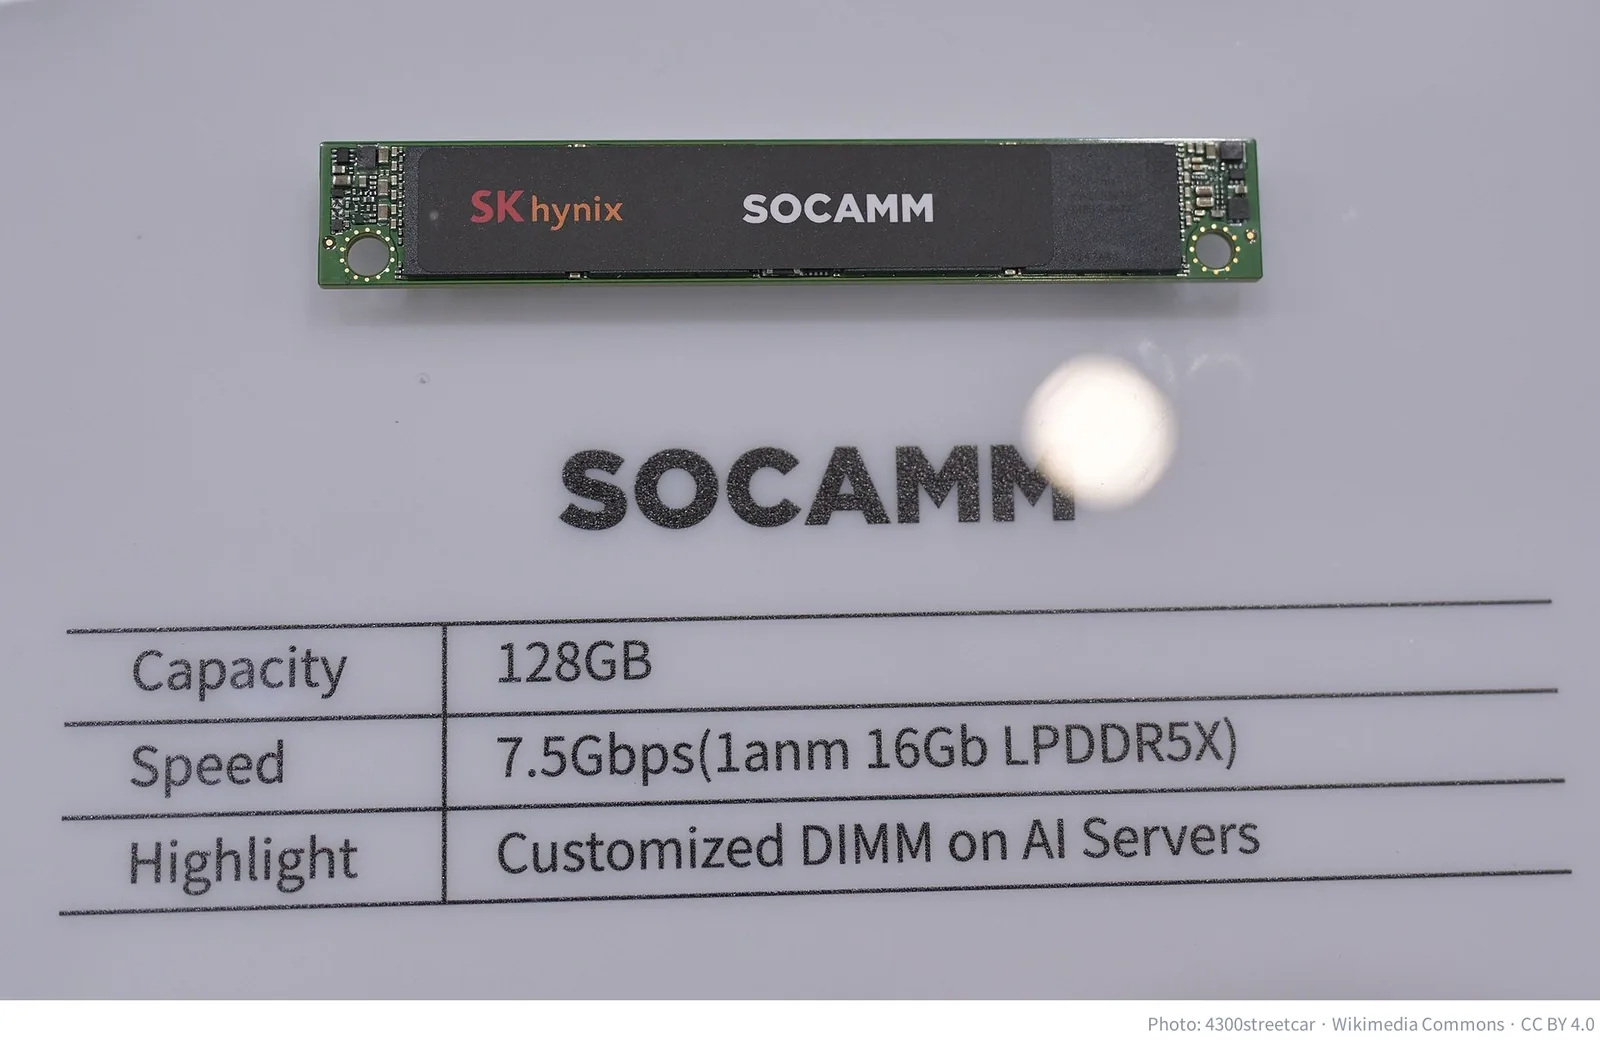
The premise of this calculation is how long the memory SK hynix makes keeps selling into AI servers. If, as the company says, volumes are sold out through 2029, profit could last longer than the 2.7 years the market has priced in, and the value of the shares being bought and retired now grows accordingly.
When the cancellations are done, almost half of one share in ten is gone
The shares that disappear are the 23,693,272 bought in August plus the cancellation portion of the new buyback. Taking half of the new 14.92 million shares as the cancellation portion gives 7.46 million. Together that is 31.15 million shares, 4.26% of the current 730.49 million shares outstanding. After cancellation shares outstanding fall to 699.34 million, and each remaining share’s slice of the company grows 4.45% (author’s calculation). In short, cancelling 31.15mn shares cuts the share count 4.26%, and each remaining share’s slice grows 4.45%. If the remaining KRW 10tn of buybacks, not yet scheduled, is also cancelled, these ratios rise further.
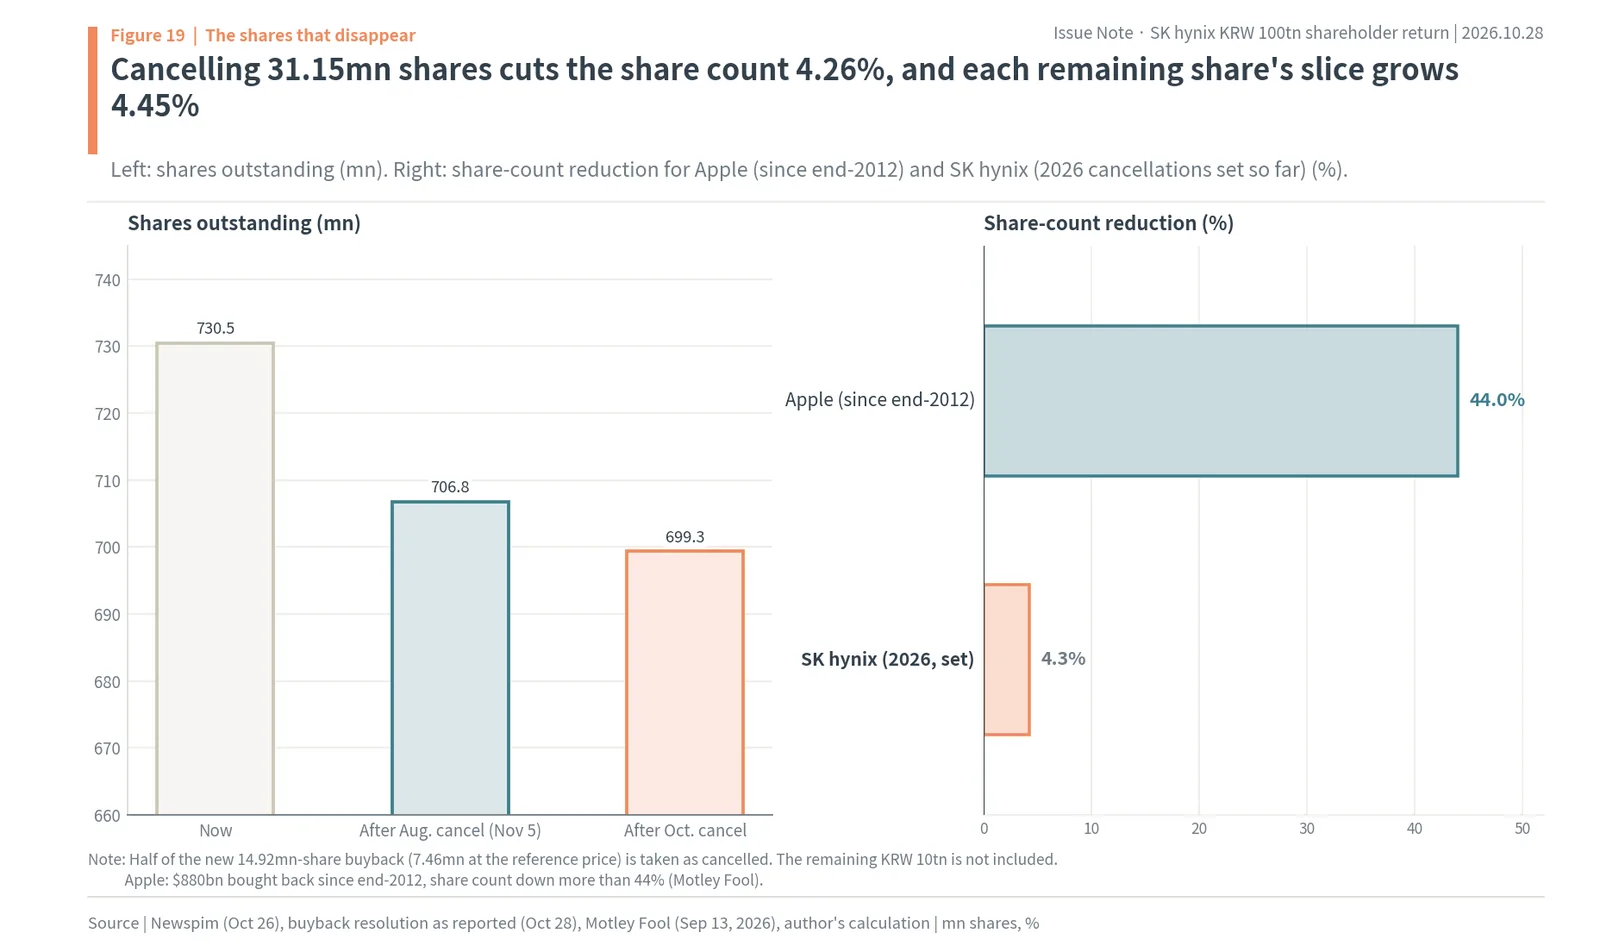
Compared with Apple, this is still the beginning. Apple bought for more than 13 years from the end of 2012 and cut its share count by more than 44%. SK hynix cuts its share count by just over 4% in this one fiscal year. Since the company has said it will keep buying back shares every quarter, how much this number accumulates each year will be the yardstick for an Apple-style compounding.
A hypothetical example: for a 100-share holder, the dividend and the cancellation are about the same size
Suppose an individual with no other financial income holds 100 SK hynix shares. At the October 28 close they are worth about KRW 149mn (about $111,000). This person receives KRW 2,000k (KRW 2mn, about $1,495) as the third-quarter dividend, based on the November 30 record date. Financial income is under KRW 20mn, so after 15.4% is withheld, KRW 1,692k reaches the bank account. The same person’s 100 shares’ slice of estimated 2027 net profit to owners grows from KRW 45,533k before cancellation to KRW 47,561k after, an increase of KRW 2,028k (based on WISEreport’s KRW 332.6tn estimate, author’s calculation). In short, for someone holding 100 shares (about KRW 149mn), the third-quarter dividend is KRW 2,000k and the rise in their slice of 2027E profit from cancellation is KRW 2,028k.
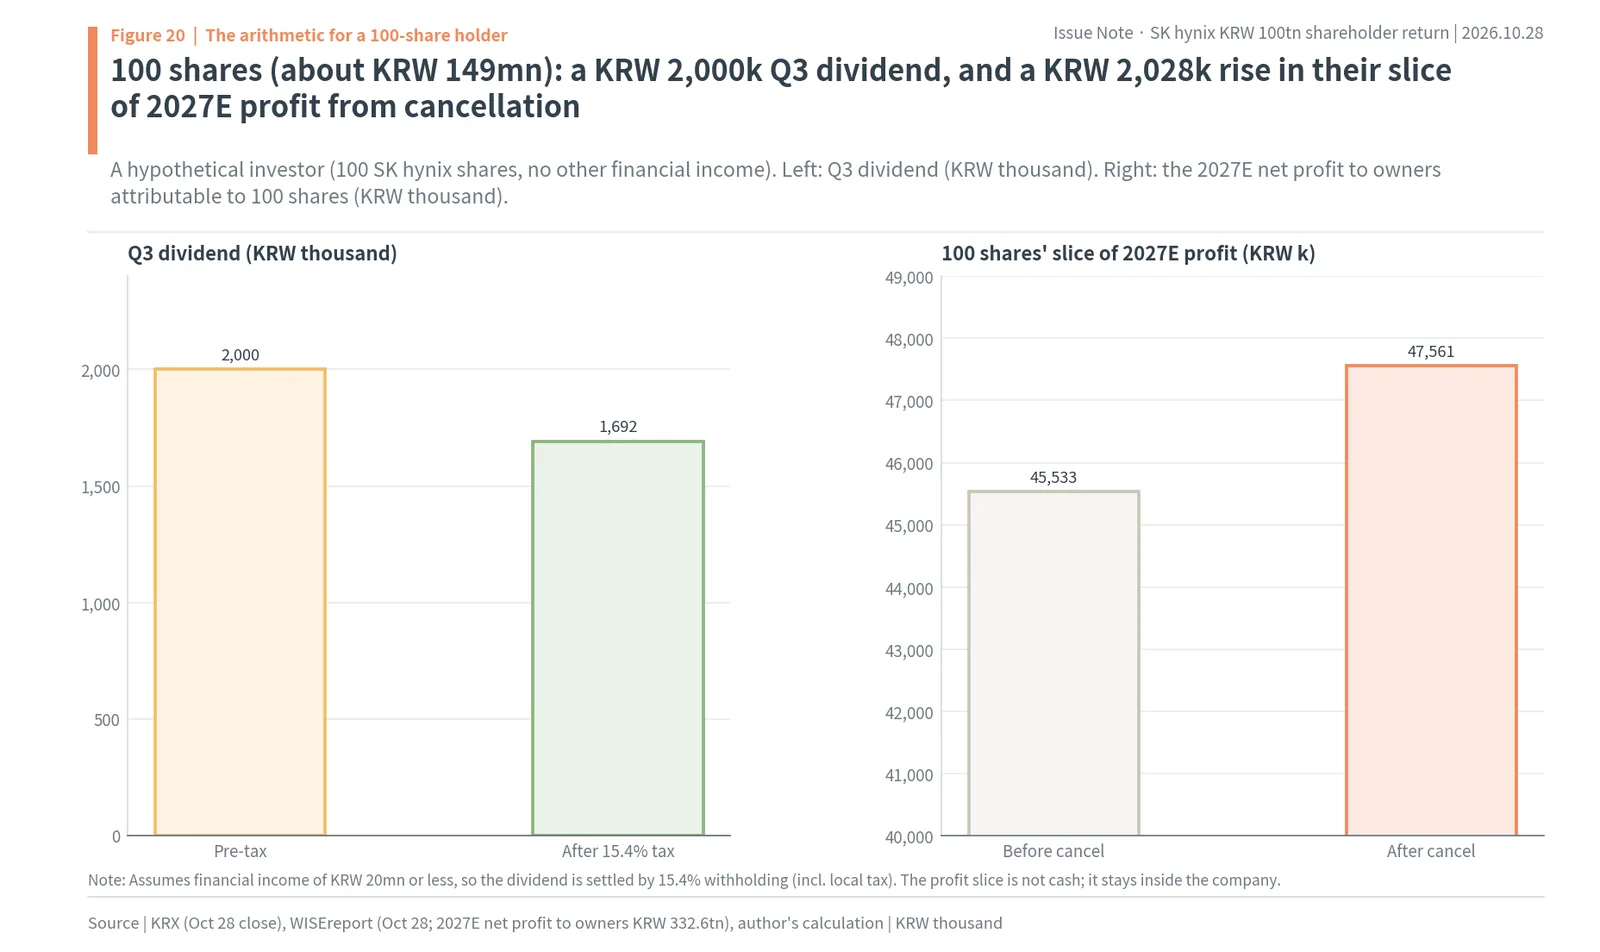
The two numbers are similar but different in kind. The KRW 2,000k dividend is cash that can be spent right away, and it is taxed. The KRW 2,028k added by cancellation is not cash but a slice that builds up inside the company, and it reaches the holder only when the share price reflects that profit. At a time when the share price does not pay for even three years of profit, money the company spends on cancellation builds up, untaxed, in the remaining shareholders’ slice. That is why the author looks at “at what price” before “how much” in this announcement.
The author sees the value of this announcement not in the KRW 100tn size but in the fact that the company is buying and retiring shares while the price is worth less than three years of next year’s profit. The author also judges that the parts of the return not yet set (the fourth-quarter dividend and the remaining buyback) would serve remaining shareholders better if they tilted further toward cancellation than toward dividends. Half of the dividend goes to foreigners and large domestic holders face combined taxation, whereas cancellation enlarges every shareholder’s slice by the same ratio, untaxed.
The KRW 40tn bought in August is worth KRW 35.2tn at today’s price
Looked at from another angle, the price question brings the August buyback into view. From August 20 to October 21 the company spent KRW 40tn buying 23,693,272 shares at an average of KRW 1,688,426. Valued at the October 28 close of KRW 1,487,000, those shares are worth KRW 35.2tn (about $26.3bn), 11.9% below what was paid (author’s calculation). In hindsight the company paid too much.
Still, these shares are cancelled on November 5. The value of cancelled shares vanishes from the books, so it does not remain as a “loss.” What matters to remaining shareholders is the proportion of shares that disappears. The August cancellation alone reduces shares outstanding by 3.24%. The only regret is that the same KRW 40tn spent at prices from October on would have retired more shares. This experience says one thing about the order of the remaining return: it pays remaining shareholders to bring cancellations forward when the share price is cheap relative to profit, and to lean toward dividends when it is dear. The company’s pledge to buy back shares every quarter also has the effect of spreading these price swings evenly over time.
The new buyback runs on the market for three months from October 29. Filling the daily limit of 1,492,000 shares would take just over ten days to buy all 14.92 million shares, but as in August, when the company finished a month ahead of a three-month window, the actual pace is the company’s call. If the share price rises while it buys, the same KRW 10tn buys fewer shares. So the 7.457 million shares (at the reference price) and 6.725 million (at the October 28 close) calculated in this report are an upper bound and a current value; the final number will be confirmed in the result report at the end of January.
Measured again by earnings per share, the P/E is just over 3x
Translating the effect of cancellation into earnings per share gives a more familiar number. WISEreport’s estimate of 2027 earnings per share is KRW 470,589. That estimate is based on the current share count. When cancellation is done and each remaining share’s slice is 4.45% larger, the same net profit gives earnings per share of KRW 491,530 (author’s calculation). Divided by the October 28 close of KRW 1,487,000, the P/E falls from 3.16x to 3.03x. If the remaining KRW 10tn of buybacks, not yet scheduled, is cancelled as well, it falls a little further.
A P/E of 3 means someone who bought the whole company at today’s price would earn back the price in net profit in just over three years. It is low even against reports that the Korean market’s overall 12-month forward P/E is a little over 4x, or 4.95x on an MSCI basis (Electronic Times, October 25; Korea Economic Daily, October 27). The company earning the largest profit in Korea is valued below the Korean market average. The reason the market cites is doubt about how long the profit will last, and the company’s answer is long-term supply agreements and shareholder returns.
This number ties into the October 28 move as well. That day SK hynix’s market cap rose KRW 106.7tn, 3.1 times the KRW 34.1tn newly approved by the board on October 28. A gain far larger than the money newly pledged suggests the market may have read this announcement not as a one-time dividend but as a framework for returns that will continue. The cause of a share price move cannot be pinned to one thing, but two facts stood side by side that day: results 8.3% above expectations, and a return framework changed to “buybacks every quarter.”
Even so, value added in a day can disappear in a day. What this report tries to see through calculation rather than the share price is how much cancellation enlarges the remaining shareholders’ slice. That slice is set by the number of shares the company actually buys and retires, confirmed in the result report on the new buyback at the end of January and in the 2027 cancellation filings. When and how far the share price reflects that slice is the next question.
At the 2018 peak the money went to investment; in 2026 it goes to shareholders
Where a memory maker spends what it earns at a peak is not a new question. At the last big peak, in 2018, SK hynix’s operating profit was KRW 20.8438tn with a 52% margin (company newsroom, January 2019). That year it invested KRW 17tn and paid a KRW 1,500 dividend per share. When the cycle turned the next year, investment was cut to KRW 12.7tn (Dealsite). Measured against operating profit, 81.6% went into investment in 2018. In 2026, 38.1% of the estimated operating profit of KRW 262.7tn goes back to shareholders. In short, in 2018, 81.6% of KRW 20.8tn of operating profit went to investment; in 2026, 38.1% of estimated operating profit goes to shareholders.
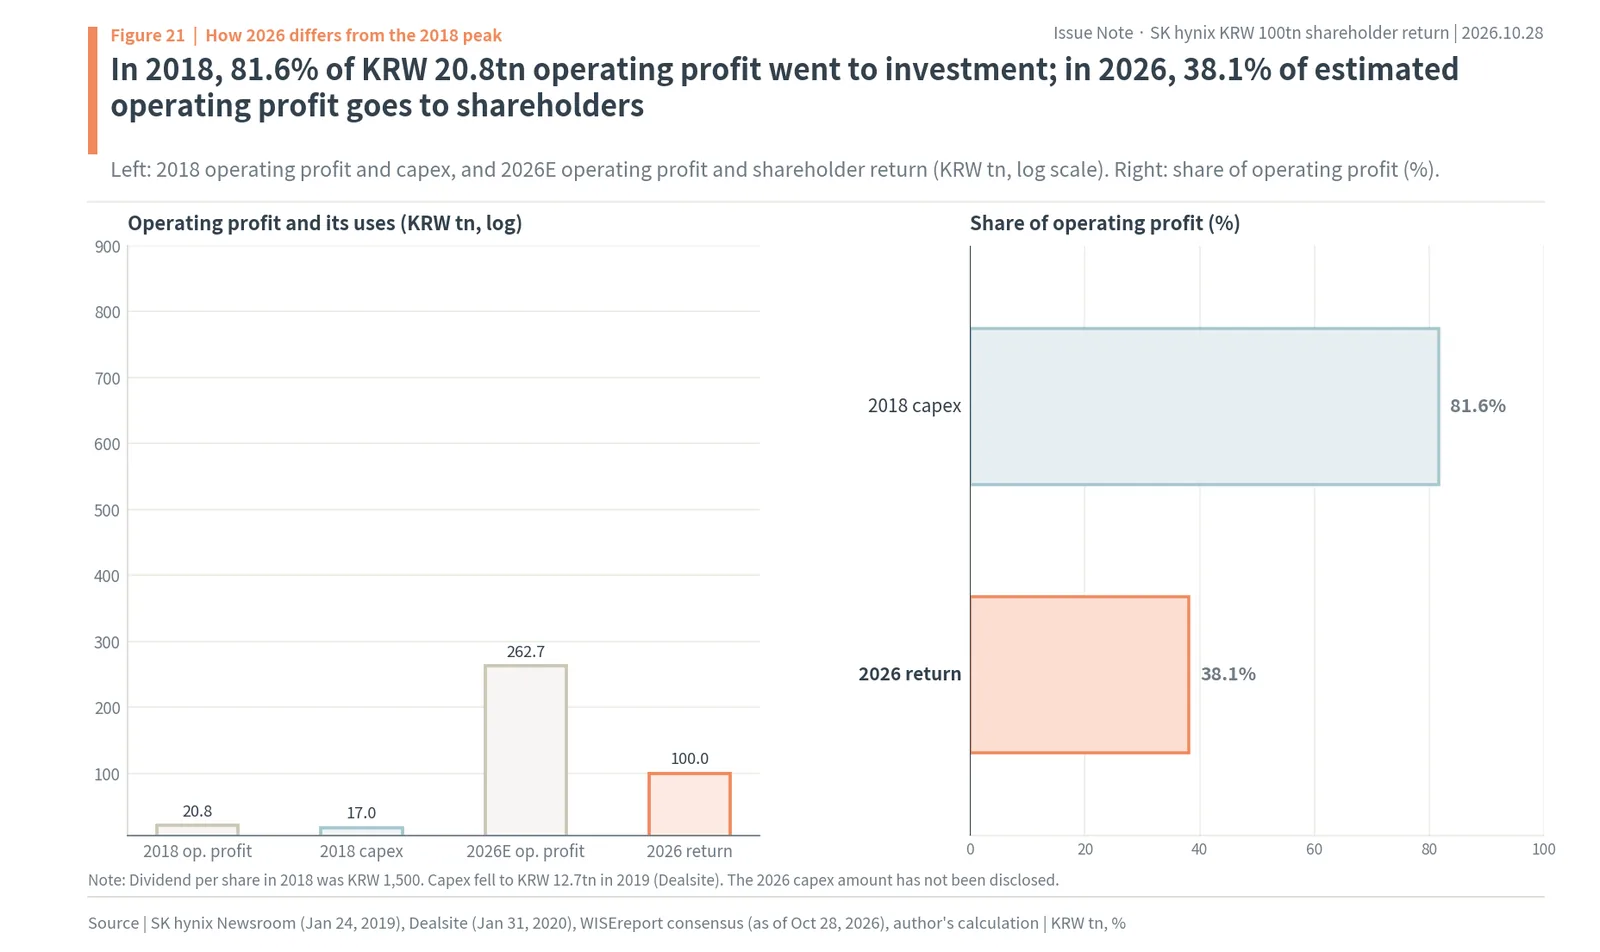
The 2026 investment amount has not been disclosed. The company said only that investment next year will rise sharply from this year and that it will adjust the size and timing flexibly to demand, competitiveness and profitability. So the two years cannot be compared side by side on an investment ratio. The direction is clear, though. In 2018 SK hynix put most of what it earned back into factories and returned little to shareholders. In 2026 SK hynix is raising factory investment while returning more than a third of operating profit to shareholders. It is a choice made possible because the scale of profit has changed so much.
Can the same size be repeated next year?
Whether the return ends after one year depends on next year’s profit. WISEreport’s operating profit estimates are KRW 262.7tn for 2026, KRW 403.8tn (about $301.7bn) for 2027 and KRW 434.2tn for 2028. The 2027 free cash flow (FCF) forecasts compiled by Hankook Ilbo from 10 brokers are KRW 304tn for SK hynix and KRW 378tn for Samsung Electronics. In short, operating profit estimates rise from KRW 262.7tn in 2026 to KRW 403.8tn in 2027, and the 2027 FCF forecast is KRW 304tn.
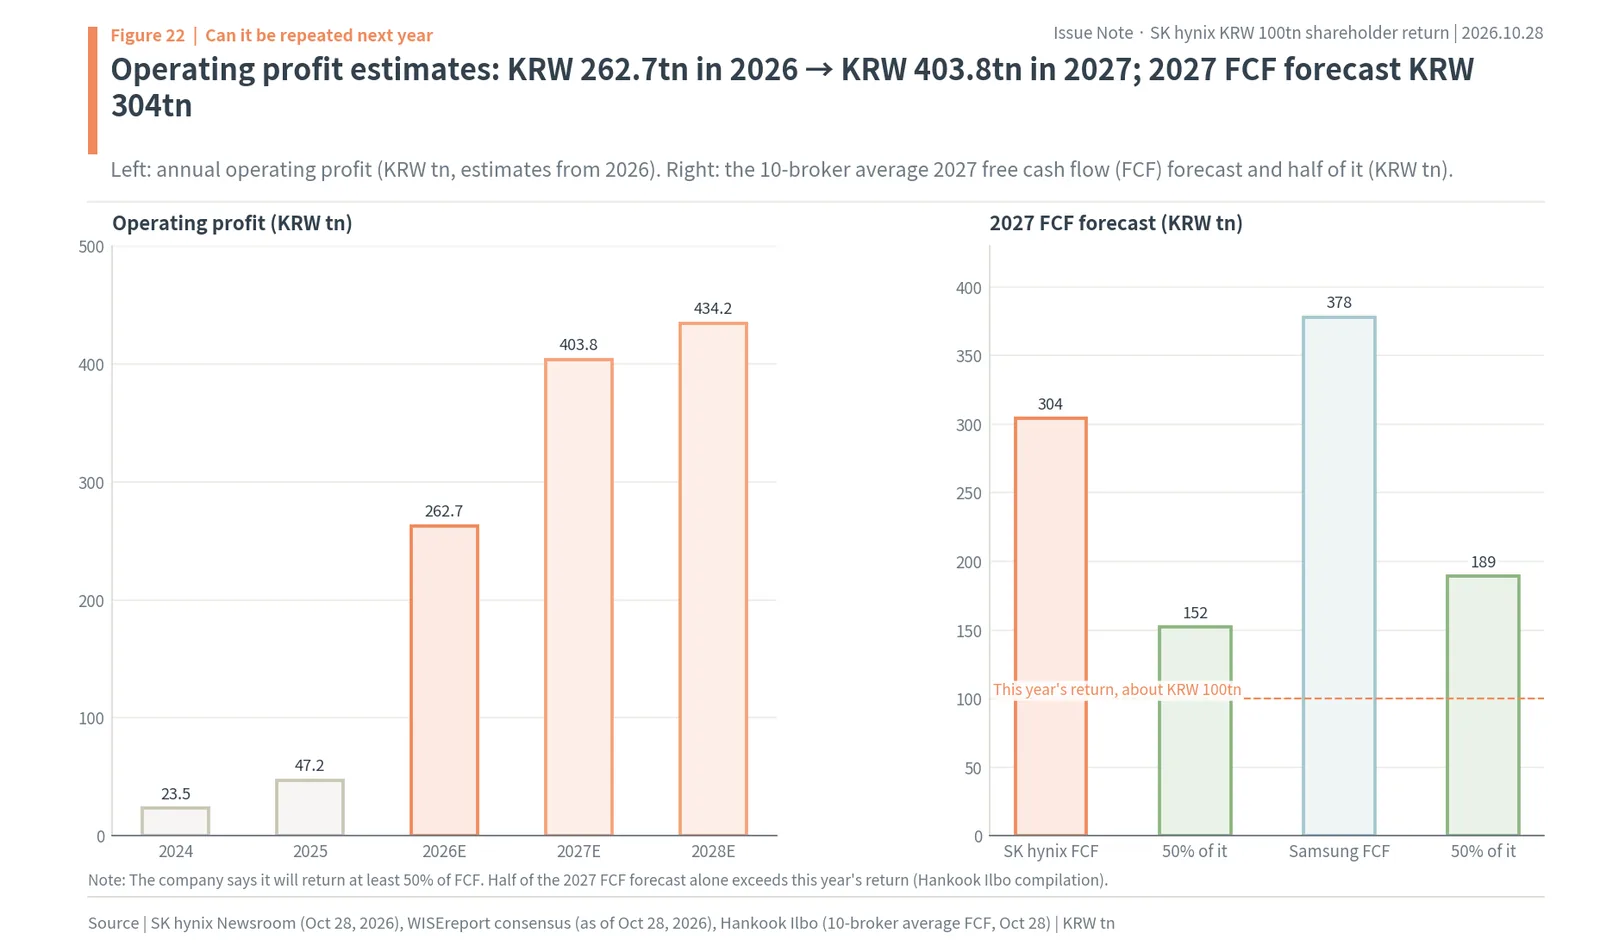
The company said it will return at least 50% of FCF. Half of the 2027 FCF forecast of KRW 304tn is KRW 152tn, more than this year’s roughly KRW 100tn. Half of Samsung Electronics’ KRW 378tn is KRW 189tn. If both companies keep the same principle, more than KRW 340tn could go back to shareholders in 2027 alone (Hankook Ilbo). This calculation of course assumes memory prices move as currently estimated. TrendForce expected fourth-quarter contract prices for commodity DRAM to rise 10% to 15% from the previous quarter (September 30), with the increases shrinking from about 80% in the second quarter and about 40% in the third (October 20). For profit to grow this much while price increases shrink, volumes have to carry it, and the long-term supply agreements the company described (more than half of 2027 and 2028 capacity) are that support.
Memory prices and volumes hold up the floor under the return
Returns beyond next year come down to how much memory the company sells and at what price. The numbers the company gave on the conference call are these. In the third quarter average selling prices rose in the high 20% range for DRAM and in the mid-20% range for NAND from the previous quarter. For the fourth quarter it expects DRAM shipments to rise in the mid-20% range and NAND shipments in the mid-single digits. It put 2027 demand growth at the mid-20% range for DRAM and the high teens for NAND, and said tight supply of HBM and DRAM will last until 2030 (TheElec conference-call transcript). The M15X plant in Cheongju runs at full capacity by year-end.
Market research numbers point the same way. On September 30 TrendForce expected fourth-quarter contract prices to rise 10% to 15% from the previous quarter for commodity DRAM and 15% to 20% for NAND. On October 20 it put the fourth-quarter DRAM contract price increase at about 20%, noting that increases were shrinking from about 80% in the second quarter and about 40% in the third. Prices keep rising, but more slowly.
Linked to the return, these numbers come to this. In a phase where price increases are shrinking, profit can keep growing only if volumes rise. That long-term supply agreements with 14 major customers cover more than half of 2027 and 2028 capacity means more than half of those volumes are already settled. Next year’s HBM volume and price talks are also finished. So the 2027 operating profit estimate of KRW 403.8tn is a number largely supported by volumes alone, even if prices rise no further. The principle of returning at least 50% of FCF stands on this.
Seen the other way, this is also where the market’s worry, built into the share price, lies. A market cap of 2.69 years of estimated 2027 operating profit means the market sees a correspondingly large chance that profit falls sharply from 2028 on. If the company is right that it is sold out through 2029 and supply stays tight through 2030, today’s price sets the length of profit too short. The bigger that gap, the more each share the company buys and retires now is worth. This is where the author’s reason for looking at “at what price” first is confirmed once more.
Samsung Electronics faces the same question tomorrow
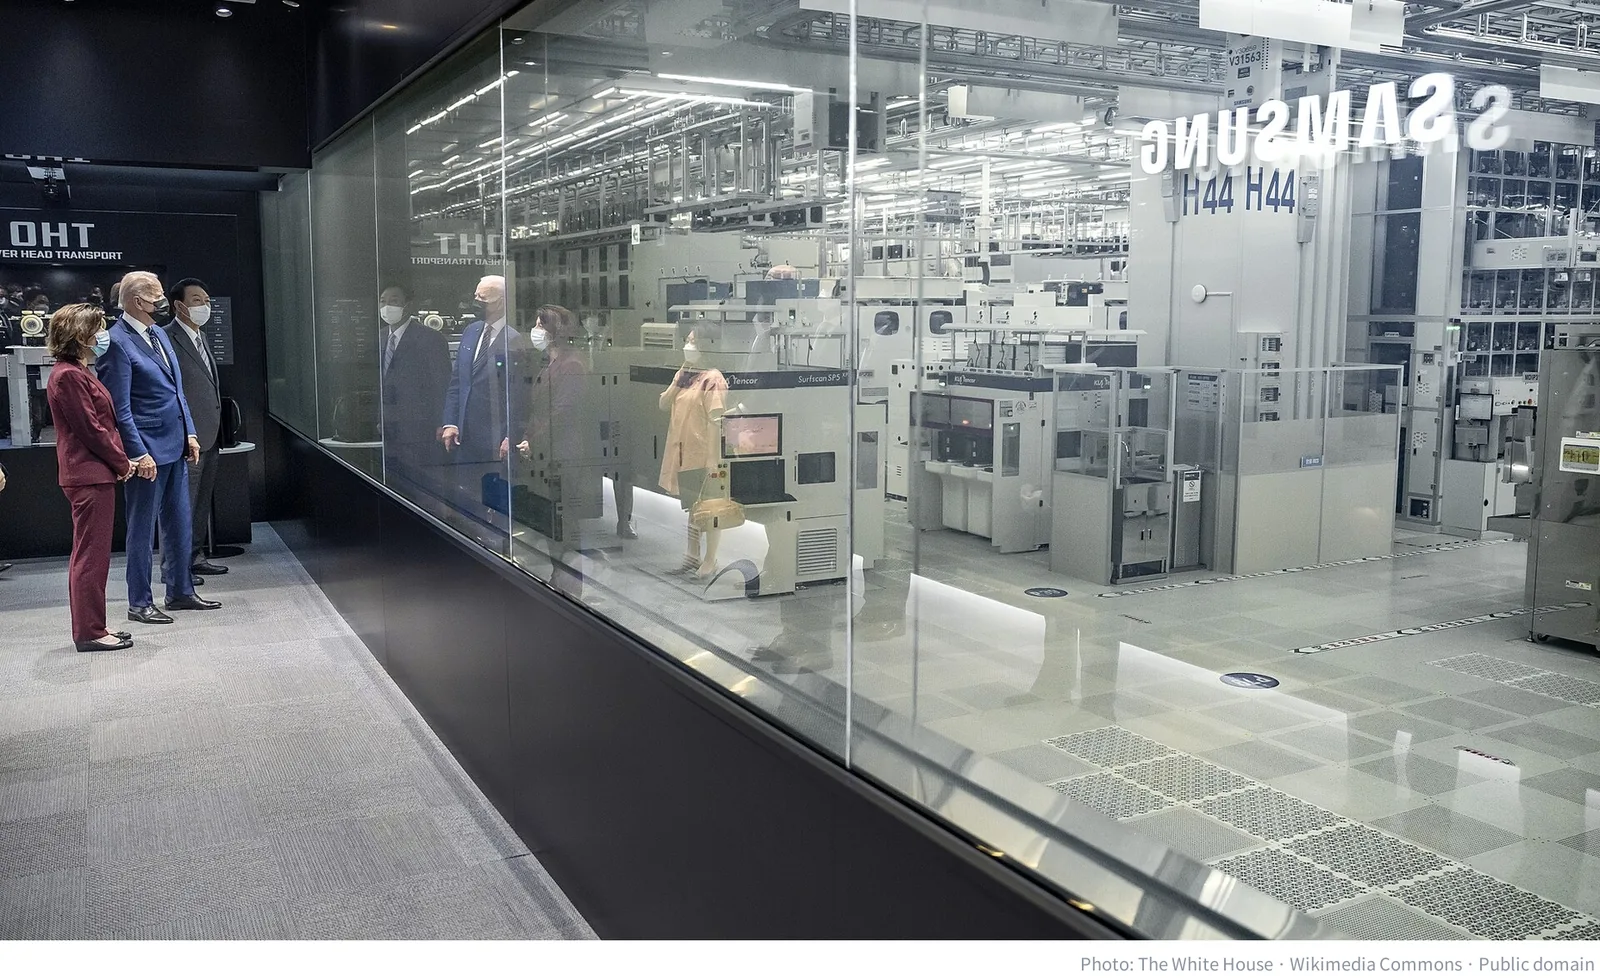
Samsung Electronics, which runs the Pyeongtaek semiconductor campus, announces final third-quarter results on October 29. Its preliminary operating profit was KRW 107.4tn. Samsung’s board already previewed a 2026 shareholder return of KRW 90tn to 110tn on August 21, and at this board meeting it is expected to set a third-quarter cash dividend of about KRW 30tn (Korea Economic Daily, Financial News). The remaining KRW 60tn to 80tn will be split between dividends and buybacks for cancellation at a board meeting in late January 2027. In short, Samsung Electronics previewed a KRW 90tn to 110tn 2026 return, and about KRW 30tn of third-quarter dividend comes with final results on October 29.
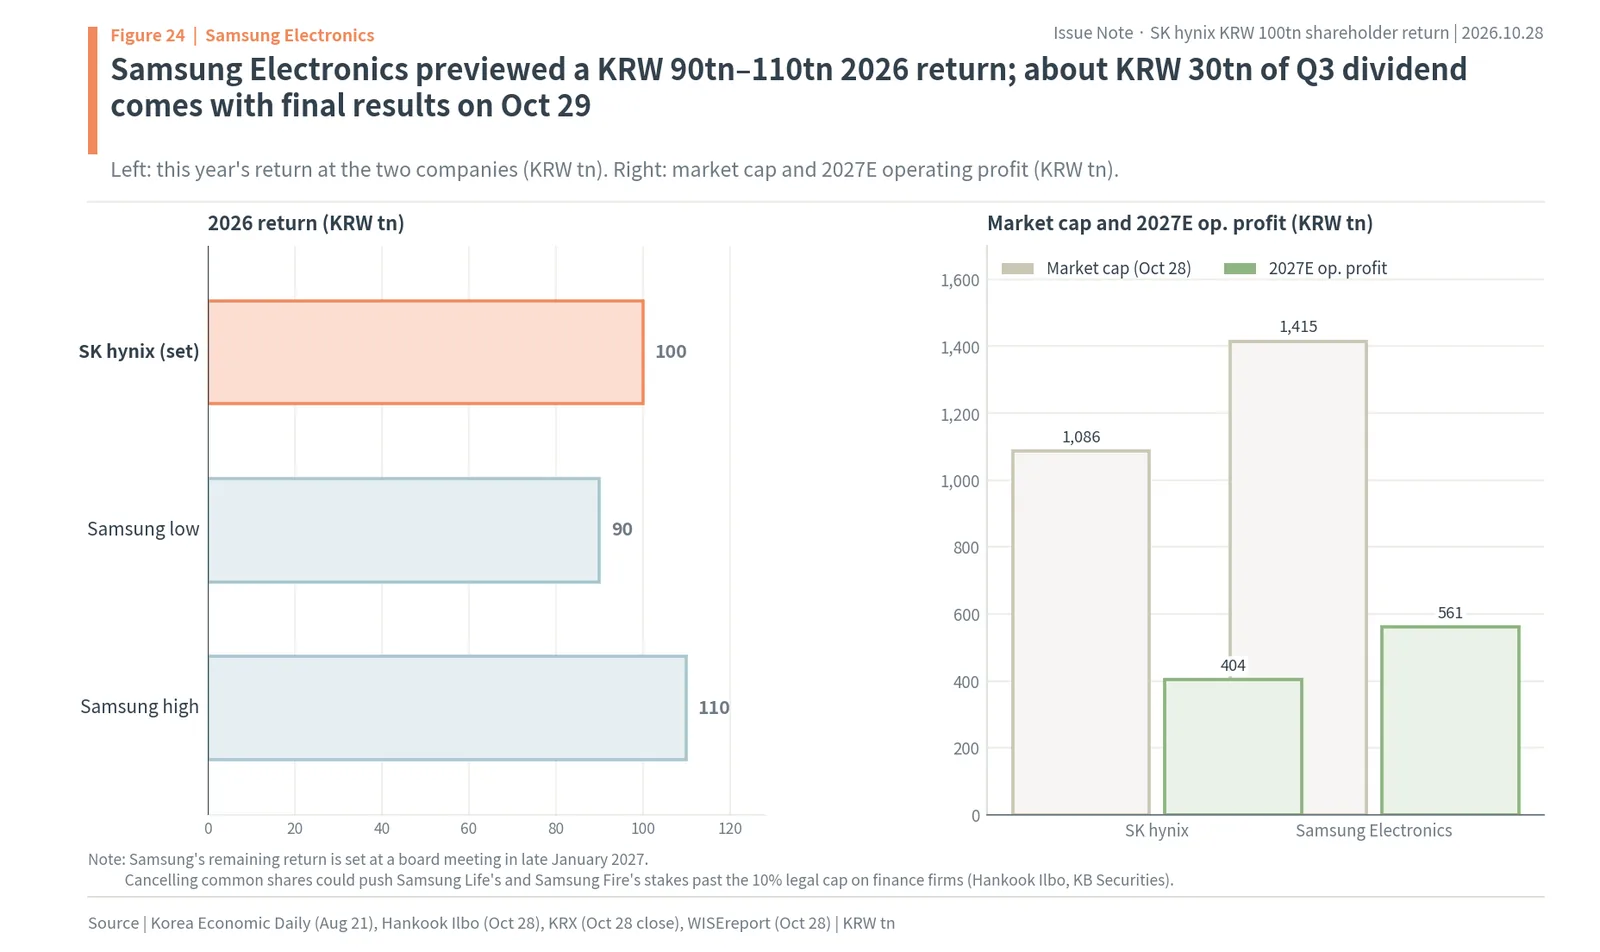
As the right of the chart shows, the two companies are valued similarly too. Market caps are KRW 1,086tn for SK hynix and KRW 1,415tn for Samsung Electronics (about $1,057bn), and estimated 2027 operating profits are KRW 404tn and KRW 561tn. Samsung has a constraint that SK hynix lacks. Cancelling a large number of common shares reduces shares outstanding, raising Samsung Life’s and Samsung Fire & Marine’s stakes in Samsung Electronics, which could cross the line in Korea’s financial-industry structure law that bars financial companies from owning more than 10% of a non-financial affiliate (Hankook Ilbo, KB Securities). KB Securities expects that if the remaining budget is KRW 110tn, it will be split into about KRW 70tn of cash dividends and KRW 40tn of cancellation. It is a structure that has to lean toward dividends over cancellation. Samsung Life’s 8.82% gain that day sits on this link.
Affected sectors and stocks
The stocks this announcement touches directly fall into four groups. The first is SK hynix itself. The return schedule becomes a supply-and-demand schedule. From October 29 to January 28, 2027, a buyer that takes up to 1,492,000 shares a day enters the market. Average daily volume over the last 20 trading days was 3.5 million shares, so the daily limit equals 42.6% of average volume (author’s calculation). The second is SK Square and SK Inc. Just over KRW 6tn of dividends flows into SK Square, and cancellation raises its stake. How much of the dividend SK Square passes down to its own shareholders is the key to narrowing the holding-company discount (44.1%). The third is Samsung Electronics and Samsung Life and Samsung Fire. Whether Samsung’s return leans toward cancellation, and how it resolves the 10% constraint, connects to the two insurers’ share prices. The fourth is the brokers handling the trades. The new buyback goes through SK Securities and NH Investment & Securities, but the commissions are small relative to the size of those companies and hard to see as a link that moves their share prices.
The link to memory equipment and materials companies comes from the investment plan rather than this announcement. The company said only that investment will rise sharply next year and gave no amount. The signal that more returns do not mean less investment will be confirmed by the 2027 investment figure the company gives at its January results.
The case against, and what the numbers say
The arguments against this announcement were also checked in the original sources. Seoul Finance wrote that large-scale returns could strain the balance with R&D and capital spending, and that profitability could be hurt if big tech investment slows or memory supply rises (October 28). Announcing a return more than twice the size of the roughly KRW 45tn raised through ADRs in July, just three months later, can also look like an awkward order of events.
By the numbers, this worry is small. First, KRW 40tn of the KRW 100tn has already been spent, and net cash at the end of September was still KRW 98.7tn. The remaining return of at least KRW 35.4tn is a little over a third of net cash. Second, returning just half of the 2027 FCF forecast of KRW 304tn would be KRW 152tn, so brokers calculate there is room for returns even after a big rise in investment. Third, the company said it will adjust investment size and timing flexibly, and the remaining KRW 10tn of buybacks has no set timing. The structure leaves room to cut if the cycle turns. Fourth, the ADR money is earmarked for capital spending, while the return is funded by operating profit and the Kioxia sale proceeds. Weighing these points, the author sees this return not as a decision that eats into investment capacity but as the result of profit having grown so large that the company can do both.
Six signals to watch
The signals that would confirm or shake the view above are set out as six gauges. Each needle shows the value as of October 28. The six are return size, cancellation share, years priced in, payout ratio, foreigners and Samsung Electronics. Return size is already large at 9.2% of market cap. The cancellation share is at least KRW 60tn of the KRW 100tn, two thirds. Years priced in (market cap ÷ estimated 2027 operating profit) is 2.69 years; the lower it is, the more profit the same money buys. The payout ratio is 11.7%, below the 25% separate-taxation threshold. Foreigners bought a net KRW 380.1bn of SK hynix on October 28, changing direction after a month of net selling. Samsung Electronics is still at the preview stage.
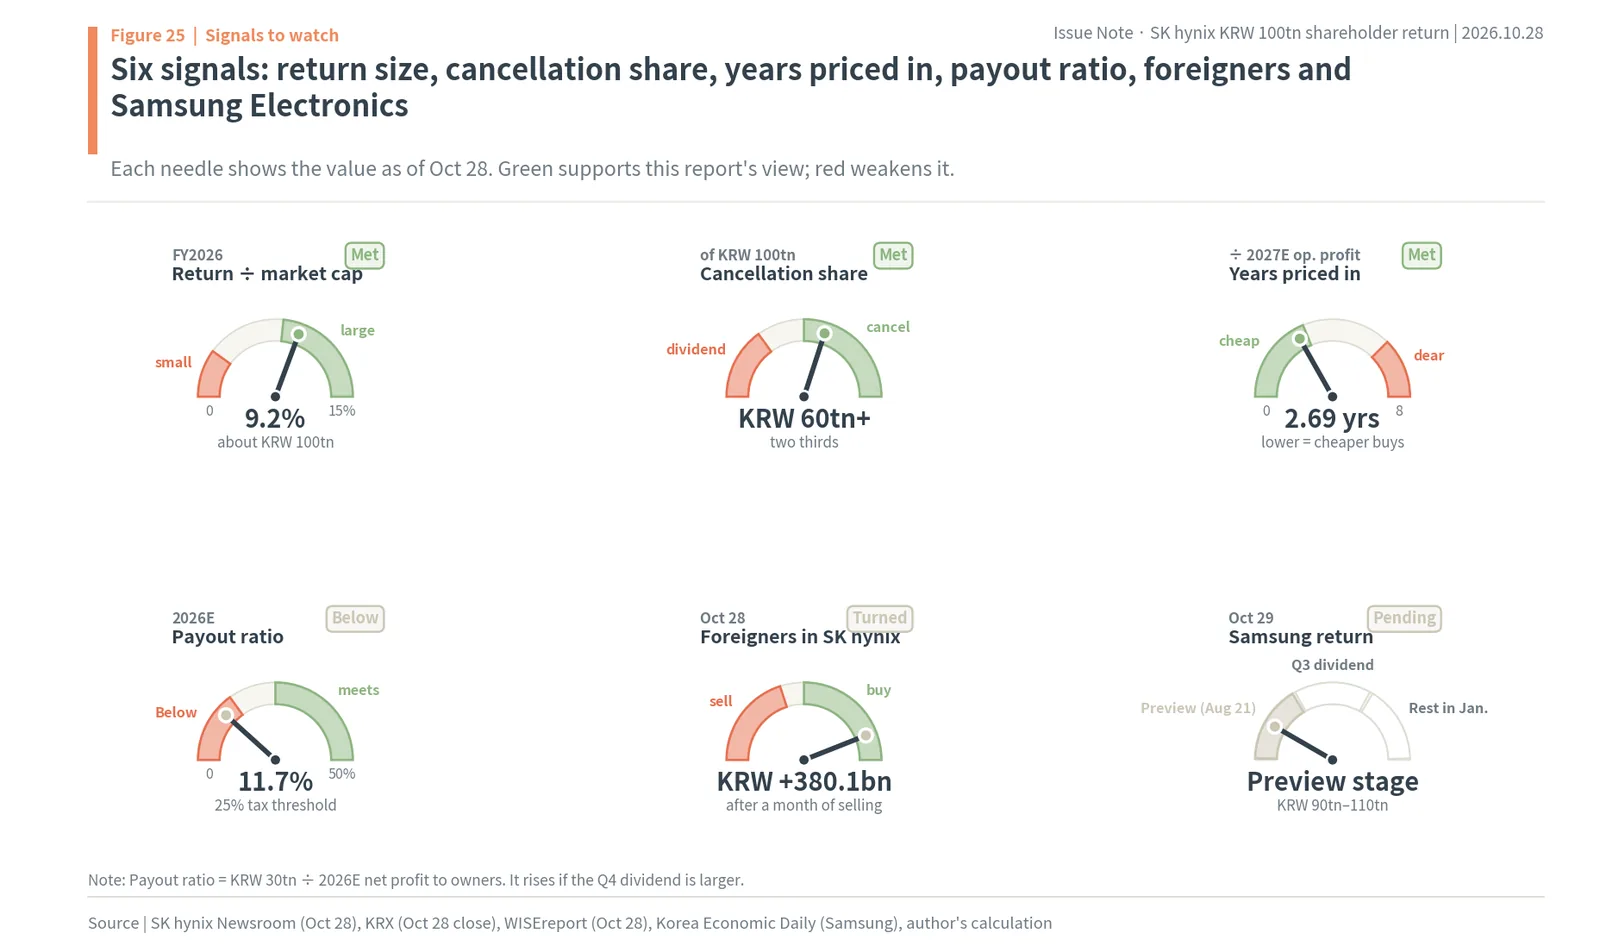
Of these, the needles likely to move first are foreigners and Samsung Electronics. Whether foreigners keep buying ahead of the November 30 record date or sell again after the dividend will show whether this return is read as a one-off dividend event or a long-term cancellation policy. Samsung Electronics sets its third-quarter dividend on October 29 and the rest in late January. The years-priced-in needle moves with where the share price trades while the company buys back shares.
Dates to watch
On October 29 SK hynix starts its new buyback, and Samsung Electronics announces final third-quarter results and its dividend. On November 5 the 23.69 million shares bought in August are cancelled. On November 11 MSCI announces its November index review, which takes effect with trading on November 30. To receive the third-quarter dividend, investors must buy by November 26; the record date is November 30. The U.S. Federal Reserve’s next meeting is December 8 and 9. In short: October 29 buyback starts and Samsung results, November 5 cancellation, November 26 last day to buy, November 30 record date.
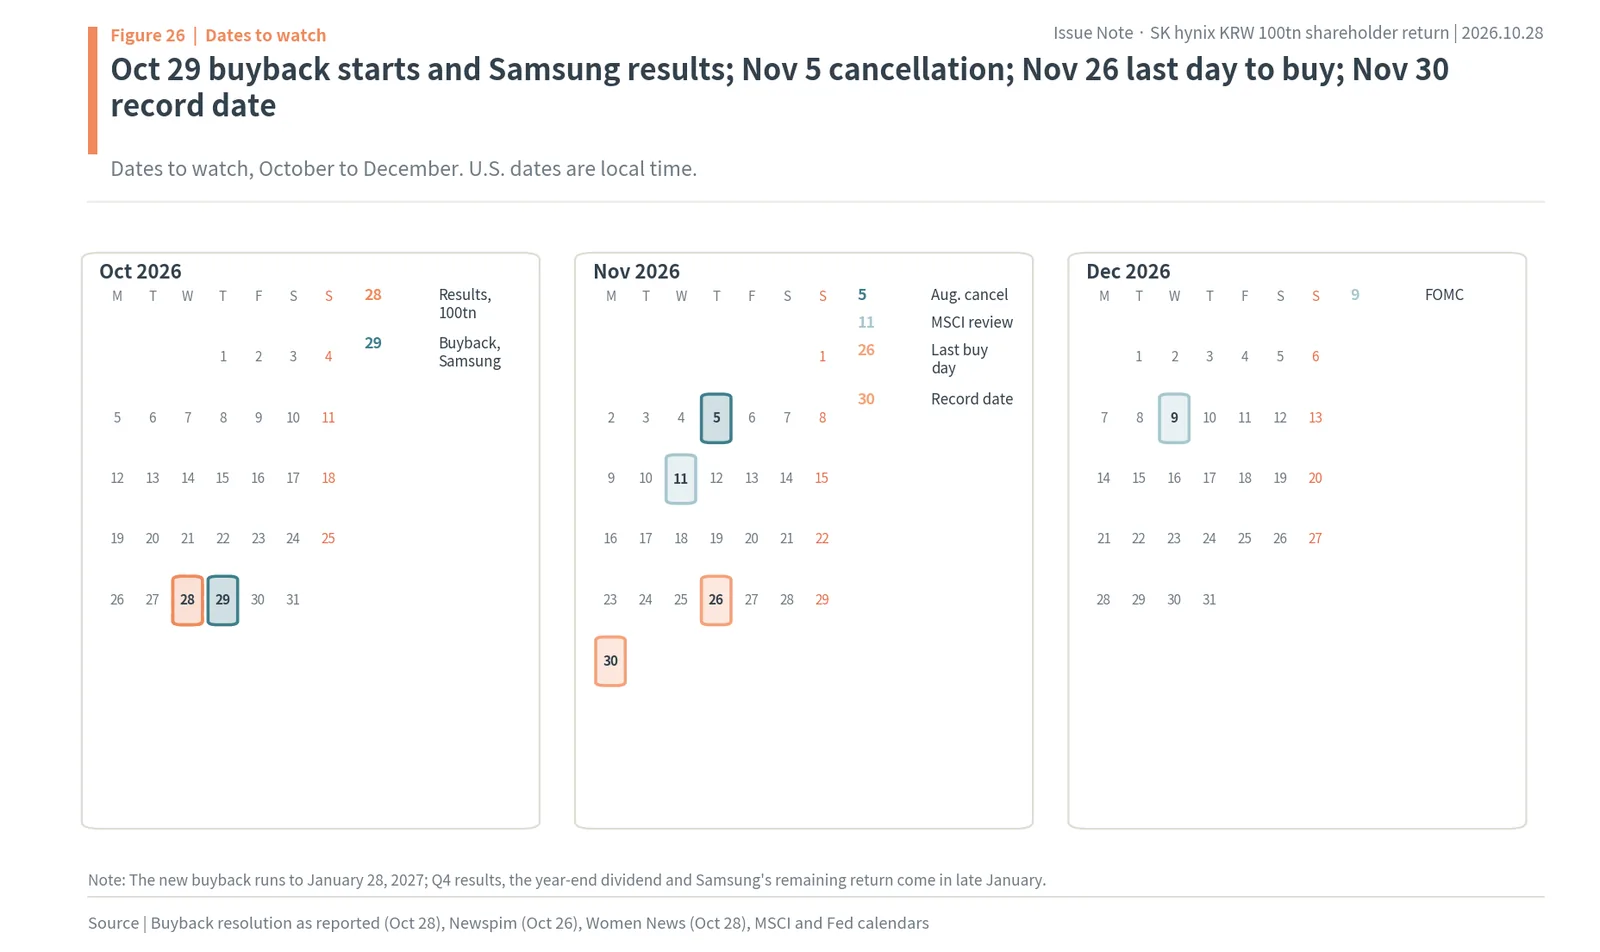
Beyond the calendar, the new buyback period ends on January 28, 2027, and SK hynix’s fourth-quarter results and year-end dividend come in late January, together with Samsung Electronics’ decision on the rest of its return. Three numbers matter then: how far the fourth-quarter dividend exceeds KRW 15.4tn, the timing of the remaining KRW 10tn buyback, and the 2027 investment amount. Once those three are out, it will be possible to confirm in numbers which way the balance between “how much” and “at what price” has tipped.
Common questions: eight things that are easy to misread about the KRW 100tn
This section regroups the numbers above as questions. It makes no new claims.
The first question is by when to buy to receive the third-quarter dividend. The record date is November 30, and since trades settle two days after purchase, shares must be bought by November 26. The dividend is KRW 20,000 per share and is paid within a month of the record date. The payment date was not stated separately in the filing.
The second is whether the KRW 100tn is all new money this year. It is not. It already includes about KRW 0.5tn of first- and second-quarter dividends and the KRW 40tn buyback approved in August and completed by October 21. What the board newly set on October 28 is the KRW 14.1tn third-quarter dividend and the KRW 20tn new buyback, and the roughly KRW 10tn of that for employee pay is not in the KRW 100tn. What remains is at least KRW 15.4tn of dividends from the fourth quarter on and about KRW 10tn of buybacks with no set timing.
The third is whether the Kioxia special dividend comes again next year. The Kioxia sale was a one-time event, so a special dividend of the same size will not repeat every year. The company said it will pay most of the Kioxia gain through the third-quarter and year-end dividends. How much goes into the year-end dividend will be known in late January.
The fourth is whether the dividend qualifies for separate taxation. On current numbers, it is unlikely. KRW 30tn of dividends is 11.7% of WISEreport’s estimated 2026 net profit to owners, short of the high-dividend company test (a payout ratio of 25% or more with dividends up at least 10%, or 40% or more). If the fourth-quarter dividend rises enough to take the year’s total above KRW 64tn, it would meet the test. Individuals with financial income of KRW 20mn or less a year are done with 15.4% withholding either way.
The fifth is whether the buyback lifts the share price. This report does not say whether the price will rise. Two things can be calculated: the company becomes a buyer of up to 1,492,000 shares a day, and once cancellation is done, each remaining share’s slice of profit grows 4.45%.
The sixth is whether Samsung Electronics will return money the same way. Samsung previewed KRW 90tn to 110tn for 2026 but will set the structure in late January. Cancelling many common shares could push Samsung Life’s and Samsung Fire’s stakes above the 10% legal limit, so the dividend share may be larger than at SK hynix (KB Securities estimate).
The seventh is whether the KRW 10tn employee-pay buyback hurts shareholders. About KRW 10tn of company cash goes out but the share count does not fall, so that money does not enlarge shareholders’ slice. At the reference price it is 7.46 million shares, 1.02% of shares outstanding. On the other hand, if it replaces cash bonuses with shares, it turns labor costs the company would pay anyway into shares. The company kept the accounting clear by leaving this portion out of the KRW 100tn.
The eighth is how many retail shareholders there are and whether the August buyback lost money. At the end of June SK hynix had 3,461,526 retail shareholders, 5.1 times the 681,671 of a year earlier (Economist Korea). Most of them receive less than KRW 20mn of dividends a year and are done with 15.4% withholding; on October 28 retail investors sold a net KRW 606.5bn of SK hynix. The 23.69 million shares bought in August at an average of KRW 1,688,426 are worth KRW 35.2tn at the October 28 close, 11.9% below cost, but they are cancelled on November 5, so no loss stays on the books; the remaining shareholders keep only the effect of 3.24% of shares disappearing.
Basis of calculation: how the company announcement, KRX closes, ownership and WISEreport estimates were joined
This section sets out where the report’s numbers came from and how they were calculated.
Results and return figures come from the SK hynix Newsroom’s third-quarter 2026 results release (October 28) and press reports of the same day’s filings. Dividing the total third-quarter dividend of KRW 14,103,466,480,000 by KRW 20,000 per share gives 705,173,324 shares, exactly the 730,492,365 shares outstanding minus 25,319,041 treasury shares. This share count was used to calculate the Kioxia special dividend (KRW 10,000 × 705.17 million shares = KRW 7.05tn). The KRW 15.4tn of dividends from the fourth quarter on is the minimum implied by “at least KRW 30tn” after subtracting the first three quarters, and the remaining KRW 10tn buyback is the minimum implied by “at least KRW 60tn” after subtracting the August KRW 40tn and the new KRW 10tn cancellation. Neither is an amount the company has set.
Share prices and market caps are October 28 regular-session data from the Korea Exchange Data System (pykrx). Closes are market cap divided by listed shares, a regular-session value not mixed with after-hours trading on Nextrade (NXT), Korea’s alternative trading venue. Net buying by investor type also uses KRX final figures, which can differ slightly from numbers in articles published right after the close.
The dividend split multiplies shares outstanding by foreign ownership of 48.61% (October 27, KRX), SK Square’s 146,100,042 shares and the NPS’s 7.50% (July report). Foreign ownership is measured against shares outstanding, and foreigners, SK Square and the NPS are assumed not to overlap. Actual dividends are set by the shareholder register on November 30.
Market cap ÷ estimated 2027 operating profit, the P/E, the payout ratio for separate taxation and the profit slice in the hypothetical example use WISEreport estimates as of October 28 (2026 net profit to owners KRW 256.1tn; 2027 operating profit KRW 403.8tn, net profit to owners KRW 332.6tn and earnings per share KRW 470,589). The post-cancellation share count subtracts the 23,693,272 August shares and half of the new 14.92 million (7.46 million, counted at the KRW 1,341,000 reference price). The actual number cancelled depends on the purchase price. Tax on the dividend in the hypothetical example assumes financial income of KRW 20mn or less and applies 15.4% (including local tax).
Dollar conversions in the foreign comparison and throughout this edition use KRW 1,338.2 per dollar on October 28 (Yahoo Finance). U.S. company figures are buyback authorizations; Alphabet, Microsoft and Meta are from a tracking site. The KRW 17tn of 2018 investment follows Dealsite (January 2020). Broker FCF forecasts are a Hankook Ilbo compilation (average of 10 brokers).
SK hynix’s KRW 100tn shareholder return: quick answers
Q. What did SK hynix announce on October 28, 2026?
Together with third-quarter results of KRW 104.6tn revenue and KRW 83.3tn operating profit, SK hynix set a fiscal 2026 shareholder return of about KRW 100tn (about $74.7bn at KRW 1,338.2 per dollar): cash dividends of at least KRW 30tn and buybacks for cancellation of at least KRW 60tn, including the KRW 40tn August buyback. It also said buybacks will continue every quarter.
Q. Is the KRW 100tn all new money?
No. It already includes about KRW 0.5tn of first- and second-quarter dividends and the KRW 40tn buyback completed on October 21. The board newly set a KRW 14.1tn third-quarter dividend (KRW 20,000 per share) and a KRW 20tn buyback, of which about KRW 10tn for employee pay is not counted. At least KRW 15.4tn of dividends and about KRW 10tn of buybacks remain to be set.
Q. By when must I buy SK hynix to receive the third-quarter dividend?
The record date is November 30, 2026, and Korean trades settle two days after purchase, so shares must be bought by November 26. The dividend is KRW 20,000 per share, half of it a special dividend from the Kioxia stake sale, and is paid within a month of the record date.
Q. Who receives SK hynix’s dividends?
On the author’s split of the KRW 14.1tn third-quarter dividend, foreigners receive about KRW 7.1tn (50.4%, about $5.3bn), SK Square KRW 2.92tn and the National Pension Service KRW 1.1tn, with KRW 2.98tn for other domestic holders. The money reaching SK Square can flow further up to SK Inc.
Q. Does the SK hynix dividend qualify for Korea’s separate dividend taxation?
Not on current numbers. KRW 30tn of dividends is 11.7% of WISEreport’s estimated 2026 net profit to owners of KRW 256.1tn, below the 25% payout test for a high-dividend company. Reaching 25% would take KRW 64tn. Individuals with KRW 20mn or less of financial income are done with 15.4% withholding either way.
Q. Why does the buyback price matter more than the size?
Market cap is 2.69 years of estimated 2027 operating profit and the P/E is 3.16x. The same KRW 10tn bought 5.92mn shares at the August average of KRW 1,688,426 but buys 7.46mn at the new reference price of KRW 1,341,000, 25.9% more. Cancelling 31.15mn shares cuts the share count 4.26% and lifts each remaining share’s slice of profit 4.45%.
Sources
- SK hynix Newsroom, Q3 2026 business results (link), Oct 28, 2026; Q1 (link), Apr 23, 2026; Q2 (link), Jul 29, 2026; full-year 2025 (link), Jan 28, 2026; full-year 2018 (link), Jan 24, 2019
- Korea Exchange (KRX) Data System: KOSPI market cap, listed shares and net buying by investor type (pykrx, regular sessions on Oct 27 and 28, 2026), stock and index prices (Oct 2025 to Oct 28, 2026); DART annual report (Mar 17, 2026)
- WISEreport consensus (SK hynix, Samsung Electronics and SK Square, as of Oct 28, 2026)
- Newspim, August buyback result (link), Oct 26, 2026; Hyundai Economic Daily, buyback resolution (link), Oct 28, 2026
- MTN, conference call (link); EBN (link); Newsis (link); Jaekyung Ilbo (link); Segye Ilbo (link), Oct 28, 2026
- Herald Economy, market close (link) and broker views (link), Oct 28, 2026; Women News, record date (link), Oct 28, 2026
- Insight, SK Square’s share (link), Oct 28, 2026; Yonhap, Korea Ratings outlook (link), Oct 28, 2026; Korea Financial Newspaper, ADR (link), Jul 13, 2026; Newsspace, Chey Tae-won’s SK Inc. stake (link), Oct 3, 2026
- Hankook Ilbo, will Samsung Electronics follow (link), Oct 28, 2026; Korea Economic Daily, Samsung Electronics KRW 90tn to 110tn return (link), Aug 21, 2026; Seoul Finance (link), Oct 28, 2026
- Yonhap Infomax (via Daum), Q2 investment gains (link), Jul 29, 2026; Dealsite (link), Jan 31, 2020
- Separate taxation of dividend income: Business Watch (link), Dec 4, 2025; Maeil Shinmun (link), Oct 13, 2026
- Apple press release (link), May 1, 2018; Business Standard (AFP), May 2, 2018; Business Standard (Reuters, TrimTabs), Jun 6, 2018; Motley Fool (link), Sep 13, 2026; BNN Bloomberg, May 2, 2024; Morningstar and Dow Jones on Nvidia, Sep 28, 2026; buybackstocks.com
- TrendForce DRAM prices (link), Sep 30, 2026 and Oct 20, 2026
- Photos: Daniel L. Lu, Apple Park (CC BY-SA 4.0); Narubaru7, Korea Exchange Seoul (CC BY 4.0); 4300streetcar, SK hynix DDR5 and SOCAMM (CC BY 4.0); 掬茶, Kioxia Kitakami (CC BY-SA 4.0); The White House, Samsung Electronics Pyeongtaek campus (public domain); via Wikimedia Commons
Was this note useful?
Thanks. Your answer helps decide what to cover next.
Korea market snapshot · Oct 28, 2026
New to Korean stocks? Start here for the basics.
Most read lately
Get the Saturday note on Korean stocks
One email every Saturday with the week’s new research on Korean listed companies and links to the updated data pages. Built from DART filings and KRX data. Free; unsubscribe in one click. See past issues