Hanwha Solutions (009830.KS) Stock: Why It Fell 28%, When the US Needs Solar Most, and the Qcells Cell Edge in 2027
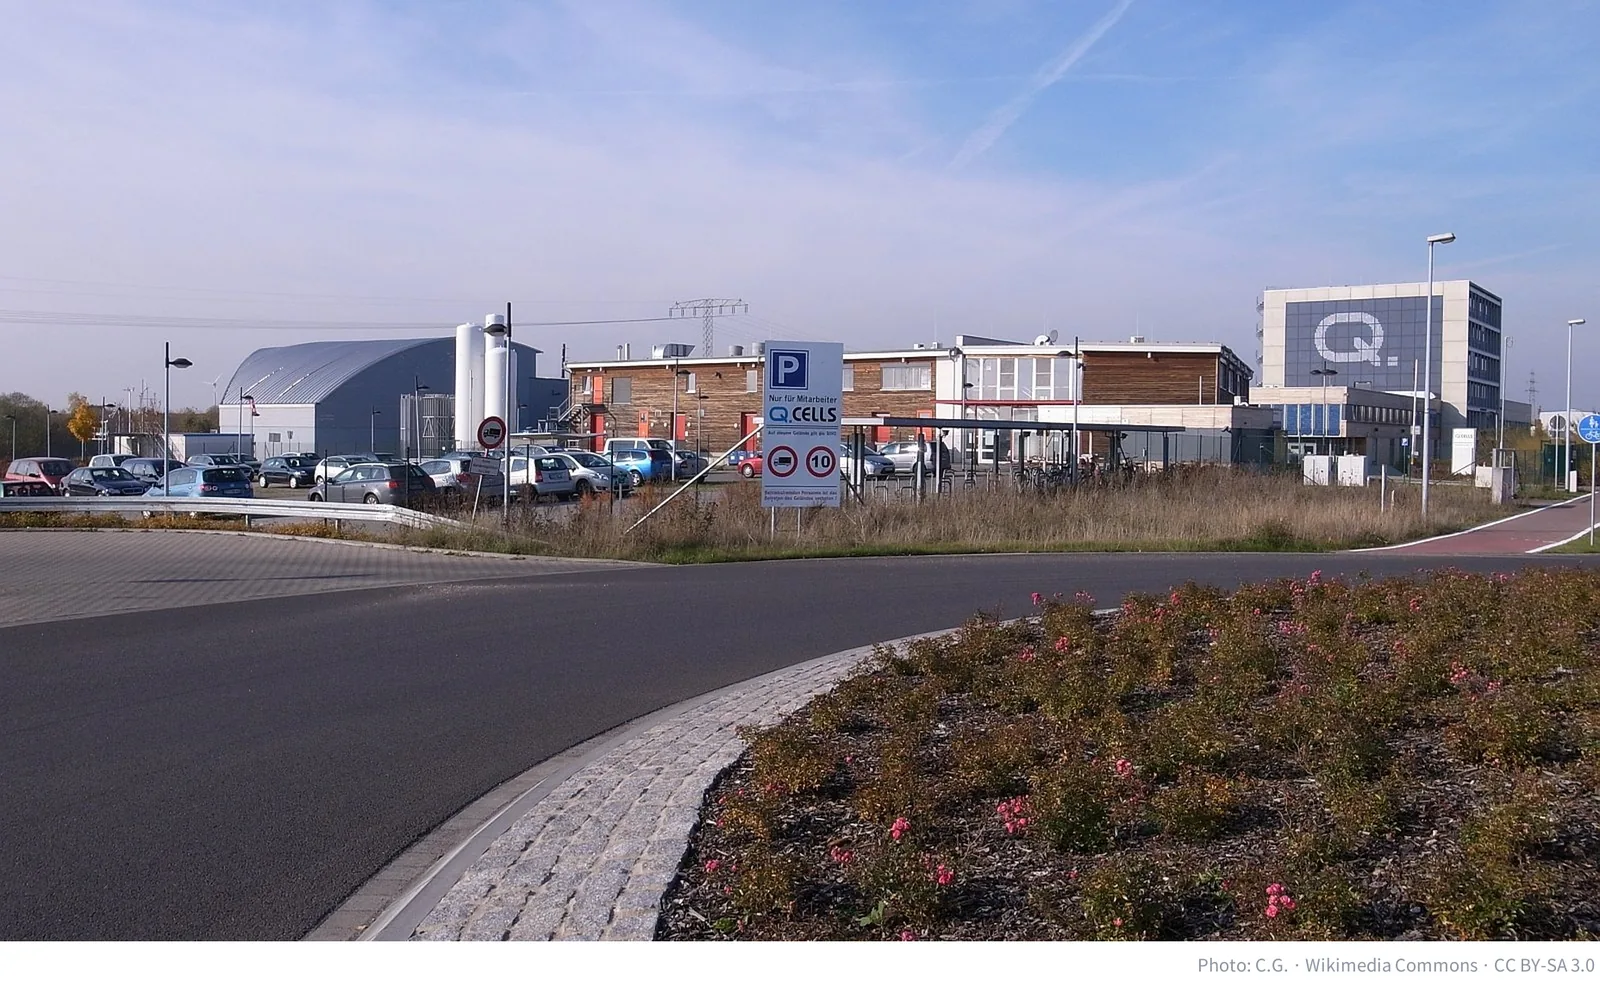
In April 2012 Q-Cells, a solar company in Saxony-Anhalt, Germany, filed for insolvency. In 2007 its shares had traded near $100 and its market value had reached several billion dollars, and it was once called the world’s largest solar company. The reason it collapsed was simple. Solar panel prices fell by about 50% in a year and the market was flooded with panels. It was a time when every panel made lost money (MIT Technology Review, August 27, 2012).
On August 26 of that year the Hanwha Group signed a deal to buy the company. The company described the cash price as being in the “medium double-digit million euro” range, and part of the debt came with it. Reports put the cash price anywhere from $48.4 million to $63 million (PV Tech, Recharge, MIT Technology Review). The Q-Cells that Hanwha bought in the year everyone was abandoning solar is the root of today’s Hanwha Qcells, which makes everything from ingots to modules in Georgia in the United States.
The share price of Hanwha Solutions, which owns Hanwha Qcells, fell from KRW 37,000 on October 6 to KRW 26,500 on October 26. Over the last five trading days alone it lost about a fifth. This report asks six questions. Why did it fall so far, and which of the reasons is hard to see? Does the US really need solar? When does it need it most? What supply advantage does Hanwha Solutions have at that point? Can it get past the reasons it fell? And is now a situation in which buying makes sense? The causes of the drop are limited to those confirmed by dated news, filings and data, and the last question is answered with situations, not buy prices.
This report is the English edition of the author’s Korean note on Hanwha Solutions (009830.KS).
As of: October 27, 2026 (prices are October 26, 2026 regular-session closes)
Stocks covered: Hanwha Solutions (009830.KS, KOSPI). Compared with OCI Holdings (010060), HD Hyundai Energy Solutions (322000) and CS Wind (112610), and with the US solar cell plants of ES Foundry, Canadian Solar and T1 Energy.
Topics: the business and the US manufacturing credit (AMPC), two years of share prices and events, the market, sector and own parts of the big down days, the intraday move on October 26, the causes of the October market sell-off, Q3 expectations and their four reasons, the quarterly credit and the exchange rate, investor flows by phase with foreign ownership and short interest, the US power shortage (PJM, gas turbines, EIA planned capacity), the US installation outlook and tax-credit deadlines, the US cell bottleneck and module prices, the remaining credits against market value, the days the reasons get tested, 2027 earnings paths by situation, and the signals that would change the call.
Data: share prices, indexes, trading by investor type, foreign ownership and short selling come from the KRX Data System (October 26, 2026 regular-session closes); the intraday move from Naver one-minute prices; the exchange rate from the Naver Seoul FX close (KRW 1,327 per dollar on October 26) and Yahoo Finance; the consensus from WISEreport (October 26); company figures from DART filings and earnings coverage; and US figures from SEIA, Wood Mackenzie, EIA, PJM and Anza. Numbers the author calculated are marked “author’s calculation.”
Some Korea-specific background. The KOSPI is the Korea Exchange’s main board, and tickers ending in .KS trade there. The KRX publishes each day’s net buying and selling by investor type (foreigners, institutions with sub-groups such as investment trusts, pension funds, private equity funds, financial investment firms and insurers, and individuals), which is why this report can say who bought and who sold. DART is the Financial Supervisory Service’s electronic disclosure system. Hanwha Solutions is a listed affiliate of the Hanwha Group, one of Korea’s large family-run conglomerates (chaebol). Korea counts large sums in units of 100 million won; this report converts them to KRW bn. Dollar figures in parentheses are converted at KRW 1,327 per dollar, the October 26, 2026 Seoul close. At that rate the KRW 26,500 closing price was about $19.97 and the market value of KRW 5,959.7bn about $4.49bn.
The conclusions first. First, Hanwha Solutions’ fall after October 6 was the whole solar sector being sold on top of a market in which KOSPI fell 21.2% on US inflation and interest rates, doubts about AI investment and Middle East tension, and on every big down day Hanwha’s own part was actually positive. Second, the sector was sold because of the Q3 report due on October 29. Q3 looked empty because a tariff refund that made up three-tenths of Q2 profit will not repeat, imports brought in before the tariffs are delaying price increases, the Cartersville cell plant runs at only about half, and a stronger won books the same dollar credit as fewer won. Third, the US needs solar because it is short of electricity, it needs it most in 2027 when a tax-credit in-service deadline falls, and projects that have already qualified keep demand from falling much through 2030. Fourth, the scarcest part at that point is the cell, and 31% of US cell capacity is Hanwha’s Cartersville plant. All the credits still to come add up to almost exactly today’s market value. Fifth, three of the four reasons for the drop are timing problems with fixed dates, and the currency effect is covered once the plant runs fully. So this is a point at which to wait for the first signal of a buy situation, and that first signal is the October 29 report. The institutions and foreigners who led the rebound are selling now and individuals are buying, so whether those investors return is watched from the same day.
1. Hanwha Solutions is a solar company that makes cells on US soil, and most of its profit is the US manufacturing credit
More than half of sales is solar
Hanwha Solutions has three businesses: renewable energy, which makes solar cells and modules and develops solar projects; chemicals, which makes basic chemicals such as PVC and caustic soda; and advanced materials, which makes lightweight automotive materials and materials for solar modules. Of second-quarter 2026 sales of KRW 4,582.7bn, renewables were KRW 2,482.3bn, chemicals KRW 1,465.0bn and advanced materials KRW 300.3bn (Dealsite, July 30, 2026). Renewables were 54% of sales (author’s calculation). Operating profit of KRW 306.5bn in the same quarter also split into renewables KRW 166.4bn, chemicals KRW 87.1bn and advanced materials KRW 28.8bn, so solar was more than half. Chemicals swung from a loss a year earlier to a profit, and advanced materials’ profit rose 193.9% in a year. The company as a whole lost KRW 300.2bn at the operating level in 2024 and KRW 364.8bn in 2025 before returning to profit from the first quarter of 2026 (WISEreport).
The chemicals side is being restructured. Yeochun NCC, which Hanwha owns jointly with DL, will shut its second and third plants under a petrochemical restructuring plan the government approved on July 22, 2026, and Hanwha Solutions will put in KRW 272.5bn (Etoday). The direction is to shrink commodity chemical capacity that has been losing money to Chinese oversupply, so that chemicals hold solar back less.
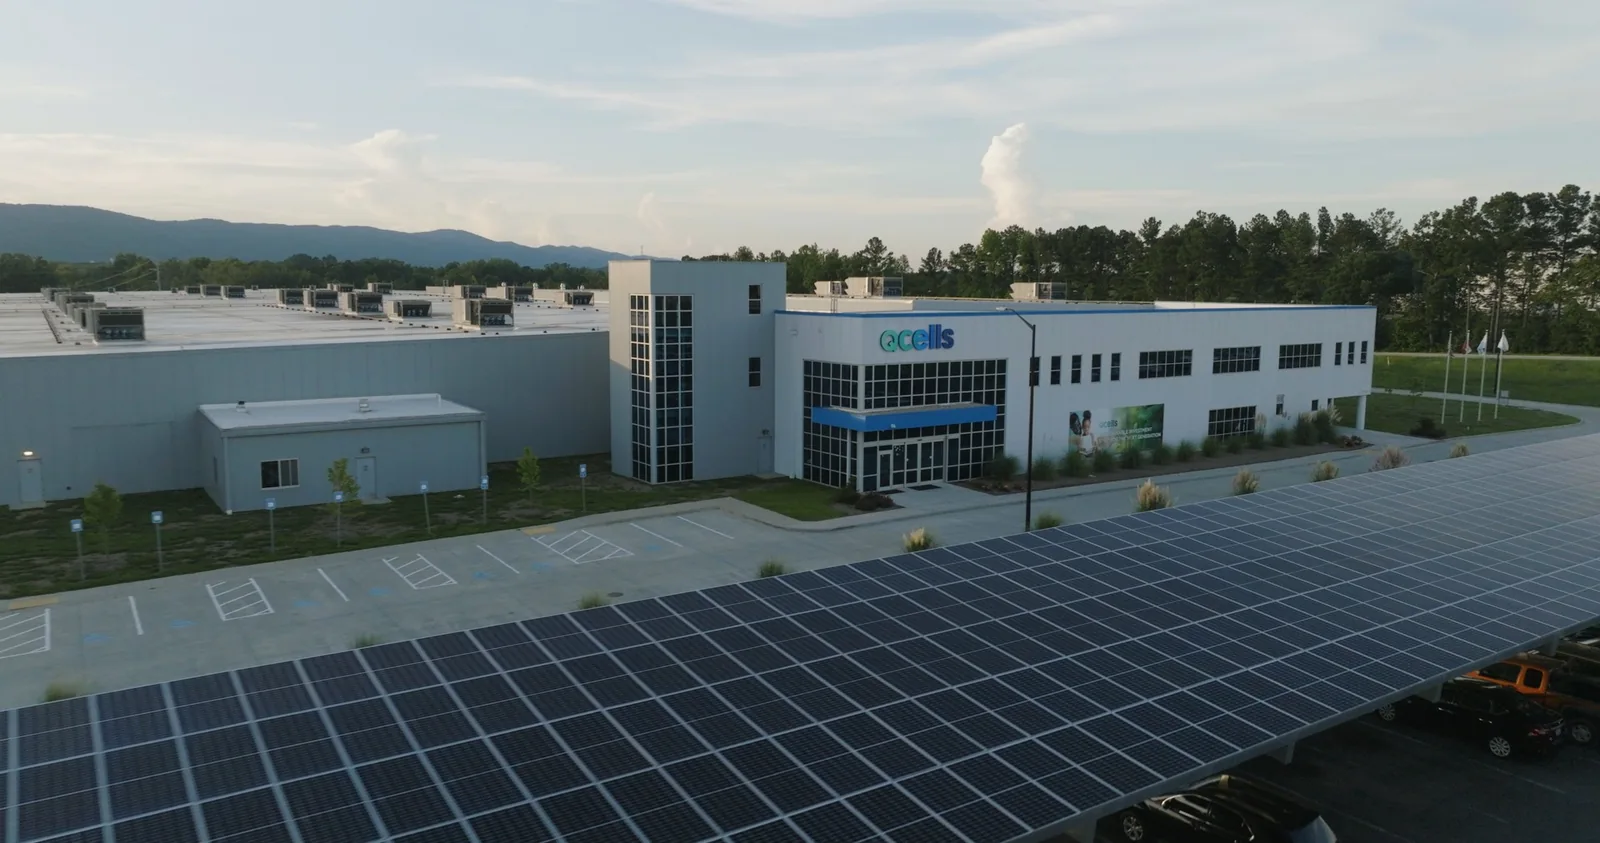
The center of the solar business is the US. Tariffs were also what took the company there. When the US put a 30% safeguard tariff on imported cells and modules in January 2018, Hanwha Qcells announced that May that it would build a module plant of more than 1.6GW a year in Dalton, Georgia, and began running it in 2019 (CleanTechnica, May 31, 2018). The strategy of getting inside the tariff wall first has continued since then. Hanwha Qcells has made modules in Dalton since 2019, and in June 2026 it completed a “Solar Hub” in Cartersville in the same state. Cartersville makes 3.3GW each of ingots, wafers and cells, and together with Dalton its US module capacity is 8.6GW (Money Today, June 10, 2026). Silicon refined from sand (polysilicon) is melted and grown into a cylinder (the ingot), sliced into thin plates (wafers), given circuits (cells), and framed under glass (modules) to make a panel. Cartersville is the first plant in the US to do every step from ingot to module in one place.
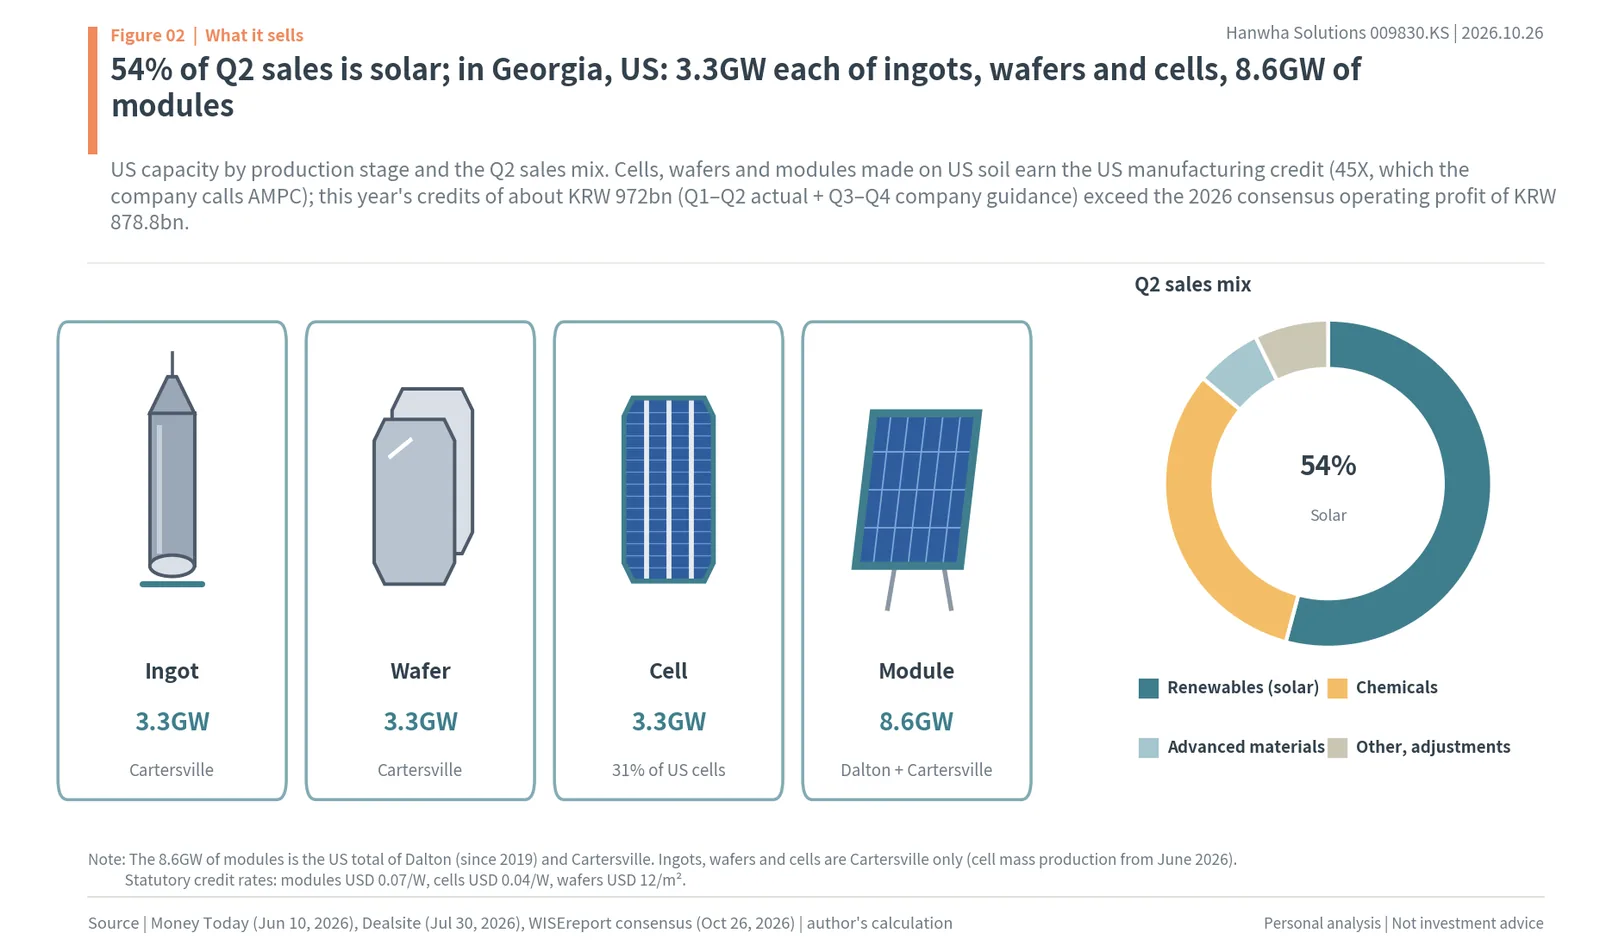
The credit is bigger than operating profit
Making things in the US matters because of money. The advanced manufacturing production credit created by the US Inflation Reduction Act (Section 45X, which the company calls AMPC) pays a fixed amount per watt or per area for components made in the US: USD 0.07 per watt for modules, USD 0.04 per watt for cells and USD 12 per square meter for wafers. The credit can be sold to other companies for cash, so it is booked in operating profit and also becomes real cash.
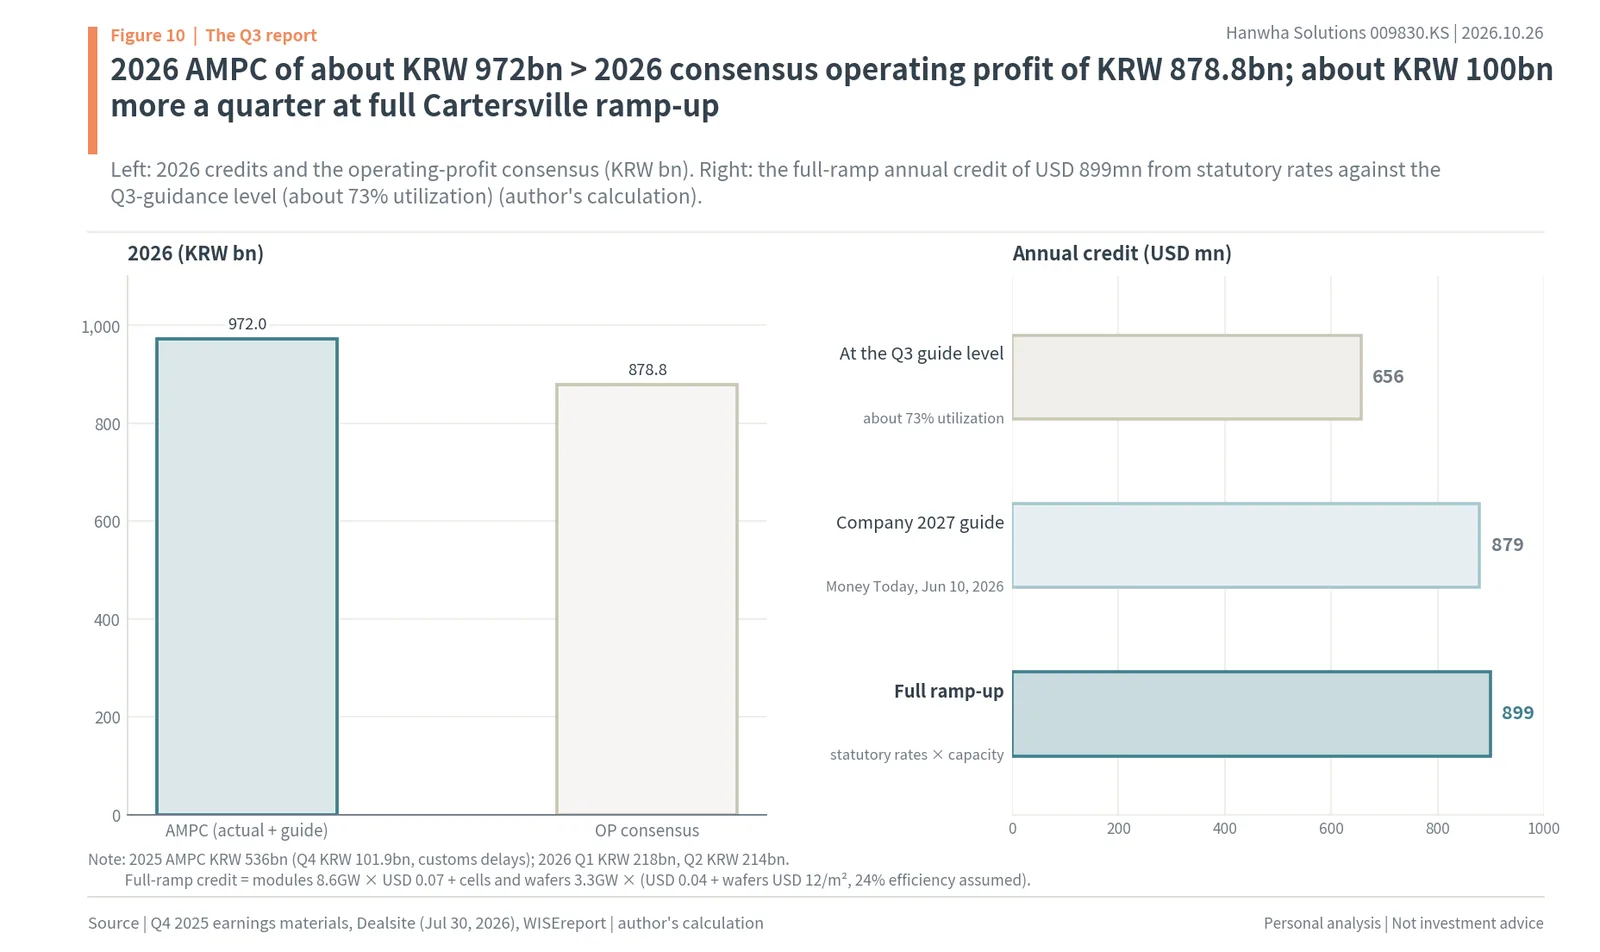
This credit is now almost all of Hanwha Solutions’ profit. The credit was KRW 218bn in the first quarter of 2026 and KRW 214bn in the second, and the company guided to KRW 230bn in the third quarter and KRW 310bn in the fourth (Dealsite). The four quarters add up to about KRW 972bn of credits this year (about $732mn), more than the WISEreport consensus for 2026 operating profit of KRW 878.8bn (author’s calculation). Excluding the credit, the second-quarter renewables division lost about KRW 48bn, and within it the module business lost about KRW 70bn (iM Securities, July 30, 2026). Without the credit, all the other businesses together are below zero.
So what moves this company’s share price most is how fully its US plants run and how much the US buys from them. That is why this report looks at the reasons for the drop and at US demand together.
2. The drop was not a Hanwha-only problem: the whole solar sector was sold on top of a shaken market
From the one-year low to the top and back down
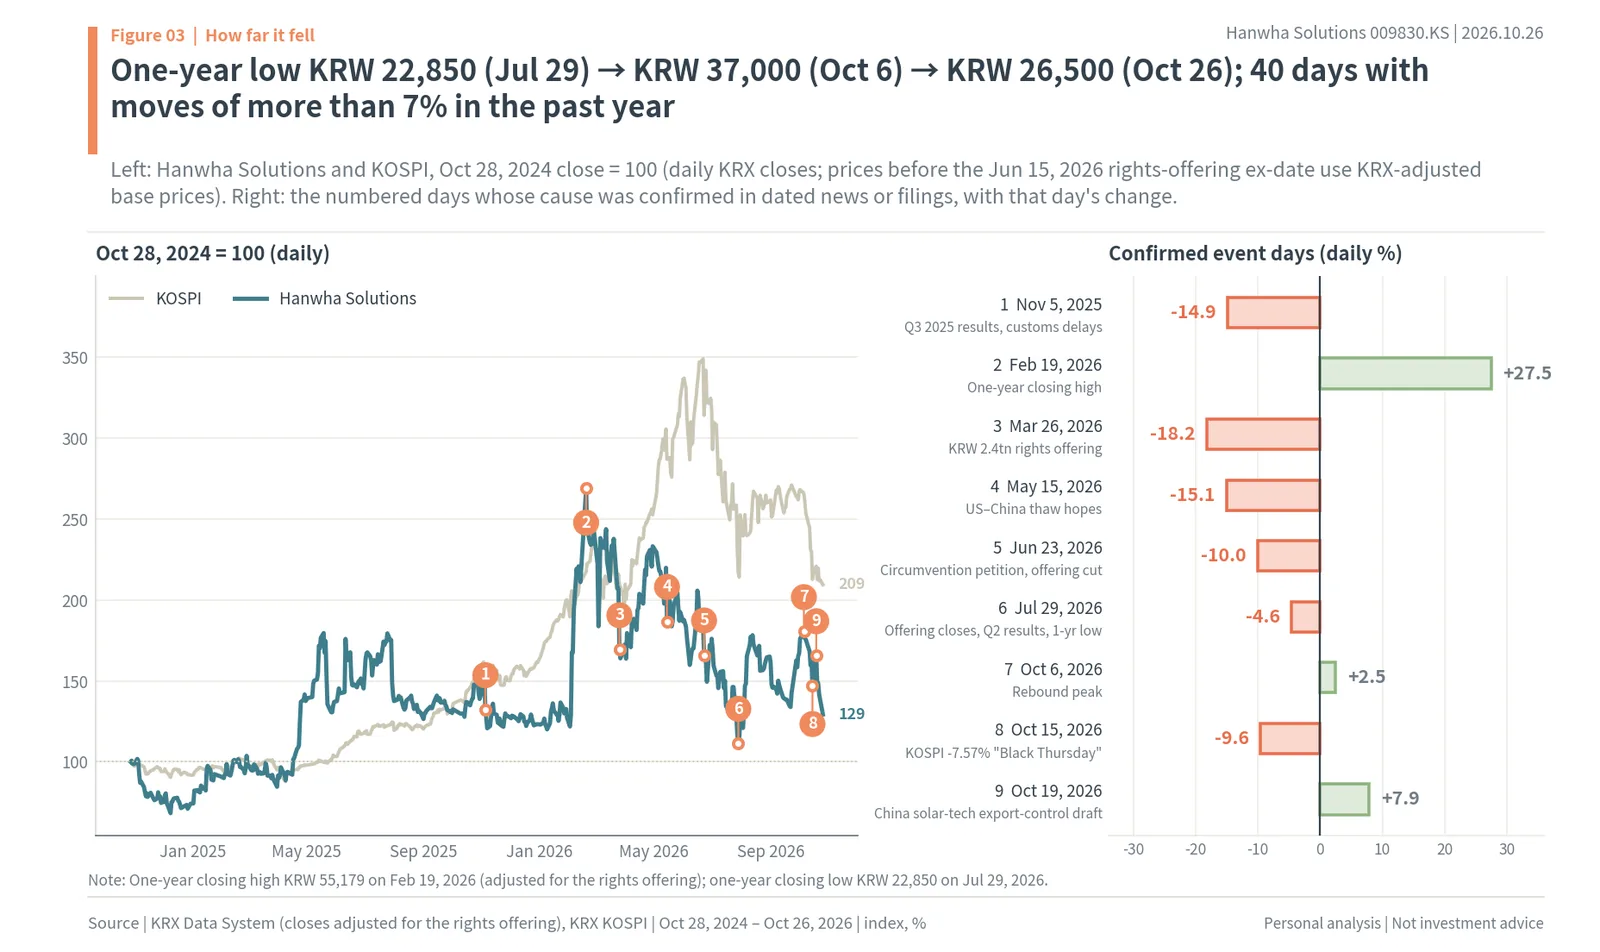
Hanwha Solutions moved more than 7% up or down on 40 days over the past year (author’s calculation). Each big day had its own reason. On November 5, 2025 it fell 14.9% when third-quarter results came with an outlook for lower plant utilization because of US customs checks, and on March 26, 2026 it fell 18.2% on the announcement of a KRW 2.4tn rights offering. On May 15 solar stocks fell together on worries that hopes of US–China reconciliation could loosen US rules on Chinese products, and on June 23 it fell 10.0% amid a petition alleging that Korean cells circumvent US duties and criticism over a reduced rights offering. The one-year closing low was KRW 22,850 on July 29, when the rights-offering subscription ended and second-quarter results came out.
After that the share price rose 61.9% to KRW 37,000 on October 6 and then came back down to KRW 26,500 on October 26 (about $19.97). Most of the rebound was given back in three weeks. The one-year closing high was on February 19 (KRW 55,179 adjusted for the rights offering), so the price today is less than half of it. Forty days of moves over 7% in a year means a big swing about one trading day in six: this is a stock that has reacted strongly to every event.
Splitting the big down days into market, sector and own parts
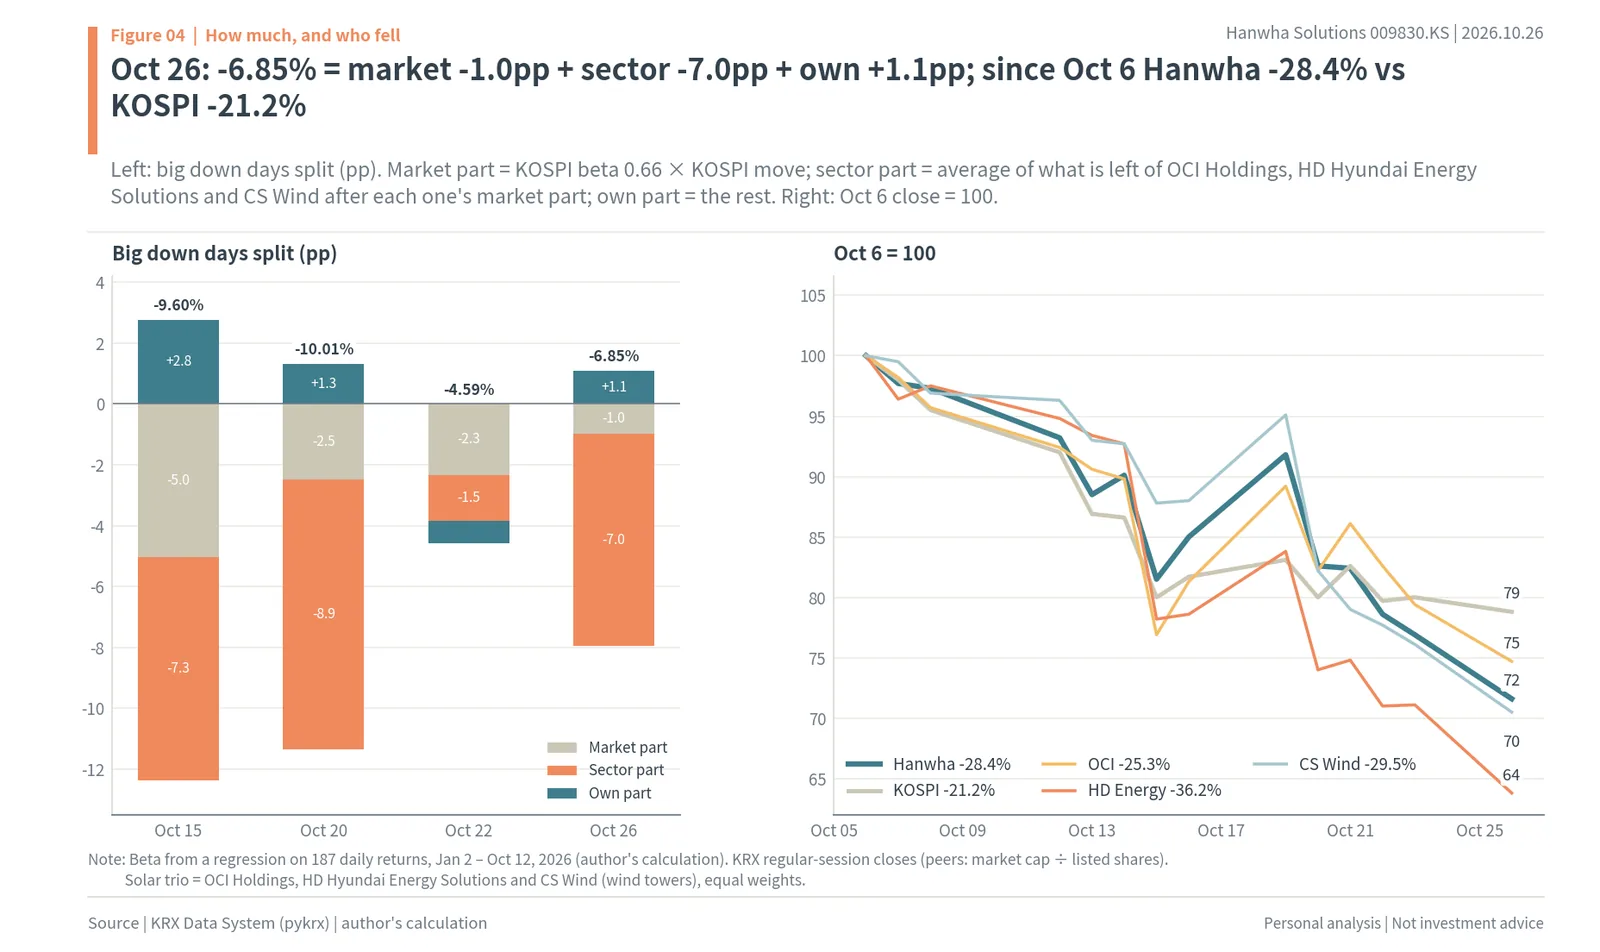
From October 6 to October 26 Hanwha Solutions fell 28.4%. Over the same period KOSPI fell 21.2%, and among solar and wind stocks OCI Holdings fell 25.3%, CS Wind 29.5% and HD Hyundai Energy Solutions 36.2% (KRX, author’s calculation). Hanwha sits around the middle of its sector.
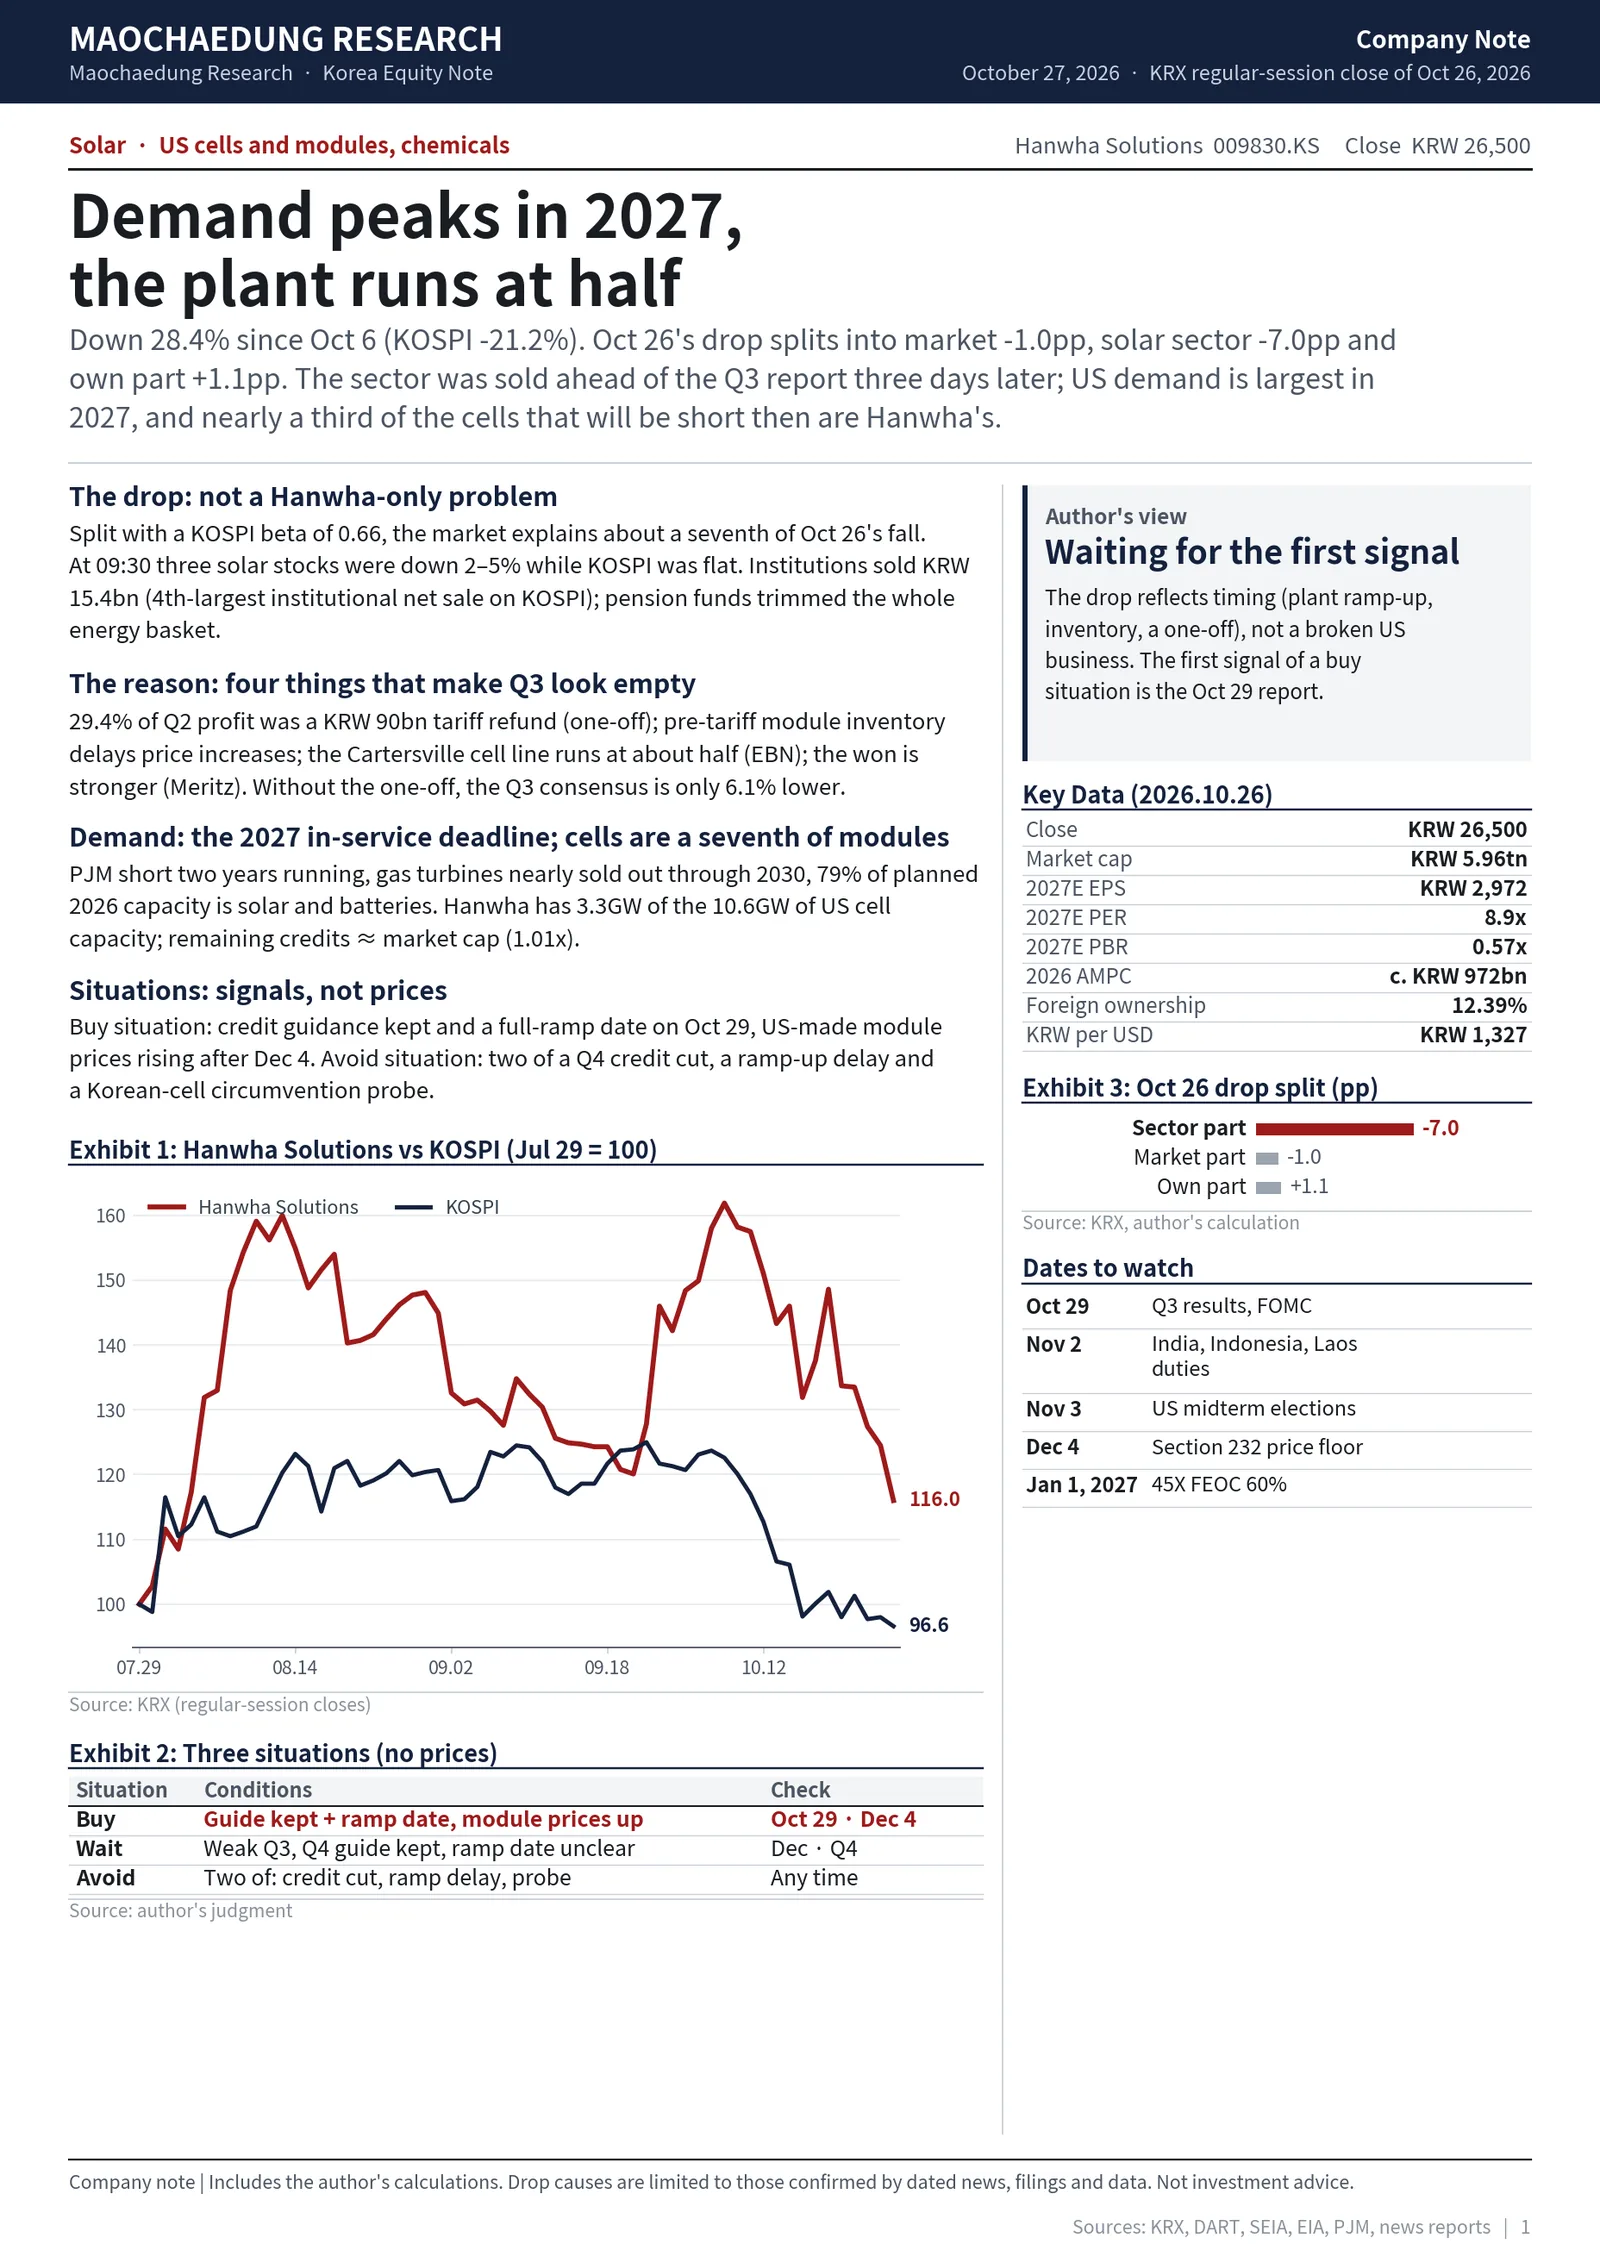
Splitting each day’s fall into three parts makes it clearer. The market part is Hanwha’s KOSPI beta of 0.66 (a regression on 187 daily returns from January 2 to October 12, 2026) times that day’s KOSPI move. The sector part is the average of what is left of the falls of OCI Holdings, HD Hyundai Energy Solutions and CS Wind after each one’s own market part is taken out. The rest is Hanwha’s own part. Hanwha’s -6.85% on October 26 splits into market -1.0pp, sector -7.0pp and own +1.1pp. On October 15 its -9.60% was market -5.0pp, sector -7.3pp and own +2.8pp, and on October 20 its -10.01% was market -2.5pp, sector -8.9pp and own +1.3pp (author’s calculation). On all three days when it fell close to 10%, the own part was positive. Only on October 22, a smaller fall (-4.59%), was the own part slightly negative, at market -2.3pp, sector -1.5pp and own -0.7pp. Hanwha fell less than its sector, and most of what it lost was the sector being sold as a whole.
On October 26 only solar was pushed down, from the opening bell
The intraday move on October 26 tells the same story. In Naver’s one-minute prices Hanwha opened 1.58% lower at 09:00 and was down 4.57% by 09:30. At the same moment HD Hyundai Energy Solutions was down 3.82% and OCI Holdings 2.37%, while KOSPI was up 0.03%, unchanged from the day before. Hanwha then moved between -5.62% at 11:00 and -4.39% at 13:00, was -5.98% at 15:00 and closed at -6.85%. The largest one-minute drop was 1.23pp at 09:01: there was no minute in which some news broke the price at once. It was selling in one direction all day. HD Hyundai Energy Solutions’ preliminary third-quarter results came out after the close, at 15:46.
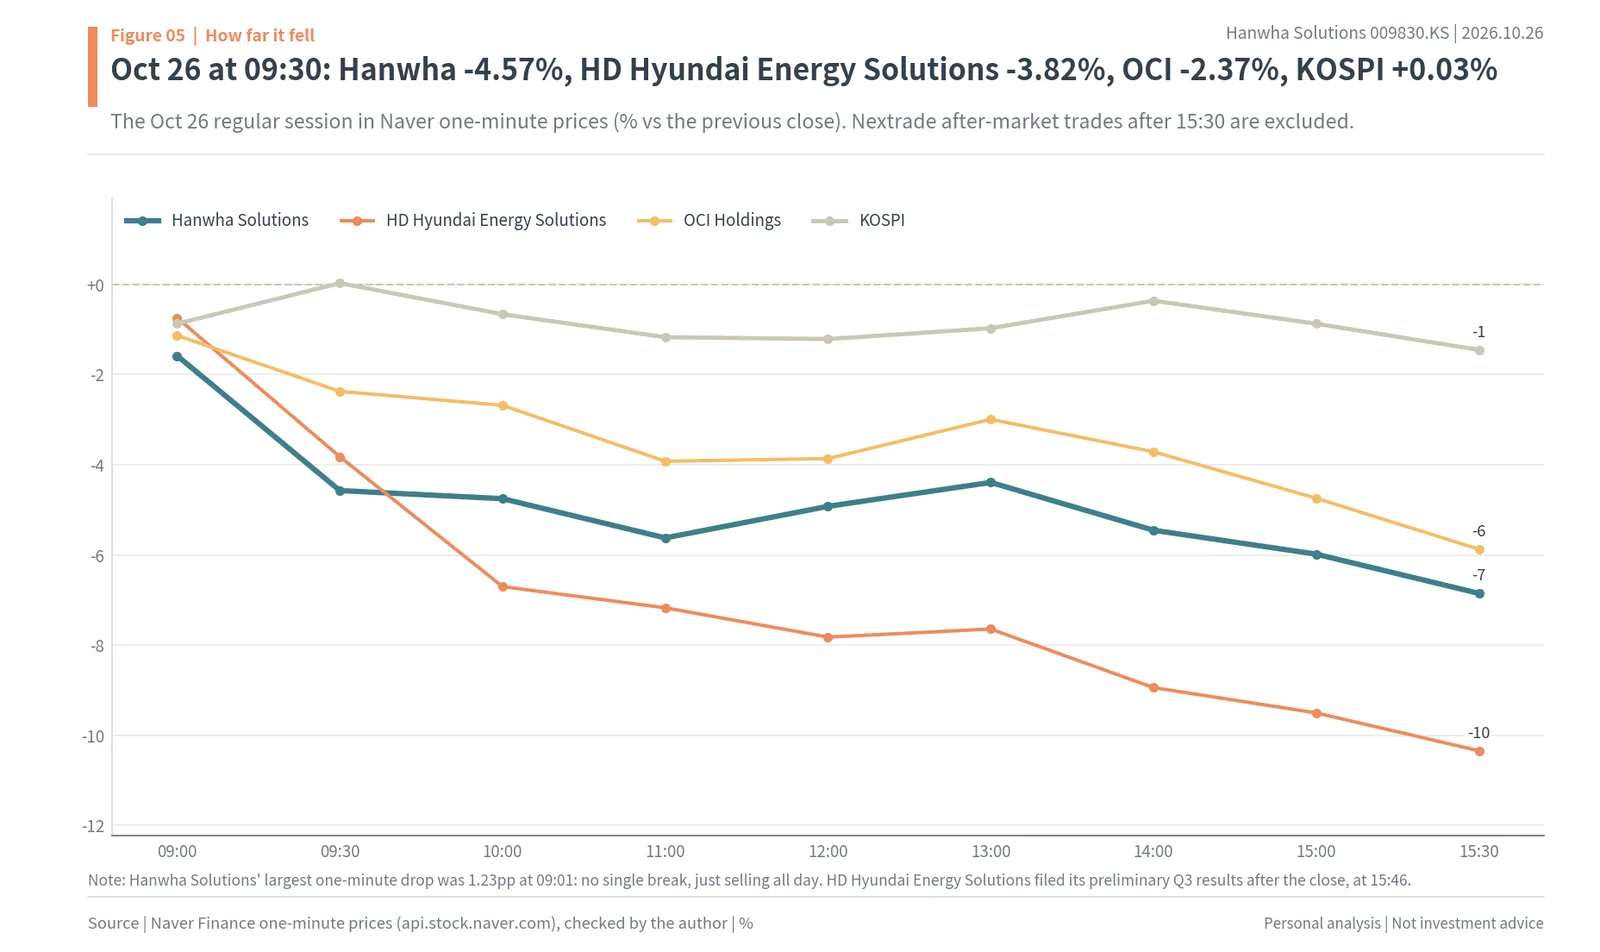
So this fall was not a Hanwha-only problem but the whole solar sector being sold on top of a shaken market. The next two chapters look at why the market was shaken and why the sector was sold.
3. In October the market fell first: US inflation, the money behind AI investment, and the Middle East
Three big down days and the reasons given that day
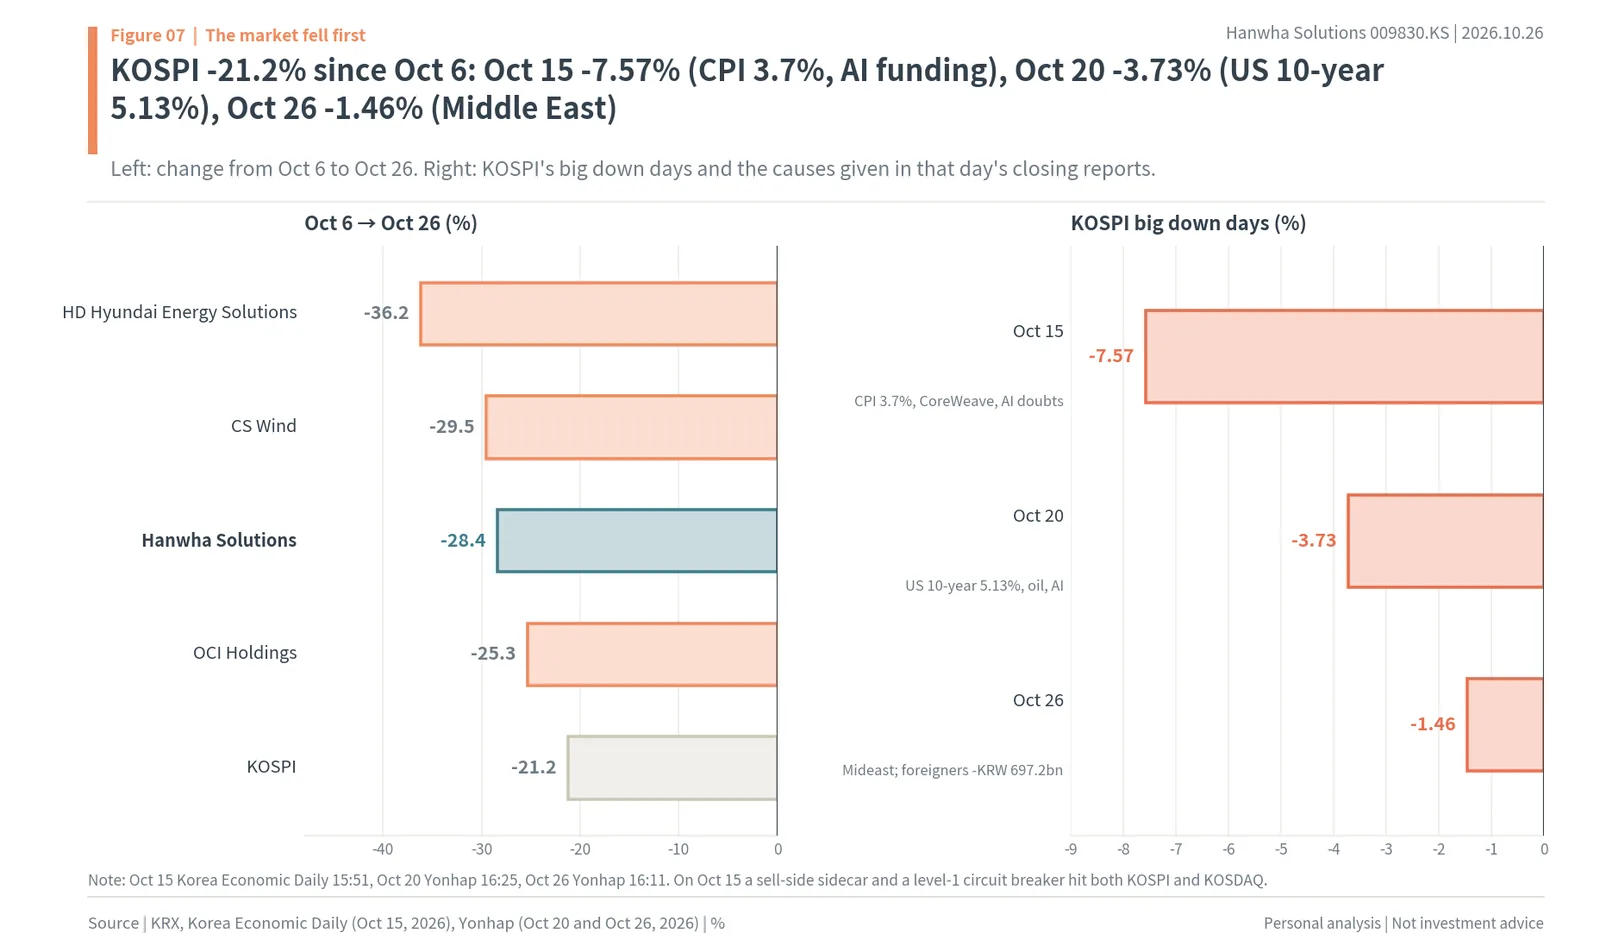
On October 15 KOSPI fell 7.57% to close at 5,554.27. A sell-side “sidecar” (a temporary halt of program selling) and a level-1 circuit breaker (a market-wide trading halt) were triggered on both KOSPI and KOSDAQ; foreigners sold a net KRW 4,819.6bn of KOSPI stocks, while individuals bought KRW 2,145.1bn and institutions KRW 2,004.8bn. KOSPI had fallen for seven trading days in a row, losing 20.7% over that stretch, and on the same day Japan’s Nikkei 225 fell 4.81% and Taiwan’s Taiex 3.41%. The Korea Economic Daily (October 15, 15:51) gave four reasons. US consumer prices rose 3.7% in September, above the 3.6% expected, and the probability of an October rate hike on the CME FedWatch tool rose from the 20% range to the 30% range. The funding risk of the AI cloud company CoreWeave grew, news that Anthropic’s third-quarter revenue growth had slowed from 147% in the previous quarter to 45% came out, and a Gartner report took a dim view of the returns on AI investment. On the same day “AI power” stocks collapsed together: Hyosung Heavy Industries -14.71%, LS Electric -12.13% and HD Hyundai Electric -10.31%.
On October 20 KOSPI fell 3.73%. Yonhap (16:25) cited doubts about AI profitability and profit-taking, the US 10-year Treasury yield above 5.13%, and a Houthi attack on Saudi Arabia with WTI crude at $103.66. On October 26 KOSPI fell 1.46% to 5,469.47, its lowest since April 6, and KOSDAQ lost 3.26%. According to Yonhap (16:11), Middle East tension flared again over the weekend and oil prices jumped (Brent at $116.72 on October 23, with the US 10-year yield briefly above 5%, Aju Business Daily), and with investors waiting for this week’s US rate decision (the FOMC), big tech earnings and the US midterm elections, foreigners sold a net KRW 697.2bn of KOSPI stocks. The same day foreigners bought a net KRW 276.2bn of KOSPI 200 futures, and the won was at KRW 1,321.1 per dollar at 15:30. Institutions bought a net KRW 611bn. Every sector fell that day, led by medical and precision equipment (-5.88%), metals (-3.51%) and machinery and equipment (-3.16%).
The market fell 21.2%
From October 6 to October 26 KOSPI fell 21.2%. Over the same period Hanwha Solutions fell 28.4%, OCI Holdings 25.3%, CS Wind 29.5% and HD Hyundai Energy Solutions 36.2%. As shown above, solar stocks fell more than the market on every big down day, but underneath was what pulled the whole market down: US inflation and interest rates, doubts about AI investment and Middle East tension. When rates rise, the interest cost of the developers who build solar plants rises, and so does the discount rate applied to future profits. The same wind blew harder on the solar sector.
So the first cause of the October fall is the market, and on top of it Hanwha fell further together with its sector. The reason the sector fell further can be found in the report card due three days later.
4. The sector was sold for the Q3 report: the four things that make it look empty are all about timing
Three days before results, expectations came down
Hanwha Solutions holds its third-quarter earnings conference call at 2 p.m. on October 29 (DART notice of investor relations meeting, October 7). Just before it, brokers lowered their numbers. On the morning of October 15 DB Securities cut its target price from KRW 51,000 to KRW 41,000, saying it had put “higher costs such as freight” into its earnings estimates, while raising its rating to Buy because the fall in the share price was excessive (Korea Economic TV, October 15, 07:10). On October 22 Meritz Securities forecast third-quarter operating profit of KRW 192.2bn and cited the strong won and the end of second-quarter one-offs as the reasons it would be lower than the second quarter (Liberty Korea Post). EBN (October 23, 13:04) wrote that the module division is expected to post an operating loss of about KRW 127.3bn in the third quarter.
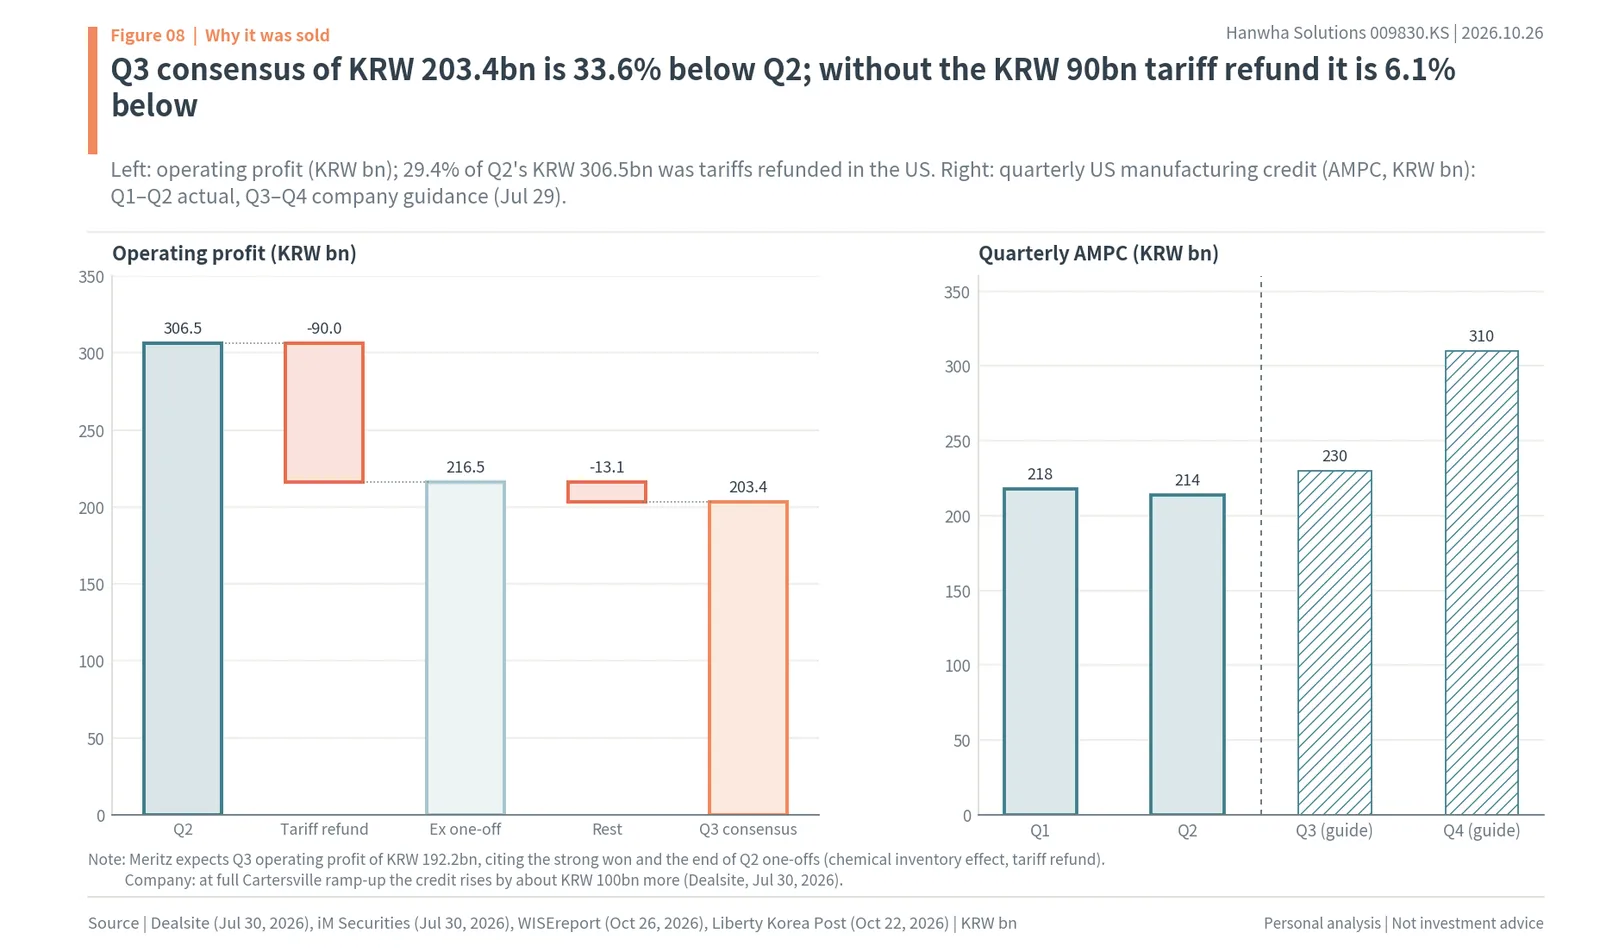
WISEreport’s third-quarter operating profit consensus is KRW 203.4bn (about $153mn), 33.6% below the second quarter’s KRW 306.5bn. Companies in the same sector were sold together in the three days before results because this number looked empty. But taken apart one by one, all four reasons it looks empty are not that the US business is broken but that it is not yet time.
A reason that is hard to imagine: three-tenths of Q2 profit was refunded tariffs
Second-quarter operating profit of KRW 306.5bn (about $231mn) included KRW 90bn (about $68mn) of tariffs refunded in the US (Dealsite, July 30, 2026). That means 29.4% of the profit was money that comes in only once (author’s calculation). Without the KRW 90bn, the underlying second-quarter profit was KRW 216.5bn, and the third-quarter consensus of KRW 203.4bn is only 6.1% below it. Most of the headline -33.6% is not the business getting worse but a one-off that was mixed into the previous quarter.
Two: tariffs actually delayed price increases
Tariffs raise the price of imports to help companies that make things in the US. But according to EBN, imported modules brought in before the tariffs took effect are still in the US market, delaying the price increases Hanwha Qcells expected. Until the goods that developers bought early to avoid the tariffs are sold, the new tariffs are not fully reflected in prices. The effect of the tariffs has not disappeared; it has been pushed back by the amount of that inventory.
The numbers to watch on October 29
So the numbers to watch on October 29 are the parts rather than the operating profit total. Meritz expects third-quarter operating profit of KRW 118.3bn from renewables and KRW 37.8bn from chemicals. In July the company expected third-quarter module sales to rise by more than 1GW from the second quarter to about 2.5GW (ZDNet Korea), and CFO Lee Jae-bin expected third-quarter sales of the residential energy business to grow (Dealsite). If volumes rose as planned and profit still looks empty, the gap comes from the one-off, inventory and utilization; if the volumes themselves fell short, demand has to be looked at again. The credit amount shows how the plants are running more directly than volumes do.
Three: the US plant still runs at only half
In the same article EBN wrote that utilization at the Cartersville cell plant remains at “about half,” and that delays in the ramp-up to stabilize production have increased the burden of fixed costs. The company also said in its July 29 results that Cartersville is ramping up capacity and stabilizing its processes and that it plans to raise utilization gradually (Dealsite). Unlike the Dalton plant in Georgia, which has long made modules, Cartersville is running new processes for ingots, wafers and cells for the first time.
When the plant runs fully, the credit grows. The company explained that the credit will rise by about KRW 100bn more once Cartersville runs fully (Dealsite, reported on a quarterly basis). Multiplying the statutory credit rates by US capacity (8.6GW of modules, 3.3GW of cells and wafers) gives a full-utilization credit of about USD 899mn a year, and the third-quarter guidance of KRW 230bn is 73% of that (author’s calculation, assuming KRW 1,400 per dollar). Each percentage point of utilization adds about KRW 11.9bn of annual credit at today’s exchange rate (author’s calculation). This year’s credits of KRW 218bn in the first quarter, KRW 214bn in the second, KRW 230bn guided for the third and KRW 310bn guided for the fourth add up to about KRW 972bn, already more than the 2026 operating profit consensus of KRW 878.8bn. In 2025 customs delays held the fourth-quarter credit to KRW 101.9bn and the full year to KRW 536bn (Q4 2025 earnings materials). From mid-2025 US Customs held cells that Qcells was importing under the Uyghur Forced Labor Prevention Act, so the Georgia plant could not get cells, and about 1,000 workers were furloughed without pay in November 2025. Normal production resumed only on March 6, 2026 (pv-tech, Solar Power World). The credit rising every quarter this year is the result of that customs problem being resolved and Cartersville starting up. DB Securities expects operating profit of KRW 838.9bn in 2026 and KRW 1,151.8bn in 2027, with a fourth-quarter credit of about KRW 300bn.
The reason the module business loses money without the credit comes from the same place. In the second quarter the module business lost about KRW 70bn excluding the credit (iM Securities), and a new plant carries all of its fixed costs, people, equipment and depreciation, even before it runs fully. As more cells and modules come out of the same costs, the fixed cost per panel falls, so simply finishing the ramp-up improves the underlying business. The industry view reported by EBN also puts the real improvement next year.
Four: a stronger won books the same dollar credit as fewer won
The credit is set in dollars. The company’s 2027 credit outlook of USD 879mn was converted to about KRW 1,341.4bn in a June article; at the October 26 Seoul close of KRW 1,327 it is KRW 1,166.4bn (author’s calculation). Every KRW 100 fall in the won-dollar rate reduces the 2027 credit by KRW 87.9bn in won. That is why Meritz cited the strong won as a reason for the lower third quarter. The won strengthened sharply from a July average of KRW 1,489 through September, and over the last two weeks it barely moved, from KRW 1,343 on October 13 to KRW 1,327 on October 26. So the exchange rate is less the trigger of a single day’s fall than the background that lowered third-quarter expectations.
The company cannot set the exchange rate, but it can cover it. The KRW 87.9bn a year taken away by a KRW 100 stronger won is 22% of the roughly KRW 400bn a year added by running Cartersville fully (the company’s about KRW 100bn a quarter × 4) (author’s calculation). Once the plant runs properly, the currency’s bite is less than a quarter of it.
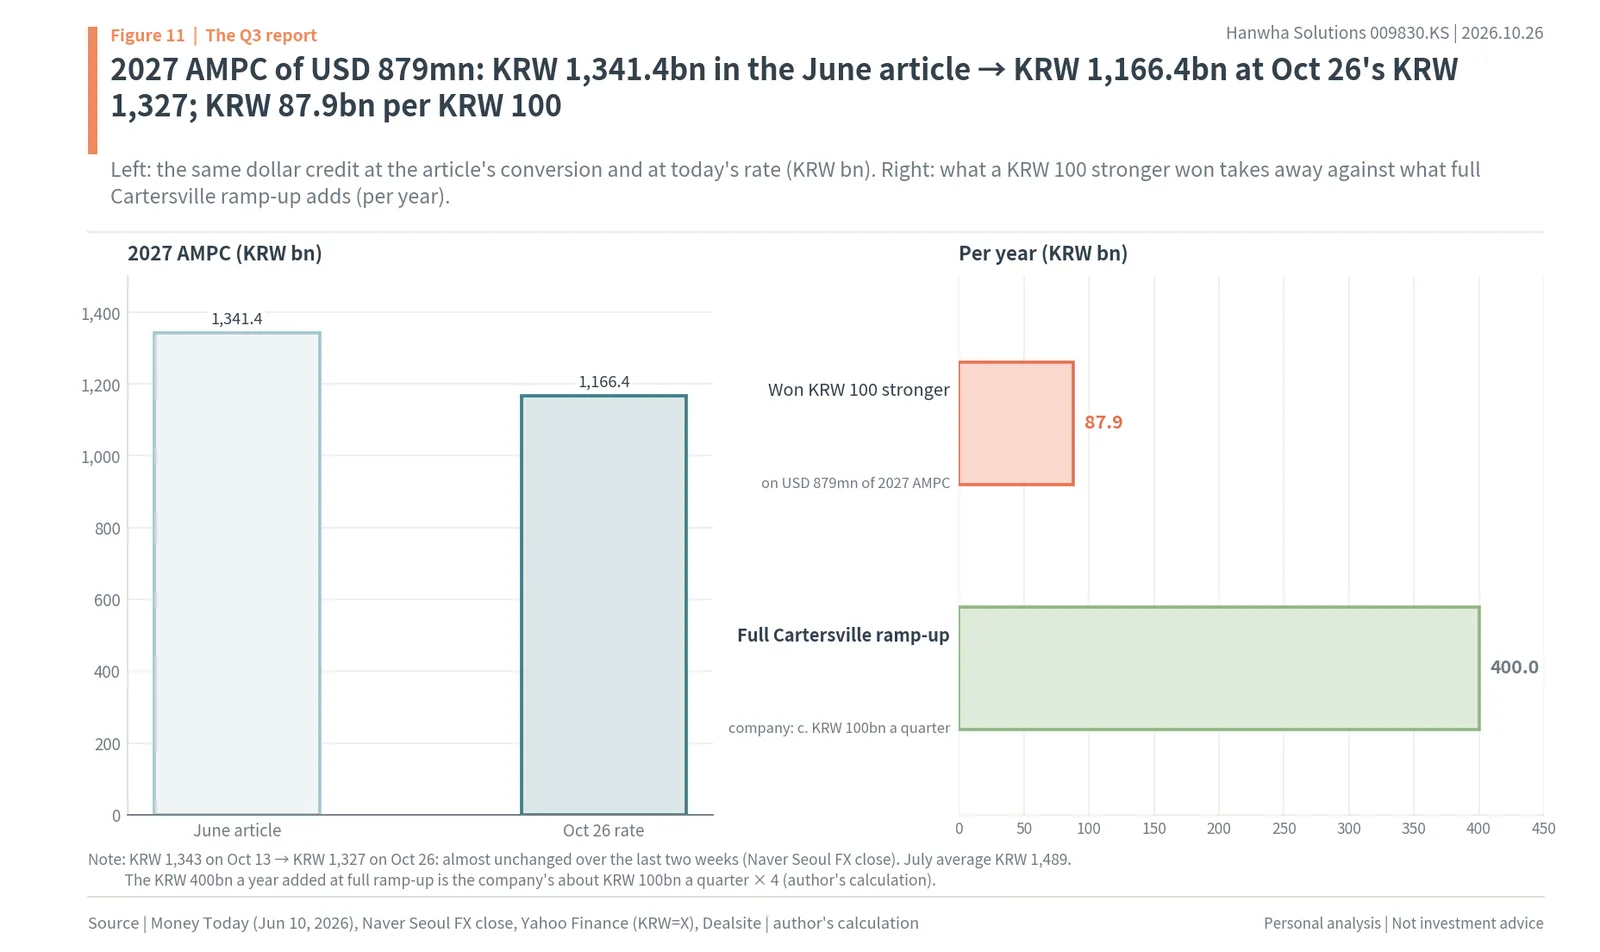
So institutions sold ahead of results not because the US business is broken but because third-quarter numbers look empty: a one-off dropped out, inventory is delaying the tariff effect, the plant runs below capacity and the won is stronger. Three of the four are timing problems with fixed dates, and the remaining one is covered once the plant runs fully.
5. Investor flows: the institutions and foreigners who led the rebound are selling, and the individuals who sold the rebound are buying
Buyers and sellers switched in every phase
Splitting the KRX record of net buying by value into price phases shows the turnover clearly. From July 1 to July 29, a period that included the rights-offering subscription, the share price fell 32.7% while foreigners sold a net KRW 145.4bn and financial investment firms KRW 61.5bn, and individuals bought KRW 172.7bn. Pension funds bought KRW 23.0bn and investment trusts KRW 14.3bn.
The 61.9% rebound from July 30 to October 6, after the low, was led by institutions and foreigners. Investment trusts bought a net KRW 56.6bn, pension funds KRW 47.0bn, foreigners KRW 42.1bn, financial investment firms KRW 13.7bn, private equity funds KRW 8.9bn and insurers KRW 5.4bn, so institutions and foreigners together bought KRW 173.7bn. The sellers were individuals, who sold a net KRW 174.8bn. They handed over in the rebound the shares they had taken during the offering.
In the first drop from October 7 to October 15 (-18.5%) and the jump from October 16 to 19 (+12.6%), financial investment firms and pension funds bought a little. The flow reversed from October 20. In the second drop from October 20 to 26 (-21.9%), foreigners sold a net KRW 41.0bn, pension funds KRW 8.9bn, investment trusts KRW 6.2bn, private equity funds KRW 5.7bn, financial investment firms KRW 3.3bn and insurers KRW 1.4bn, while individuals bought KRW 65.8bn. Individuals took almost all of the KRW 66.5bn that institutions and foreigners sold (author’s calculation).
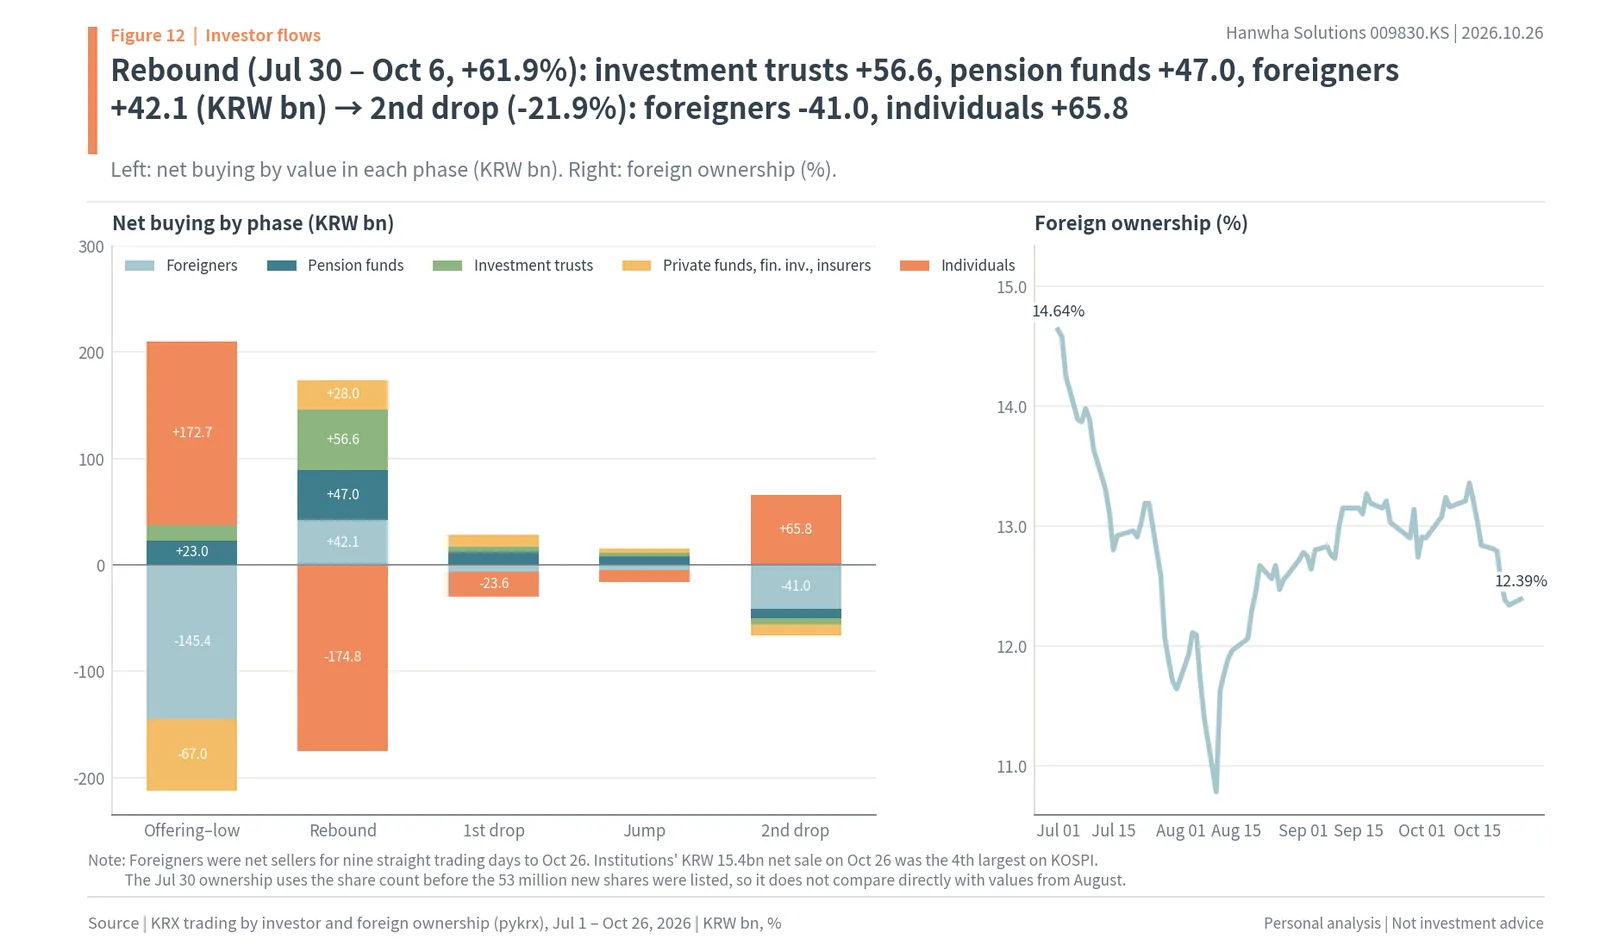
Foreigners sold nine days in a row; short selling is small
Foreign ownership fell from 14.64% on July 1 to 11.70% on July 30 during the offering (based on the share count before the 53 million new shares were listed). It rose with the rebound to 13.15% on September 11, then fell back to 13.04% on October 15 and 12.39% on October 26. Foreigners were net sellers for nine straight trading days to October 26. In shares held, foreign holdings fell from 29.57 million on September 11 to 27.87 million on October 26, about 1.71 million fewer (KRX).
The short-sale balance built up to 2.42% of listed shares on July 28 as shares were borrowed and sold ahead of receiving new offering shares, fell to 0.11% on September 29 after the new shares were listed, and was 0.31% on October 22. Short selling was 7.0% of trading on October 26 (KRX). A balance of 0.31% of listed shares means the selling now is of shares that were held, not shares that were borrowed and sold.
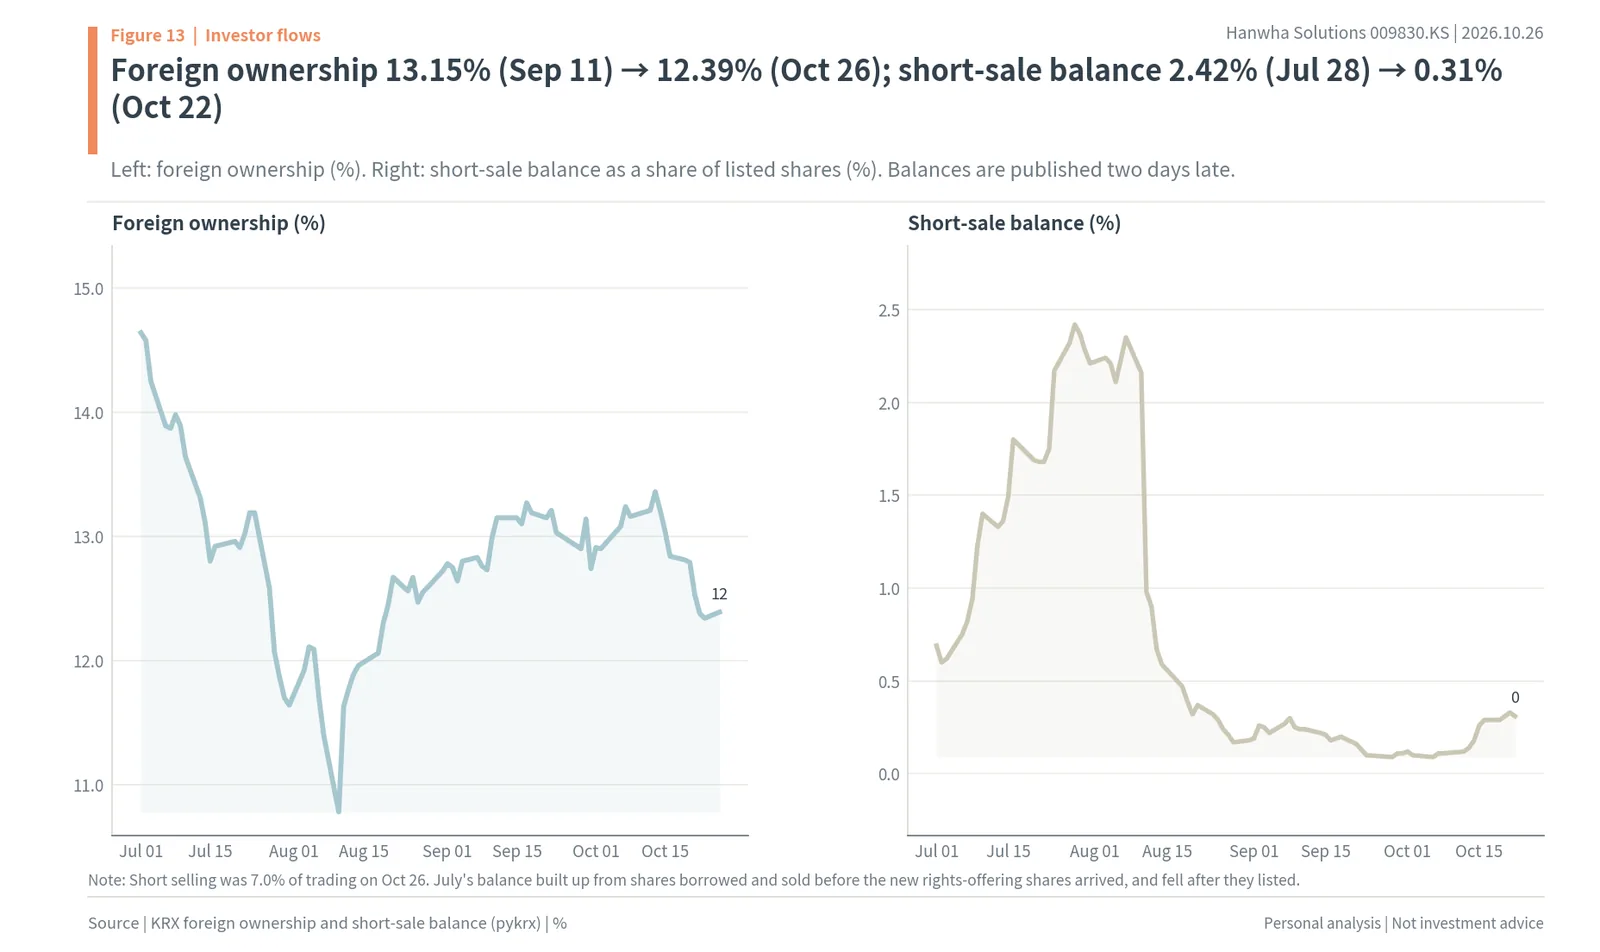
October 26: pension funds trimmed energy stocks as one basket
On October 26 alone institutions sold a net KRW 15.4bn. That day KOSPI institutions as a whole bought a net KRW 611bn (Yonhap), yet Hanwha Solutions was the fourth-largest institutional net sale on KOSPI. Within institutions, pension funds sold KRW 6.35bn, private equity funds KRW 3.79bn, financial investment firms KRW 2.58bn, investment trusts KRW 1.54bn and insurers KRW 1.13bn, and foreigners also sold KRW 4.25bn. Individuals bought KRW 19.56bn.
The pension funds’ selling was not aimed at Hanwha alone. The same day pension funds sold Doosan Enerbility (KRW 13.3bn), HD Hyundai Electric (KRW 6.6bn), HD Hyundai Energy Solutions (KRW 6.4bn) and Hanwha Solutions (KRW 6.4bn). They took weight off energy stocks spanning nuclear, power equipment and solar as one basket (KRX, author’s tally). That day the top of the pension funds’ KOSPI net-sell list was lined with defense, shipbuilding and energy stocks that had risen a lot this year: LIG Defense & Aerospace (KRW 16.1bn), Doosan Enerbility, Sam-A Aluminium (KRW 12.8bn), HD Hyundai Heavy Industries (KRW 12.2bn) and Doosan (KRW 10.9bn). It was not selling that singled out Hanwha but selling that lightened the whole energy basket ahead of big events.
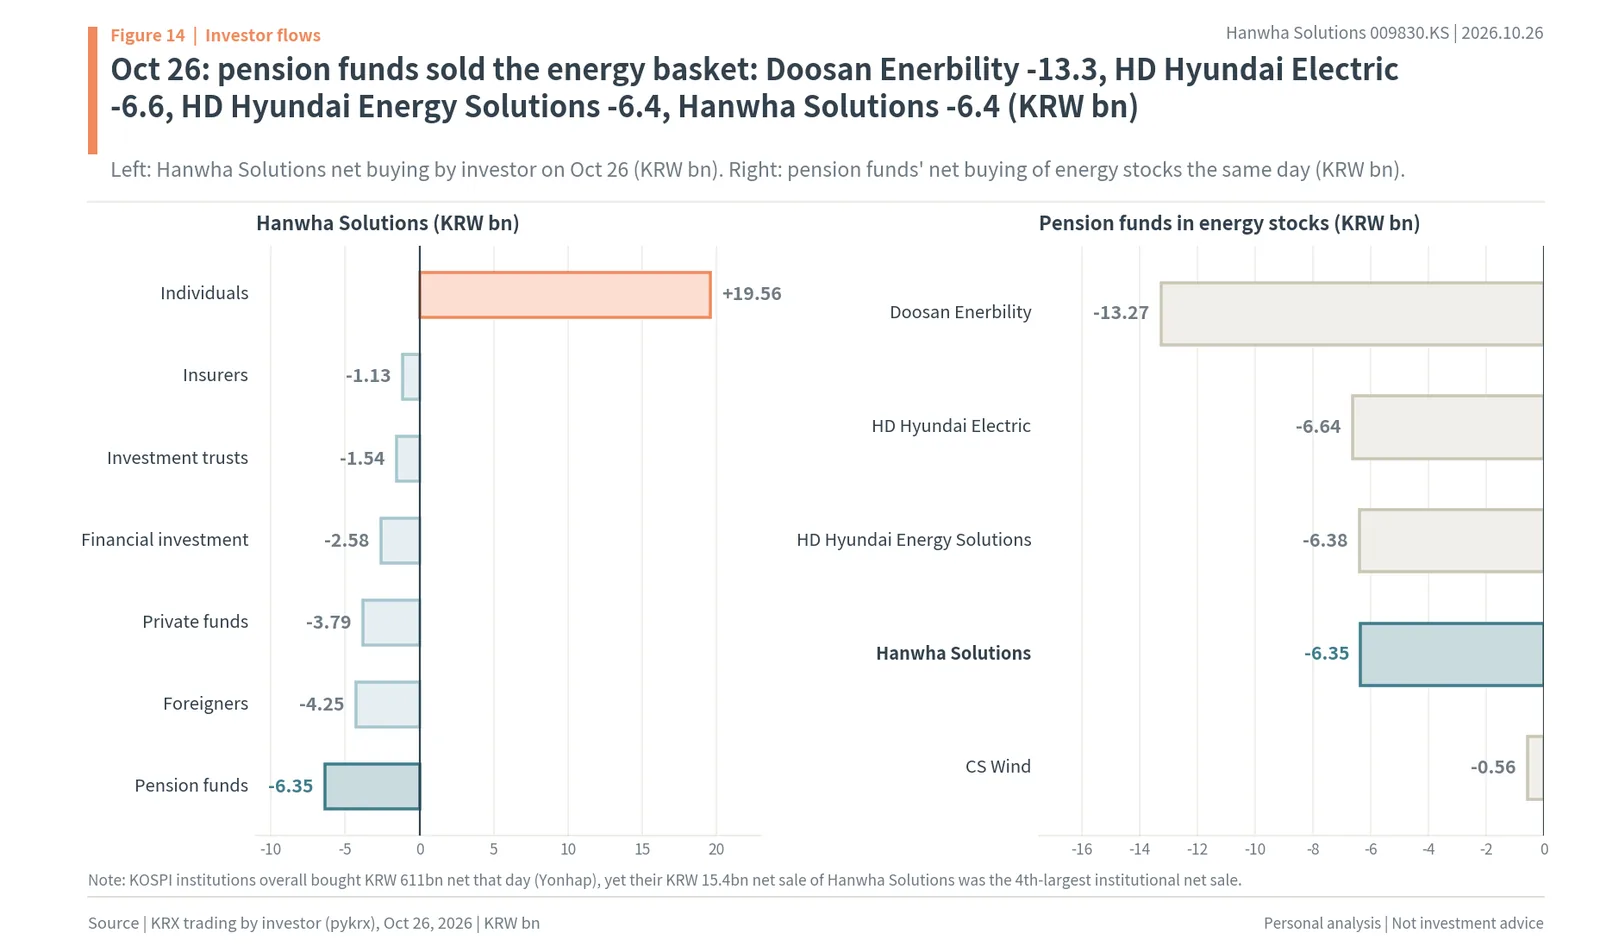
By month: institutions bought in August, foreigners are selling in October
Cut by month, the same flow looks like this. In July foreigners sold a net KRW 133.5bn and individuals bought KRW 153.0bn. In August pension funds bought KRW 43.9bn, private equity funds KRW 41.3bn and investment trusts KRW 21.0bn, while individuals sold KRW 120.7bn. In September investment trusts bought another KRW 22.8bn but private equity funds sold KRW 35.1bn, and in October financial investment firms bought KRW 23.6bn, pension funds KRW 19.5bn and investment trusts KRW 14.1bn while foreigners sold KRW 23.0bn (KRX, author’s tally). Over the full year foreigners bought a net KRW 228.0bn and institutions KRW 294.7bn (pension funds KRW 137.6bn), and individuals sold a net KRW 517.4bn. Over a year, this is a stock institutions and foreigners have been adding to, and since last week those investors have been trimming part of it.
So right now the institutions and foreigners who led the rebound are selling and individuals are taking the shares. For those investors to buy again, the report card has to show numbers. Whether there is a reason in the US for those numbers to improve is the next question.
6. The US is short of electricity, so it needs solar
The largest grid failed to secure enough capacity two years running
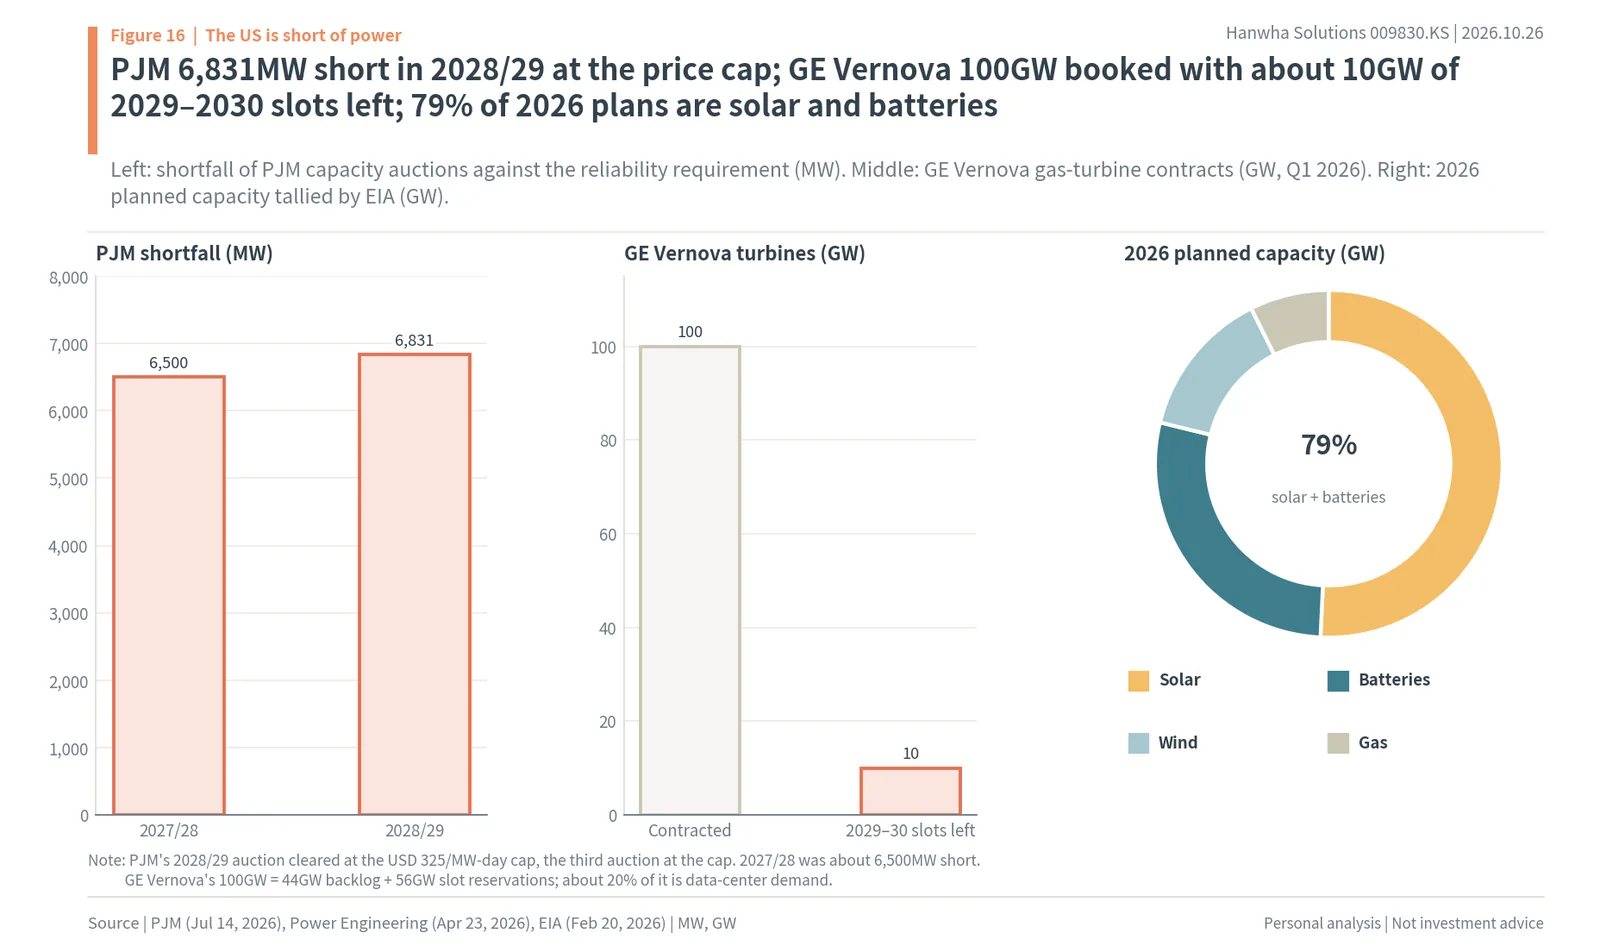
PJM, the largest US grid, which supplies electricity to 67 million people in 13 eastern states and Washington, D.C., buys the generating capacity it will need three years ahead in an annual auction. The 2028/29 auction announced on July 14 secured 138,318MW but fell 6,831MW short of the reliability requirement. The price hit the cap approved by the Federal Energy Regulatory Commission, USD 325 per MW-day, making it the third auction to clear at the cap. The previous 2027/28 auction was also about 6,500MW short (PJM press release). That is two years running below the reliability requirement. Capacity secured times price in the 2028/29 auction came to USD 16.4bn, and even adding the 10,864MW from areas that arrange their own capacity (FRR), the total was 149,182MW. The price hit a cap that was 2.5% lower than the 2027/28 cap of USD 333.44. A price stuck at the cap means supply was short enough that, without the cap, the price would have gone higher.
Gas turbines are nearly sold out through 2030
When electricity is short, the first answer that comes to mind is gas-fired generation. But the order book of the companies that make turbines, the heart of a gas plant, is full. GE Vernova had 100GW under contract in the first quarter of 2026, a 44GW gas-turbine backlog plus 56GW of slot reservations, and only about 10GW of slots were left for 2029 and 2030 combined. About 20% of the contracts are data-center demand (Power Engineering, April 23, 2026). There is almost no room left for new orders through 2030.
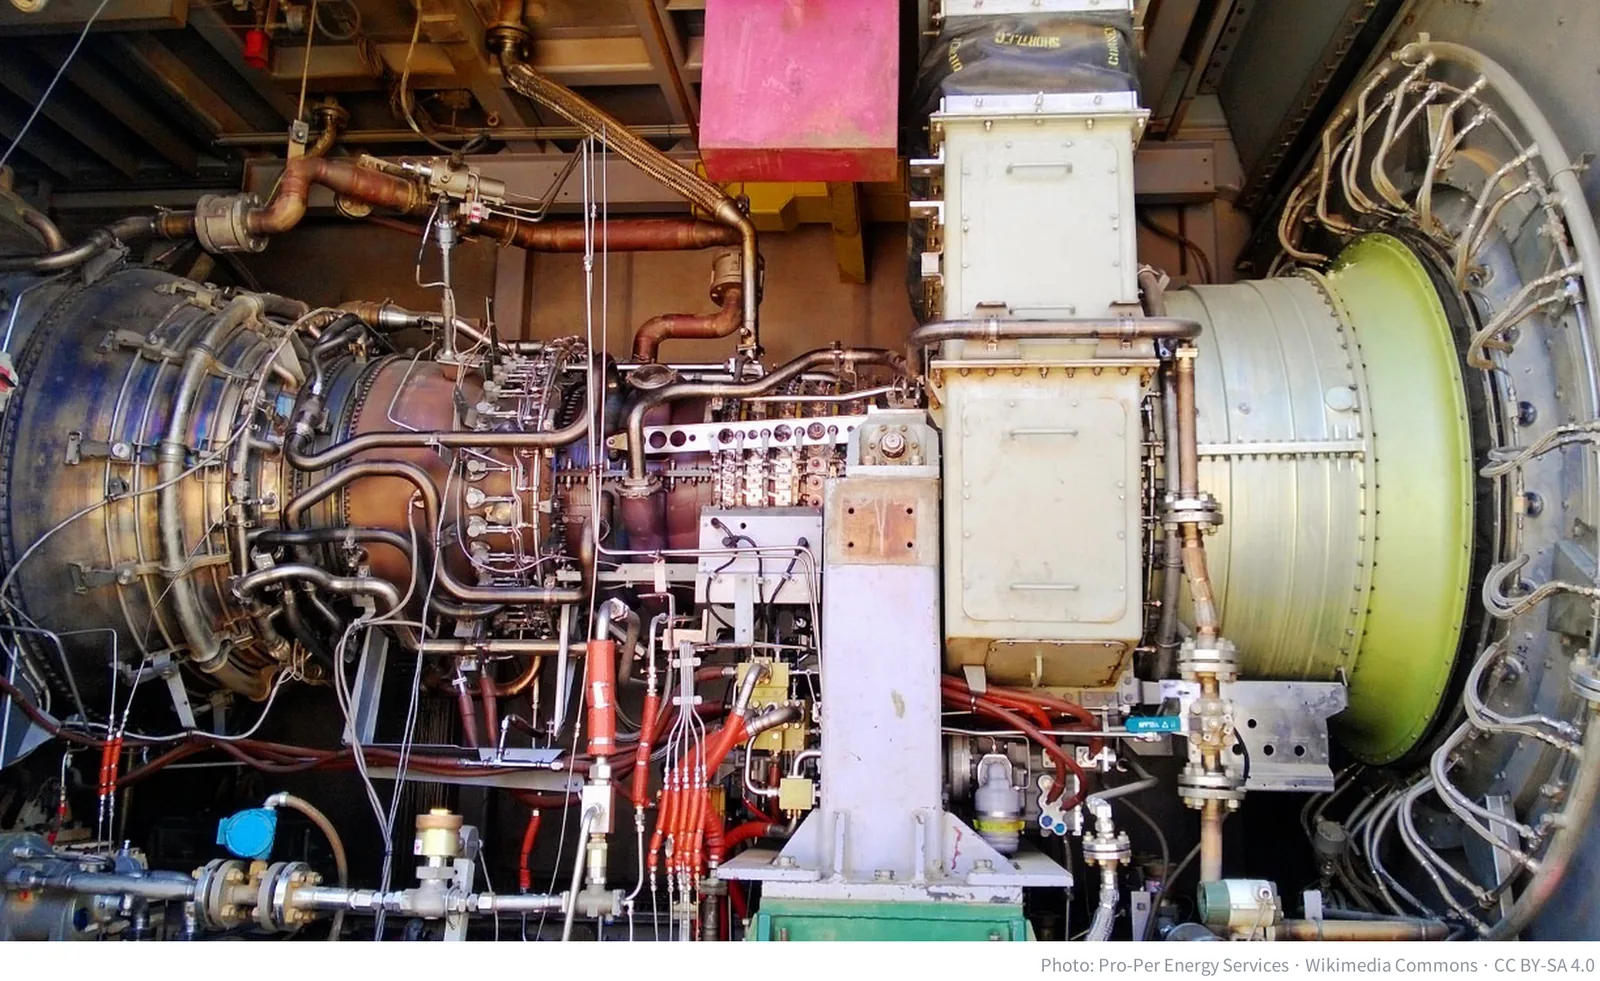
So the power sources that can be built quickly are solar and batteries. Of the 86GW of US capacity planned for 2026 tallied by EIA, solar is 43.4GW, batteries 24GW, wind 11.8GW and gas 6.3GW (EIA, February 20, 2026). Solar and batteries make up 79% (author’s calculation). Capacity actually added in 2025 was 53GW, so the planned volume rose sharply in a year. Construction times are short and there is no need to wait for turbines.
Data centers are pushing demand up
Power demand has risen this fast because of data centers. In February 2026 the Electric Power Research Institute (EPRI) estimated that data centers will use 9% to 17% of US electricity in 2030. The North American Electric Reliability Corporation (NERC) expects summer peak demand to rise by 224GW over the next ten years. EIA said US electricity consumption in the third quarter was 4% higher than a year earlier and expects consumption in the commercial sector, which includes data centers, to grow another 2.8% in 2027 (EIA Short-Term Energy Outlook, October 6). Third-quarter residential consumption rose 6% and commercial 5%, and total US generation rises from 4,545bn kWh in 2026 to 4,613bn kWh in 2027. Data center owners are also signing more contracts to buy power directly. In January 2024 Microsoft signed a module and installation agreement with Hanwha Qcells for 12GW through 2032 (about 1.5GW a year), and on August 20, 2026 the two widened the partnership to add generating capacity together (Solar Power World, Hanwha press release).
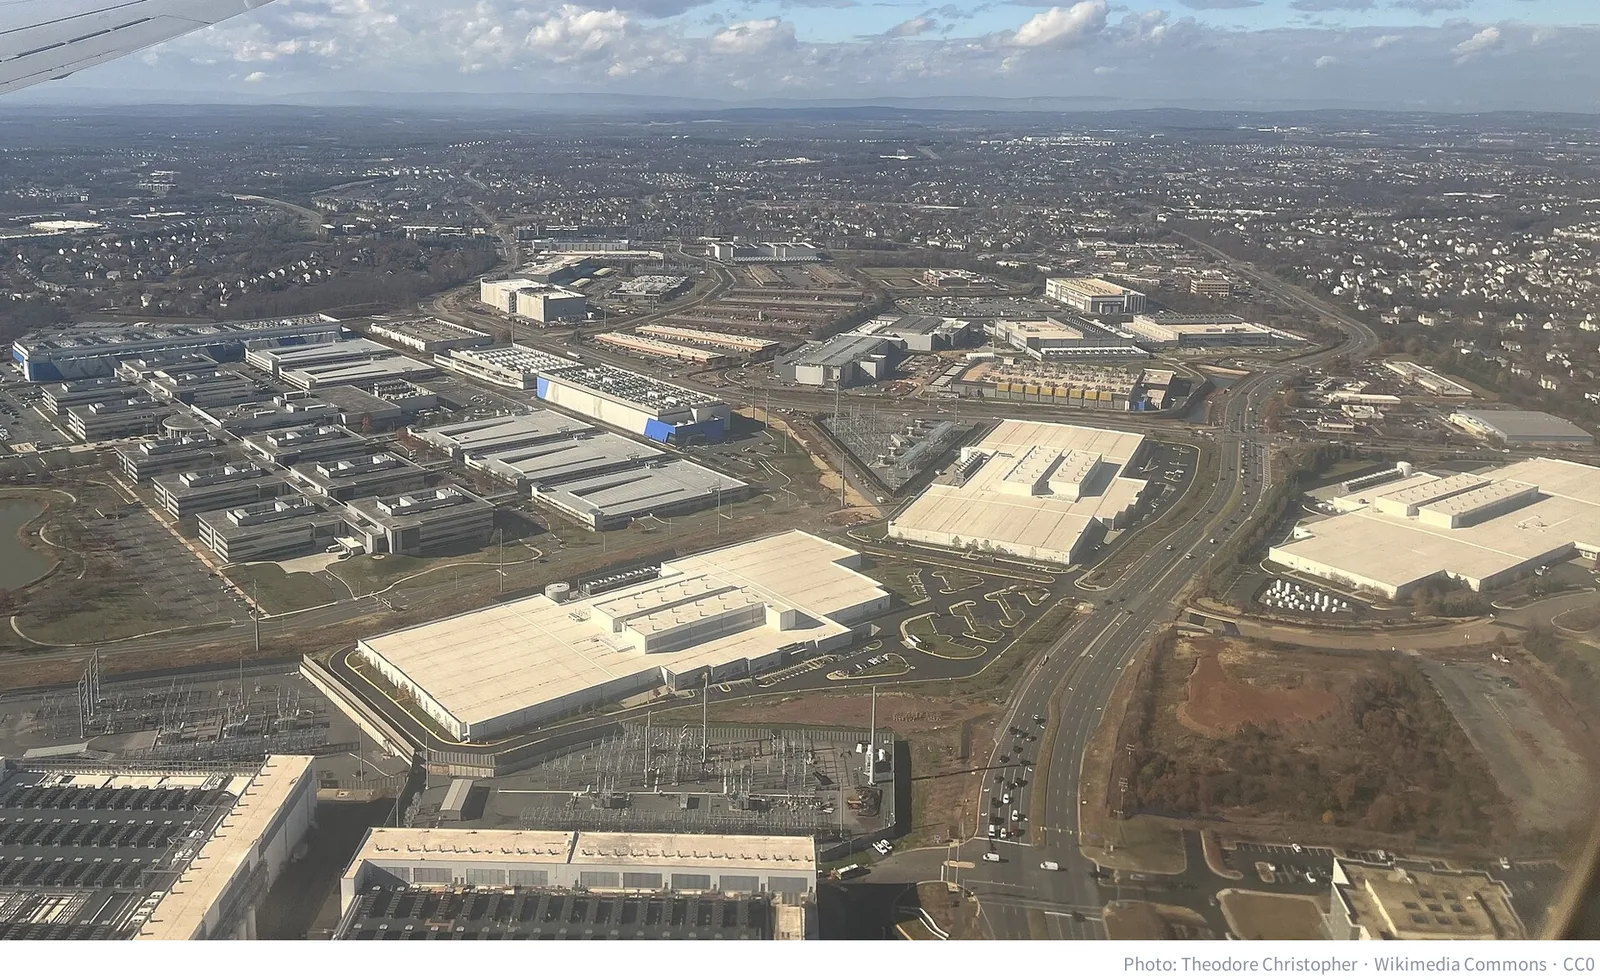
So the US needs solar. Power users are growing fast, gas-fired generation struggles to get turbines through 2030, and what fills the gap fastest is solar and batteries. The next question is when it is needed most.
7. The need peaks in 2027 and does not fall much through 2030
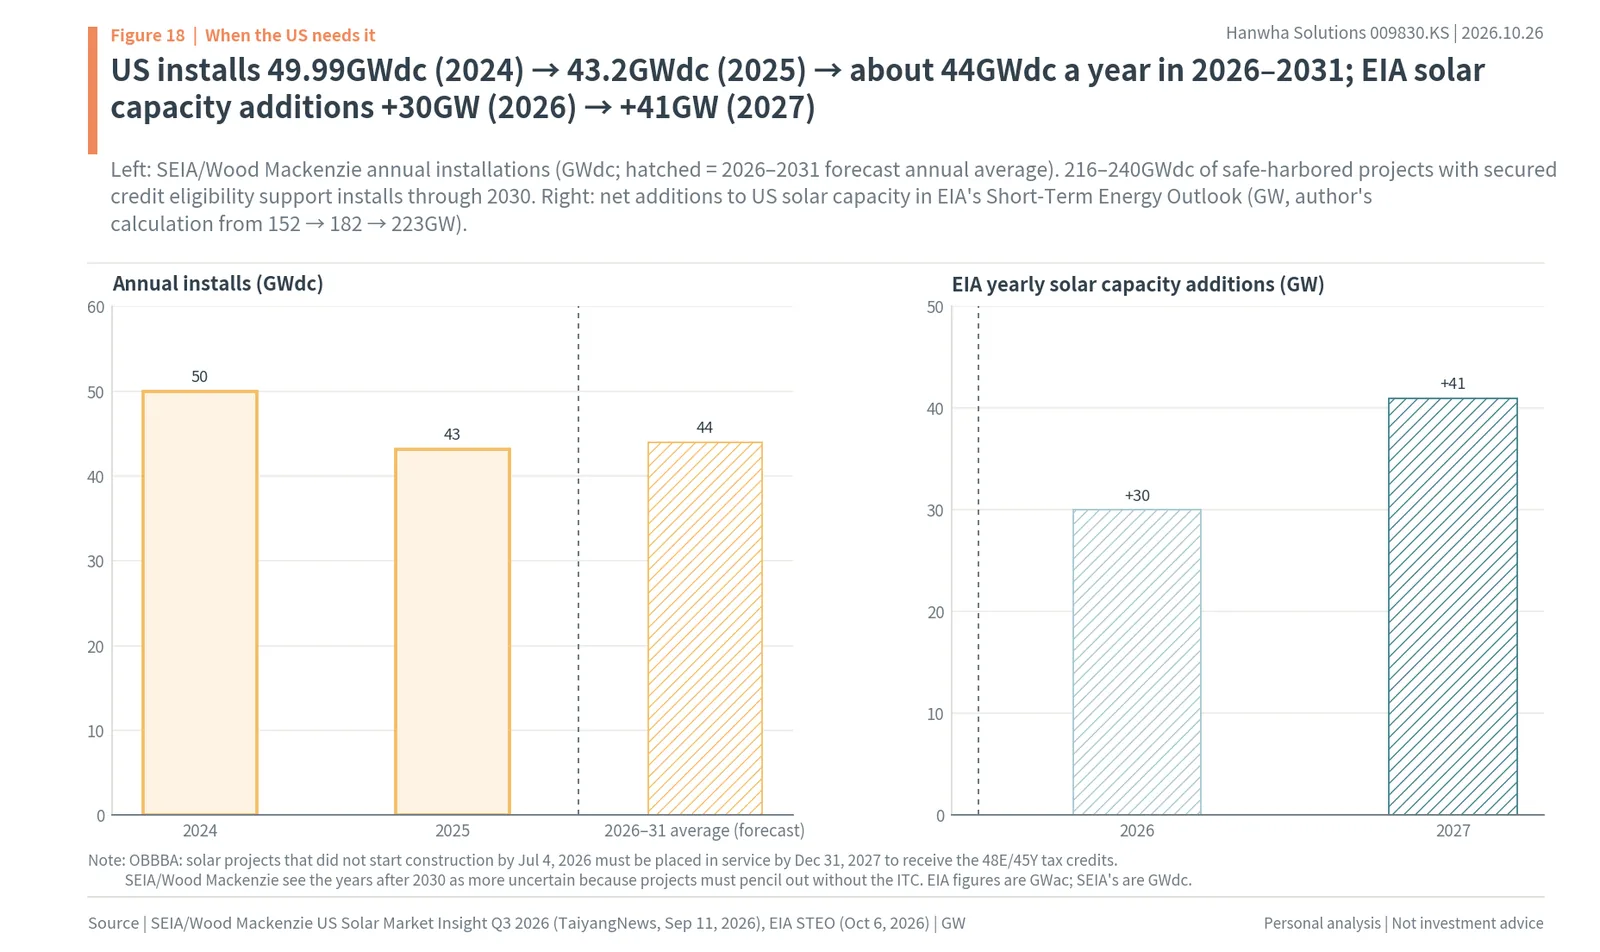
Installations continue at around 44GWdc a year
US solar installations peaked at 49.99GWdc in 2024 and fell to 43.2GWdc in 2025 (SEIA). In 2026, 19.2GWdc was installed in the first half alone; second-quarter installations were 11.4GWdc, up 45% from a year earlier, and utility-scale projects within that were 9.6GWdc, up 61%. Residential installations were 995MWdc, the lowest in five years. SEIA and Wood Mackenzie expect about 44GWdc a year of installations from 2026 to 2031, with cumulative capacity passing 545GWdc by 2031 (Q3 2026 report, TaiyangNews, September 11). Residential falls 23% in 2026 and grows again from 2027, because the tax credit for homeowners who buy rooftop solar (Section 25D) ended at the end of 2025. Hanwha’s US residential energy sales were also far lower, at KRW 262bn in the first quarter of 2026 and KRW 272bn in the second against KRW 594bn and KRW 478bn a year earlier (iM Securities). So the weight of Hanwha’s US business is moving from residential to utility-scale and to cells. Commercial installations fall about 7% a year in 2026 and 2027 and grow again in 2028 to 2030 as safe-harbored projects are completed, while community solar is about 1.7GWdc in 2026 and falls about 12% a year from 2028 (SEIA, Wood Mackenzie). In every segment, what supports 2027 to 2030 is projects that qualified before the deadlines.
What supports this outlook is projects that have already secured credit eligibility. “Safe-harbored” volume, from projects that began construction before the deadline to qualify for the tax credits, is 216 to 240GWdc and supports installations through 2030. The same report says the years after 2030 are harder to forecast because projects must make economic sense without the investment tax credit (ITC).
Why 2027 is the most urgent: the in-service deadline
The One Big Beautiful Bill Act (OBBBA), passed in July 2025, put deadlines on the wind and solar tax credits (48E and 45Y). Projects that did not begin construction by July 4, 2026 must be placed in service by December 31, 2027 to receive the credit. Projects that began construction have four years to be placed in service: by the end of 2029 for a 2025 start and the end of 2030 for a 2026 start (Foley, August 15, 2025). Projects racing to be in service before the deadline pile up in 2027.
The threshold for counting as having begun construction also widened. In August 2025 the Treasury, in Notice 2025-42, said large solar projects count as having begun construction only after physical work, and kept the “5% safe harbor,” which counted spending 5% of the cost as beginning construction, only for small projects of 1.5MW or less. But in June 2026 a federal district court vacated the notice as an arbitrary change to a long-standing standard without explanation and sent it back to the IRS (Orrick, June 12, 2026). If the ruling stands, projects that spent 5% before the July 4 deadline also qualify for the credit. The more projects qualify before the deadlines, the thicker the floor under installations in 2027 to 2030.
EIA draws the same picture. EIA’s Short-Term Energy Outlook (October 6) puts US solar capacity at 152GW in 2025, 182GW in 2026 and 223GW in 2027. Annual additions grow from +30GW in 2026 to +41GW in 2027 (author’s calculation, in alternating-current GWac). 2027 is the year of the largest increase in the forecast period.
The manufacturing credit stays full through 2029, then shrinks
The manufacturing credit Hanwha receives (45X) follows a different clock. The credit for solar components is paid in full through 2029, then falls to 75% in 2030, 50% in 2031 and 25% in 2032 before ending (KPMG, January 12, 2026). In exchange, a cap was put on the share of materials bought from “prohibited foreign entities.” The share of direct material costs bought from non-prohibited sources must be at least 50% in 2026, 60% in 2027, 70% in 2028, 80% in 2029 and 85% from 2030 (Troutman, Notice 2026-15). On the trade side, antidumping and countervailing duty orders on cells from India, Indonesia and Laos are due around November 2 (S&P Global), and a Section 232 minimum import price takes effect on December 4.
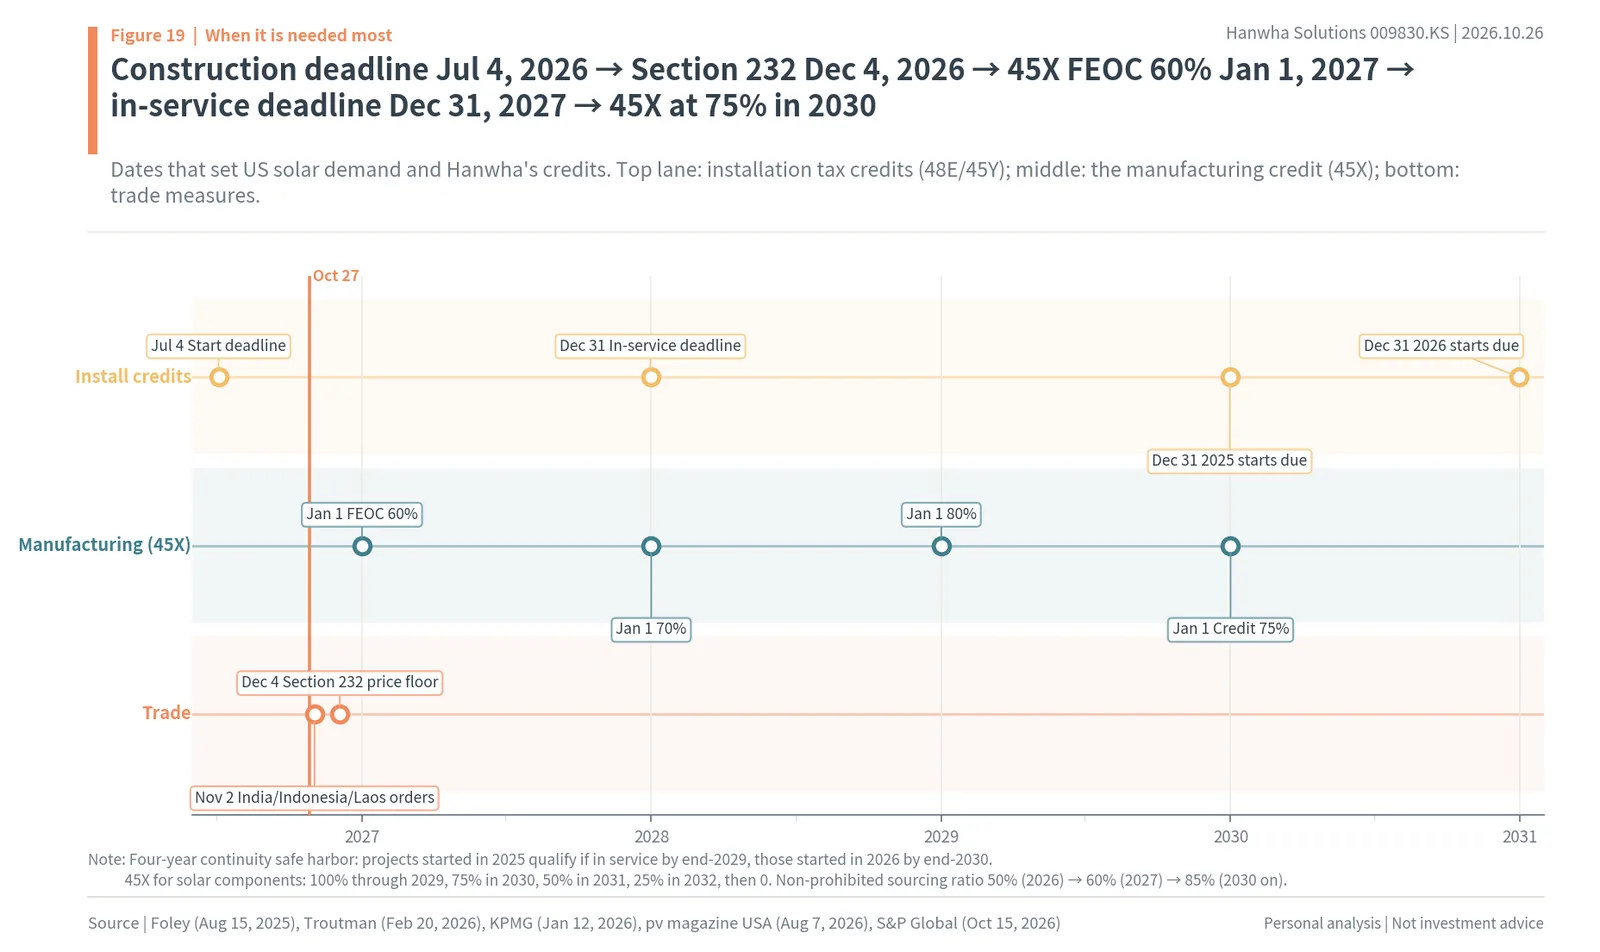
So the US needs solar most in 2027, and projects that have already qualified keep demand from falling much through 2030. That overlaps with the years Hanwha receives the full credit (through 2029). Who supplies the panels then decides Hanwha’s advantage.
8. The supply bottleneck is cells, and Hanwha has nearly a third of US cells
Many module plants, few cell plants
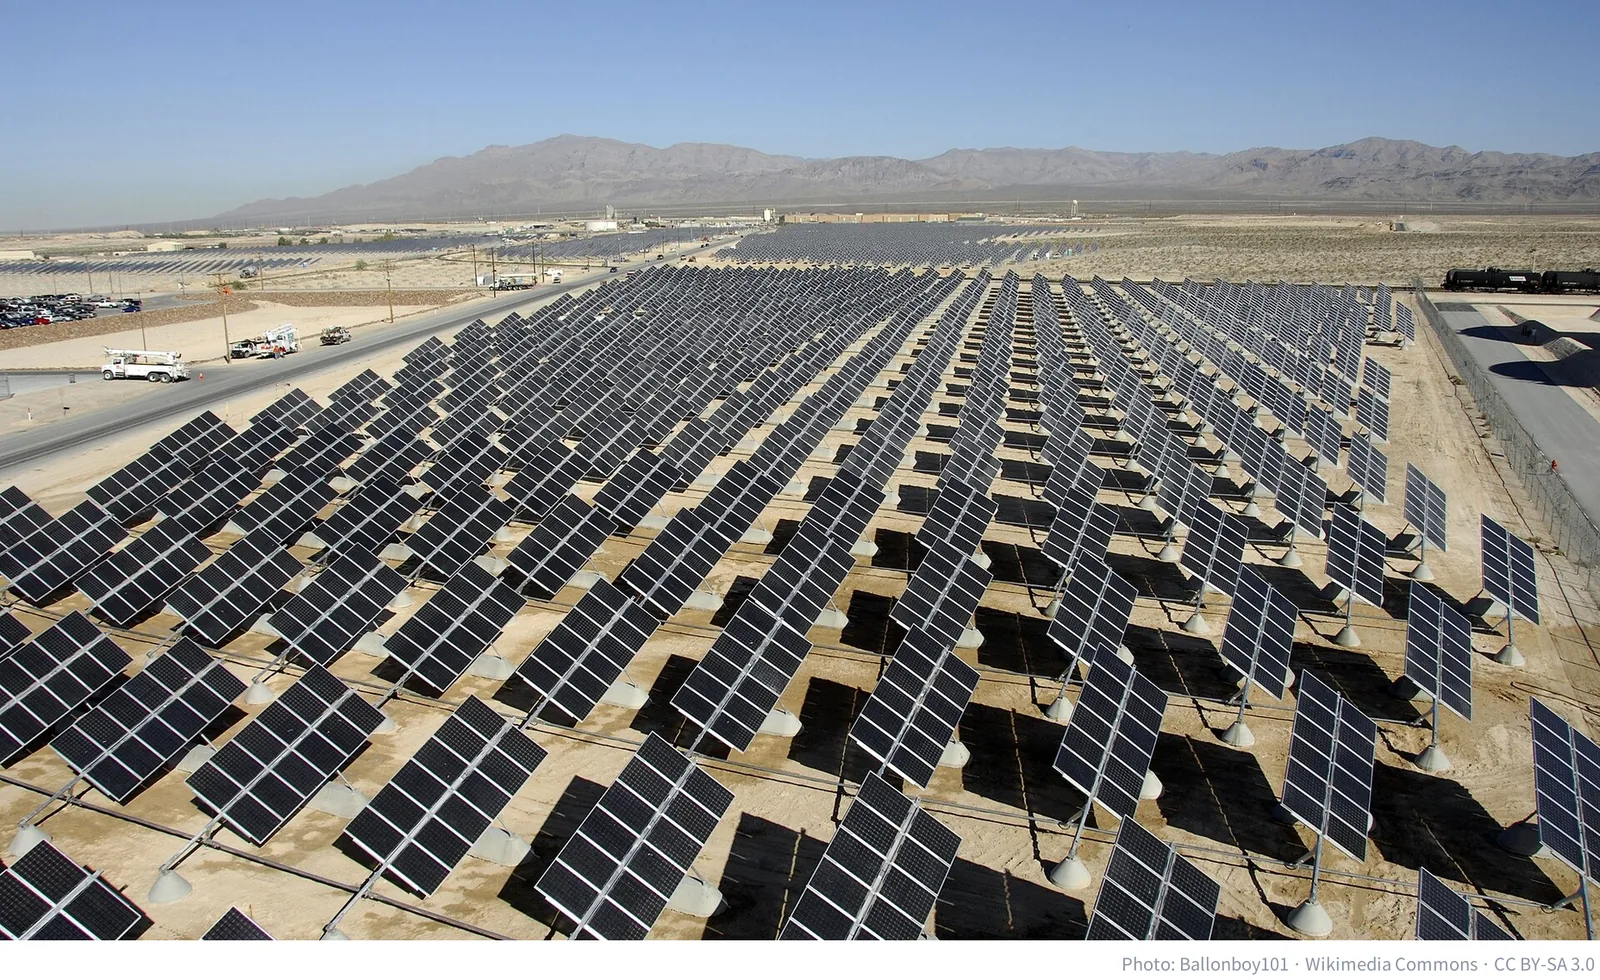
Who makes the panels for the new solar power plants being built in the US? Looking at modules alone, the US is already a big producer. By SEIA’s count, 75.3GW of module capacity was running in the US in September 2026, more than a year’s installations of about 44GWdc. But the capacity to make the cells inside those modules is only 10.6GW. Cell capacity is about a seventh of module capacity. Even counting plants under construction or announced, US cell capacity is expected to be 20.5GW at the end of 2027 (pv magazine USA). Most modules assembled in the US use imported cells.
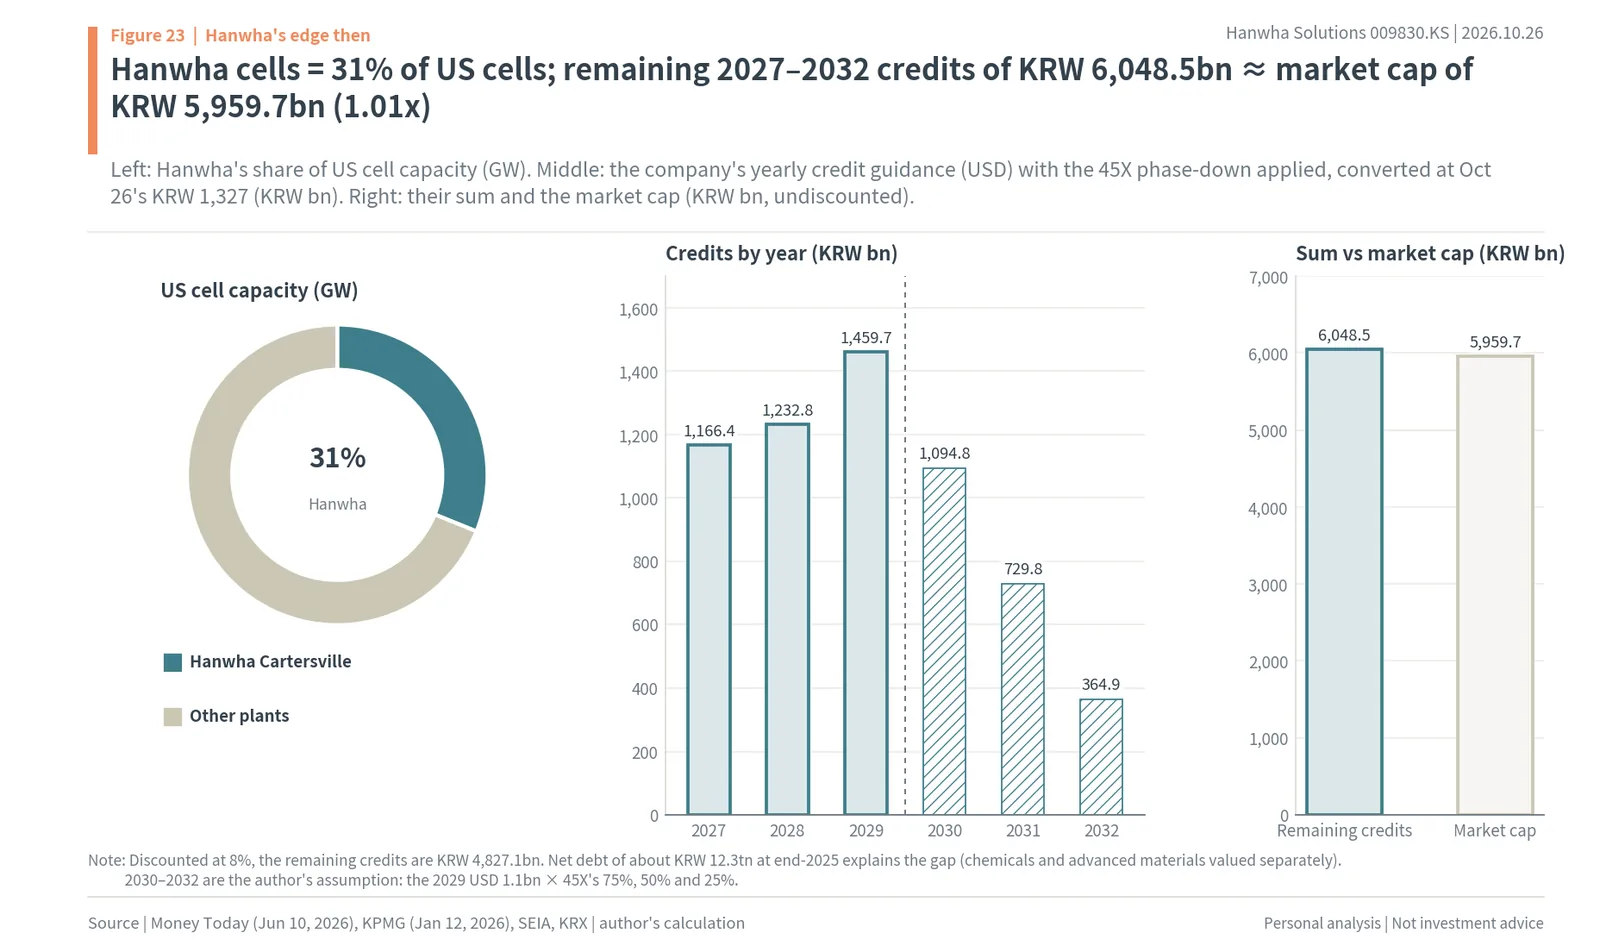
Within this narrow door, Hanwha’s 3.3GW at Cartersville is 31% of US cell capacity (author’s calculation). The other cell plants are ES Foundry in South Carolina at 3GW, Canadian Solar in Jeffersonville, Indiana, which started its first 2.1GW phase in July (targeting 6.3GW in the first half of 2027), and T1 Energy’s 2.1GW plant in Austin, Texas, which targets first output in the fourth quarter. Since a December 2025 reorganization, Canadian Solar’s US arm is 75.1% owned by its parent and 24.9% by China-listed subsidiary CSI Solar. Cartersville is the only place that also makes ingots and wafers in the US. First Solar, the largest US solar manufacturer, makes thin-film modules rather than silicon cells and so takes a different path around the cell bottleneck; its backlog was 45.1GW at the end of June 2026 (pv-tech). In the market for modules that use silicon cells, only a handful of companies can supply US-made cells in volume.
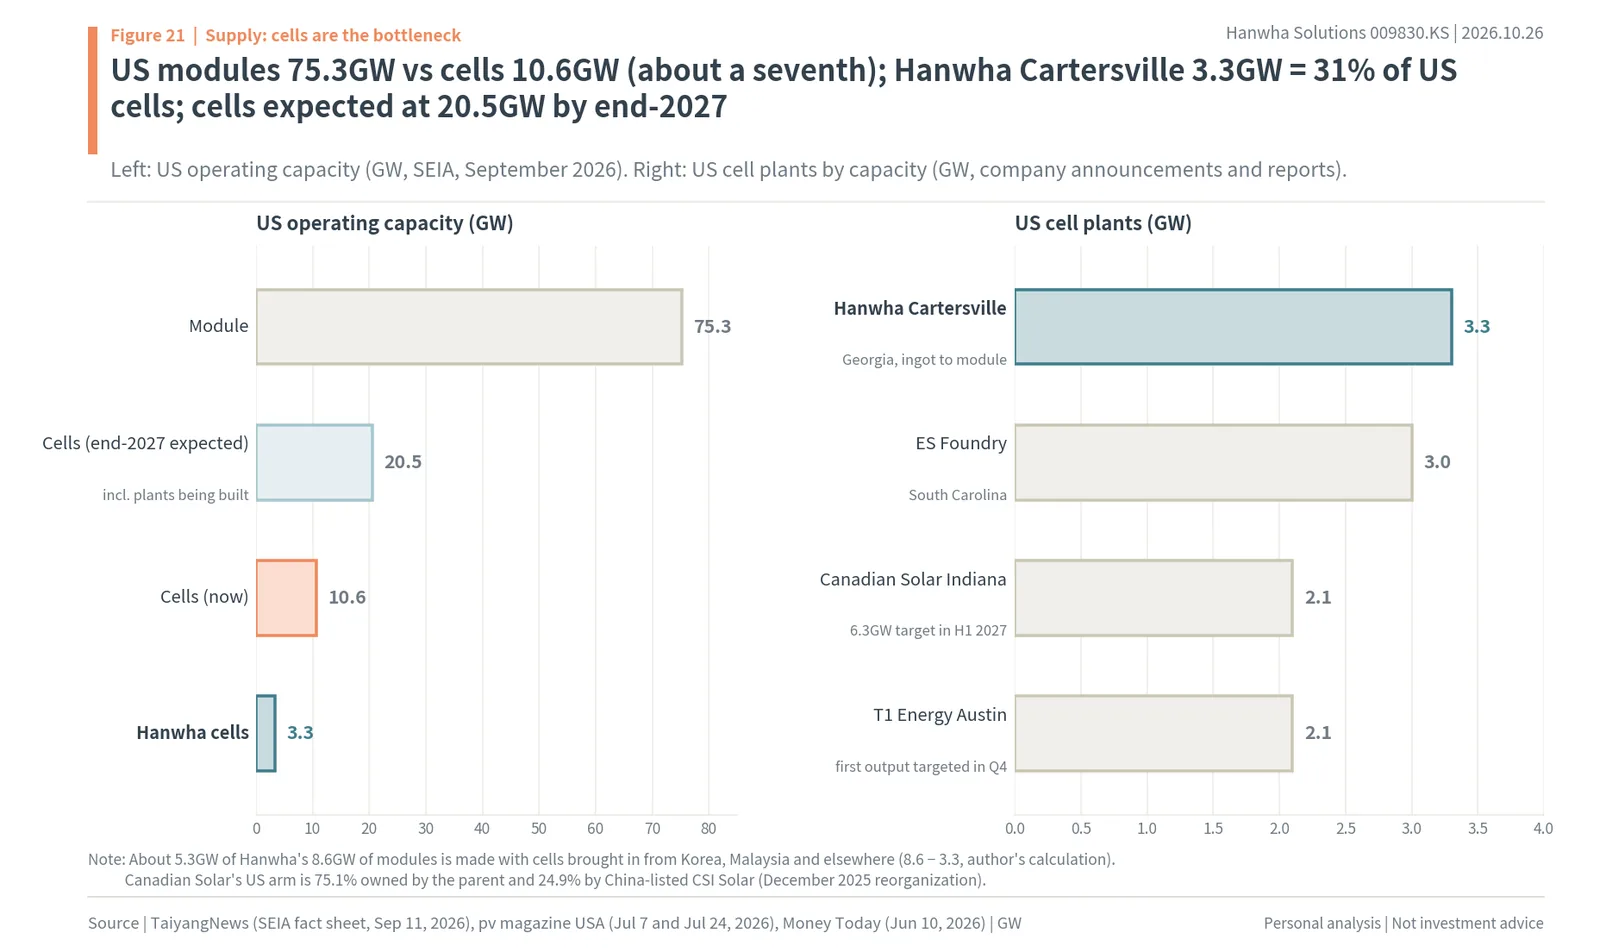
Cells are short inside Hanwha too. Of its 8.6GW of modules, 3.3GW can be filled with Cartersville cells, and the remaining roughly 5.3GW is made with cells brought in from Korea, Malaysia and elsewhere (author’s calculation). The more Hanwha’s cell plant runs, the larger the share of modules made with US cells.
Its materials and customers are also kept apart from the Chinese supply chain. Hanwha signed a 10-year, USD 1.2bn polysilicon supply contract with OCI Holdings’ Malaysian unit running from July 2024 to June 2034 (Dealsite). On October 20, responding to China’s draft export controls on solar technology, Hanwha Solutions said Chinese companies are its competitors rather than its partners and that its US solar production system was not built on technology transferred from China (iNews24). Hanwha Qcells’ share of the US residential module market was 38.5% in 2025 and of the commercial market 15.5% (Wood Mackenzie, cited by Money Today). In February 2026 it agreed with LG Energy Solution Vertech to use 5GWh of US-made batteries in Qcells installation projects in 2028 to 2030, so it is also building solar plants with batteries attached (pv magazine USA).
Modules made with US cells sell for more
Because cells are short, modules made with US cells carry a premium. By Anza’s count, in August 2026 imported modules sold for 27.1 cents per watt and US-assembled modules with imported cells for 30 cents, while modules made in the US with US cells sold for 47 cents. A high share of US-made components makes it easier for developers to earn a 10pp bonus on the investment tax credit (the domestic content adder, DCA). The company also said in July that Cartersville products earn a premium because of the DCA.
From December 4 the floor under imports rises. The Section 232 proclamation puts a 15% tariff on imports of polysilicon and derivative products and sets minimum import prices of USD 21 per kg for polysilicon, USD 100 per kg for ingots and wafers, USD 0.22 per watt for cells and USD 0.38 per watt for modules (pv magazine USA, August 7). Anza expects imported modules to cost about 38 cents afterwards, US modules with imported cells about 43 cents and US-cell modules 56 to 62 cents. DB Securities also said the module minimum import price was set higher than expected, so 2027 selling prices could rise. The price gap with imports narrows, but the way opens for the price of US-cell modules itself to rise. Once the “pre-tariff imports” described in chapter 4 are sold, these prices start to show.
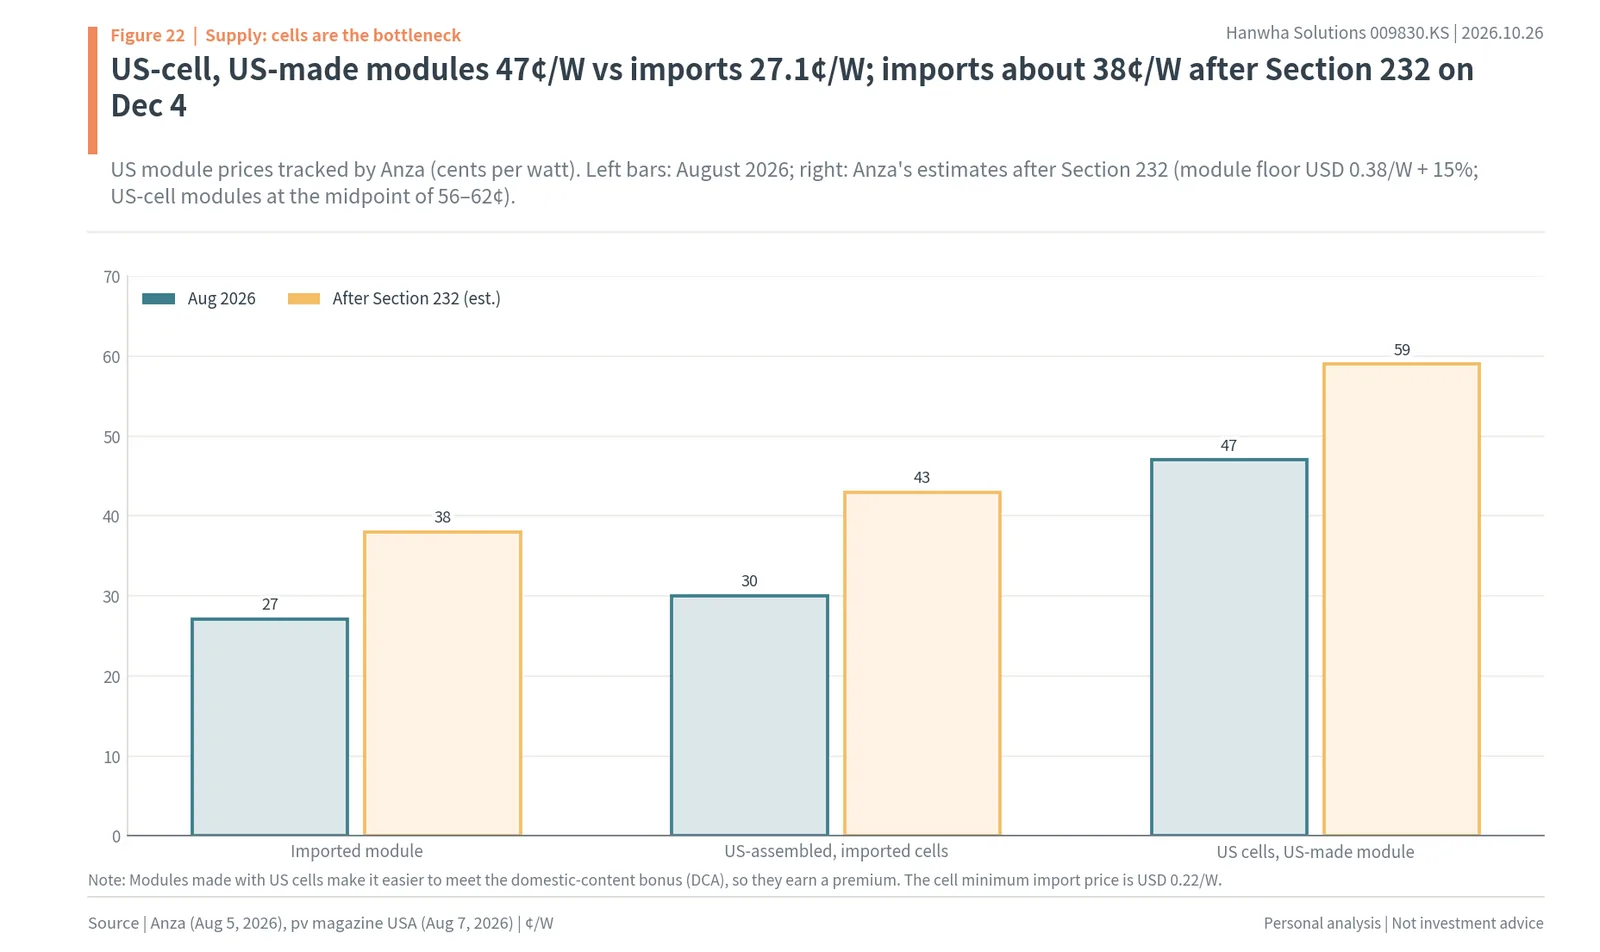
So when the US needs solar most in 2027, Hanwha holds nearly a third of the scarcest part, the cell. That this weapon still runs at only half was the story of chapter 4.
9. All the credits still to come add up to about today’s market value
KRW 6.0tn of remaining credits, KRW 6.0tn of market cap
The company’s yearly credit outlook given in June is USD 675mn in 2026, USD 879mn in 2027, USD 929mn in 2028 and USD 1.1bn in 2029 (Money Today, June 10, 2026). Because 45X steps down to 75%, 50% and 25% from 2030, the 2029 value was multiplied by those ratios to extend the series to 2032 (author’s assumption). The total for 2027 to 2032 is USD 4,558mn, or KRW 6,048.5bn at the October 26 rate of KRW 1,327. By year it is KRW 1,166.4bn in 2027, KRW 1,232.8bn in 2028, KRW 1,459.7bn in 2029, KRW 1,094.8bn in 2030, KRW 729.8bn in 2031 and KRW 364.9bn in 2032 (author’s calculation).
Hanwha Solutions’ market value on the same day was KRW 5,959.7bn (about $4.49bn). As chapter 8 showed, Hanwha holds 31% of US cell capacity, and those cells and modules generate this credit. The simple undiscounted sum of the remaining credits, KRW 6,048.5bn, is 1.01 times the market value. Discounted at 8% a year it is KRW 4,827.1bn (author’s calculation). Either way, the market is giving almost no value to the chemicals and advanced materials businesses or to the solar business outside the credit. Per share, the 2027 credit alone is about KRW 5,186, roughly a fifth of the October 26 closing price of KRW 26,500 (author’s calculation, 224.89 million common shares).
Debt explains the gap
What hides the value of the other businesses is debt. At the end of 2025 net debt was KRW 12.31tn (about $9.28bn) and the debt-to-equity ratio 193% (Q4 2025 earnings materials). Korea Ratings and NICE Investors Service have had a negative outlook on the company’s AA- rating since December 2024 (BizWatch). Interest-bearing debt was KRW 15,726.1bn at the end of June 2026 (WISEreport). The 2026 rights offering issued 53 million shares at KRW 22,100 to raise KRW 1,171.3bn, of which KRW 907.7bn is for capital spending and KRW 263.6bn for repaying debt. The money that comes in as credits goes first to paying interest and reducing debt.
On the consensus, that is 8.9 times 2027 forward EPS of KRW 2,972 and 0.57 times expected 2027 book value per share of KRW 46,868 (WISEreport, author’s calculation). Consensus operating profit rises from KRW 878.8bn in 2026 to KRW 1,298.7bn in 2027 and KRW 1,466.8bn in 2028, and EPS from KRW 2,077 to KRW 2,972 and KRW 3,591. The path brokers have drawn is the same as credits growing every year. If the credits come in as planned and the plants run fully, the value of the other businesses that the market now treats as zero and the debt reduction show up in turn. If the plants are late, less credit comes in and debt falls more slowly. The speed at which credits arrive is the speed at which debt falls and at which the other businesses’ value shows. So the next chapter looks at when the reasons for the drop get resolved, by date.
10. The reasons for the drop are timing problems with dates attached
The day each reason is tested
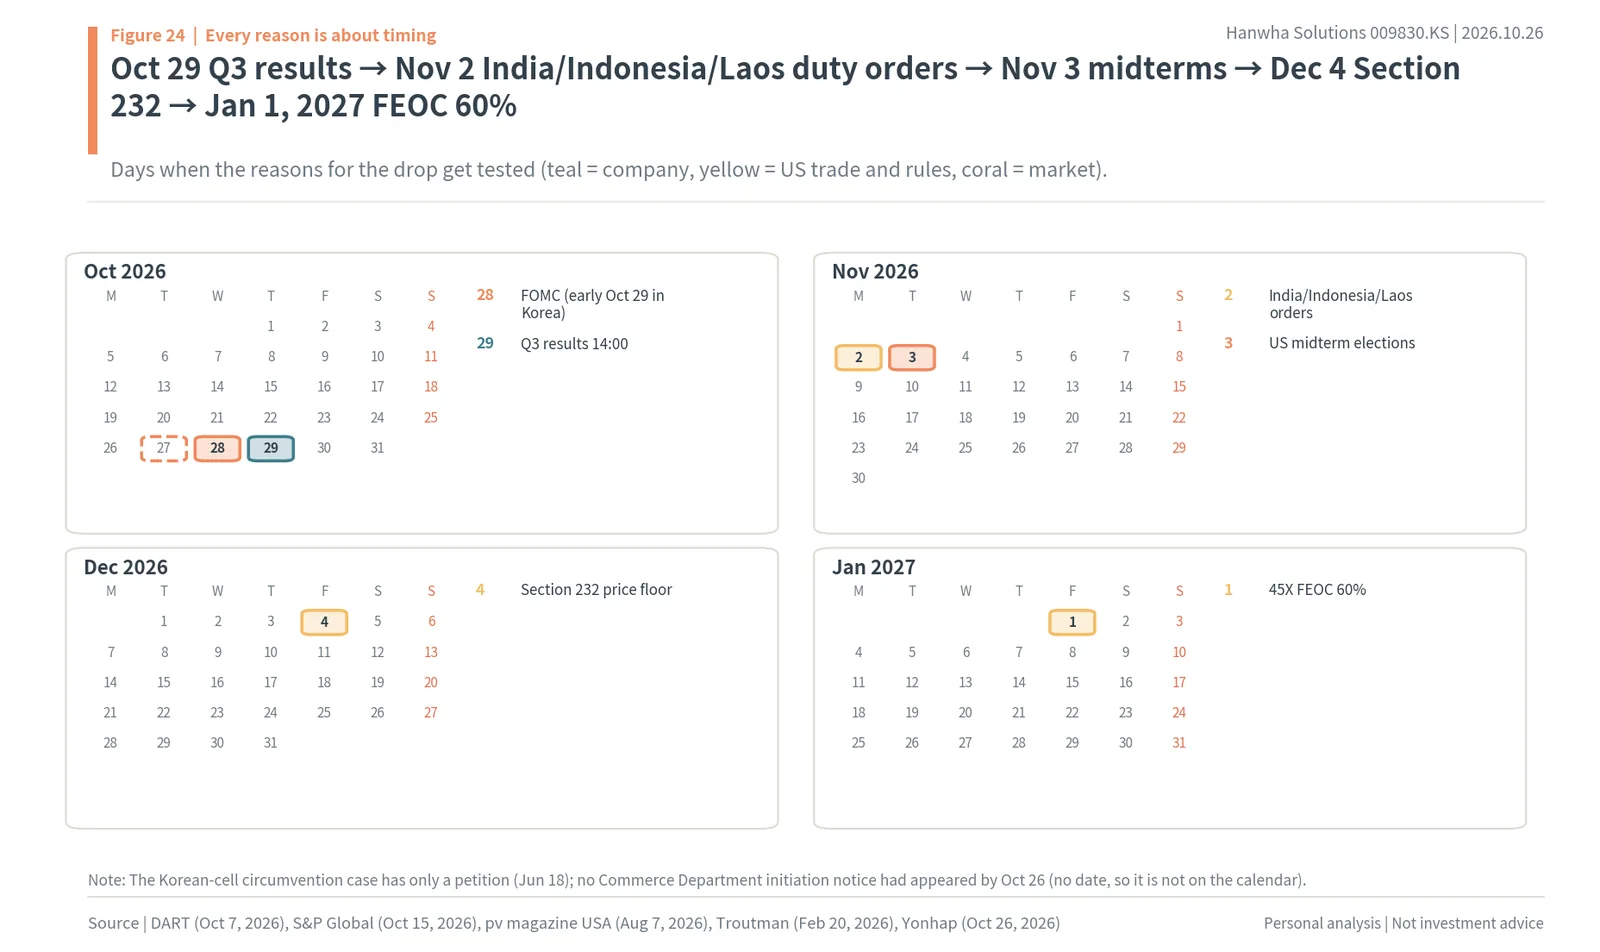
Of the four reasons in chapter 4, three have known dates. The third-quarter figures without the one-off tariff refund come out at the 2 p.m. results on October 29. The first check that day is whether the third-quarter credit matched the company’s KRW 230bn guidance and whether the fourth-quarter guidance of KRW 310bn holds. The fourth-quarter guidance was given at the end of July, when the July average exchange rate was KRW 1,489; at today’s KRW 1,327 it becomes about KRW 276.3bn (author’s calculation). Whether the company fills that gap with utilization will show at the same time.
The pre-tariff import inventory problem is checked by whether US module prices move toward the floor after the Section 232 minimum import price takes effect on December 4. Cartersville’s half utilization is checked by whether the company gives a date for full ramp-up and whether the fourth-quarter credit in the fourth-quarter results (January to February 2027) exceeds KRW 310bn. The company cannot control the strong won, but as shown above, the credit added by full ramp-up is more than four times what a KRW 100 move takes away.
The market reasons have dates too. The US rate decision comes early on October 29 Korea time, and the US midterm elections are on November 3. Meritz named the US International Trade Commission’s final determination on October 14, hopes of restoring the investment tax credit (ITC) after the November midterms, and the December 4 module minimum import price (USD 0.38 per watt) as fourth-quarter US policy catalysts (Liberty Korea Post, October 22). On trade, the US International Trade Commission (USITC) found injury from cells from India, Indonesia and Laos on October 14, and antidumping and countervailing duty orders are due around November 2. The antidumping rates are 123.04% for India, 94.36% for Indonesia and 65.43% for Laos (S&P Global, October 15). It is the second package of duties after Cambodia, Malaysia, Thailand and Vietnam in 2025 (pv magazine USA). On January 1, 2027 the 45X non-prohibited sourcing ratio rises to 60%. China’s draft ban and restrictions on exports of 12 solar technologies, published on October 16, are open for comment until November 15 (pv magazine); Hanwha Solutions’ position is that the direct impact is small because its US production system was not built on technology transferred from China.
One date not on the calendar
The circumvention case on Korean cells is not on the calendar. On June 18 AMER, a group of three companies including a Canadian Solar subsidiary, petitioned the US Commerce Department to investigate whether Korean cells circumvent the antidumping and countervailing duty orders on China, naming Hanwha Qcells first and also HD Hyundai Energy Solutions and Shinsung E&G. The petition is not a new antidumping case but a question of whether the existing China orders are being circumvented (pv magazine USA, June 23). In its July results the company said Commerce had not opened a formal investigation and that it has stronger grounds than in the 2023 case over its Malaysian plant. As of October 26 there was no notice in the Federal Register of an investigation into Korea. Whether one is opened is one of the signals that defines the “avoid situation” in the next chapter.
So the reasons for the drop are about timing, not breakage, and the days they get tested are fixed: October 29, December 4 and the full-ramp date. What numbers come out on those dates decides whether it is a situation in which buying makes sense.
11. Is it a buy situation? The answer is situations, not prices
Three situations and 2027 earnings in each
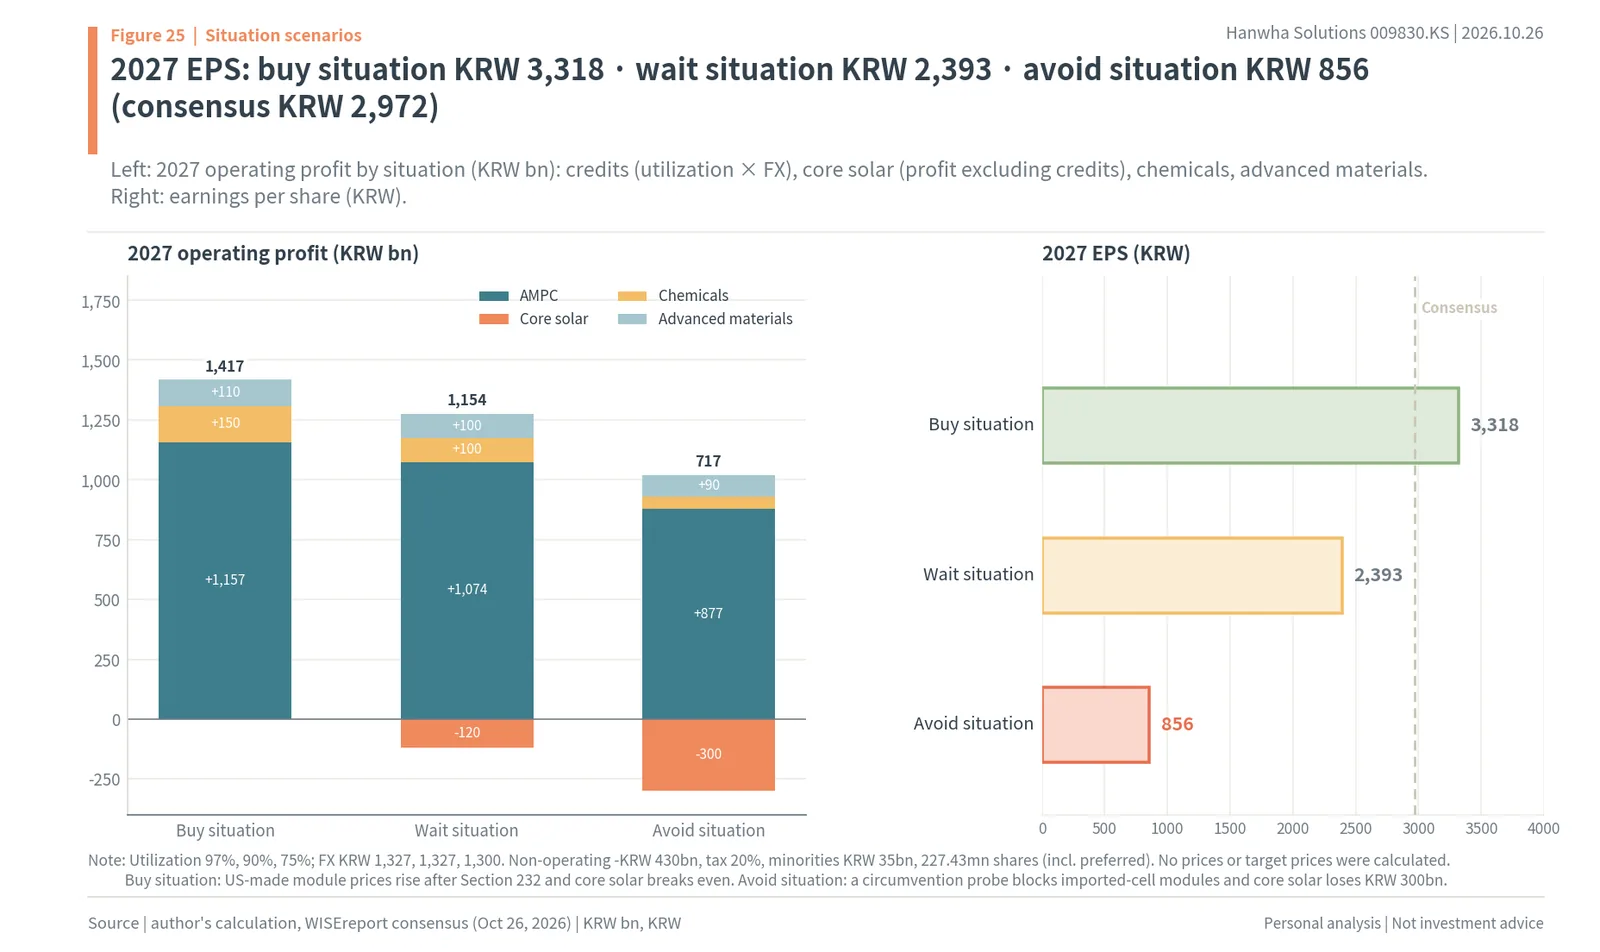
This chapter gives no buy price range and no target price. Instead it sets out, as conditions, what situation makes buying reasonable, what calls for waiting and what calls for avoiding, and attaches numbers only for how 2027 earnings would look in each. Earnings add the credit (plant utilization × exchange rate), the core solar business excluding the credit, chemicals and advanced materials, subtract non-operating items of KRW 430bn, tax at 20% and minority interests of KRW 35bn, and divide by 227.43 million shares (including preferred shares) (author’s calculation).
The buy situation is when, on October 29, the third-quarter credit comes in as guided, fourth-quarter guidance holds and a date for full Cartersville ramp-up is given, and US-made module prices start rising after December 4. In that case 2027 has utilization of 97% at KRW 1,327 per dollar for a credit of KRW 1,157bn, core solar at breakeven as prices rise after Section 232, chemicals at KRW 150bn and advanced materials at KRW 110bn, for operating profit of KRW 1,417bn and EPS of KRW 3,318. It is a picture of the core business recovering on top of the credit.
The wait situation is when the third quarter is as weak as expected but fourth-quarter guidance holds and only the full-ramp date is unclear. Then December module prices and the fourth-quarter report are watched too. 2027 has utilization of 90% for a credit of KRW 1,074bn, core solar at -KRW 120bn, chemicals at KRW 100bn and advanced materials at KRW 100bn, for operating profit of KRW 1,154bn and EPS of KRW 2,393.
The avoid situation is when two of the following coincide: fourth-quarter credit guidance is cut, the ramp-up slips again, or a circumvention investigation into Korean cells is opened. 2027 then has utilization stuck near the third-quarter guidance level at 75% and KRW 1,300 per dollar for a credit of KRW 877bn, core solar at -KRW 300bn as the circumvention case blocks modules made with imported cells, chemicals at KRW 50bn and advanced materials at KRW 90bn, for operating profit of KRW 717bn and EPS of KRW 856. The WISEreport consensus for 2027 EPS is KRW 2,972, between the buy and wait situations. With consensus set at 1, the buy situation is 1.12, the wait situation 0.81 and the avoid situation 0.29 (author’s calculation). Most of the earnings gap between the buy and avoid situations comes from the credit (utilization) and the core solar business outside it. How fully the same plant runs spreads earnings by nearly four times.
Eight signals that change the call
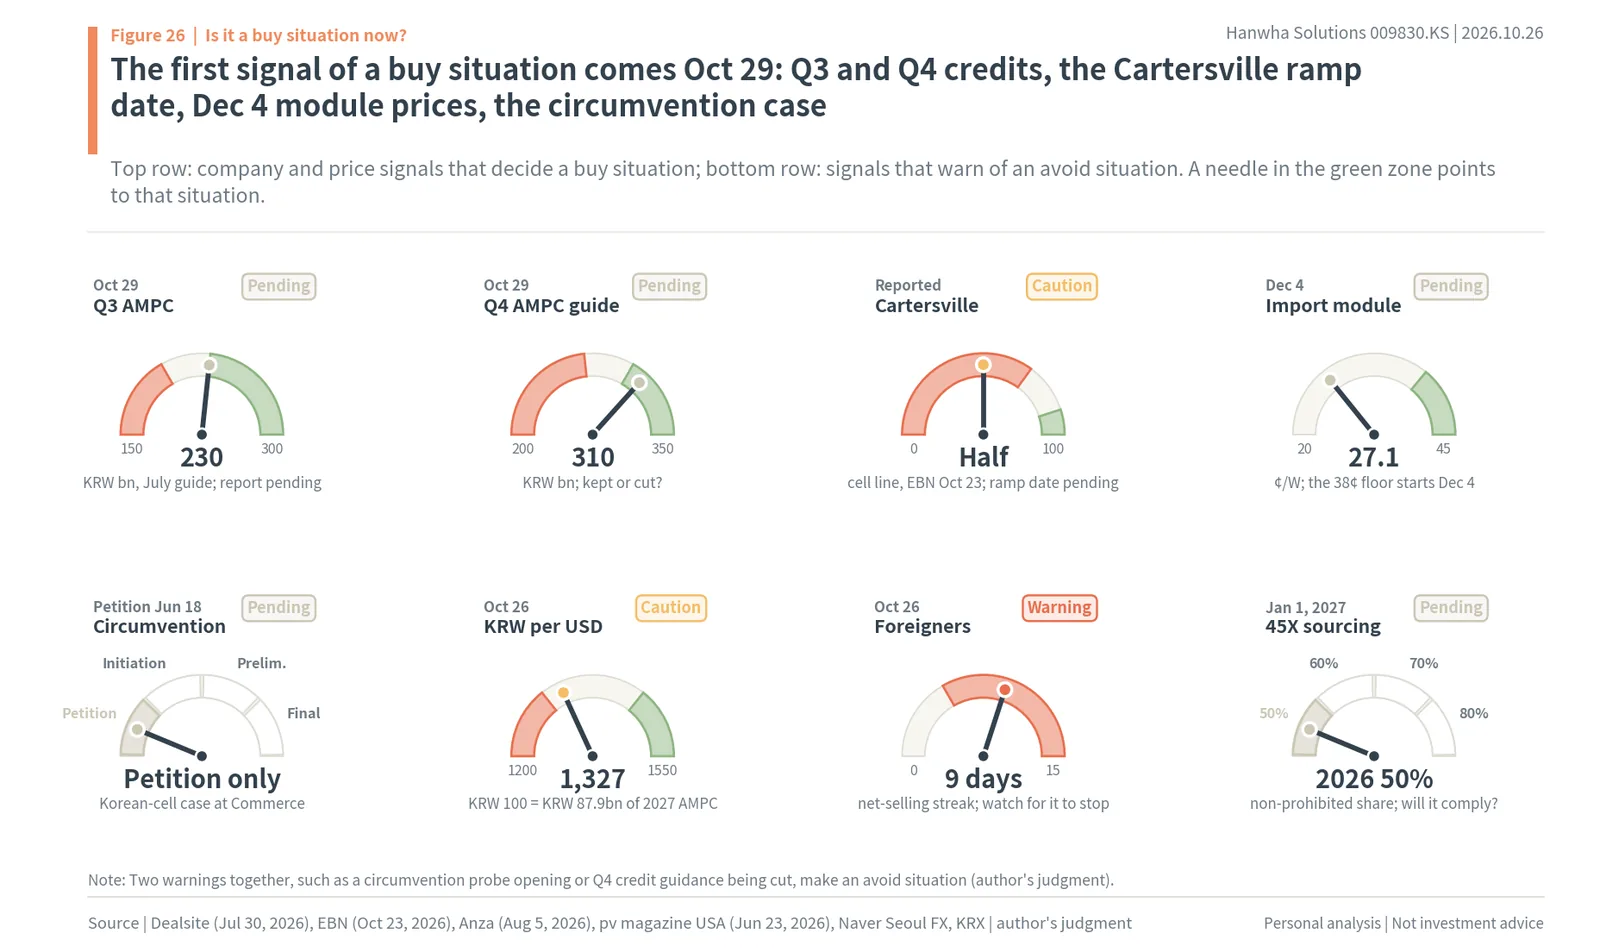
The signals that separate the situations are set out as eight gauges. The top row sets the buy situation: whether the third-quarter credit on October 29 (guidance KRW 230bn) and the fourth-quarter credit guidance (KRW 310bn) hold, when Cartersville cell utilization, reported at about half, reaches full ramp-up, and whether imported module prices (27.1 cents in August) rise toward the 38-cent floor after December 4.
The bottom row warns of the avoid situation: whether the Korean-cell circumvention case moves from petition to initiation, whether the won-dollar rate (KRW 1,327) falls further, whether foreigners’ selling streak (nine days) stops, and whether the company meets the 2027 45X non-prohibited sourcing ratio of 60%. If the top row moves into the green zone it is a buy situation; if two in the bottom row move into the red zone it is an avoid situation (author’s judgment).
Which investors return in each situation
The three situations also connect to investor flows. The July to October rebound was led by investment trusts (KRW 56.6bn), pension funds (KRW 47.0bn) and foreigners (KRW 42.1bn). If a buy situation arrives, whether those investors come back decides how fast the share price moves. In a wait situation, a market in which individuals take the shares, as now, is likely to continue, and in an avoid situation more of the shares foreigners bought (a net KRW 228.0bn over the year) could come out. That is why the foreign selling-streak gauge is read together with the earnings signals.
The signals arrive in order
The order of the signals is also fixed. First comes the 2 p.m. results on October 29, when the credit figures, fourth-quarter guidance and the full Cartersville ramp-up date come out together. Second come the duty orders on cells from India, Indonesia and Laos around November 2 and the midterm elections on November 3. Third are US module prices in the weeks after Section 232 takes effect on December 4. Fourth is whether the KRW 310bn guidance was met in the fourth-quarter results in January to February 2027. In between, the day foreigners’ selling streak stops is the first sign that the investors who led the rebound are coming back. The buy situation is complete when these signals point the same way, and the avoid situation is set when two bottom-row signals coincide.
The author’s view
The author sees this as a point at which to wait for the first signal of a buy situation. The reasons for the drop are not a breakdown of the US business but timing problems of plant ramp-up, inventory and a one-off; the US needs solar most in 2027; and at that point Hanwha holds nearly a third of the scarcest part, the cell. What remains is to see in numbers whether that plant runs fully, and the first number comes in the October 29 report. Demand peaks in 2027; the plant still runs at half.
12. Calculation basis
The numbers in this report come from only two places. Numbers taken from filings, articles and reports carry their source, and numbers the author calculated are marked “author’s calculation.” The calculations follow the basis below.
Share prices are KRX regular-session closes. For Hanwha Solutions the report uses KRX Data System prices (with values before the June 15 rights-offering ex-date adjusted to the KRX base price), and for OCI Holdings, HD Hyundai Energy Solutions and CS Wind market value ÷ listed shares. The pykrx price table close and Naver’s displayed price (KRW 26,450 on October 26, with a low of KRW 25,700) mix in Nextrade after-market trading and were not used. The reference close is KRW 26,500 (-6.85%) on October 26, 2026.
In the drop decomposition, the market part is Hanwha Solutions’ KOSPI beta (the regression slope of 187 daily returns from January 2 to October 12, 2026, 0.66) × that day’s KOSPI change. The sector part is the equal-weighted average of what remains for OCI Holdings, HD Hyundai Energy Solutions and CS Wind after removing each one’s market part with its own KOSPI beta, and the own part is Hanwha Solutions’ change minus the other two parts. The intraday move uses Naver one-minute prices (api.stock.naver.com) relative to the last regular-session value on October 23, with rows after 15:30 removed. The largest one-minute drop is the smallest difference between adjacent one-minute changes. The two-year chart indexes Hanwha Solutions and KOSPI to 100 at the October 28, 2024 close (the Korean edition also shows the stock ÷ KOSPI relative strength), and event numbers are attached only to days whose cause was confirmed by dated reports or filings.
Investor flows are KRX trading by investor type, net buying by value. The phases are offering to low (July 1 to July 29), rebound (July 30 to October 6), first drop (October 7 to October 15), jump (October 16 to 19) and second drop (October 20 to 26), and phase returns are measured from the close of the day before each phase. Foreign ownership and the short-sale balance share are KRX published values, and ownership on July 30 uses the share count before the new shares were listed. The net-selling streak counts days of negative foreign net buying backwards from October 26.
The 2026 credit of about KRW 972bn adds the company’s quarterly figures (first and second quarters actual, third and fourth quarters from July guidance). The full-utilization annual credit is modules 8.6GW × USD 0.07 per watt + cells and wafers 3.3GW × (cells USD 0.04 per watt + wafers USD 12 per square meter, about 4.17 million square meters per GW at 24% efficiency) = about USD 899mn. Converting the third-quarter guidance of KRW 230bn to utilization (73%) assumes KRW 1,400 per dollar. The fourth-quarter guidance at today’s exchange rate (about KRW 276.3bn) is KRW 310bn × 1,327 ÷ 1,489 (July average, Yahoo Finance). The 2027 to 2032 credits extend the company’s dollar outlook (USD 879mn in 2027, USD 929mn in 2028 and USD 1.1bn in 2029) by applying the post-2030 45X step-down (75%, 50%, 25%) to the 2029 value, converted at the October 26 Seoul close of KRW 1,327. The discounted value uses 8% a year from the end of 2026. The effect of a KRW 100 move is USD 879mn for 2027 × KRW 100, and the extra credit at full ramp-up is the company’s about KRW 100bn a quarter × 4.
The change in foreign holdings is the difference in shares held in KRX foreign ownership data (29,576,977 shares on September 11 → 27,865,427 shares on October 26). For the won-dollar rate, calculations in the text use the Naver Seoul FX close (KRW 1,327 on October 26), and only the July average (KRW 1,489) and the June 10 value were taken from Yahoo Finance (KRW=X). The 15:30 rate in closing reports (KRW 1,321.1) was taken at a different time and was not used in calculations.
2027 earnings by situation are credit (full-utilization annual credit × utilization × exchange rate) + core solar + chemicals + advanced materials = operating profit; (operating profit – non-operating KRW 430bn) × (1 – 20% tax) – KRW 35bn minority interests = net profit to owners; ÷ 227.43 million shares (224.89 million common shares + preferred shares) = EPS. Utilization, exchange rate, core solar, chemicals and advanced materials values are the author’s assumptions. Buy prices, target prices and expected returns were not calculated.
PJM, GE Vernova, EIA, EPRI and NERC figures come from each organization’s press releases and the articles that reported them, and the SEIA and Wood Mackenzie Q3 2026 report was cross-checked against TaiyangNews and pv magazine coverage and a summary because the SEIA website would not open. The credit per share is the 2027 credit (KRW 1,166.4bn) ÷ 224.89 million common shares. The ratios of situation EPS to consensus are rounded to two decimal places.
US installations from SEIA and Wood Mackenzie are in direct current (GWdc) and EIA capacity in alternating current (GWac), so they were not added together. US cell and module capacity is from the SEIA fact sheet (September 2026), and Hanwha’s share is Cartersville’s 3.3GW ÷ 10.6GW. Module prices are Anza’s figures, and the post-Section 232 price of US-cell modules is drawn at the midpoint (59 cents) of Anza’s 56 to 62 cent range.
Hanwha Solutions, the October drop and US solar demand: frequently asked questions
Q. Why did Hanwha Solutions stock fall in October 2026?
From October 6 to October 26, 2026 Hanwha Solutions fell 28.4% while KOSPI fell 21.2% on US inflation and interest rates, doubts about AI investment and Middle East tension. Split with a KOSPI beta of 0.66, its -6.85% on October 26 was market -1.0pp, solar sector -7.0pp and its own part +1.1pp, and on all three days it fell close to 10% its own part was positive. The solar sector was sold together ahead of the third-quarter report on October 29.
Q. Why does Hanwha Solutions’ third quarter of 2026 look weak?
The WISEreport consensus for third-quarter operating profit is KRW 203.4bn, 33.6% below the second quarter’s KRW 306.5bn. But second-quarter profit included a one-off US tariff refund of KRW 90bn (29.4% of it); without it the gap is only 6.1%. The other reasons are imports brought in before the tariffs delaying price increases (EBN), the Cartersville cell line running at about half while it ramps up and stabilizes (EBN, the company), and a stronger won (Meritz).
Q. What is AMPC and how much of Hanwha Solutions’ profit is it?
AMPC is the company’s name for the US Section 45X advanced manufacturing production credit, which pays USD 0.07 per watt for modules, USD 0.04 per watt for cells and USD 12 per square meter for wafers made in the US. Hanwha’s credit was KRW 218bn in the first quarter of 2026 and KRW 214bn in the second, with guidance of KRW 230bn and KRW 310bn for the third and fourth, about KRW 972bn in all. That is more than the 2026 operating profit consensus of KRW 878.8bn.
Q. When does the US need solar the most?
2027. Under the OBBBA, solar projects that did not begin construction by July 4, 2026 must be in service by December 31, 2027 to receive the 48E/45Y credits, and EIA’s capacity additions rise from +30GW in 2026 to +41GW in 2027. Safe-harbored projects of 216 to 240GWdc support installations through 2030. Demand is pushed by a power shortage: PJM’s 2028/29 auction was 6,831MW short, GE Vernova had only about 10GW of gas-turbine slots left for 2029 and 2030, and 79% of 2026 planned US capacity is solar and batteries.
Q. How large is Hanwha Qcells’ share of US solar cell capacity?
US module capacity was 75.3GW in September 2026 but cell capacity only 10.6GW, about a seventh. Hanwha’s 3.3GW Cartersville plant is 31% of US cell capacity and the only US plant that also makes ingots and wafers. Modules made with US cells sold for 47 cents per watt in August 2026 against 27.1 cents for imports, and Anza expects imports at about 38 cents after the Section 232 minimum import price takes effect on December 4.
Q. How do Hanwha Solutions’ remaining credits compare with its market value?
Applying the 45X step-down to the company’s dollar outlook, credits from 2027 to 2032 add up to USD 4,558mn, or KRW 6,048.5bn at KRW 1,327 per dollar, 1.01 times the October 26 market value of KRW 5,959.7bn. Discounted at 8% they are KRW 4,827.1bn. Net debt of KRW 12.31tn at the end of 2025 explains why the market gives little value to the other businesses.
Q. Is Hanwha Solutions a buy now?
The report answers with situations, not prices. A buy situation is credit guidance holding and a full-ramp date for Cartersville on October 29 plus US-made module prices rising after December 4, with 2027 EPS of KRW 3,318. A wait situation gives KRW 2,393, and an avoid situation, when two of a Q4 credit cut, another ramp-up delay and an opened Korean-cell circumvention probe coincide, gives KRW 856, against a consensus of KRW 2,972. The author sees the stock as waiting for the first signal, the October 29 report.
Sources
- MIT Technology Review, One-time solar giant Q-Cells to be sold off soon (link), Aug 27, 2012; PV Tech, Official: Hanwha Group strikes deal to acquire Q-Cells (link), Aug 2012; Recharge, South Korea’s Hanwha agrees to buy Q-Cells (link), Aug 2012
- DART, Hanwha Solutions, Notice of investor relations meeting (link), Oct 7, 2026; Results of rights offering (link), Jul 30, 2026; Subscription results and preliminary earnings, Jul 29, 2026
- Dealsite, Hanwha Solutions Q2 results and AMPC guidance (link), Jul 30, 2026
- iM Securities, Hanwha Solutions Q2 review (link), Jul 30, 2026
- Hanwha Solutions, Q4 2025 earnings presentation (link), Feb 5, 2026
- Money Today, Hanwha Qcells completes US Solar Hub, AMPC by year (link), Jun 10, 2026; Hanwha Solutions Q2 results (link), Jul 29, 2026
- Investing.com Korea, Use of proceeds of Hanwha Solutions’ rights offering (link), Jul 20, 2026
- BizWatch, Hanwha Solutions credit rating outlook, May 2026
- Korea Economic TV, DB Securities adjusts Hanwha Solutions estimates (link), Oct 15, 2026 07:10
- Liberty Korea Post, Meritz Securities Q3 outlook for Hanwha Solutions (link), Oct 22, 2026
- EBN, Hanwha Solutions module division Q3 outlook (link), Oct 23, 2026 13:04
- iNews24, Hanwha and OCI on China’s solar technology export controls (link), Oct 20, 2026 14:41
- Korea Economic Daily, Another “Black Thursday”: KOSPI and KOSDAQ plunge more than 7% (link), Oct 15, 2026 15:51
- Yonhap, KOSPI close (link), Oct 20, 2026 16:25; (link), Oct 26, 2026 16:11
- Newsis, Hanwha Solutions posts Q3 operating loss (link), Nov 5, 2025; Daum, Hanwha Solutions falls on KRW 2.4tn rights offering (link), Mar 26, 2026; Aju Business Daily, Solar stocks fall on US–China thaw (link), May 15, 2026; Etoday, Two setbacks for Hanwha Solutions (link), Jun 24, 2026
- PJM, 2028/2029 Base Residual Auction results (link), Jul 14, 2026
- Power Engineering, GE Vernova power equipment orders (link), Apr 23, 2026
- EIA, Short-Term Energy Outlook (link), Oct 6, 2026; Today in Energy, 2026 planned capacity additions (link), Feb 20, 2026
- EPRI, Data center load (link), Feb 26, 2026; POWER, NERC 2025 Long-Term Reliability Assessment (link), Jan 2026
- TaiyangNews, SEIA and Wood Mackenzie US Solar Market Insight Q3 2026 (link), Sep 11, 2026; pv magazine USA, 2025 Year in Review (link), Mar 11, 2026
- Foley, Treasury beginning-of-construction guidance for wind and solar (link), Aug 15, 2025; Troutman, FEOC material assistance guidance (link), Feb 20, 2026; KPMG, 45X (link), Jan 12, 2026; Orrick, Court throws out Notice 2025-42 (link), Jun 12, 2026
- pv magazine USA, SEIA manufacturing dashboard (link), Aug 27, 2026; US cell capacity (link), Jul 7, 2026; Canadian Solar Indiana cells (link), Jul 24, 2026; Section 232 (link), Aug 7, 2026; Korean-cell circumvention petition (link), Jun 23, 2026; Qcells and LG Energy Solution Vertech battery deal (link), Feb 5, 2026
- Anza, Section 232 solar tariffs add new price floor on modules (link), Aug 2026
- S&P Global, US finds solar imports from India, Indonesia, Laos threaten domestic factories (link), Oct 15, 2026
- WISEreport consensus (Oct 26, 2026), KRX Data System prices, indexes, trading by investor, foreign ownership and short selling (Jan 2026 to Oct 26, 2026), Naver one-minute prices (Oct 26, 2026), Naver Seoul FX close, Yahoo Finance (KRW=X), author’s calculations
- Photos: C.G. (CC BY-SA 3.0), Narubaru7 (CC BY 4.0), QCcomm (CC BY-SA 4.0), Pro-Per Energy Services (CC BY-SA 4.0), Theodore Christopher (CC0), Ballonboy101 (CC BY-SA 3.0), via Wikimedia Commons
Disclaimer
This report records the author’s personal analysis and views based on public information and does not recommend any particular product or company. It does not recommend buying or selling any financial investment product and is not an investment advisory or quasi-investment advisory service.
The figures in this report are those public at the time of writing. Filings and reports may change later, and consensus figures are the average of the estimating institutions at the time cited. Cartersville utilization is as reported, the yearly credits are the company’s dollar outlook converted at the exchange rate, and the US demand outlook is that of SEIA, Wood Mackenzie and EIA. Accuracy and completeness are not guaranteed.
The drop decomposition (beta), the credit totals and the earnings paths by situation are estimates based on the assumptions stated in the text; if the assumptions do not hold, the results differ. Items marked “author’s calculation,” “author’s assumption” or “author’s judgment” are the author’s calculations and assumptions, not confirmed facts. The situation scenarios do not give buy or sell prices.
Author’s interests: not disclosed
Responsibility for decisions and their outcomes lies with the reader.
As of: October 27, 2026
Was this note useful?
Thanks. Your answer helps decide what to cover next.
Korea market snapshot · Oct 27, 2026
New to Korean stocks? Start here for the basics.
Most read lately
3Balance Sheet Recession: Japan’s Lost Years and Korea’s KRW 2,000 Trillion Household Debt (2026)
4Commodity Cycle Order: Gold Peaks First, Grains Last, Rates Next (2026)
5Hanwha Succession: Who Gained Among the Three Kim Brothers, from One Basket to Three Paths
Get the Saturday note on Korean stocks
One email every Saturday with the week’s new research on Korean listed companies and links to the updated data pages. Built from DART filings and KRX data. Free; unsubscribe in one click. See past issues