
Debt-to-Equity Ratio and Interest Coverage Ratio Explained: 41 of 53 Korean Companies That Can’t Cover Interest Had Low Debt Ratios (Korean Stocks)
The debt-to-equity ratio (liabilities ÷ equity) tells you how much debt a company has; the interest coverage ratio (operating profit ÷ interest expense) tells you how well it can carry it. They often disagree, because about half of large-cap debt is interest-free prepayments and payables. Among 239 large Korean companies, 41 of the 53 that could not cover their interest in 2025 had a debt-to-equity ratio under 200%, while HD Hyundai Heavy Industries, at 180.1%, covered its interest 21.1 times. Data as of the October 8, 2026 close.
- Debt-to-equity ratio = total liabilities ÷ total equity (the amount of debt); interest coverage ratio = operating profit ÷ interest expense (the strength to carry it).
- Hypothetical: A at a 150% debt-to-equity ratio covers interest 40x, while B at 80% covers it only 0.95x, because most of A’s debt is interest-free prepayments.
- The median interest-bearing share of debt at 239 large Korean companies is 47.8%; shipbuilding’s is 4.8%.
- Of 53 companies with a 2025 interest coverage ratio below 1, 41 had a debt-to-equity ratio under 200%; 27 were below 1 three years running.
- Adding the 1.12%p rise in 2026 AA- corporate bond yields to interest-bearing debt cuts the median ratio from 6.31x to 4.91x and raises companies below 3x from 79 to 91.
Key takeaways
- The debt-to-equity ratio (liabilities ÷ equity) counts every kind of debt, including customer prepayments and trade payables that carry no interest. The interest coverage ratio (operating profit ÷ interest expense) shows how many times operating profit covers the interest on that debt: one measures how much debt there is, the other how well the company can carry it.
- Among 239 large Korean listed companies, 41 of the 53 with a 2025 interest coverage ratio below 1 had a debt-to-equity ratio under 200%, and 27 were below 1 three years running.
- The AA- 3-year corporate bond yield rose 1.12 percentage points in 2026, from 3.545% to 4.663%. Adding that rise to interest-bearing debt pulls the median interest coverage ratio of the 239 companies down from 6.31x to 4.91x.
Written: October 11, 2026 (market-cap ranks use KRX closes on October 8; Korean markets were closed on October 9 for Hangul Day)
Concepts covered: debt-to-equity ratio, interest-bearing debt, interest coverage ratio (ICR), marginal (“zombie”) firms, interest-rate sensitivity
Dollar figures are converted at KRW 1,339 per dollar, the USD/KRW close on October 8, 2026.
1. What are the debt-to-equity ratio and the interest coverage ratio? Read debt by its weight
This report explains the debt-to-equity ratio and the interest coverage ratio with numbers from Korea’s largest listed companies. It asks one question: which numbers tell you whether a company’s debt is dangerous? The answer is that the debt-to-equity ratio alone is not enough. You also need to know how much of the debt carries interest, and how many times operating profit covers that interest (the interest coverage ratio). The debt-to-equity ratio measures the amount of debt; the interest coverage ratio measures the strength to carry it.
The two numbers part ways because of what debt is made of. The liabilities on a balance sheet mix debt that pays interest, such as bank loans and corporate bonds, with debt that does not, such as prepayments received from customers and money owed to suppliers. The debt-to-equity ratio adds them together without telling them apart. So a shipbuilder that has collected large prepayments on a big order book shows a high debt-to-equity ratio, while a chemical company with a low debt-to-equity ratio can still fail to pay its interest if most of its debt is borrowings and its operating profit is negative.
In large Korean stocks the difference shows up in numbers. From the 300 largest companies by market cap on October 8, the author removed 61 banks, brokers, insurers, card companies, holding companies, investment companies and firms that consolidate financial subsidiaries, and calculated the remaining 239. Of the 53 companies with a 2025 interest coverage ratio below 1, 41 had a debt-to-equity ratio under 200%, and 26 had less debt than equity (author’s calculation). Conversely, HD Hyundai Heavy Industries (329180.KS), with a debt-to-equity ratio of 180.1%, paid interest on only 4.1% of its debt, and its interest coverage ratio was 21.1x.
The interest coverage ratio follows interest rates. While the Bank of Korea base rate rose from 1.00% at the end of 2021 to 3.50% at the end of 2023, the median interest coverage ratio of the 239 companies fell from 10.71x to 4.12x, and the median company’s 2025 interest expense was 2.16 times its 2021 level. In 2026 the base rate rose twice, in July and August, to 3.00%, and the AA- 3-year corporate bond yield rose 1.12 percentage points, from a January average of 3.545% to a September average of 4.663%. This report adds that rise to the interest-bearing debt of large caps and recounts their interest coverage ratios.
The order is as follows. The first part covers the definitions of the two ratios, a hypothetical example and what debt is made of. The middle looks at how the 239 companies are spread, the path by which interest rates changed coverage, the companies below 1 three years running and the differences between sectors. The last part runs through a calculation that plugs in the 2026 rate rise; the cases of KEPCO, chemicals, retail and shipbuilding; quarterly and consensus numbers; and statistics for Korean companies as a whole, and ends with six steps readers can apply to their own stocks.
2. Debt ratios in Korean stocks: WISEfn, DART, marginal firms and delisting rules
All company figures in this report are consolidated, the basis Korean listed companies use for their headline results, so a parent’s numbers include its subsidiaries’ debt and interest. The 239 companies come from the largest stocks on the Korea Exchange (KRX), which runs two main boards: KOSPI for large, established companies and KOSDAQ for smaller and growth companies. Korean amounts are often quoted in eok won (100 million won) and jo won (1 trillion won); this report writes them as KRW bn and KRW tn.
The ratios come from WISEfn, the data provider whose company pages appear under “Company info” on each stock in Naver Finance, Korea’s most-used stock portal. Its stability table lists the debt-to-equity ratio, net debt ratio, current ratio and interest coverage ratio by year and by quarter, and its financial summary lists interest-bearing debt and brokers’ consensus operating profit, so readers can repeat every calculation here. Original filings are published on DART, Korea’s electronic disclosure system run by the Financial Supervisory Service; the notes to the annual report list borrowings and finance costs.
The Bank of Korea and the Financial Supervisory Service define a marginal firm, often called a zombie company, as one whose interest coverage ratio has been below 1 for three years running. The Bank of Korea tracks the share of such firms among externally audited companies in its semiannual Financial Stability Report, and that share reached 19.1% in the fourth quarter of 2025. When losses pile up, the exchange’s listing rules come into play: a company whose equity falls below half of its paid-in capital (capital impairment of 50% or more) is designated an “administrative issue,” a warning label on the stock, and full capital impairment is grounds for delisting. A reform announced in February 2026 extends the full-impairment test from the fiscal year-end to the half-year and raises the minimum market cap to stay listed.
Interest rates are moving again. The Bank of Korea raised its base rate from 2.50% to 2.75% on July 16, 2026, its first hike in three years and six months, and to 3.00% on August 27. That is why the interest coverage ratio, not the debt-to-equity ratio, is the number to watch for Korean companies this year.
3. How the numbers were counted: 239 Korean large caps, WISEfn consolidated data
Which companies, which figures, and how
The starting point is the 300 largest companies by KRX market cap on October 8. Preferred shares, SPACs and REITs were excluded from the start. Banks, securities firms, non-life and life insurers and card companies were then removed, because a financial company’s liabilities, such as customer deposits and insurance reserves, are the raw material of its business, so the debt-to-equity ratio and the interest coverage ratio do not mean the same thing as for other companies. Next came holding companies grouped as conglomerates in WISEfn’s industry classification (WICS), companies with “holdings” in their names, companies that act mainly as investment vehicles (SK, SK Square, HD Hyundai, LS, GS, Hanjin KAL, EcoPro, Hanmi Science, Hankook & Company), Hyundai Motor, which consolidates a finance subsidiary, the financial service Kakao Pay and an infrastructure fund. A holding company consolidates its subsidiaries’ debt, so counting it alongside the subsidiaries would count the same debt twice. Removing these 61 left 239 companies.
All figures are consolidated WISEfn figures (Naver company data). From the stability table of the investment-indicator screen, the author downloaded the debt-to-equity ratio, total liabilities, total equity, net debt ratio, current ratio, interest coverage ratio, operating profit and non-operating interest expense, annually for 2021–2025 and quarterly from Q2 2025 to Q2 2026. On this screen the debt-to-equity ratio is total liabilities divided by total equity, and the interest coverage ratio is operating profit divided by non-operating interest expense. For interest-bearing debt, the author used “interest-bearing liabilities” (borrowings, bonds and similar) from the financial summary screen. 2026 operating profit is the consensus on the same screen. Data were retrieved October 9–11.
For interest coverage statistics, 8 companies with 2025 interest expense of KRW 50m or less were set aside as “virtually debt-free.” A company that pays almost no interest has a coverage ratio in the thousands, which would distort the median and the bracket counts. So interest coverage figures cover 231 companies and debt-to-equity figures cover 239. When operating profit is negative the interest coverage ratio is negative too, and this report counts those cases separately as “operating losses.”
The “effective interest rate” is the year’s interest expense divided by year-end interest-bearing debt. For a company whose debt rose or fell sharply during the year, this value drifts away from the actual rate, so it is read only as the median of the 239 companies, never for one company. For rates, the report uses the Bank of Korea ECOS base rate (year-end; monthly for 2026) and the AA- 3-year corporate bond yield (annual average; monthly average for 2026). The calculation that plugs in the 2026 rate rise adds the same increase to all interest-bearing debt, so it is an end point; in reality interest changes in the order that debts mature. All ratios are the author’s calculations.
4. Debt-to-equity ratio and interest coverage ratio formulas (with a hypothetical example)
Definitions
The debt-to-equity ratio is total liabilities divided by total equity. A company with KRW 100bn of equity and KRW 150bn of liabilities has a debt-to-equity ratio of 150%. It compares the money owed to others (liabilities) with the money shareholders put in plus retained profits (equity), so it is a ruler for the amount of debt. In the Bank of Korea’s Financial Statement Analysis, the 2025 debt-to-equity ratio of 34,456 externally audited companies was 98.3%, down from 103.4% in 2024 (Herald Economy, June 9, 2026).
The interest coverage ratio (ICR) is operating profit divided by interest expense. A company with KRW 20bn of operating profit paying KRW 0.5bn of interest has an ICR of 40x; a company with KRW 4bn of operating profit paying KRW 4.2bn of interest has an ICR of 0.95x. An ICR of 1x means the money earned from operations equals the interest; below 1x, the business does not earn enough to pay even the interest. So this number measures the strength to carry debt. The Bank of Korea and the Financial Supervisory Service call a company whose ICR is below 1 three years running a marginal firm (Herald Economy, October 12, 2025).
The two numbers measure different things. The debt-to-equity ratio looks at one point on the balance sheet: the debt left at year-end. The interest coverage ratio looks at one year of the income statement: the operating profit earned and the interest paid over twelve months. A company with a lot of debt but large profits has a high ICR, and a company with little debt but no profit has a low one. That is why you need both to know whether debt is actually heavy.
Put into words: a debt-to-equity ratio of 150% means “for every 100 won of shareholders’ money, the company is using 150 won of other people’s money,” and an ICR of 40x means “a year of operating profit equals 40 years of interest.” The first sentence says how much debt has piled up; the second says how hard that debt presses on the company this year. For someone choosing stocks, the second is more direct, because profit left after interest is what belongs to shareholders. A company with an ICR of 2x pays half its operating profit in interest; one with 10x pays a tenth.
Hypothetical example: the company with the higher debt-to-equity ratio can be safer
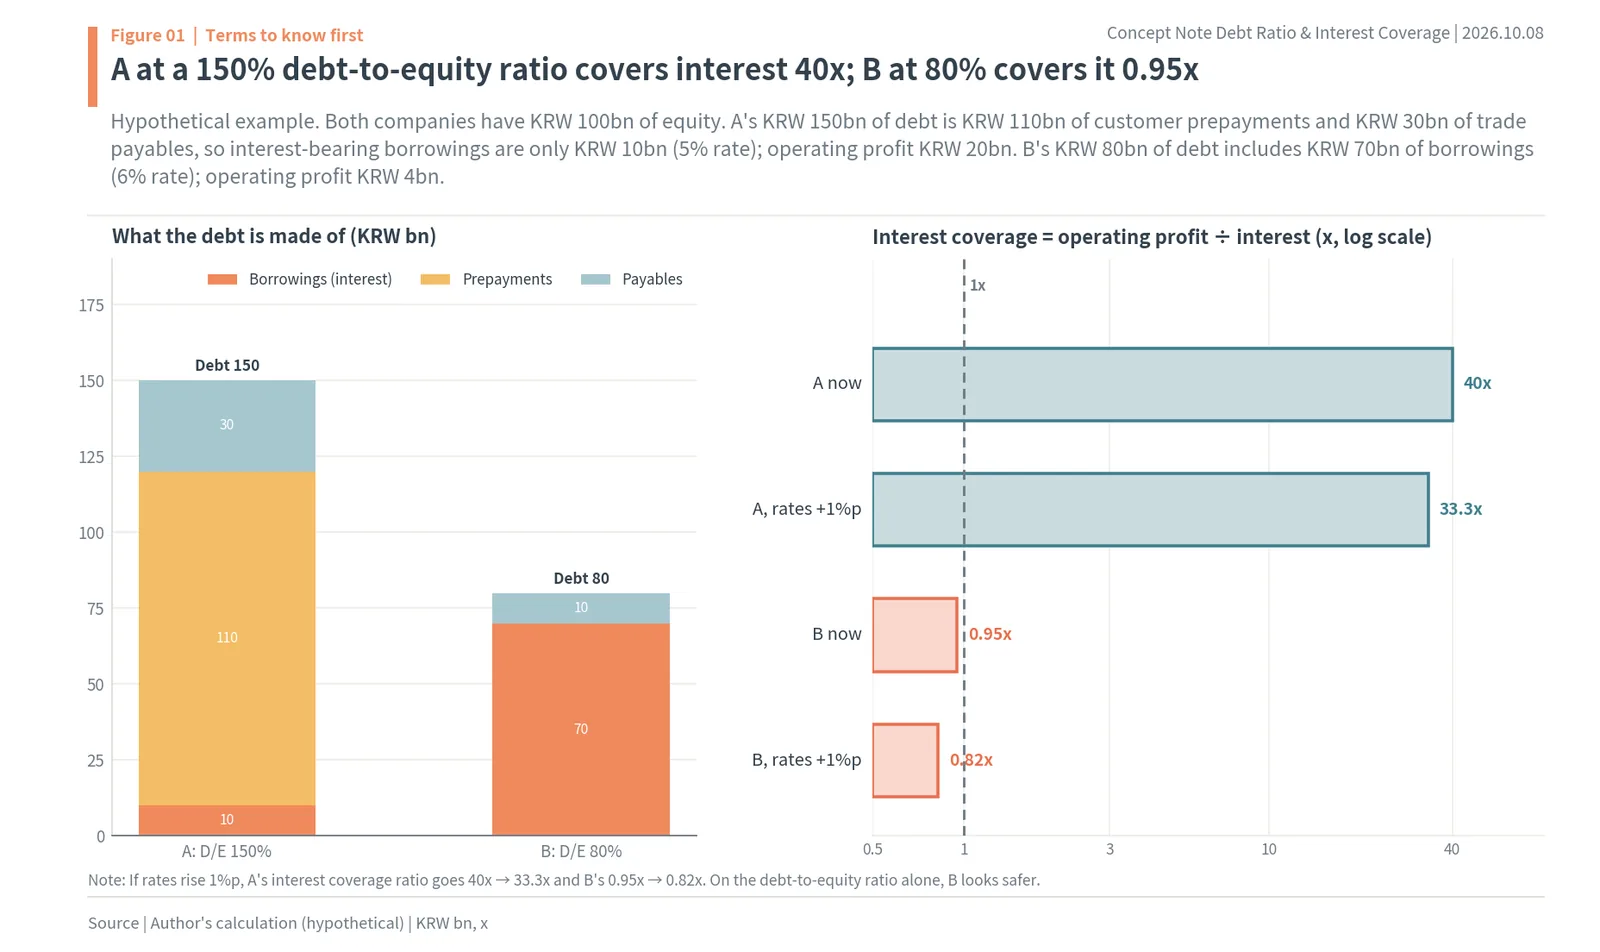
Figure 1 shows two hypothetical companies, each with KRW 100bn of equity. A has KRW 150bn of liabilities, a debt-to-equity ratio of 150%. But KRW 110bn of that is customer prepayments and KRW 30bn is money owed to suppliers; interest-bearing borrowings are only KRW 10bn. At a 5% rate the interest is KRW 0.5bn, and dividing operating profit of KRW 20bn by it gives an ICR of 40x. The interest-bearing share of its debt is 6.7%.
B has KRW 80bn of liabilities, a debt-to-equity ratio of 80%, a little over half of A’s. But KRW 70bn of that is borrowings at 6%, so interest is KRW 4.2bn. Operating profit is KRW 4bn, so the ICR is 0.95x: the business earns less than its interest. On the debt-to-equity ratio alone, B looks safer, but A covers its interest 40 times and B less than once.
If rates rise 1 percentage point, the gap widens. A’s KRW 10bn of borrowings at 6% means interest of KRW 0.6bn, and its ICR falls from 40x to 33.3x. B’s KRW 70bn at 7% means interest of KRW 4.9bn, and its ICR falls from 0.95x to 0.82x. The same 1 point raises interest far more at the company with more interest-bearing debt, and the company that started with a low ratio struggles first.
What this example teaches is an order. Check the amount of debt with the debt-to-equity ratio, then check how much of it carries interest, and finally check how many times operating profit covers that interest. Skip these three steps and you read things backwards: a company full of prepayments looks dangerous and a company with no profit looks safe.
5. Interest-bearing debt vs customer prepayments and trade payables
Half of large-cap debt bears no interest
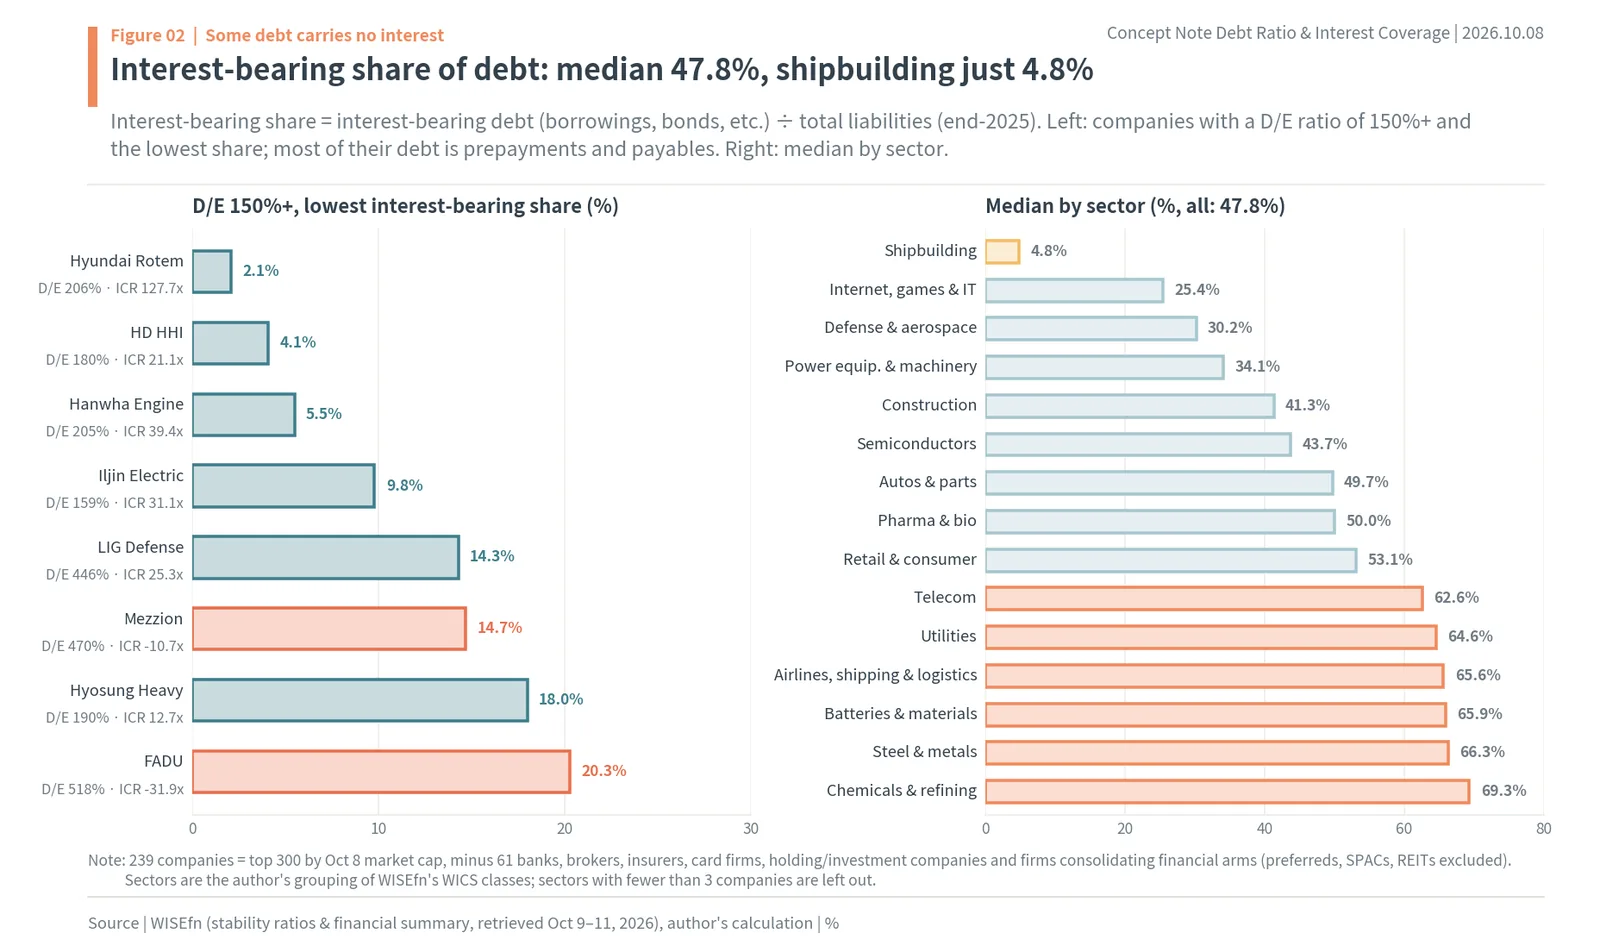
Calculating the share of interest-bearing debt (borrowings, bonds and similar) in total liabilities at the end of 2025 for the 239 companies gives a median of 47.8%. Roughly half of large-cap debt carries no interest. There are three main kinds of interest-free debt: trade payables (goods received now, paid for later), prepayments or contract liabilities received from customers before the product is made, and provisions set aside for costs expected in the future.
The left side of Figure 2 shows the companies with a debt-to-equity ratio of 150% or more whose interest-bearing share is lowest. Hyundai Rotem has a debt-to-equity ratio of 206.4%, but its interest-bearing share is 2.1% and its ICR is 127.7x. HD Hyundai Heavy Industries has a debt-to-equity ratio of 180.1%, an interest-bearing share of 4.1% and an ICR of 21.1x. Hanwha Engine (debt-to-equity 204.9%, share 5.5%), Iljin Electric (159.2%, 9.8%) and LIG Defense & Aerospace (446.4%, 14.3%) belong to the same group. They are shipbuilding, defense and power-equipment companies that collect down payments when they win orders.
The right side shows medians by sector. Shipbuilding has the lowest interest-bearing share at 4.8%, followed by internet, games and IT at 25.4%, defense and aerospace at 30.2% and power equipment and machinery at 34.1%. At the other end are chemicals and refining at 69.3%, steel and metals at 66.3%, batteries and materials at 65.9%, airlines, shipping and logistics at 65.6% and utilities at 64.6%. In industries that buy large assets such as plants, ships, aircraft and power stations with debt, two-thirds of the debt pays interest.
Customer prepayments push the debt-to-equity ratio up as orders grow
Shipbuilders have high debt-to-equity ratios because of how their contracts work. A shipowner pays a down payment and progress payments in installments when it orders a ship, and the shipbuilder books that money as contract liabilities until it delivers the vessel. The more orders it wins, the more prepaid money piles up, and the higher its debt-to-equity ratio goes. Samsung Heavy Industries’ debt-to-equity ratio was 304.1% in the third quarter of 2024, but excluding KRW 5.31tn of contract liabilities it falls to 161.8% (Dealsite, January 2, 2025). These contract liabilities carry no interest, and they turn into revenue and disappear when the ship is delivered.
A change in accounting rules can also make the ratio jump. When the lease accounting standard IFRS 16 took effect in 2019, the rent on leased aircraft and stores started being booked as liabilities (lease liabilities). The Financial Supervisory Service analyzed 100 companies using operating leases and found that, as of January 1, 2019, the increase in the debt-to-equity ratio was largest in air transport, an average of 85.8 percentage points, followed by cinemas and similar businesses at 85.5 points, shipping at 42.8 points and retail at 32.9 points (Etoday, August 1, 2019). Lease liabilities carry interest, so interest expense rose too.
There are also devices that lower the ratio. Hybrid capital securities (perpetual bonds) with no maturity or a very long one are booked as equity. A simple calculation shows that Jeju Air’s KRW 100bn perpetual bond in September 2026 would lower its debt-to-equity ratio from about 1,009% to about 685% (Dealsite, September 30, 2026). But perpetual bonds also pay high interest, so interest expense does not fall. The debt-to-equity ratio moves a great deal with contract structures and accounting rules; the interest coverage ratio follows the interest actually paid.
6. HD Hyundai Heavy Industries vs Lotte Chemical: when the two ratios disagree
HD Hyundai Heavy Industries: liabilities rose, but interest-bearing debt fell
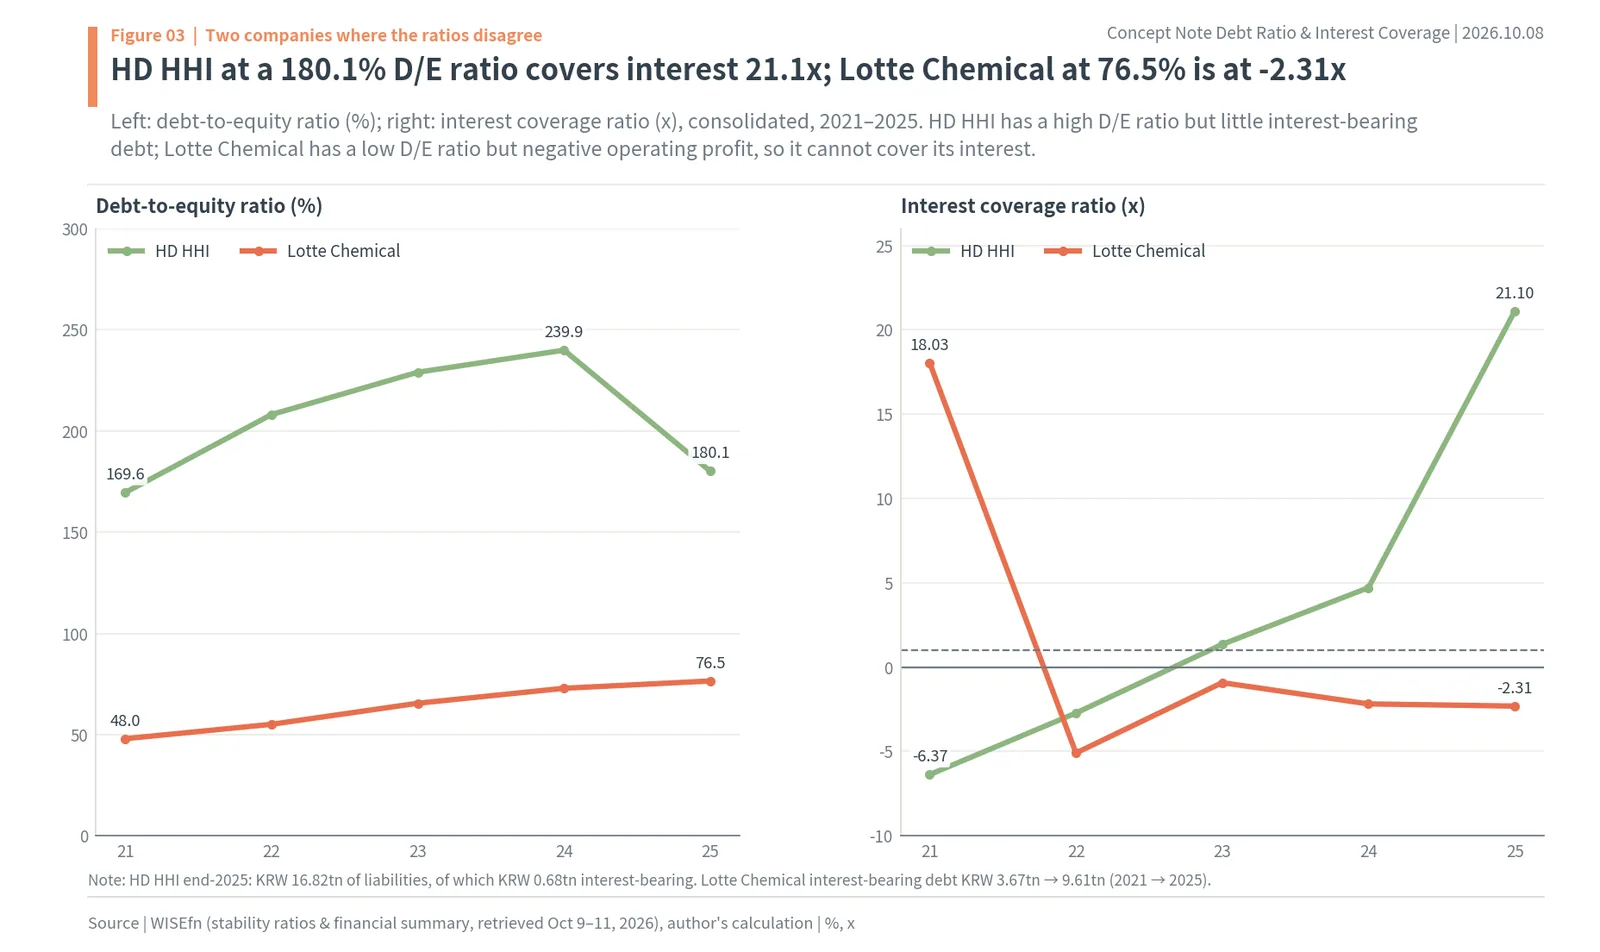
Figure 3 puts side by side the paths by which HD Hyundai Heavy Industries, with a debt-to-equity ratio of 180.1%, reached an ICR of 21.1x, and Lotte Chemical (011170.KS), at 76.5%, reached -2.31x. HD Hyundai Heavy Industries’ debt-to-equity ratio rose from 169.6% in 2021 to 239.9% in 2024 and came back to 180.1% in 2025. Over the same period total liabilities grew from KRW 9.48tn to KRW 16.82tn (about $12.6bn). Yet interest-bearing debt shrank from KRW 3.48tn to KRW 0.68tn. The extra liabilities were prepayments received on orders, and the company used that money to repay borrowings.
The interest coverage ratio moved the opposite way. In 2021 an operating loss of KRW 0.8tn gave -6.37x; it went to -2.72x in 2022, 1.35x in 2023 and 4.71x in 2024, and reached 21.1x in 2025 on operating profit of KRW 2.04tn. Interest expense stayed at around KRW 0.1tn while operating profit grew. In 2024, the year its debt-to-equity ratio peaked, its interest coverage was actually rising.
Lotte Chemical: little debt on paper, but it cannot pay the interest
Lotte Chemical’s debt-to-equity ratio rose from 48.0% in 2021 to 76.5% in 2025, close to the large-cap median of 73.6%. On the debt-to-equity ratio alone, it does not look like a heavily indebted company. But its interest-bearing debt rose from KRW 3.67tn to KRW 9.61tn (about $7.2bn), and in 2025 71.3% of its debt paid interest. Interest expense grew from KRW 0.09tn to KRW 0.41tn.
Operating profit swung from KRW 1.54tn in 2021 to KRW -0.76tn in 2022, and losses continued through KRW -0.94tn in 2025. Its ICR went from 18.03x to -5.09x, -0.92x, -2.18x and -2.31x, below 1 for three straight years from 2023 to 2025. At the end of September 2024 the company missed, at 4.3x, a covenant attached to KRW 2.045tn of public bonds requiring three-year cumulative EBITDA ÷ interest expense of at least 5x, and at a bondholders’ meeting in December the covenant was removed (New Daily, November 21, 2024). Even with a low debt-to-equity ratio, a company with weak coverage sees its debt contracts shaken first.
7. Net debt ratio and current ratio explained
The net debt ratio looks at debt minus cash
If the debt-to-equity ratio is a wide ruler for the amount of debt, the net debt ratio is a narrow ruler for the money that actually has to be repaid. Net debt is interest-bearing debt minus the cash and short-term financial instruments the company holds, and the net debt ratio divides it by equity. When cash exceeds debt, net debt turns negative, and such a company is called a “net cash” company. KRW 1tn of borrowings weighs differently on a company with KRW 1tn of cash in the vault and one with none.
The large-cap numbers make the difference clear. In 2025 Samsung Electronics’ net debt ratio was -23.1%, SK hynix’s -8.4%, Kia’s -31.5% and HD Hyundai Heavy Industries’ -30.9%: all hold more cash than debt. HD Hyundai Heavy Industries has a debt-to-equity ratio of 180.1% but a negative net debt ratio, because cash received as prepayments has piled up beyond its borrowings. KEPCO, by contrast, has a net debt ratio of 258.2% and Korean Air 149.4%: even after subtracting cash, their debt is far larger than their equity. Lotte Chemical went from -5.3% in 2021 to 39.2% in 2025, turning from a net cash company into a net debt company in five years.
The net debt ratio is most useful read together with the interest coverage ratio. Large net debt and a low ICR mean there is neither the cash to repay the debt nor the profit to pay the interest. With negative net debt, even if the ICR dips below 1 for a while, the company can pay interest from cash on hand. So when you meet a company with a low ICR, check its net debt ratio next to gauge how long it can hold out.
The current ratio looks at what is due within a year
The current ratio is assets that will turn into cash within a year (current assets) divided by debt due within a year (current liabilities). Above 100 means more money is coming in within a year than going out. If the debt-to-equity ratio and the interest coverage ratio look at the size of debt and its interest, the current ratio looks at its maturity. Even with enough profit to pay interest, a company runs out of money if it cannot refinance debt coming due within the year.
In 2025 the current ratio was a comfortable 232.8% at Samsung Electronics, 185.8% at SK hynix and 156.5% at Kia. KEPCO’s was 45.8%: debt due within a year is more than twice the assets that will turn into cash within a year. Such a company has to keep rolling maturing debt into new debt, so rising rates feed through to interest quickly. Lotte Chemical’s current ratio halved from 205.9% in 2021 to 104.2% in 2025. While its net debt ratio rose and its current ratio fell, its ICR stayed below 1.
The three numbers come in this order: the debt-to-equity ratio for the amount of debt, the net debt ratio for real debt after cash, and the current ratio for debt coming due within a year. Then the interest coverage ratio shows how many times operations cover the interest on that debt. The first three say how much debt there is; the last says whether the company can bear it.
8. Five ways the debt-to-equity ratio changes (KEPCO example)
The numerator and the denominator move separately
The debt-to-equity ratio is liabilities ÷ equity, so it rises when debt grows and also when equity shrinks. There are five ways it changes. First, borrowing money increases liabilities and raises the ratio. Second, receiving prepayments on orders increases liabilities and raises the ratio. Third, a change in accounting rules that brings items such as leases onto the balance sheet as liabilities raises the ratio. Fourth, losses, or returning money through dividends and buybacks, shrink equity and raise the ratio. Fifth, a rights offering or a perpetual bond issue increases equity and lowers the ratio.
Of the five, the first and third directly change the interest coverage ratio, because borrowings and lease liabilities carry interest. Prepayments raise only the debt-to-equity ratio, not interest. The fourth route, where losses shrink equity, means operating profit is negative, so the ICR is already below 1. That is why the part of a move in the debt-to-equity ratio that moves together with the interest coverage ratio is the real debt risk.
KEPCO (015760.KS) shows the difference. Its debt-to-equity ratio jumped from 223.2% in 2021 to 459.1% in 2022 and 543.3% in 2023. A KRW 32.7tn operating loss in 2022 ate into equity (the fourth route), and the money borrowed to cover that loss swelled liabilities (the first route). When two routes work at once, the ratio more than doubles. As operating profit returned and equity built up again, the ratio came back to 416.9% in 2025. Over the same period interest expense went from KRW 1.91tn to KRW 4.34tn.
9. Debt-to-equity ratio vs interest coverage ratio: why they diverge
Most companies that cannot pay interest do not have high debt-to-equity ratios
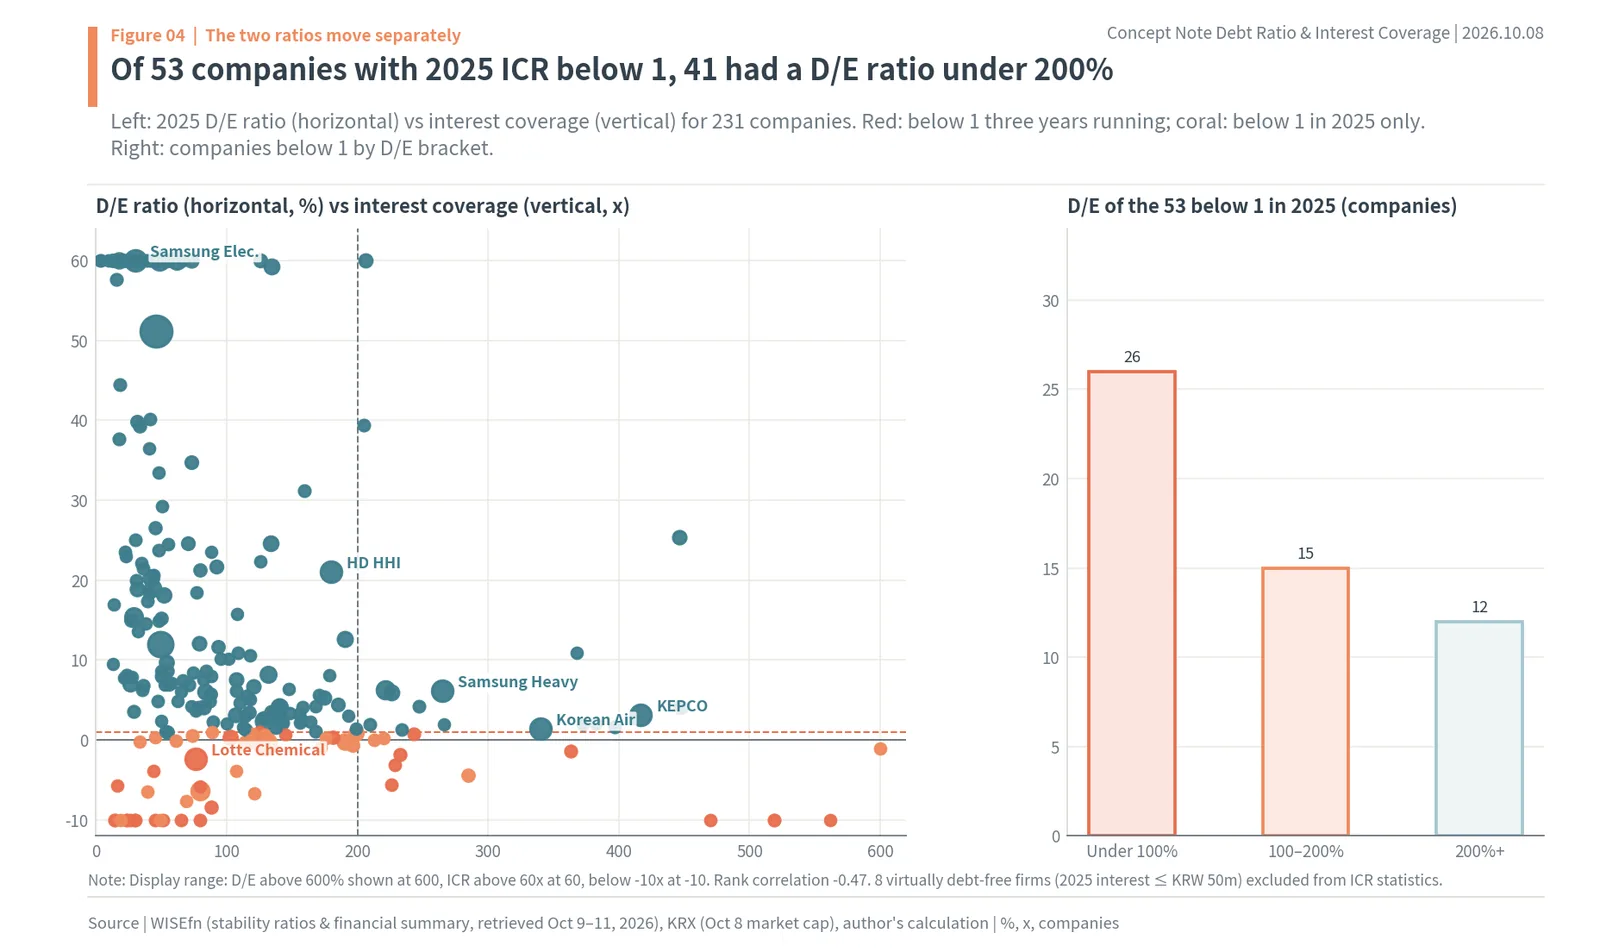
The left side of Figure 4 plots, one dot per company, the 2025 debt-to-equity ratio (horizontal) and interest coverage ratio (vertical) of the 231 companies for which coverage can be calculated. There is a tendency for coverage to fall as the debt-to-equity ratio rises, but it is weak: the rank correlation between the two is -0.47. Right of the 200% debt-to-equity line there are dots with coverage above 10x, and most dots below the 1x line sit left of 200%.
The bars on the right put this shape into numbers. Of the 53 companies with a 2025 ICR below 1, 41 had a debt-to-equity ratio under 200%, and 26 of them had less debt than equity. Only 12 were at 200% or more. Searching for companies that cannot pay their interest in order of debt-to-equity ratio would miss three of every four.
The reverse holds too. Of the 29 companies with a debt-to-equity ratio of 200% or more, 10 had an ICR of 3x or more or almost no interest. Of the 144 companies with less debt than equity, 26 had an ICR below 1. Many of the low-debt companies that cannot pay interest are biotech firms with operating losses from drug development; the rest are materials companies whose profits have fallen, such as Lotte Chemical (76.5%, -2.31x) and Hyundai Steel (73.6%, 0.60x).
So debt risk is not screened by the debt-to-equity ratio. The ratio tells you the amount of debt, but the weight with which that debt presses on a company is set by the size of the debt that generates interest and the size of operating profit. The red dots in Figure 4 (below 1 three years running) are scattered across the whole debt-to-equity axis as a result.
10. Debt-to-equity and interest coverage distribution of 239 Korean companies
Median debt-to-equity ratio 73.6%; interest coverage splits in two
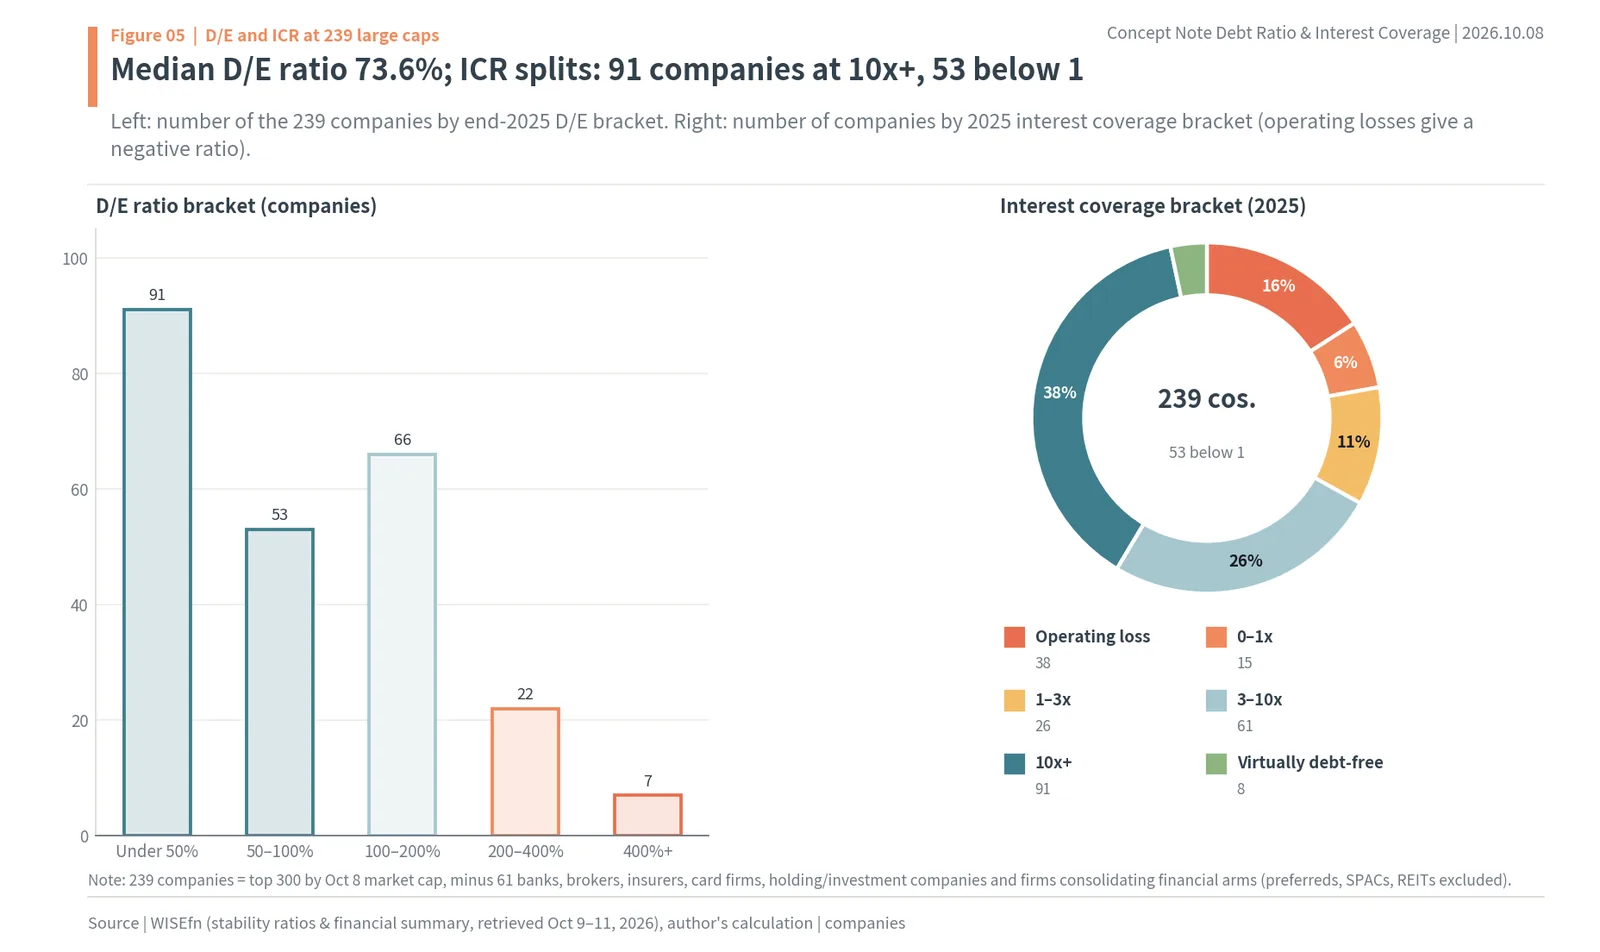
The left side of Figure 5 counts the 239 companies by end-2025 debt-to-equity bracket. The largest group, 91 companies, is below 50%, followed by 53 at 50–99.9%, 66 at 100–200%, 22 at 200–400% and 7 at 400% or more. The median is 73.6%: half of large caps have less debt than equity. The median was 80.4% in 2021, 82.3% in 2022, 74.4% in 2023 and 75.4% in 2024, so it hardly changed over five years. Across large caps as a whole, the amount of debt did not grow.
The donut on the right splits 2025 interest coverage into brackets. The largest group, 91 companies, is at 10x or more, followed by 61 at 3–10x and 26 at 1–3x. Below 1 are 53 companies: 38 with operating losses and 15 at 0–1x. The 8 virtually debt-free companies are shown separately. The median ICR is 6.31x. The amount of debt is similar across companies, but the strength to pay interest splits sharply into those with plenty and those without enough.
The 26 companies in the 1–3x bracket pay their interest today, but without much room. If operating profit falls by just a third, or interest rises by a third, they slide toward 1. In a year when rates rise, this bracket moves first. When the 2026 rate rise is plugged in later in this report, the number of companies below 3x grows from 79 to 91 precisely because this bracket thickens.
11. How interest rates changed corporate interest costs in Korea
The rate companies pay followed the base rate up one to two years later
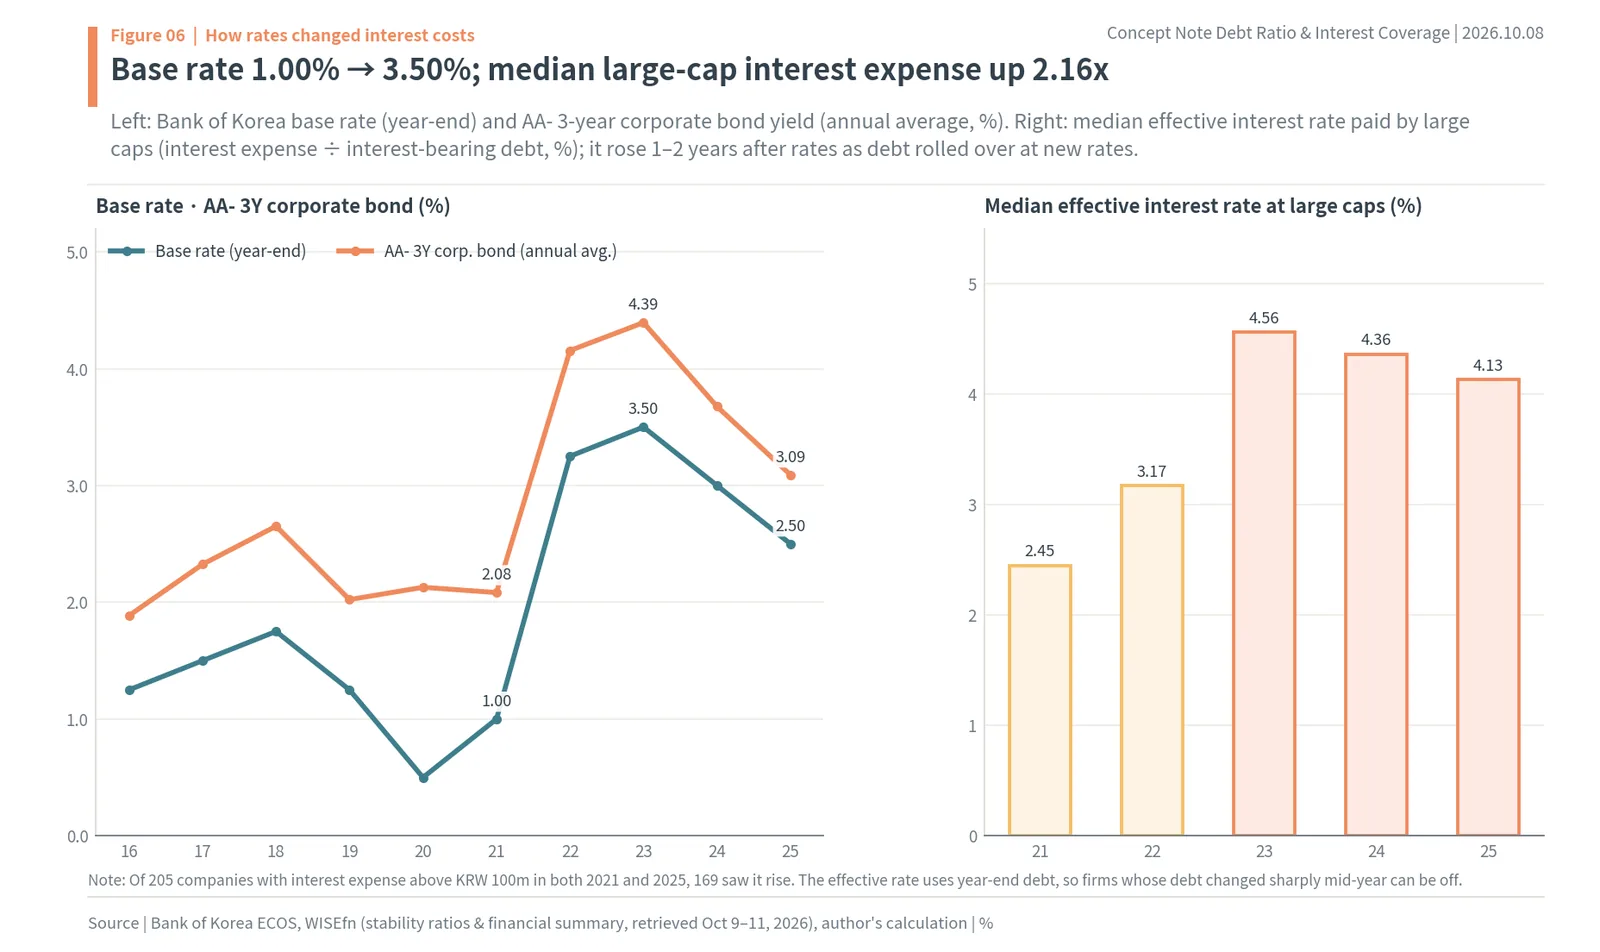
The left side of Figure 6 shows the base rate (year-end) and the AA- 3-year corporate bond yield (annual average). The base rate rose from 0.50% at the end of 2020 and 1.00% at the end of 2021 to 3.25% at the end of 2022 and 3.50% at the end of 2023, then eased to 3.00% at the end of 2024 and 2.50% at the end of 2025. The AA- 3-year yield, what a high-grade company pays to issue a three-year bond, rose from an annual average of 2.083% in 2021 to 4.155% in 2022 and 4.394% in 2023, and came back down to 3.091% in 2025.
The right side shows the median effective interest rate large caps actually paid (interest expense ÷ year-end interest-bearing debt). It rose from 2.45% in 2021 to 3.17% in 2022 and 4.56% in 2023, then eased slowly to 4.36% in 2024 and 4.13% in 2025. Market rates jumped in 2022, but the rate companies paid peaked in 2023. A company’s debt is locked in at rates set one to three years earlier, and the rate changes only when the debt matures and is re-borrowed at the new rate.
Interest expense was driven up by both rates and the amount of debt. Of the 205 companies with interest expense above KRW 100m in both 2021 and 2025, 169 saw it rise, and the median company’s 2025 interest expense was 2.16 times its 2021 level. The 2.5-point rise in the base rate, from 1.00% to 3.50%, more than doubled the interest burden of large caps. In its September 2026 Financial Stability Report, the Bank of Korea estimated that a 0.25-point rise in the base rate adds KRW 3.7tn (about $2.8bn) to corporate interest costs (Nocut News, September 22, 2026).
12. Interest coverage ratio trend 2021–2025: 10.71x → 4.12x → 6.31x
Median 10.71x → 4.12x → 6.31x
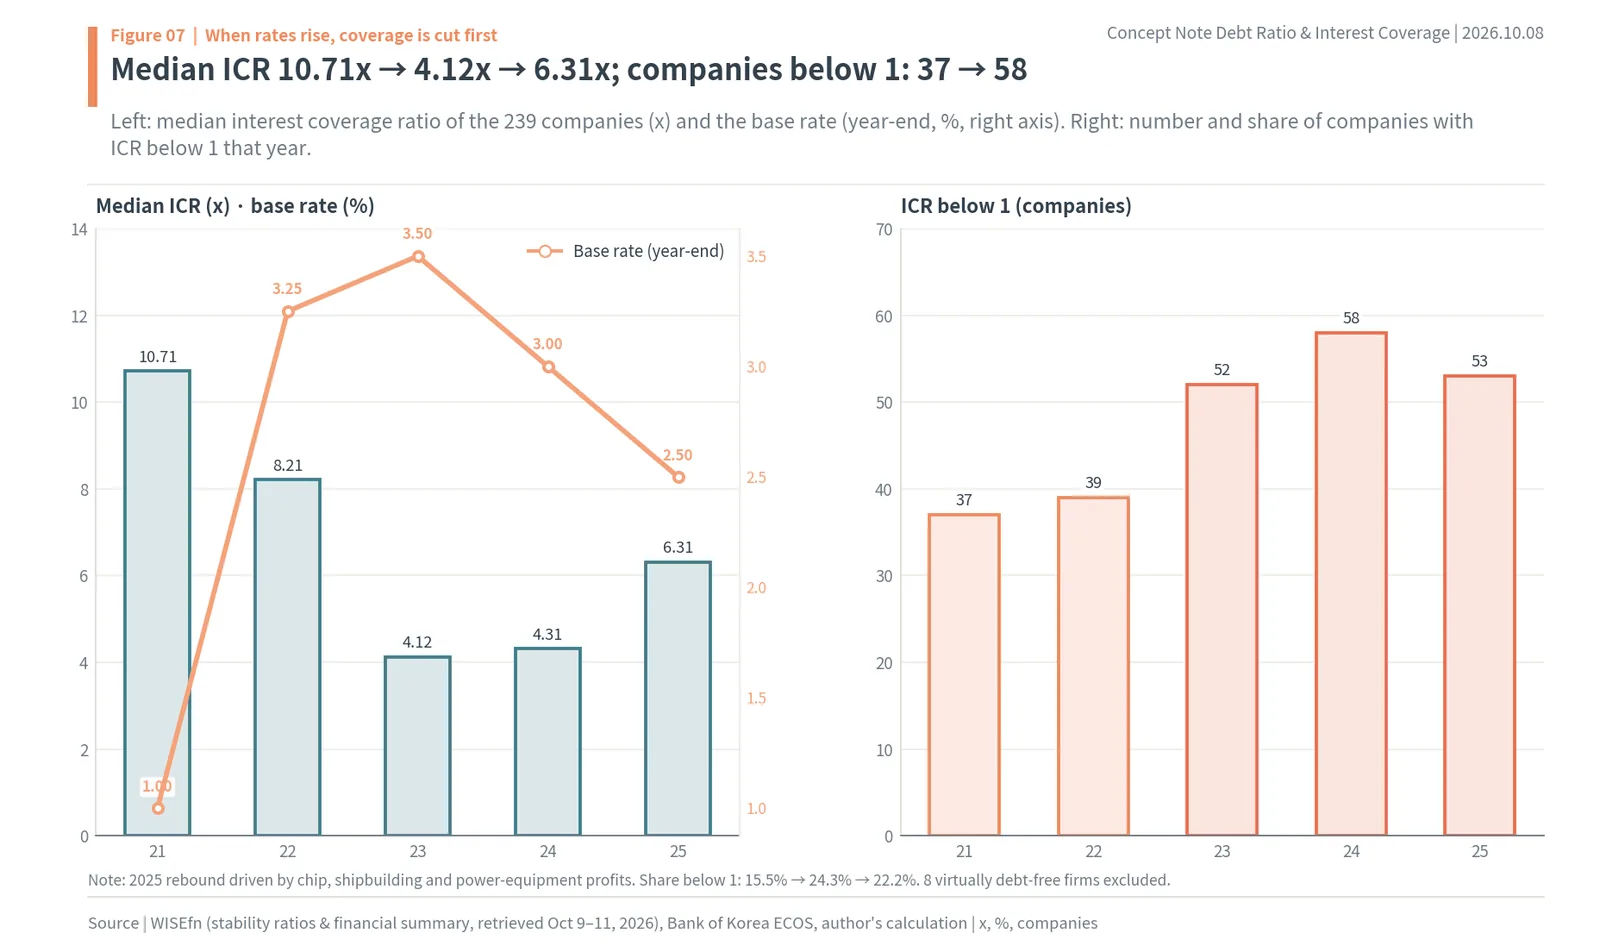
The left side of Figure 7 overlays the median ICR of the 239 companies with the base rate. It fell from 10.71x in 2021 to 8.21x in 2022 and 4.12x in 2023, more than 60% in two years, then recovered to 4.31x in 2024 and 6.31x in 2025. Coverage fell in the years rates rose and recovered after rates came down. It was cut hardest in 2022–2023, when operating profit could not keep up with the pace of rising interest expense.
The right side shows the number of companies with an ICR below 1 that year. It rose from 37 (15.5%) in 2021 and 39 in 2022 to 52 in 2023 and 58 (24.3%) in 2024, then edged down to 53 (22.2%) in 2025. The median recovered strongly in 2025, but the count below 1 barely fell. The 2025 recovery was led by sectors whose profits surged, such as semiconductors, shipbuilding and power equipment, while chemicals, batteries and retail were left out.
This pattern shows how rates reach the interest coverage ratio. When rates rise, interest goes up first on debt that is maturing; as interest rises, coverage falls at companies whose operating profit stays flat; and companies that started with low coverage drop below 1. With rates rising again in 2026, this sequence is happening now.
The 2025 recovery was led by sectors whose profits grew
The median’s rise from 4.31x to 6.31x in 2025 came less from lower rates than from many companies earning more operating profit. That year the median effective rate large caps paid fell only 0.23 points, from 4.36% to 4.13%. Meanwhile, coverage at companies whose profits surged multiplied: SK hynix went from 17.44x to 51.1x, Samsung Electronics from 36.2x to 71.97x and HD Hyundai Heavy Industries from 4.71x to 21.1x.
Companies whose profits did not grow barely moved even as rates eased a little. Lotte Shopping went from 0.76x to 0.94x and Hyundai Steel from 0.38x to 0.60x, both staying below 1. The force that lifts the interest coverage ratio is much greater in the numerator (operating profit) than in the denominator (interest). In a year of rising rates the denominator cuts coverage; in a year of rising profits the numerator lifts it. In a year like 2026, when rates are rising, the companies that hold their coverage are those whose profits grow faster than their interest.
13. Zombie companies: 27 Korean large caps with ICR below 1 three years running
16 beyond drug developers and biotech
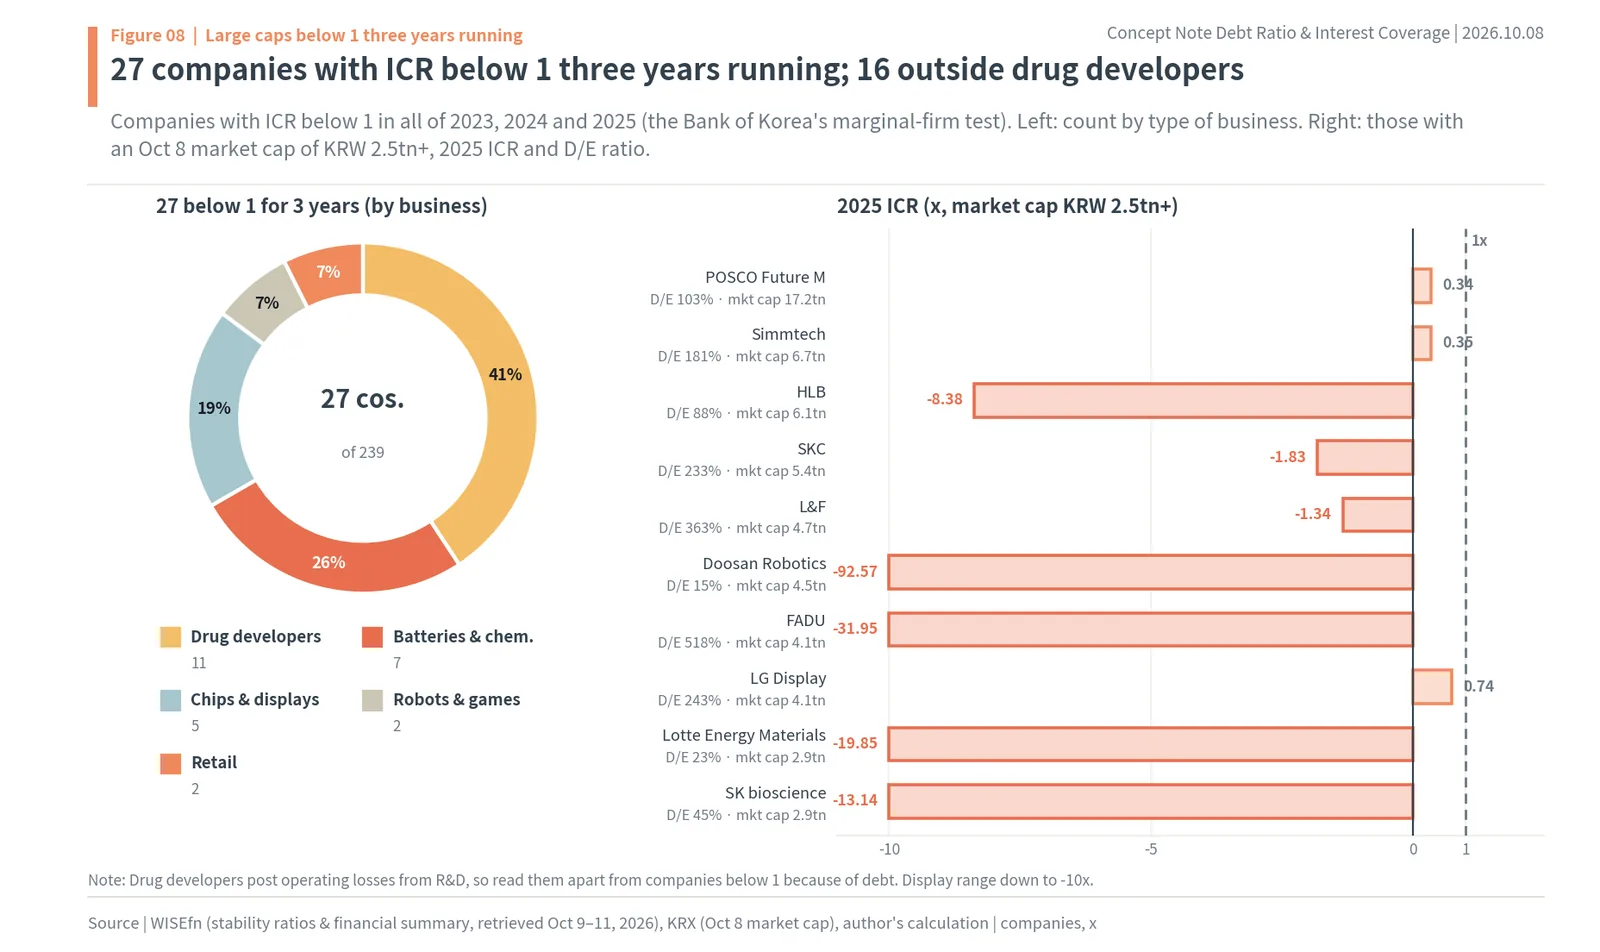
Of the 239 companies, 27 had an ICR below 1 in all three years, 2023, 2024 and 2025. In other words, 27 large caps meet the Bank of Korea’s definition of a marginal firm. The donut on the left of Figure 8 sorts these 27 by type of business. Drug developers and biotech are the largest group at 11. They post operating losses because of research spending, so they are read separately from companies below 1 because of debt.
The other 16 are 7 in batteries and chemicals (POSCO Future M, SKC, L&F, Doosan Fuel Cell, EcoPro Materials, Lotte Chemical, Lotte Energy Materials), 5 in semiconductors, displays and components (Simmtech, FADU, LG Display, Taihan Fiberoptics, SFA Semicon), 2 in retail (Lotte Shopping, E-mart) and 2 in robots and games (Doosan Robotics, Pearl Abyss). The core is battery materials and petrochemicals, which borrowed to build plants before demand turned down, and retail, with large store rents and borrowings.
The right side shows the 2025 ICR of those with an October 8 market cap of KRW 2.5tn or more. POSCO Future M, with a market cap of KRW 17.2tn (about $12.8bn), has a debt-to-equity ratio of 103% and an ICR of 0.34x; LG Display has a debt-to-equity ratio of 243% and an ICR of 0.74x. SKC is at -1.83x and L&F at -1.34x. Even companies the market values at several trillion won have, for three years now, failed to cover their interest with operating profit.
14. Debt-to-equity and interest coverage ratio by sector
Shipbuilding: 157.0% with 30.54x; batteries and materials: 128.8% with 0.71x
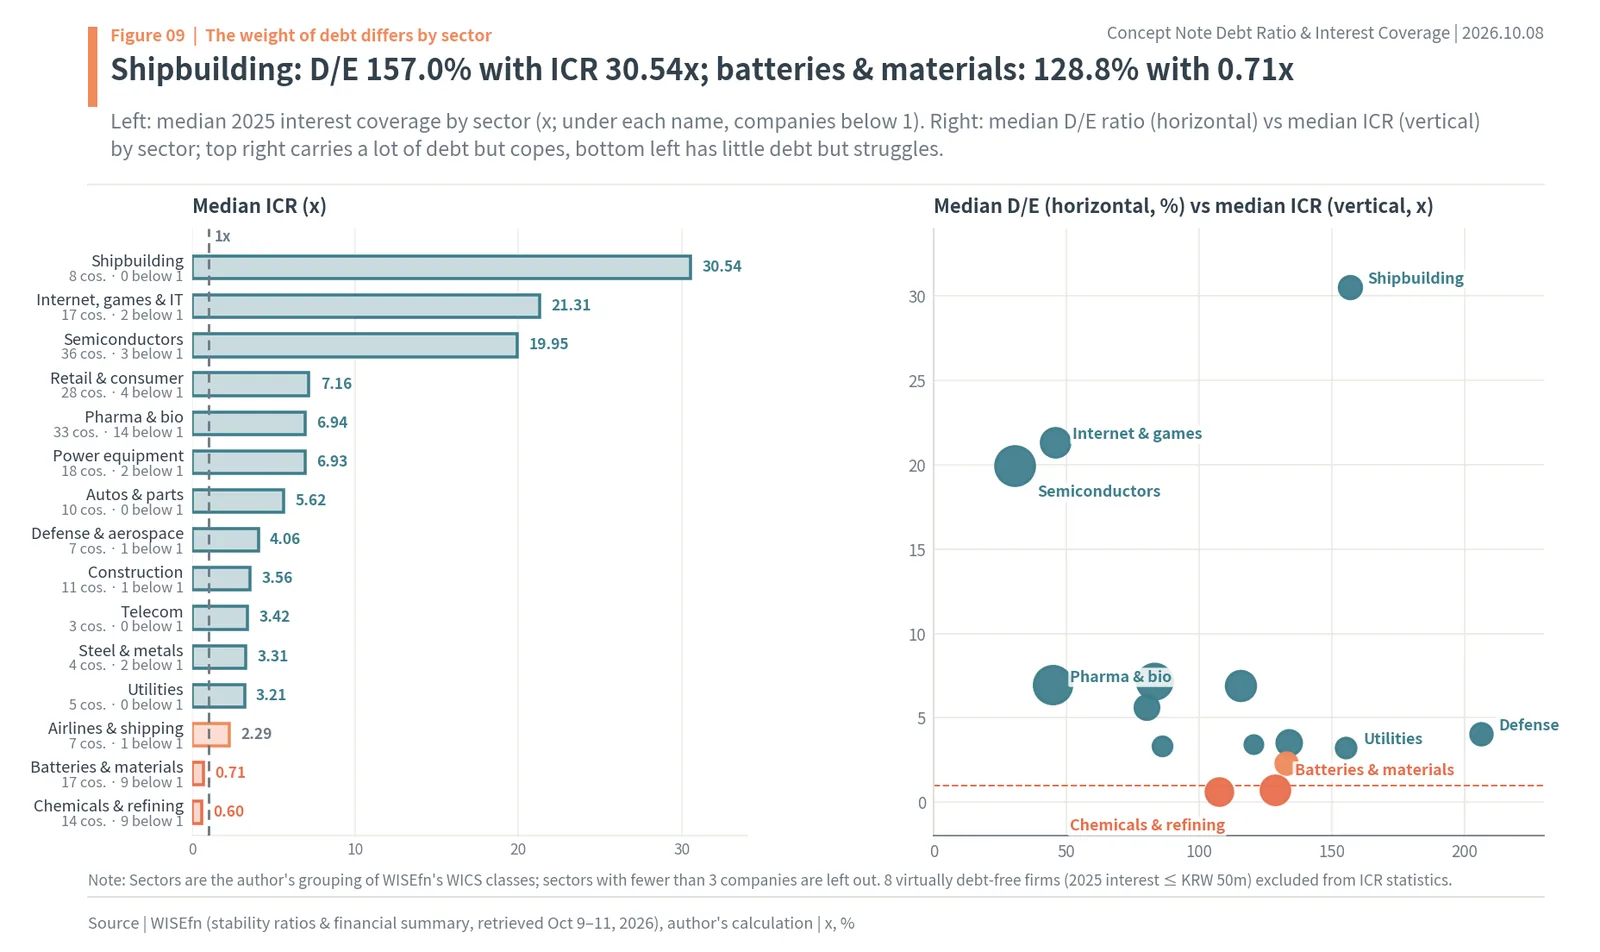
The left side of Figure 9 shows the median 2025 ICR by sector. Shipbuilding is highest at 30.54x, followed by internet, games and IT at 21.31x and semiconductors at 19.95x. At the bottom are airlines, shipping and logistics at 2.29x, batteries and materials at 0.71x and chemicals and refining at 0.60x. Nine of the 17 battery and materials companies and 9 of the 14 chemical and refining companies are below 1. A sector median below 1 means the typical company in that sector does not earn enough from operations to pay its interest.
The right side plots each sector’s median debt-to-equity ratio (horizontal) against its median ICR (vertical). Shipbuilding has a fairly high debt-to-equity ratio of 157.0% but the highest coverage, so it sits top right. Defense and aerospace has the highest debt-to-equity ratio at 206.4% but coverage of 4.06x. Batteries and materials (128.8%, 0.71x) and chemicals and refining (107.6%, 0.60x) have lower debt-to-equity ratios than shipbuilding yet sit below the 1x line. Even at the sector level, debt risk is set not by the order of debt-to-equity ratios but by the share of interest-bearing debt and the size of profits.
Semiconductors carry the lightest debt load of any sector, with a median debt-to-equity ratio of 30.5% and coverage of 19.95x. Pharma and biotech have a low debt-to-equity ratio of 45.0%, but 14 of 33 companies are below 1, most of them loss-making drug developers. Utilities (155.4%, 3.21x) and telecom (120.7%, 3.42x) carry a lot of debt, with interest-bearing shares in the 60% range, but steady operating profit from regulated tariffs and subscription fees covers their interest about three times.
15. 2026 rate hikes: how a 1.12%p rise hits interest coverage
AA- 3-year corporate bond yield 3.545% → 4.663%
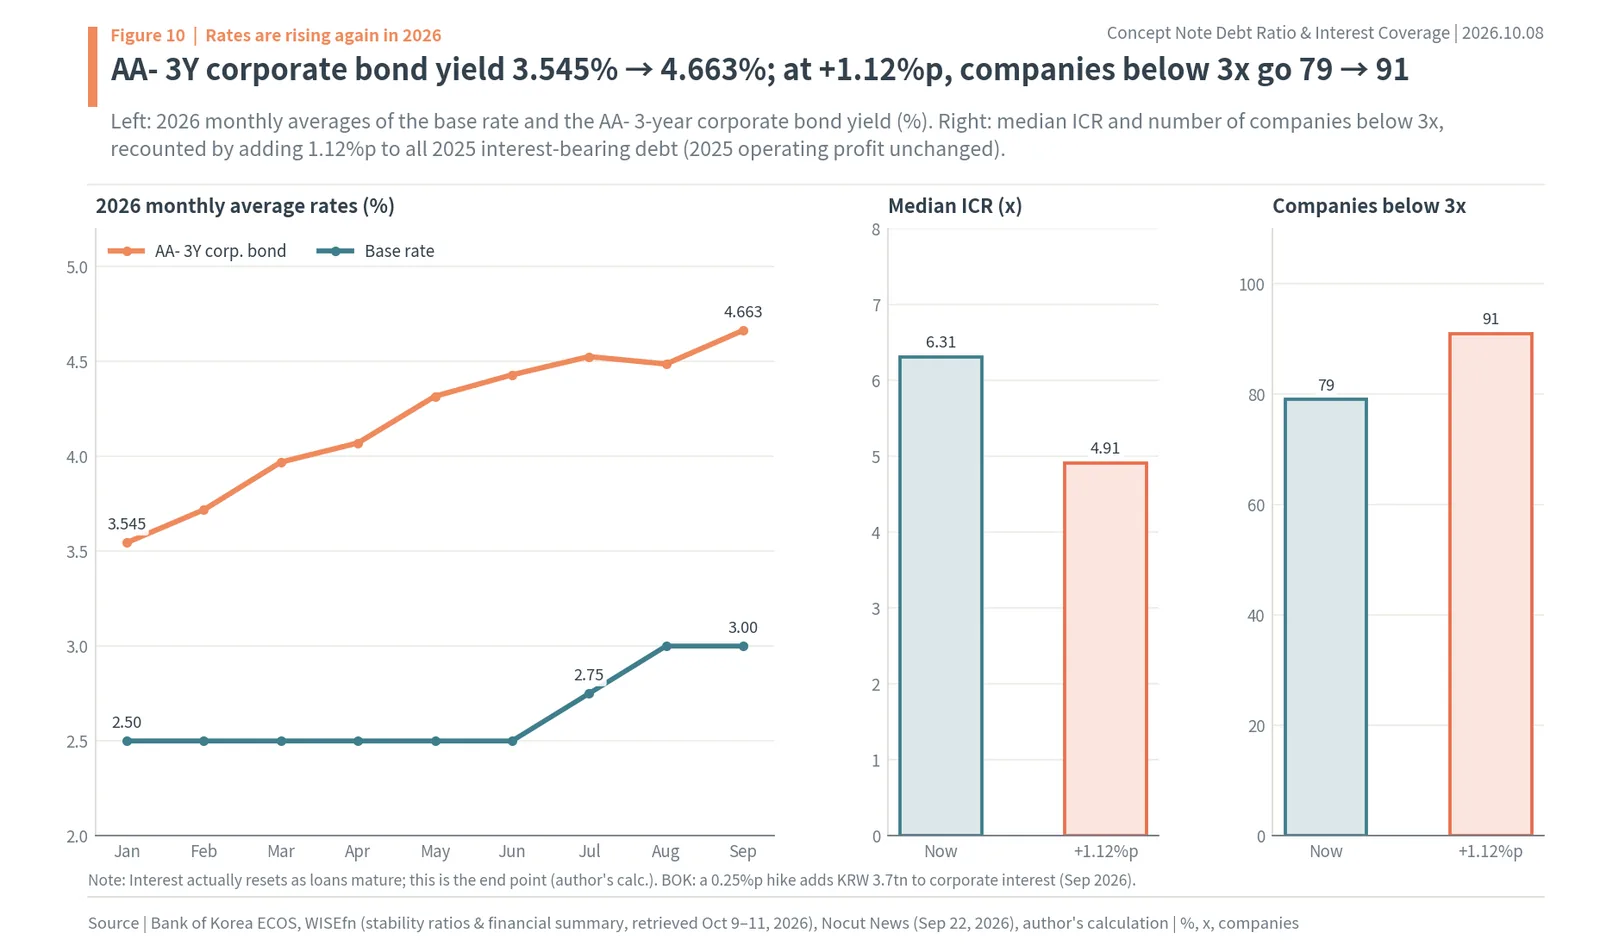
2026 is a year of rising rates again. The Bank of Korea raised its base rate from 2.50% to 2.75% on July 16, its first hike in three years and six months since January 2023 (Bizwatch, July 16, 2026), and to 3.00% on August 27. As the left side of Figure 10 shows, the AA- 3-year corporate bond yield moved ahead of the base rate. From a January average of 3.545% it went to 3.969% in March and 4.429% in June, reaching a September average of 4.663%, up 1.12 points in nine months.
The author calculated how far coverage falls when this rise reaches large-cap interest. Add 1.12 points to all interest-bearing debt at the end of 2025, recompute interest expense, and keep 2025 operating profit unchanged. The median ICR of the 239 companies then falls from 6.31x to 4.91x. Even a 1-point rise gives 5.06x, close to the 2023 median of 4.12x.
By count, companies below 3x go from 79 to 91, as 12 that were at 3x or more slip below it. Two companies newly fall below 1: Hanon Systems (1.13x → 0.96x) and Samhyun. Most of the 53 already below 1 have operating losses and sit below 1 regardless of rates; the rise thins out the 1–3x bracket just above them.
This calculation is an end point. In practice the new rate applies as debts mature, so the 1.12 points do not hit interest all at once. That is the same reason the effective rate companies paid rose about a year after market rates in Figure 6. So the 2026 rate rise will show up more in 2027 interest expense. For companies near 3x today, read their coverage allowing for next year’s higher interest.
How long rates take to reach interest
How fast a rate rise reaches the interest coverage ratio depends on the shape of a company’s debt. A company with many floating-rate loans sees its interest change within a few months of a base-rate move. A company that borrowed with three-year bonds sees its interest change only when they mature and are reissued, so roughly a third of its debt resets each year. The Bank of Korea found that bank lending rates respond most strongly about five months after a base-rate hike (Nocut News, September 22, 2026).
In large caps, this lag is visible in the effective-rate numbers above. The AA- 3-year yield jumped to an annual average of 4.155% in 2022, but the median effective rate large caps paid was 3.17% in 2022 and peaked a year later at 4.56% in 2023. Even in 2024–2025, as market rates fell, the effective rate eased only slowly to 4.36% and 4.13%. The rise in corporate bond yields from January to September 2026 will pass through the same lag and appear in interest expense in the second half of 2026 and in 2027.
16. KEPCO debt: KRW 205.6tn of liabilities and interest coverage
KRW 132.92tn of KRW 205.6tn in liabilities bears interest
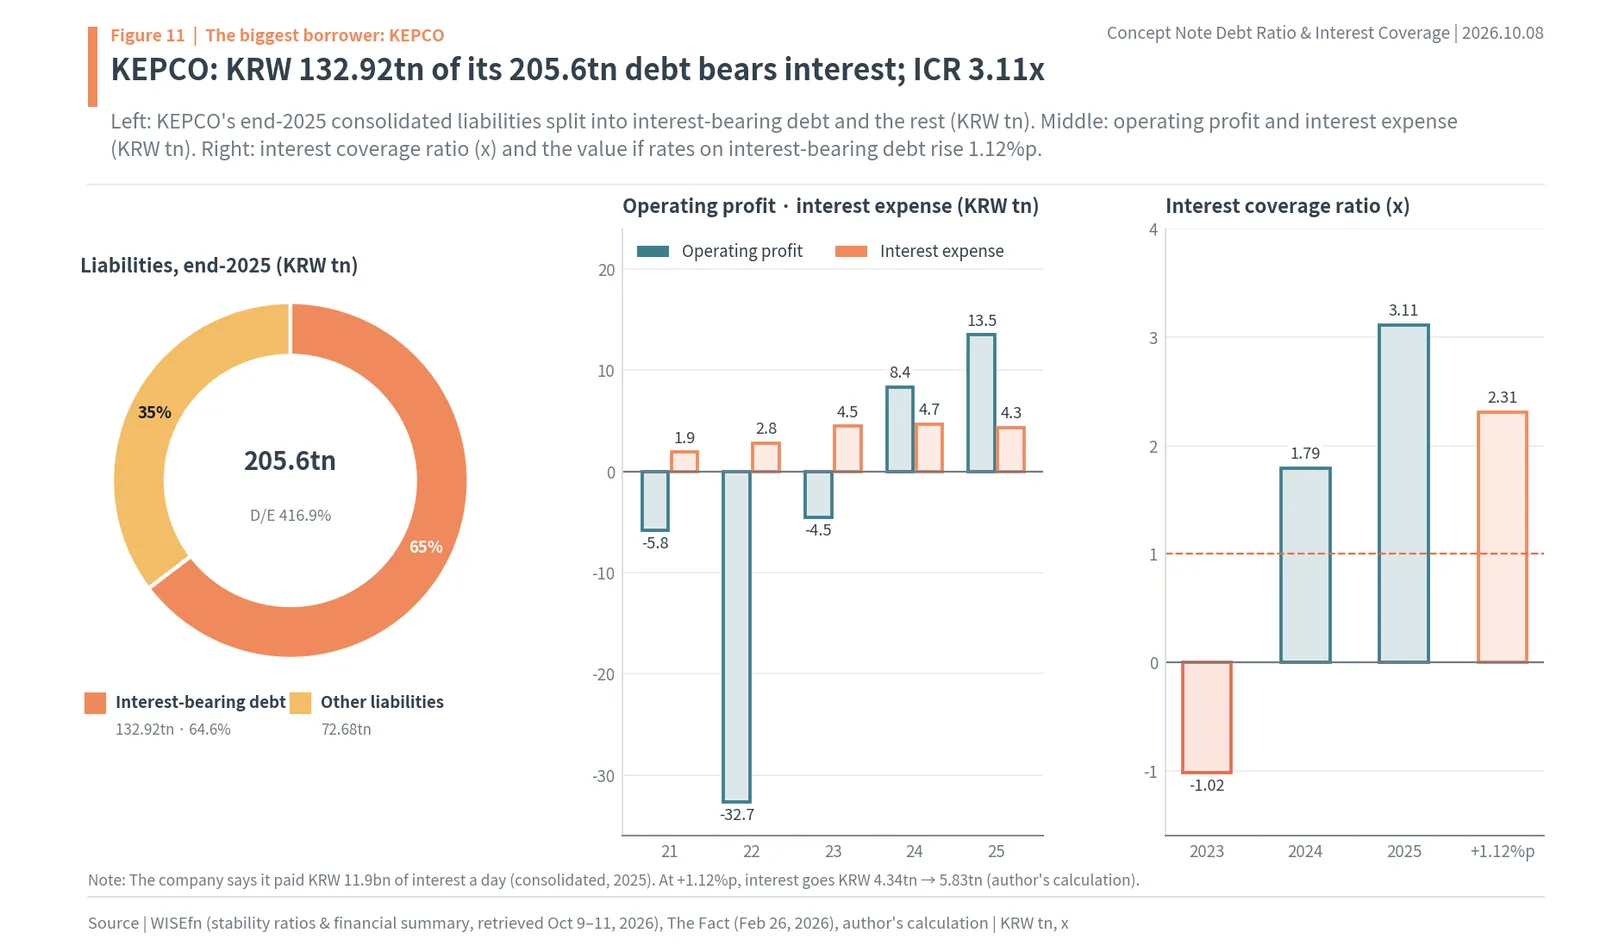
At the end of 2025, KEPCO (Korea Electric Power Corporation) had consolidated liabilities of KRW 205.6tn (about $153.5bn) and a debt-to-equity ratio of 416.9%, the largest debt among large caps. As the donut on the left of Figure 11 shows, KRW 132.92tn (about $99.3bn), or 64.6%, of that is interest-bearing, and the remaining KRW 72.68tn is other liabilities. According to the company, its consolidated interest expense in 2025 was KRW 11.9bn a day (about $8.9m) (The Fact, February 26, 2026). Multiplied over a year that is about KRW 4.34tn, matching WISEfn’s 2025 interest expense of KRW 4.34tn (author’s calculation).
The middle bars show operating profit and interest expense. When fuel costs soared in 2022, the operating loss swelled to KRW 32.7tn, and as the loss was covered with debt, interest-bearing debt grew from KRW 84.94tn in 2021 to KRW 132.92tn in 2025. Interest expense also grew from KRW 1.91tn to KRW 4.45tn in 2023 and KRW 4.67tn in 2024. With operating profit turning to KRW 8.36tn in 2024 and KRW 13.49tn in 2025, coverage recovered from -1.02x in 2023 to 1.79x in 2024 and 3.11x in 2025.
The last bar on the right adds 1.12 points to interest-bearing debt. At 1.12 points more on KRW 132.92tn, interest rises from KRW 4.34tn to KRW 5.83tn (about $3.2bn to $4.4bn), and coverage falls from 3.11x to 2.31x. For a company with this much debt, even a small rate move changes interest by trillions of won. Dividing 2026 consensus operating profit of KRW 7.77tn by 2025 interest gives 1.79x. KEPCO’s interest coverage moves between operating profit, set by electricity tariffs and fuel costs, and interest, set by rates.
17. LG Chem, Lotte Chemical, SK Innovation: interest coverage below 1
All four below 1; LG Chem 23.82x → -0.38x
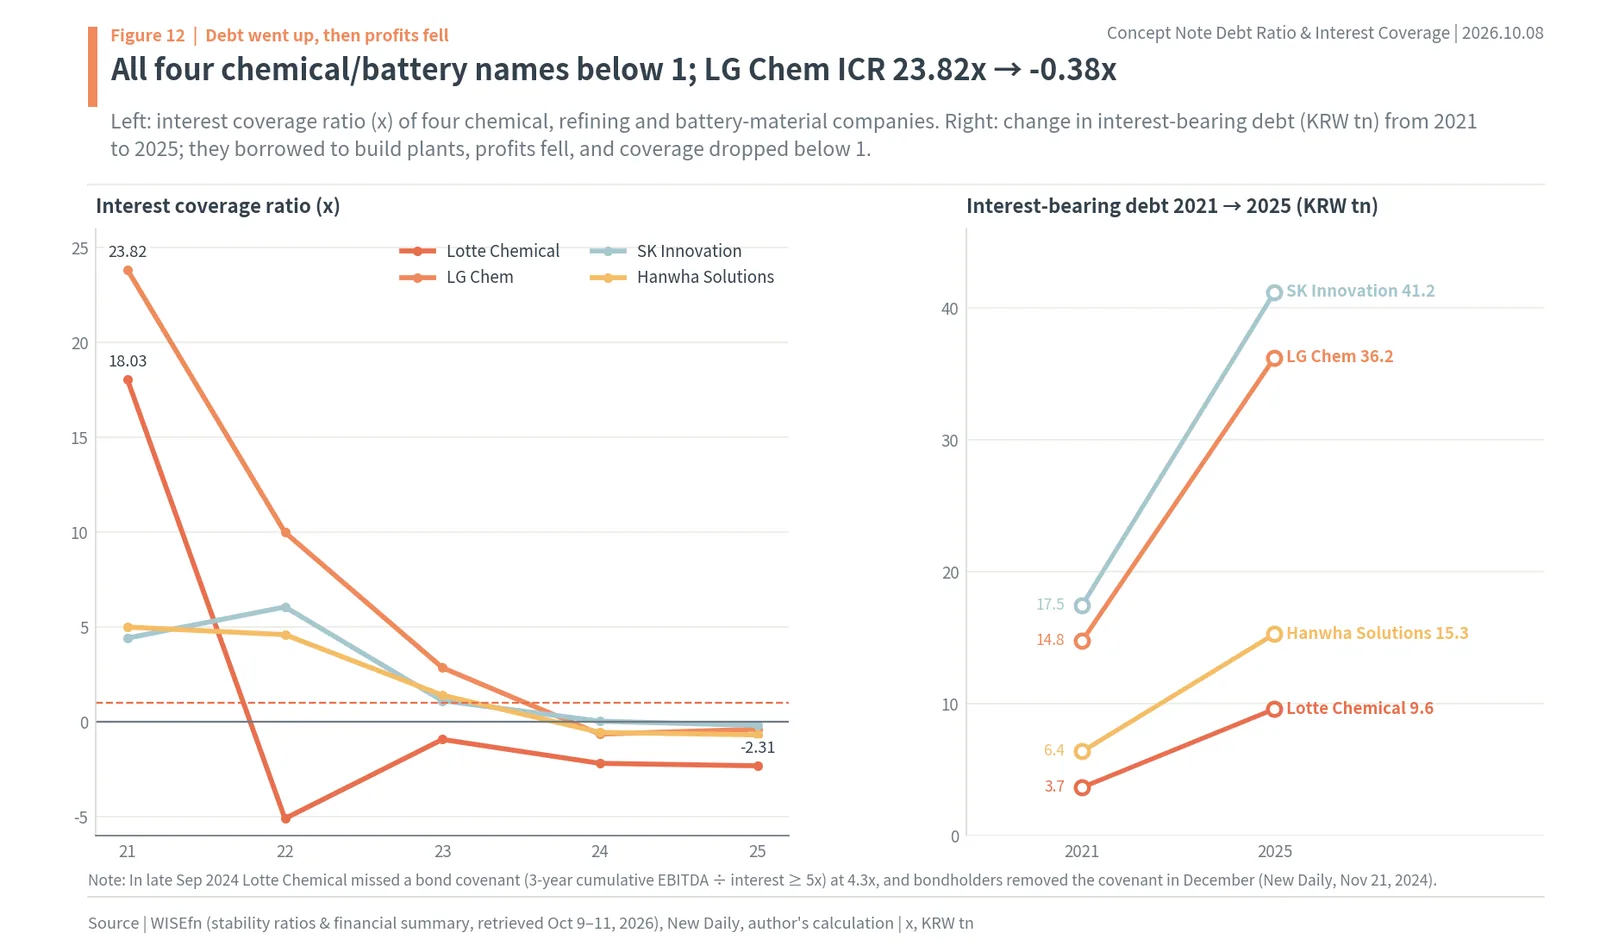
Chemical, refining and battery-material companies borrowed to build plants in 2021–2023, and from 2023 their operating profit shrank as the cycle turned. When the two trends overlap, coverage falls fastest. On the left of Figure 12, LG Chem’s ICR went from 23.82x in 2021 to 9.99x in 2022, 2.86x in 2023, -0.64x in 2024 and -0.38x in 2025. Lotte Chemical went from 18.03x to -2.31x in 2025, SK Innovation from 4.42x to -0.18x and Hanwha Solutions from 5.00x to -0.68x. All four were below 1 in 2025.
The right side shows the change in interest-bearing debt from 2021 to 2025. SK Innovation went from KRW 17.46tn to KRW 41.18tn (about $30.8bn), LG Chem from KRW 14.77tn to KRW 36.22tn, Hanwha Solutions from KRW 6.39tn to KRW 15.29tn and Lotte Chemical from KRW 3.67tn to KRW 9.61tn: all more than doubled. With debt doubling and rates rising, interest expense rose even more. LG Chem’s interest expense went from KRW 0.21tn to KRW 1.22tn, and SK Innovation’s from KRW 0.39tn to KRW 1.53tn.
Borrowing in itself was not the problem. Had the plants run as planned and earned profits, coverage would have stayed high. Coverage fell below 1 because debt and rates grew together in the years profits fell. Credit rating agencies reflected this. In their regular reviews in the first half of 2026, LG Chem was cut from AA+ to AA and SK On from A to A- (Hankyung, July 1, 2026), and the outlook on Lotte Chemical’s AA- rating was changed to negative (Money Today, June 23, 2026). A lower rating raises the yield on the next bond, which raises interest again.
18. Lotte Shopping and E-mart interest coverage ratio
Lotte Shopping below 1 for five straight years; E-mart 0.62x in 2025
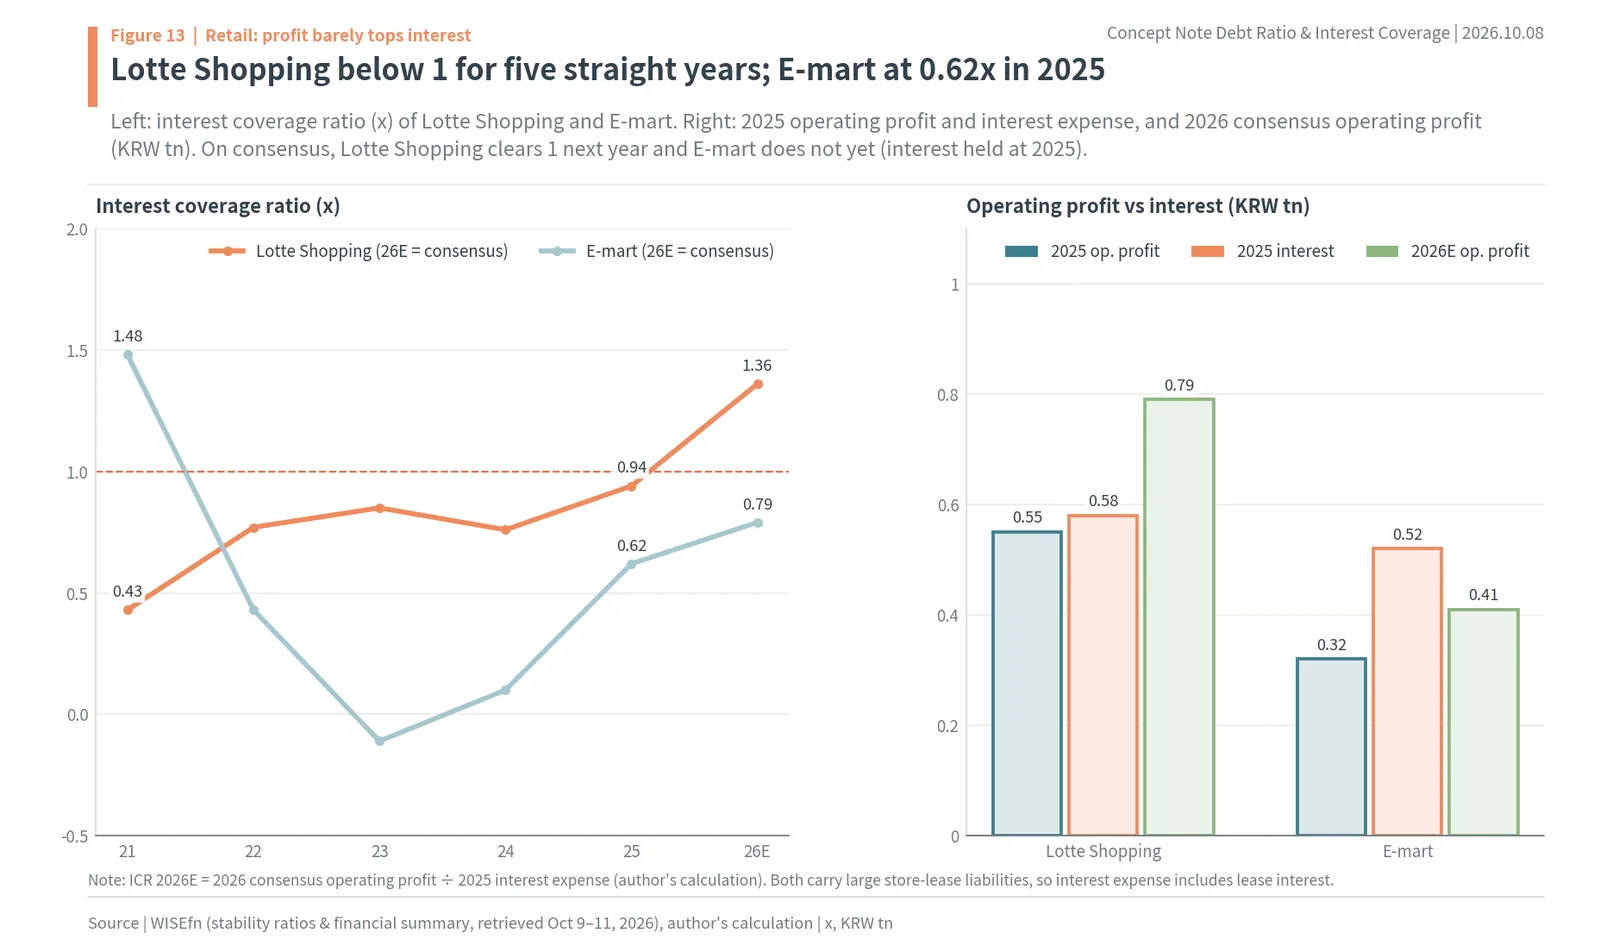
Large retailers have large lease liabilities for rented stores plus borrowings, so their interest expense is high, and fierce competition keeps operating margins thin. On the left of Figure 13, Lotte Shopping’s ICR was 0.43x in 2021, 0.77x in 2022, 0.85x in 2023, 0.76x in 2024 and 0.94x in 2025: below 1 for all five years. Its 2025 operating profit of KRW 0.55tn was slightly smaller than its KRW 0.58tn of interest expense. E-mart fell from 1.48x in 2021 to -0.11x in 2023, then recovered to 0.62x in 2025.
The bars on the right show 2025 operating profit and interest expense and 2026 consensus operating profit. Lotte Shopping’s 2026 operating profit consensus is KRW 0.79tn; holding interest at the 2025 level, its ICR would be 1.36x, above 1. E-mart’s consensus operating profit of KRW 0.41tn is smaller than its KRW 0.52tn of interest, leaving it at 0.79x. For retailers, a change of just a few tens of billions of won in operating profit moves them across 1.
Both companies have large lease (store rental) liabilities, so their interest expense includes lease interest. As the FSS analysis found that the 2019 lease standard raised retailers’ debt-to-equity ratios by an average of 32.9 points, retailers book more accounting debt and interest than their actual borrowings. Still, lease interest is rent paid every month and must come out of operating profit. A company whose coverage hovers around 1 for a long time ends up borrowing more to pay interest as soon as operating profit slips a little. Homeplus, which filed for court receivership in March 2025, posted operating losses of KRW 133.5bn, KRW 260.2bn and KRW 199.4bn in fiscal 2021–2023 while paying interest of KRW 265.8bn, KRW 202.8bn and KRW 302.5bn (Bizwatch, March 4, 2025).
19. Why shipbuilders have high debt-to-equity ratios (HD Hyundai Heavy Industries)
HD Hyundai Heavy Industries: KRW 0.68tn of interest-bearing debt; quarterly ICR 47.31x
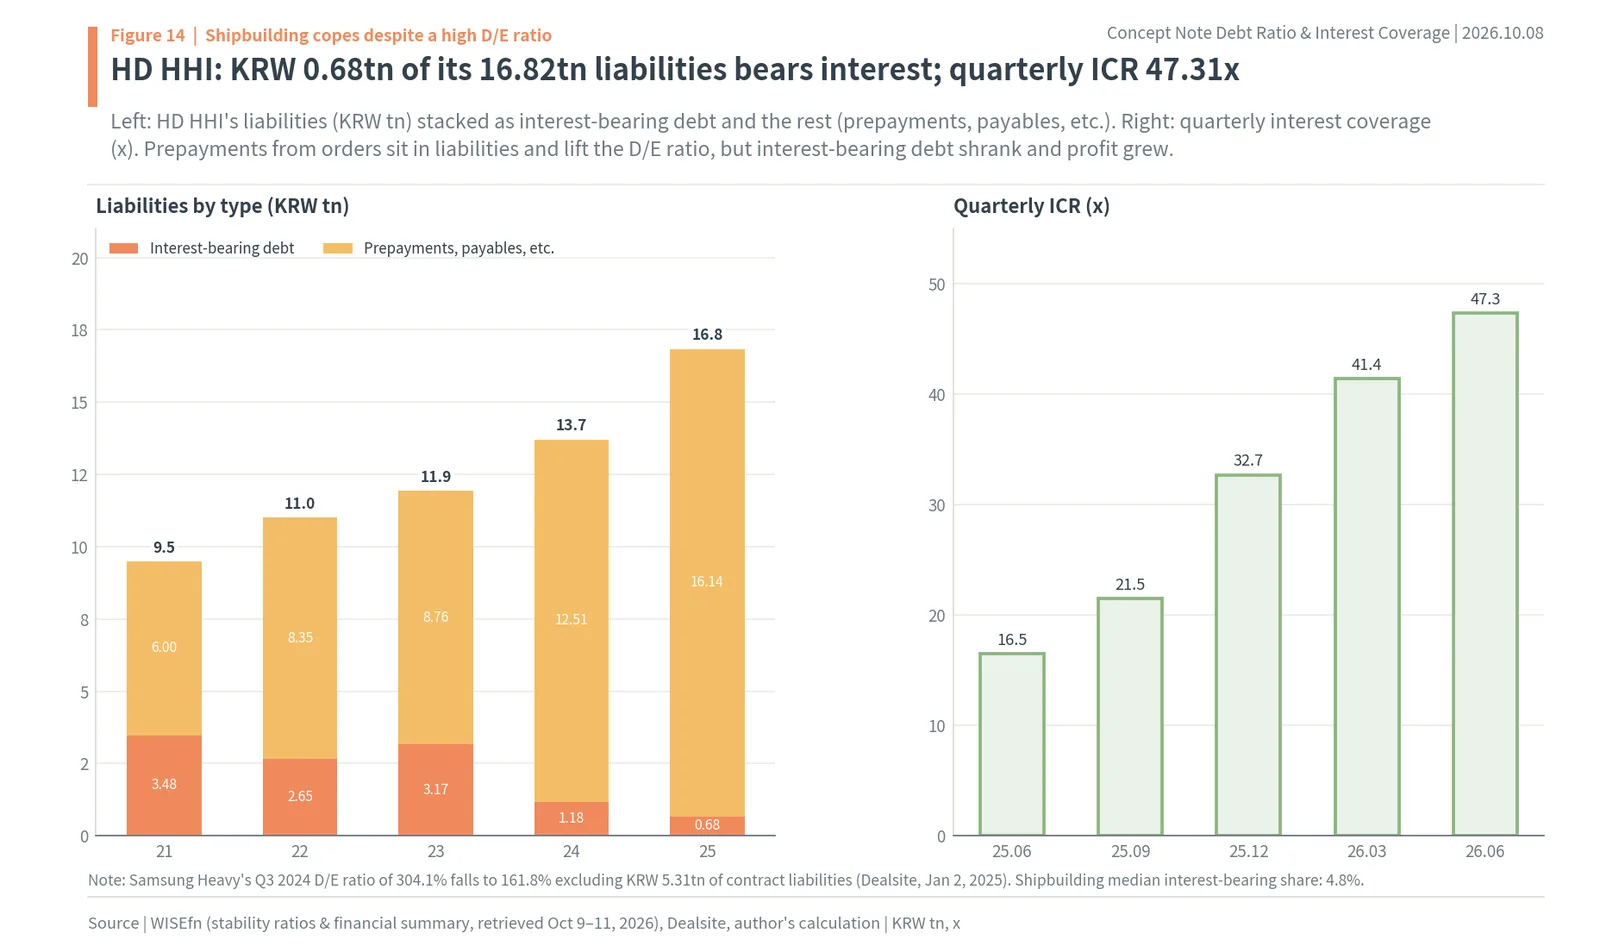
The left side of Figure 14 stacks HD Hyundai Heavy Industries’ liabilities into interest-bearing debt and other liabilities (prepayments, payables and so on). Total liabilities grew from KRW 9.48tn in 2021 to KRW 16.82tn in 2025, while interest-bearing debt fell from KRW 3.48tn to KRW 0.68tn (about $0.51bn). All of the increase was prepayments and payables. As the order backlog grew, money paid in advance by shipowners was booked as liabilities, and the company repaid borrowings with the cash that came in.
The right side shows quarterly coverage. It rose every quarter, from 16.47x in Q2 2025 to 21.47x in Q3, 32.68x in Q4, 41.39x in Q1 2026 and 47.31x in Q2. While quarterly operating profit grew from KRW 0.47tn to KRW 1.04tn, quarterly interest stayed at KRW 0.02–0.03tn. Interest-bearing debt is so small that adding 1.12 points of interest lowers the 2025 ratio only slightly, from 21.1x to 19.56x.
The median interest-bearing share of the 8 shipbuilders is 4.8%. Industries with large prepayments show high debt-to-equity ratios, but that debt turns into revenue and disappears once the ships are built and delivered. When reading such companies’ debt, look at the interest-bearing share and the interest coverage ratio instead of the debt-to-equity ratio, and watch for the point when prepayments start to shrink (when orders slow). As prepayments shrink, cash flows out by the same amount and borrowing can rise again.
20. How to read debt ratios by sector: chips, defense, construction, airlines, batteries
Semiconductors: light debt, and profit covers interest dozens of times
Semiconductors carry the lightest debt load among large caps. The 36 companies have a median debt-to-equity ratio of 30.5% and a median ICR of 19.95x. Samsung Electronics (005930.KS) had a 2025 debt-to-equity ratio of 29.9% and an ICR of 71.97x, and its quarterly ICR in Q2 2026 was 454.27x. SK hynix (000660.KS) has a debt-to-equity ratio of 45.9% and an ICR of 51.1x. As memory prices rose, operating profit came to dozens or hundreds of times interest.
Even chipmakers have had shaky years. SK hynix posted an operating loss in the 2023 memory downturn, with an ICR of -5.26x, and its interest expense grew from KRW 0.26tn in 2021 to KRW 1.47tn in 2023. After borrowing more to get through the downturn, it came back to 17.44x in 2024 and 51.1x in 2025. In industries with big profit swings, coverage swings widely too, so look at how far it falls in a bad year, not only at the ratio in a good one.
Shipbuilding and defense: sectors where the debt-to-equity ratio reads high
Shipbuilding and defense are the typical sectors whose debt-to-equity ratios read high. The 7 defense and aerospace companies have a median debt-to-equity ratio of 206.4%, the highest of any sector. LIG Defense & Aerospace’s debt-to-equity ratio rose from 237.6% in 2021 to 446.4% in 2025, while its ICR rose from 6.95x to 25.32x, because more than 85% of its debt is interest-free prepayments and the like (interest-bearing share 14.3%). Korea Aerospace Industries has a debt-to-equity ratio of 446.6% and an ICR of 4.06x.
In these sectors a rising debt-to-equity ratio usually signals more orders. Prepayments turn into revenue when ships and weapons are delivered, so the ratio rises while the backlog builds and falls in years when deliveries bunch up. HD Hyundai Heavy Industries’ ratio fell from 239.9% in 2024 to 180.1% in 2025 because deliveries and profits increased its equity. In these sectors, look at interest-bearing debt and the net debt ratio instead of the debt-to-equity ratio.
Construction: when profits wobble, coverage flips in a single year
The 11 construction companies have a median debt-to-equity ratio of 133.7% and a median ICR of 3.56x. When building costs rise more than expected, a builder books a large loss in a single year and its coverage flips in a year. Hyundai Engineering & Construction fell from 12.26x in 2023 to -12.57x in 2024, then came back to 5.35x in 2025. Daewoo E&C went from 2.52x in 2024 to -4.45x in 2025, and its debt-to-equity ratio rose from 192.1% to 284.5%. GS E&C was at -1.27x in 2023, 0.91x in 2024 and 1.32x in 2025.
When reading a builder’s debt, also look at debt outside the balance sheet. When a builder guarantees a developer’s real-estate project-finance (PF) loan, the guarantee is not booked as a liability, but if the project stalls it becomes the builder’s debt. Taeyoung E&C applied for a corporate workout on December 28, 2023, when its debt-to-equity ratio including contingent PF liabilities was 498.8% (Aju Business Daily, January 9, 2024). For builders, check the size of PF guarantees along with coverage.
Airlines, telecom and utilities: lots of debt, carried by steady profits
The 7 airline, shipping and logistics companies have a median interest-bearing share of 65.6% and a median ICR of 2.29x. They bring in aircraft and ships with debt and leases, so most of their debt pays interest. Korean Air fell from 4.10x in 2024 to 1.38x in 2025. Its interest expense rose from KRW 0.51tn to KRW 0.81tn, and its interest-bearing debt from KRW 10.95tn in 2023 to KRW 22.49tn in 2025. Its debt-to-equity ratio went from 209.6% in 2023 to 339.9% in 2025.
Telecom and utilities carry a lot of debt, with interest-bearing shares in the 60% range, but steady operating profit from fees and tariffs pays the interest. SK Telecom has a debt-to-equity ratio of 132.4% and an ICR of 2.80x; KT 120.7% and 6.75x. The telecom median is 3.42x and utilities 3.21x. Because profits in these sectors neither surge nor collapse, coverage stays around 3x for long periods. When rates rise, coverage is cut by exactly as much as interest grows, so the rate-adjusted ratio matters especially here.
Batteries: profit and interest diverged while plants were being built
The 17 battery and materials companies have a median debt-to-equity ratio of 128.8% and a median ICR of 0.71x; along with chemicals and refining, they are the two sectors whose median is below 1. LG Energy Solution went from 11.47x in 2021 to 4.71x in 2023, -1.60x in 2024 and -0.37x in 2025, while its interest expense grew from KRW 0.07tn to KRW 0.82tn. Samsung SDI went from 20.08x in 2022 to -6.37x in 2025. Operating profit shrank as electric-vehicle demand weakened while they were building plants in North America.
The battery sector’s median interest-bearing share is high at 65.9%. Plants are built with debt, and it takes years before they run and earn profits. If rates rise and demand weakens in the meantime, interest rises and profit falls, so coverage drops fastest. Conversely, when utilization rises, fixed costs are spread out, operating profit jumps and coverage recovers quickly. Read a battery maker’s interest coverage on two axes: utilization and interest rates.
21. Quarterly interest coverage ratio in 1H 2026
SK Innovation -1.01x → 9.26x; Korean Air -0.92x
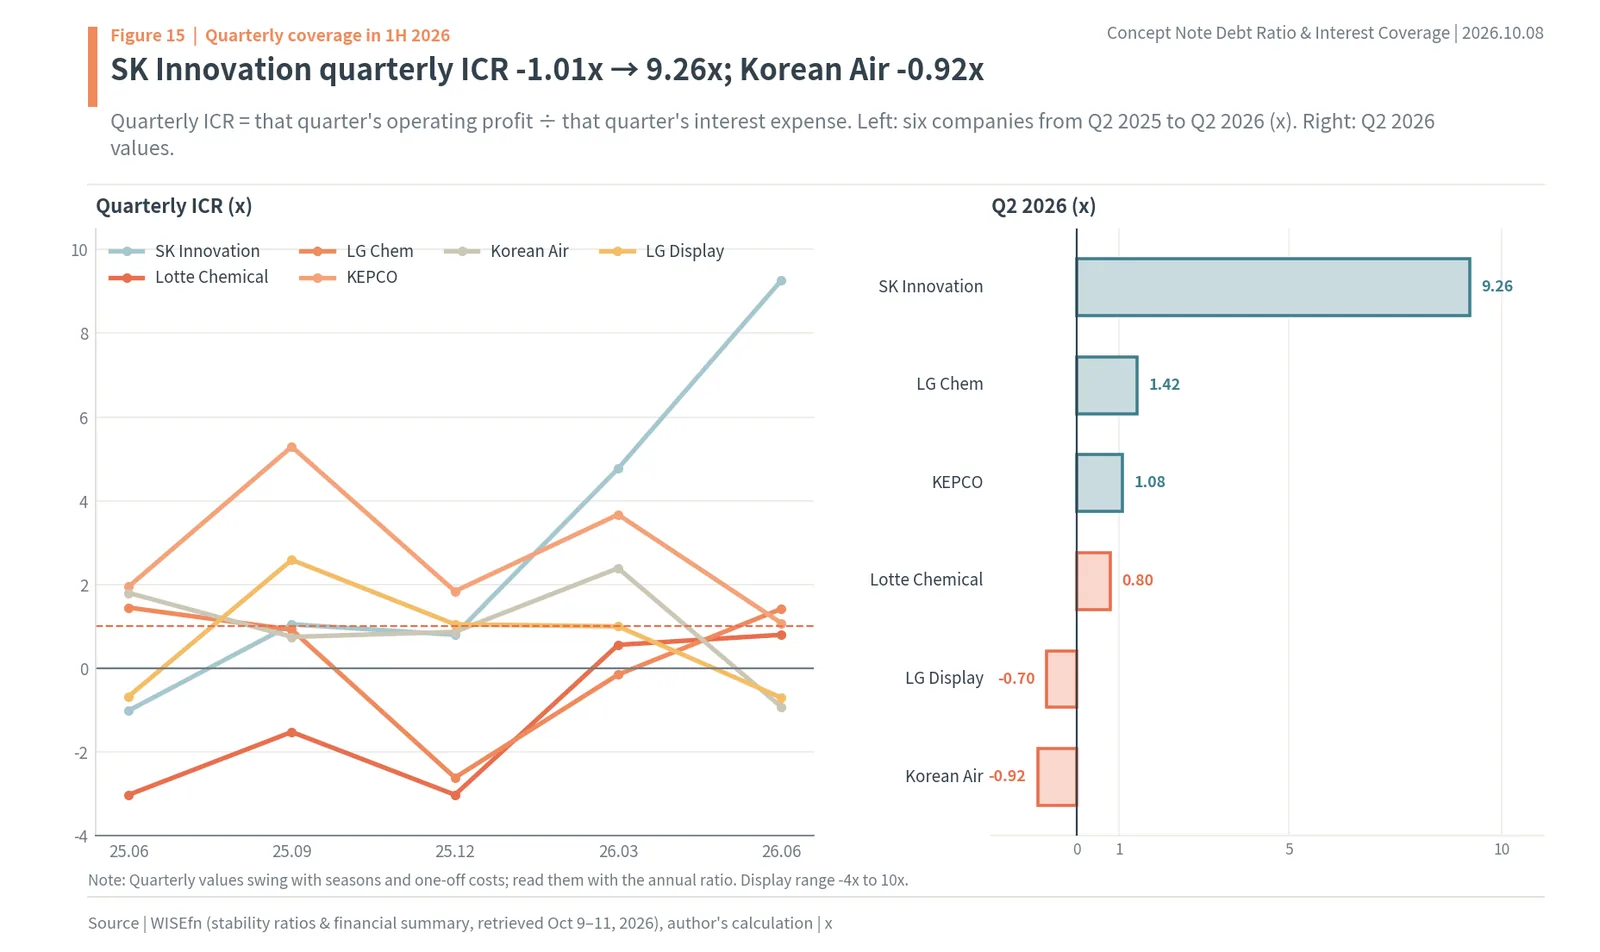
Annual numbers show the past up to last year. This year’s trend is read from the quarterly ICR (that quarter’s operating profit ÷ that quarter’s interest expense). The left side of Figure 15 traces six companies from Q2 2025 to Q2 2026. SK Innovation recovered from -1.01x in Q2 2025 to 4.77x in Q1 2026 and 9.26x in Q2. A company that posted a KRW 0.40tn operating loss in Q2 2025 earned KRW 3.49tn of operating profit in Q2 2026, covering its quarterly interest of KRW 0.38tn more than nine times. When refining profits return, even a heavily indebted company’s coverage recovers quickly.
Some companies moved the other way. Korean Air fell from 2.39x in Q1 2026 to -0.92x in Q2, posting a KRW 0.21tn operating loss in the second quarter against KRW 0.23tn of quarterly interest. Its debt-to-equity ratio also rose from 339.9% at the end of 2025 to 390.7% in Q2 2026. LG Display was at -0.70x in Q2, Lotte Chemical 0.80x, KEPCO 1.08x and LG Chem 1.42x. The bars on the right show the Q2 2026 values.
Quarterly numbers swing widely with seasons and one-off costs. KEPCO fell from 5.29x in Q3 2025 to 1.84x in Q4, then recovered to 3.67x in Q1 2026. So do not judge on a single quarter; look at the trailing four quarters together with the annual ratio. When the quarterly ratio moves in the same direction for two or three quarters in a row, the annual ratio follows.
22. Interest coverage on 2026 consensus operating profit
Recounted on consensus, 17 of 207 are below 1
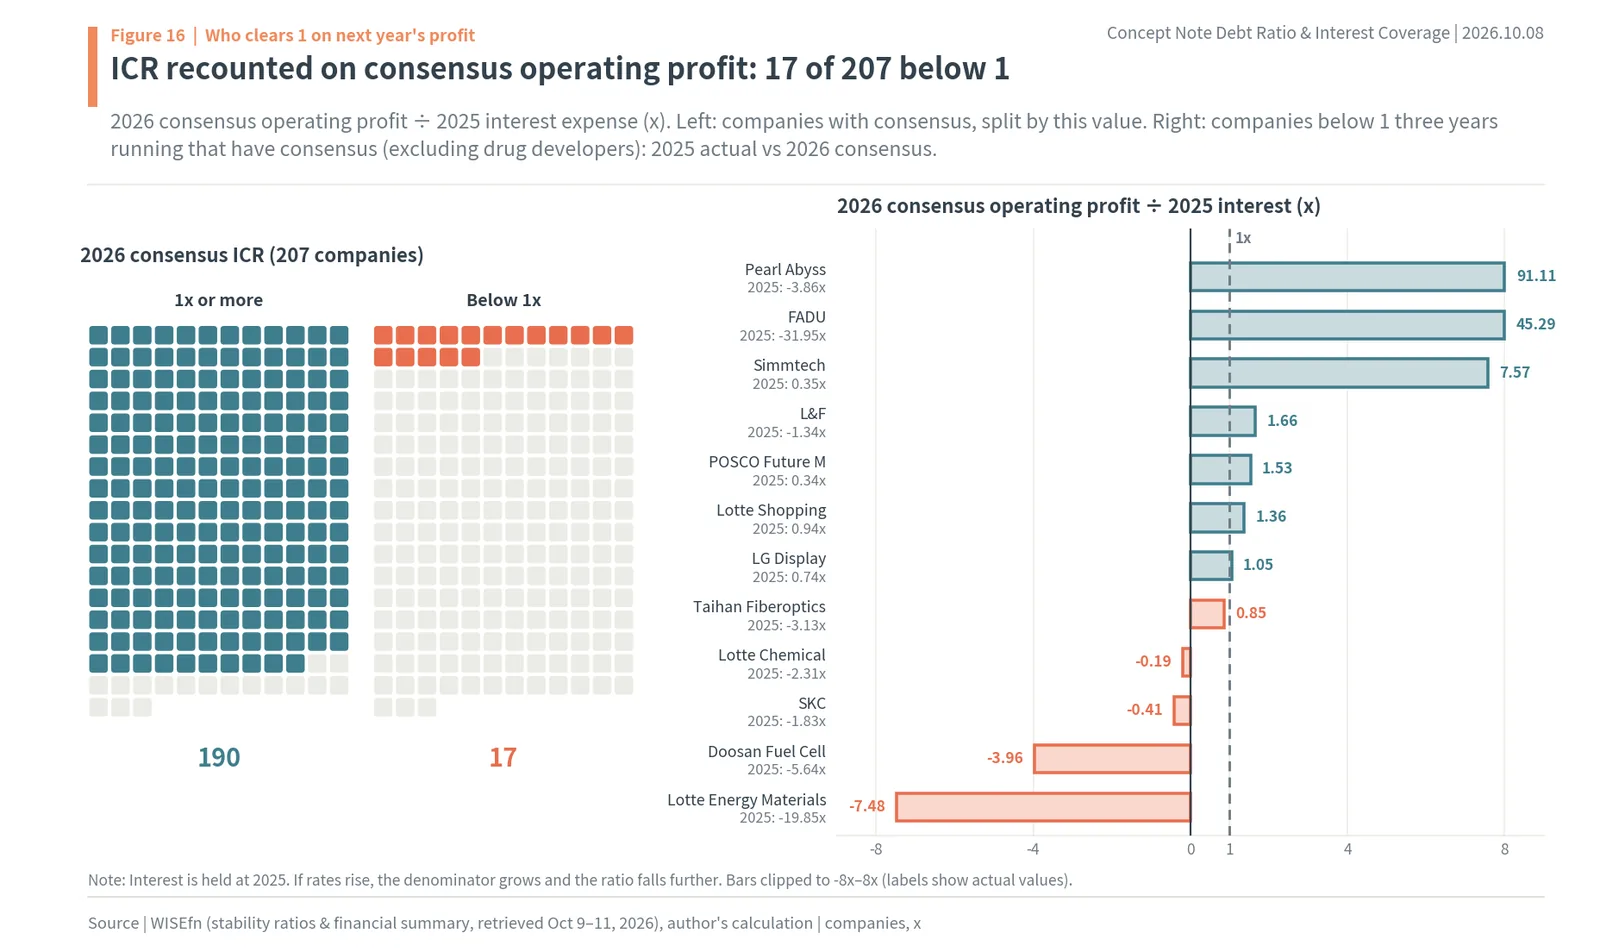
Operating profit, the numerator of the interest coverage ratio, can be brought forward with brokers’ consensus. The author recounted dividing 2026 consensus operating profit by 2025 interest expense. Of the 207 companies with consensus, 17 come out below 1, far fewer than the 53 actually below 1 in 2025. Companies with consensus are larger companies whose profits brokers estimate, so many were already profitable, and brokers have built recoveries in chemicals, batteries and retail into their numbers.
The right side shows the 2026 values for companies below 1 three years running that have consensus (excluding drug developers). Pearl Abyss (91.11x), FADU (45.29x) and Simmtech (7.57x) clear 1 by a wide margin if profits come in at consensus. L&F (1.66x), POSCO Future M (1.53x), Lotte Shopping (1.36x) and LG Display (1.05x) barely clear it. Taihan Fiberoptics (0.85x), Lotte Chemical (-0.19x), SKC (-0.41x), Doosan Fuel Cell (-3.96x) and Lotte Energy Materials (-7.48x) stay below 1 even on consensus profit.
These values hold interest at the 2025 level. As in the rate calculation above, once the 2026 rate rise reaches interest, the denominator grows and the values fall further. A company that barely clears 1 drops back below it if profit falls slightly short of consensus or interest rises slightly. So for companies at 1.0–1.7x, check each quarter whether operating profit is tracking consensus.
23. Marginal (zombie) firms in Korea: Bank of Korea and FKI statistics
Marginal-firm share of audited firms 17.1% → 19.1%; 27.6% of listed companies
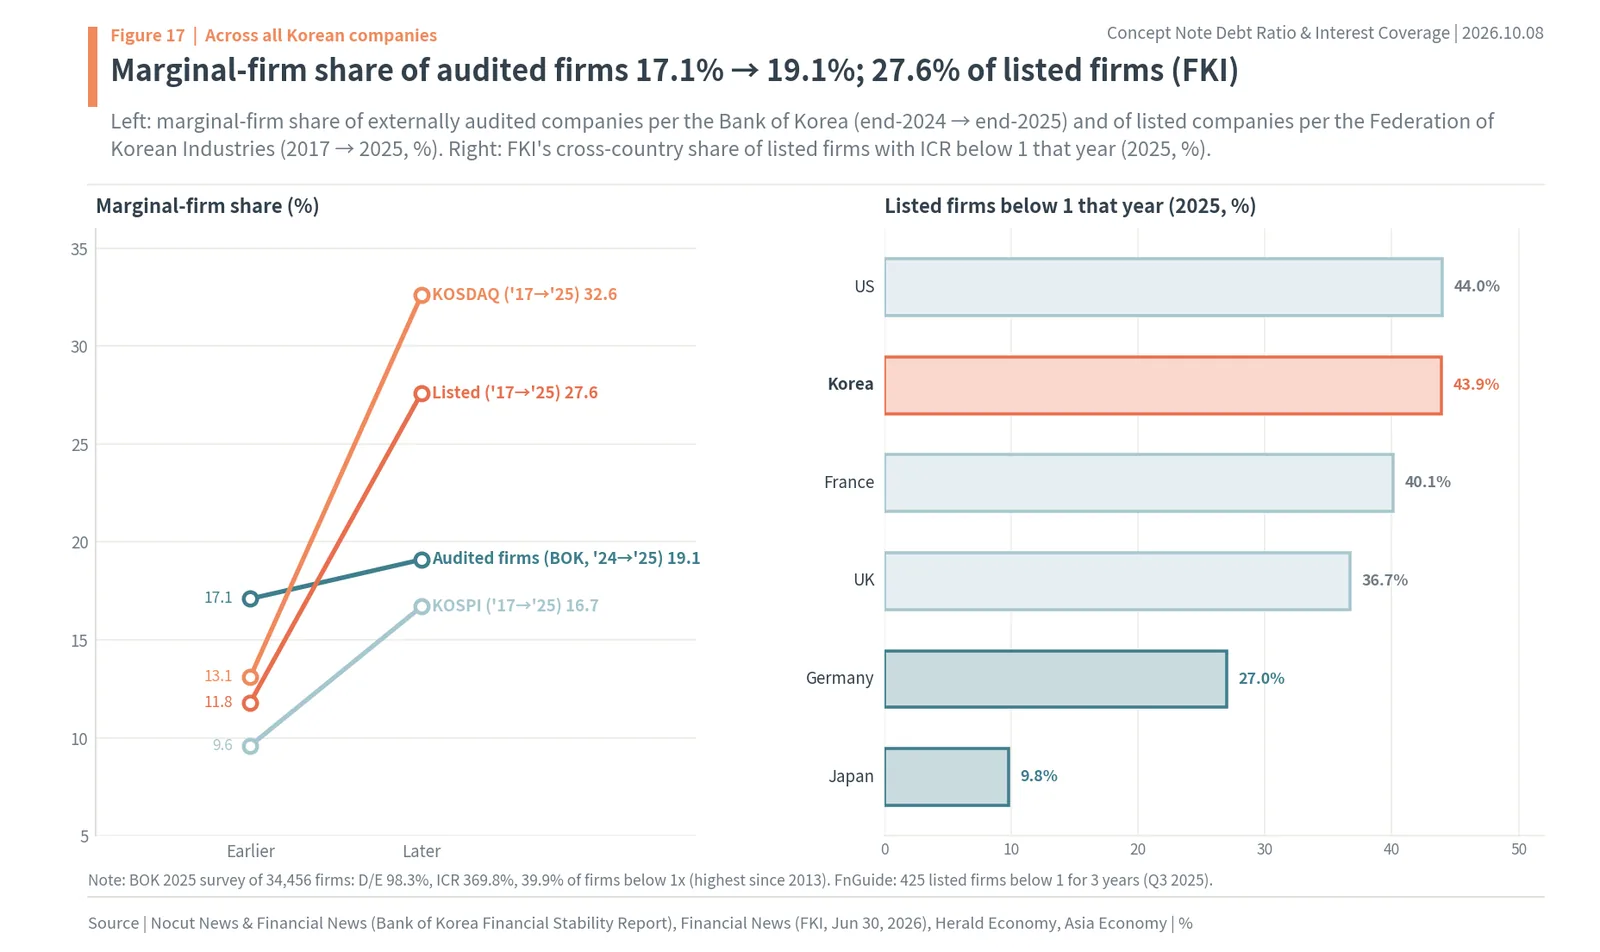
Widen the lens beyond large caps and more companies cannot pay their interest. The Bank of Korea said the share of marginal firms (ICR below 1 three years running) among externally audited companies reached 17.1% at the end of 2024, the highest since 2010 (Financial News, September 25, 2025), and in its September 2026 Financial Stability Report said it rose further to 19.1% in the fourth quarter of 2025 (Nocut News, September 22, 2026). In the 2025 Financial Statement Analysis, the overall interest coverage ratio rose to 369.8%, but the share of companies unable to cover interest with operating profit (coverage below 1x) was 39.9%, the highest since the statistics began in 2013 (Herald Economy, June 9, 2026). While highly profitable companies pulled the aggregate number up, the share of companies that cannot pay interest grew.
Among listed companies alone, the share is higher. The Federation of Korean Industries (FKI) counted the marginal-firm share of Korean listed companies at 27.6% in 2025, up 15.8 points from 11.8% in 2017. KOSPI went from 9.6% to 16.7% and KOSDAQ from 13.1% to 32.6% (Financial News, June 30, 2026). By FnGuide’s count, 425 non-financial listed companies (83 on KOSPI, 342 on KOSDAQ) had an ICR below 1 three years running as of the first three quarters of 2025 (Asia Economy, January 5, 2026).
The right side of Figure 17 shows FKI’s cross-country comparison of the share of listed companies with an ICR below 1 that year. In 2025 it was 44.0% in the US, 43.9% in Korea, 40.1% in France, 36.7% in the UK, 27.0% in Germany and 9.8% in Japan. Every country has many companies below 1 in a single year, but in the share where such years last three in a row, Korea ranked second only to the US (30.7%). Compared with 27 (11.3%) of the 239 large caps below 1 three years running, companies that cannot pay interest become more common the smaller the company.
What happens when a company cannot pay its interest
When years below 1 continue, a company borrows more, sells assets or issues new shares to pay interest. Borrowing more raises next year’s interest and pushes coverage lower. If it breaks a bond covenant, it must post collateral or amend the covenant, as Lotte Chemical did, and if its credit rating falls, its next borrowing rate rises. In June 2026, a JoongAng Group affiliate failed to repay a bond and filed for court receivership, and JTBC’s credit rating was cut to D.
Credit ratings and interest rates are part of this chain. Rating agencies set ratings partly by coverage and the size of borrowings, and the lower the rating, the higher the bond yield. In January 2026, when the AA- 3-year corporate bond yield was 3.459%, the BBB- 3-year yield was 9.303% (Money Today, June 23, 2026). On the same KRW 1tn of debt, a BBB- company pays KRW 58.44bn (about $43.6m) more interest a year than an AA- company (author’s calculation). When low coverage leads to a downgrade, the interest on the next debt rises, and the higher interest lowers coverage again: a loop forms.
When losses accumulate, equity shrinks and the debt-to-equity ratio jumps. If equity falls below half of paid-in capital (capital impairment of 50% or more), the stock becomes an “administrative issue,” and if equity falls to zero or below (full capital impairment), it becomes grounds for delisting. The delisting reform announced in February 2026 extended the full-impairment test from the fiscal year-end to the half-year, and raised the market-cap requirement to KRW 30bn (July 2026) and KRW 50bn (January 2027) on KOSPI and KRW 20bn and KRW 30bn on KOSDAQ (Shin & Kim, March 10, 2026). When low coverage lasts long enough, it eventually leads to the debt-to-equity ratio and the listing requirements.
24. Interest coverage ratio: EBITDA vs operating profit, interest vs finance costs
Operating-profit basis vs EBITDA basis
The interest coverage ratio changes depending on what goes in the numerator. This report, the Bank of Korea and WISEfn use operating profit. Bond contracts and credit ratings often use EBITDA, operating profit plus depreciation. Depreciation spreads the cost of equipment already bought and involves no cash outflow that year, so EBITDA is closer to the cash available to pay interest. The more equipment a company has, the higher its EBITDA-based ratio compared with the operating-profit-based one.
Lotte Chemical’s bond covenant used this basis. The covenant required “three-year cumulative EBITDA ÷ interest expense of 5x or more,” and it fell short at 4.3x at the end of September 2024 (New Daily, November 21, 2024). Over the same period its operating-profit-based coverage was already negative. That a company can show 4.3x on EBITDA and below 1 on operating profit is the difference between the two numbers. When you see an interest coverage ratio in an article or a filing, first check whether the numerator is operating profit or EBITDA, and whether it covers one year or several.
Interest expense vs finance costs
The denominator differs too. Finance costs on the income statement include not only interest expense but also foreign-exchange losses, derivative losses and valuation losses on financial assets. In a year of big currency moves, finance costs can be several times interest expense. Only with interest expense alone in the denominator does the ratio measure the strength to pay interest on debt accurately. WISEfn’s interest coverage ratio uses non-operating interest expense as the denominator.
Lease interest also needs checking. Since the 2019 lease standard, rent on leased stores, aircraft and ships is split into interest on lease liabilities and depreciation. So the interest expense of retailers, airlines and shipping companies includes both interest on borrowings and lease interest. Some companies disclose figures excluding lease interest, but lease payments also go out every month, so this report uses total interest expense.
Quarterly numbers and holding-company numbers
The quarterly interest coverage ratio is that quarter’s operating profit divided by that quarter’s interest expense. To use it on the same footing as the annual ratio, divide the sum of the last four quarters’ operating profit by the sum of four quarters’ interest expense. Looking at a single quarter, peak and off seasons and one-off costs swing the number widely. As KEPCO’s quarterly ratio fell from 5.29x in Q3 2025 to 1.84x in Q4, it is common for the same company’s quarterly value to change three- or fourfold.
A holding company’s consolidated numbers add up all its subsidiaries’ debt and interest. When looking at a holding-company stock, the consolidated debt-to-equity ratio and coverage show the whole group’s position, but the debt the holding company itself must repay is in its separate financial statements. This report removed holding companies from the 239 for the same reason: so as not to count the same debt twice, at the subsidiary and at the holding company. When looking at a holding company, put the consolidated and separate numbers side by side.
The 1x and 3x lines
An interest coverage ratio of 1x is the line the Bank of Korea and the FSS use to separate marginal firms. It means operating profit equals interest: the business pays only the interest and does not reduce principal by a single won. 3x is the reference line this report uses to separate “room to spare.” A company at 3x can still pay its interest if operating profit falls by two-thirds, and keeps 1.5x if rates double. Of the 239 large caps, 26 were in the 1–3x bracket in 2025, and 79 were below 3x in all.
Similar yardsticks are used abroad. The asset manager Robeco counted the share of “zombie companies” with an ICR below 1 three years running at about 1% of MSCI World mid and large caps and 7.8% of small caps at the end of September 2025 (Robeco, October 29, 2025). That companies unable to pay interest are rarer among larger companies holds in Korea too. The share of the 239 large caps below 1 three years running was 11.3%, lower than the 27.6% FKI counted for all listed companies.
25. Six steps to check a stock’s debt (Lotte Chemical, HD Hyundai Heavy Industries, KEPCO)
Lotte Chemical: low debt-to-equity ratio, but below 1 three years running
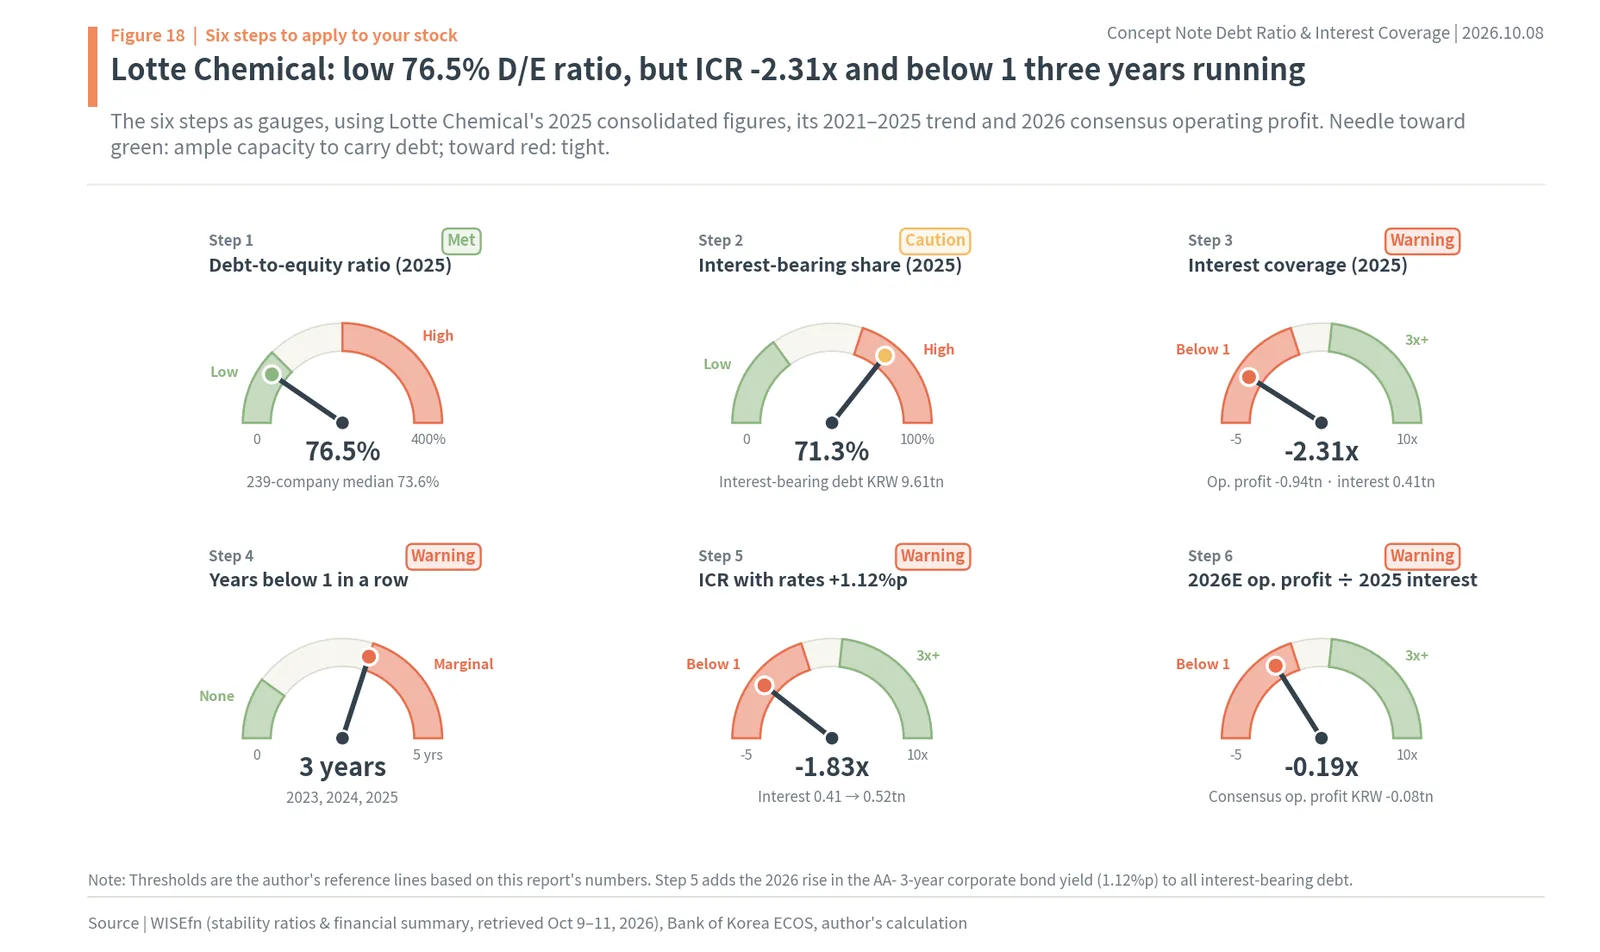
The order so far is summarized in six steps readers can apply directly to their own stocks. All the numbers can be found in the stability and financial summary tables under “Company info” (WISEfn) on each stock’s page in Naver Finance. Figure 18 is a set of gauges applying the six steps to Lotte Chemical. A needle toward green means ample strength to carry debt; toward red means it is tight.
Step 1 is the debt-to-equity ratio: total liabilities ÷ total equity. Lotte Chemical’s was 76.5% in 2025, close to the 239-company median of 73.6%, so on the amount of debt alone it looks fine. At this step, check whether the number is above 200% and whether it has risen quickly over a few years. Lotte Chemical’s rose 28.5 points in five years, from 48.0% in 2021.
Step 2 is the interest-bearing share: interest-bearing liabilities from the financial summary divided by total liabilities. Lotte Chemical’s is 71.3%, with KRW 9.61tn of debt paying interest, higher than the large-cap median of 47.8%. If this share is low (shipbuilding, 4.8%), set aside the Step 1 warning even if the debt-to-equity ratio is high; if it is high (chemicals and refining, 69.3%), look harder at Step 3.
Step 3 is the interest coverage ratio: operating profit ÷ interest expense. Lotte Chemical’s was -2.31x in 2025, an operating loss of KRW 0.94tn against interest of KRW 0.41tn. 3x or more is ample, 1–3x leaves little room, and below 1 means operations do not cover the interest. Step 4 extends Step 3 to three years. Lotte Chemical was below 1 in 2023, 2024 and 2025, which meets the Bank of Korea’s definition of a marginal firm.
Step 5 adds interest rates. Adding the 2026 rise in corporate bond yields, 1.12 points, to interest-bearing debt raises Lotte Chemical’s interest from KRW 0.41tn to KRW 0.52tn, and its ICR becomes -1.83x. With an operating loss the ratio stays negative, but it means the money going out as interest grows by more than KRW 0.1tn on top of the money needed to cover the loss. Step 6 adds next year’s profit. 2026 consensus operating profit is KRW -0.08tn; divided by 2025 interest that is -0.19x. Even on brokers’ estimates, it does not clear 1 next year.
After the six steps, Step 1’s “looks safe” turns into a “warning” at Steps 3 to 6. What this order does is shift the view from the amount of debt to its weight. Lotte Chemical’s quarterly ICR in 2026 rose to 0.56x in Q1 and 0.80x in Q2, close to 1, so the next checkpoint is whether this value clears 1 in the next quarter’s results.
Second example: HD Hyundai Heavy Industries warns only at Step 1
Applying the same six steps to HD Hyundai Heavy Industries gives the opposite result. Step 1, the debt-to-equity ratio, is 180.1%, more than twice the 239-company median of 73.6%, in warning territory. But at Step 2 the interest-bearing share is 4.1%: of KRW 16.82tn in liabilities, only KRW 0.68tn pays interest. The Step 1 warning was created by prepayments.
Step 3, the 2025 ICR, is an ample 21.1x. Step 4, the trend, shows -6.37x in 2021 and -2.72x in 2022, two years below 1, then a rise every year from 1.35x in 2023. It does not meet the three-years-running test. Step 5, adding 1.12 points, still leaves 19.56x because interest-bearing debt is small, and Step 6, 2026 consensus operating profit of KRW 4.05tn divided by 2025 interest, gives 41.98x. The quarterly ratio for Q2 2026 is 47.31x.
Putting the two companies side by side shows what the six steps are for. Lotte Chemical looked safe at Step 1 and turned to a warning at Steps 2 to 6; HD Hyundai Heavy Industries looked risky at Step 1 and turned to ample at Steps 2 to 6. Judge both on the debt-to-equity ratio alone and you read both backwards.
Three companies on the same yardstick
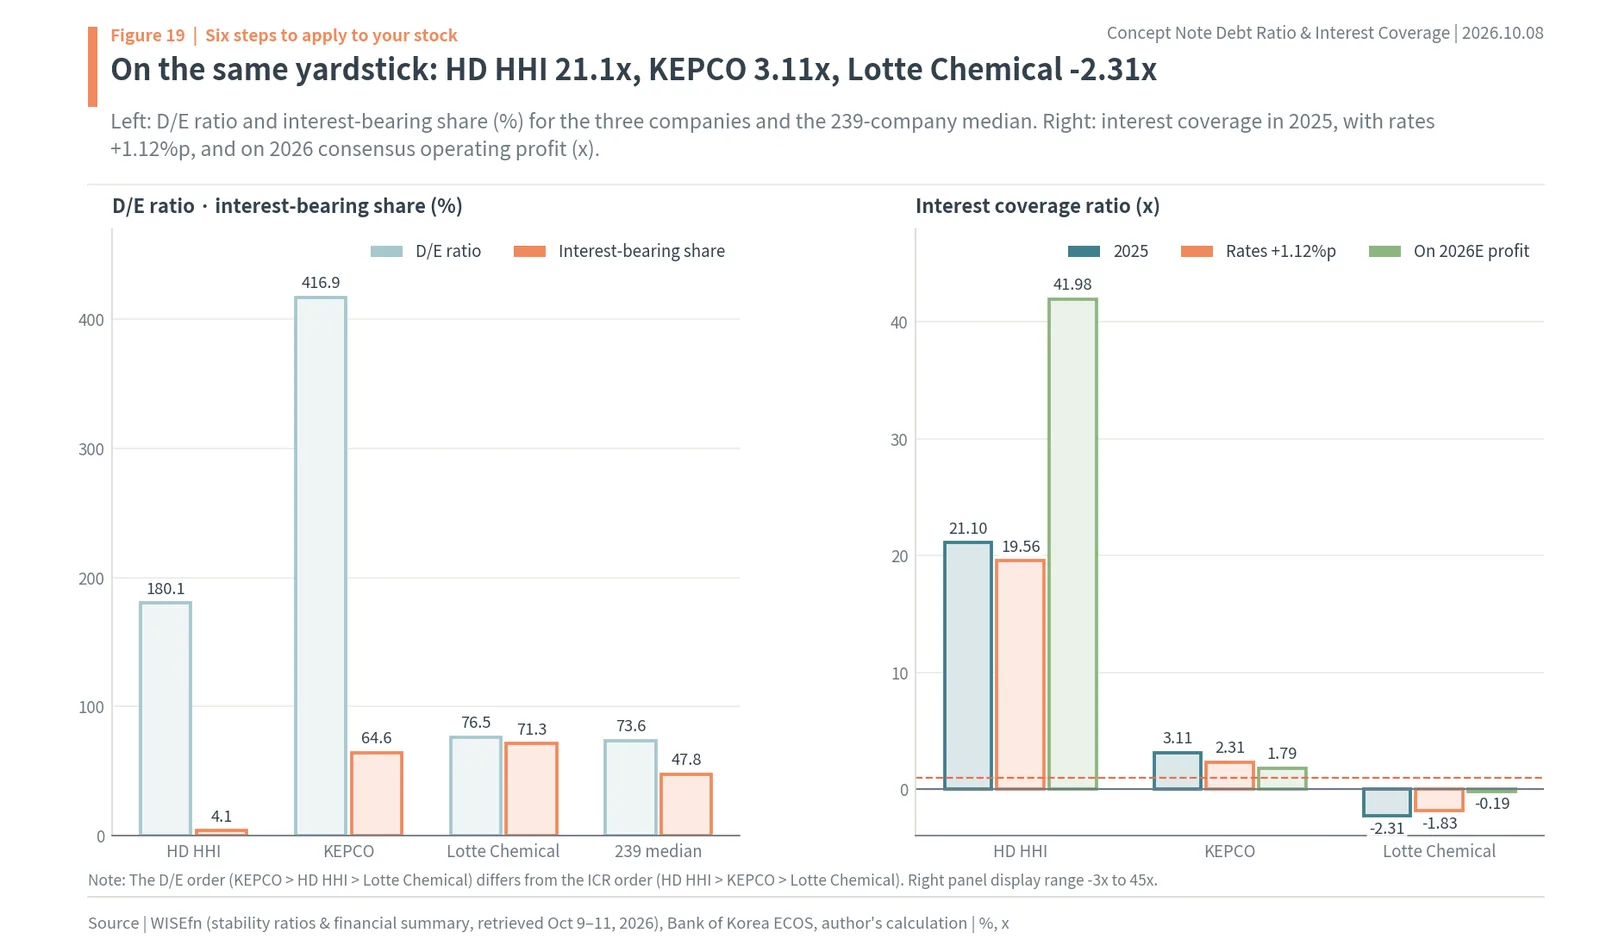
Figure 19 applies the same steps to three companies side by side. By debt-to-equity ratio the order is KEPCO (416.9%), HD Hyundai Heavy Industries (180.1%) and Lotte Chemical (76.5%). By interest coverage it is HD Hyundai Heavy Industries (21.1x), KEPCO (3.11x) and Lotte Chemical (-2.31x). The two orders differ: the company with the lowest debt-to-equity ratio has the weakest strength to pay interest.
On the left, the interest-bearing share is 4.1% at HD Hyundai Heavy Industries, 64.6% at KEPCO and 71.3% at Lotte Chemical, against a 239-company median of 47.8%. On the right, adding 1.12 points leaves HD Hyundai Heavy Industries almost unchanged, from 21.1x to 19.56x, while KEPCO goes from 3.11x to 2.31x and Lotte Chemical from -2.31x to -1.83x. On 2026 consensus operating profit, HD Hyundai Heavy Industries is at 41.98x, KEPCO 1.79x and Lotte Chemical -0.19x.
The three companies show a single chain. The more interest-bearing debt, the more rates change interest; the smaller operating profit, the more the extra interest drags coverage toward 1. So when you look at your own stock, do not stop at the debt-to-equity ratio; line up, in turn, the interest-bearing share, three years of interest coverage, the rate-adjusted ratio and the ratio on next year’s profit.
Where to find the numbers
All the numbers for the six steps are available in brokerage apps or Naver Finance. On a stock’s page in Naver Finance, click “Company info” to open the WISEfn screen. The stability table under “Financial analysis” or “Investment indicators” lists the debt-to-equity ratio, net debt ratio, current ratio and interest coverage ratio by year and by quarter, and the financial summary table has total liabilities, interest-bearing liabilities, operating profit and brokers’ consensus operating profit together. For original filings, find the schedules of borrowings and finance costs in the notes to the financial statements of the annual report on DART, Korea’s electronic disclosure system.
The calculation takes three lines. Divide interest-bearing liabilities by total liabilities to get the interest-bearing share; add interest-bearing liabilities × the rate increase to interest expense to get rate-adjusted interest; and divide operating profit (or next year’s consensus operating profit) by that interest. Every number for the 239 companies in this report was calculated with these three lines. For the rate increase, use something close to what the company borrows at, such as the AA- 3-year corporate bond yield, and use a bigger increase for companies with lower credit ratings.
26. Debt-to-equity ratio and interest coverage ratio: key takeaways
The debt-to-equity ratio is the amount of debt, total liabilities divided by total equity, and about half of that debt is interest-free debt such as prepayments and trade payables. The interest coverage ratio is operating profit divided by interest expense, the strength to carry debt: it shows how many times operations cover the interest on the part of the debt that generates it. Among 239 large Korean listed companies, 41 of the 53 with a 2025 ICR below 1 had a debt-to-equity ratio under 200%, and the 27 below 1 three years running included 16 companies outside drug development and biotech, in batteries and chemicals, chips and displays, and retail.
Interest coverage followed interest rates. While the base rate rose from 1.00% to 3.50%, the median large-cap interest expense grew 2.16 times and the median ICR fell from 10.71x to 4.12x. Adding the 1.12-point rise in the AA- 3-year corporate bond yield in 2026 to interest-bearing debt moves the median from 6.31x to 4.91x and the number of companies below 3x from 79 to 91. In a year of rising rates, coverage is cut first at companies with a lot of interest-bearing debt and little operating profit.
So when you look at your own stock’s debt, keep the order. If the debt-to-equity ratio is high, first split the debt into prepayments and borrowings; if it is low but coverage is near 1, first check the trend in operating profit. Add three years of history, the rate-adjusted ratio and the ratio on next year’s profit, and you can see whether today’s debt will be heavier or lighter next year. In 2026, with rates rising again, check companies with a lot of interest-bearing debt and coverage below 3x first, in this order.
마오채둥 정리. The debt-to-equity ratio is the amount of debt, so shipbuilders with large prepayments read high and chemical companies whose profits have fallen read low. Whether debt is heavy is read from the share of interest-bearing debt and how many times operating profit covers that interest (the interest coverage ratio). The median ICR of 239 large Korean companies fell from 10.71x to 4.12x as rates rose in 2021–2023, and adding the 1.12-point rise in 2026 corporate bond yields pulls it down again from 6.31x to 4.91x. The debt-to-equity ratio is the amount of debt; the interest coverage ratio is the strength to carry it.
Debt-to-Equity Ratio and Interest Coverage Ratio FAQ
Q. How do you calculate the debt-to-equity ratio and the interest coverage ratio?
Debt-to-equity ratio = total liabilities ÷ total equity × 100. Interest coverage ratio = operating profit ÷ interest expense. A company with KRW 100bn of equity and KRW 150bn of liabilities has a debt-to-equity ratio of 150%; a company with KRW 20bn of operating profit paying KRW 0.5bn of interest has an interest coverage ratio of 40x.
Q. What is a good interest coverage ratio?
Below 1x, operating profit does not cover interest; the Bank of Korea calls a company below 1 three years running a marginal firm. This report uses 3x as the line for room to spare: a company at 3x can still pay its interest if operating profit falls by two-thirds. The median of 239 large Korean companies was 6.31x in 2025.
Q. Why can a company with a high debt-to-equity ratio be safe?
Because much of its debt may carry no interest. Shipbuilders book customer prepayments as liabilities. HD Hyundai Heavy Industries has a debt-to-equity ratio of 180.1%, but only 4.1% of its debt (KRW 0.68tn of KRW 16.82tn) bears interest, and its interest coverage ratio was 21.1x in 2025.
Q. How do rising interest rates affect the interest coverage ratio?
As debts mature and reset at higher rates, interest expense rises and coverage falls. While the base rate rose from 1.00% to 3.50%, the median coverage of 239 large Korean companies fell from 10.71x to 4.12x. Adding the 1.12%p rise in 2026 AA- corporate bond yields to interest-bearing debt cuts it from 6.31x to 4.91x.
Q. What is a zombie (marginal) company in Korea?
A company whose interest coverage ratio is below 1 three years running. Their share of externally audited Korean companies rose from 17.1% at the end of 2024 to 19.1% in Q4 2025, and 27 of 239 large caps met the test in 2023–2025, including Lotte Chemical, POSCO Future M and LG Display.
Sources
- WISEfn (Naver company data), investment indicators: stability (debt-to-equity ratio, total liabilities, total equity, net debt ratio, current ratio, interest coverage ratio, operating profit, non-operating interest expense; 2021–2025 and Q2 2025–Q2 2026) and financial summary (interest-bearing liabilities, consensus operating profit), retrieved Oct 9–11, 2026
- Korea Exchange (KRX), market caps of all listed stocks, Oct 8, 2026
- Bank of Korea ECOS, base rate (722Y001) and AA- 3-year corporate bond yield (721Y001), 2016–Sep 2026
- Yahoo Finance, USD/KRW (KRW=X) close, Oct 8, 2026
- Herald Economy, FSS data on marginal-firm lending (link), Oct 12, 2025
- Herald Economy, Bank of Korea 2025 Financial Statement Analysis (link), Jun 9, 2026
- Financial News, Bank of Korea Financial Stability Report: marginal-firm share (link), Sep 25, 2025
- Nocut News, Bank of Korea September 2026 Financial Stability Report (link), Sep 22, 2026
- Bizwatch, July Monetary Policy Board base-rate hike (link), Jul 16, 2026
- Financial News, FKI marginal-firm share of listed companies (link), Jun 30, 2026
- Asia Economy, FnGuide count of listed companies with ICR below 1 three years running (link), Jan 5, 2026
- Dealsite, Samsung Heavy Industries contract liabilities and debt-to-equity ratio (link), Jan 2, 2025
- Dealsite, Jeju Air perpetual bond (link), Sep 30, 2026
- Etoday, FSS analysis of the impact of the lease accounting standard (link), Aug 1, 2019
- New Daily, Lotte Chemical bond covenant (link), Nov 21, 2024
- Money Today, credit ratings and corporate bond yields in 1H 2026 (link), Jun 23, 2026
- Hankyung, 1H 2026 regular rating reviews (link), Jul 1, 2026
- The Fact, KEPCO 2025 results (link), Feb 26, 2026
- Bizwatch, Homeplus court receivership filing (link), Mar 4, 2025
- Newsis, JoongAng Group affiliate receivership filing (link), Jun 15, 2026
- Shin & Kim, newsletter on the delisting reform (link), Mar 10, 2026
- Aju Business Daily, Taeyoung E&C workout (link), Jan 9, 2024
- Robeco, zombie companies in MSCI World, Oct 29, 2025