Gold Price Down 25.9%: Why Real Yields, Not Central Banks, Now Set the Gold Price (2026 Outlook)
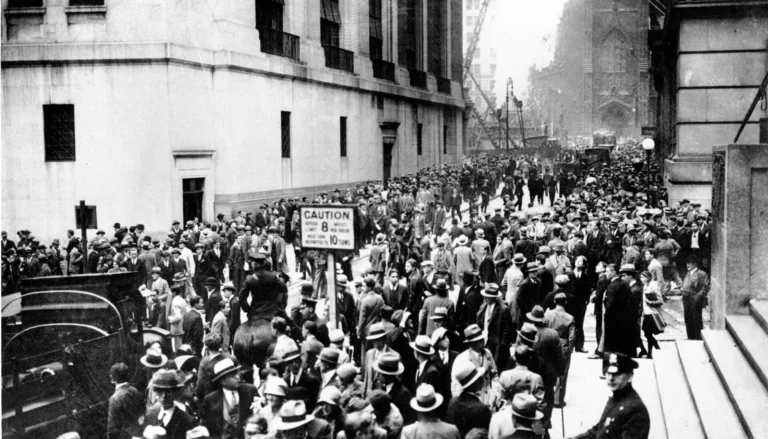
On January 21, 1980, the London gold fix was $850 an ounce. No day in history had seen gold that expensive. Three days earlier, on January 18, gold had crossed $800 for the first time, and the market was worrying about the Iran hostage crisis and the Soviet invasion of Afghanistan at the same time. The US Federal Reserve was in the middle of a fight with inflation. Consumer price inflation climbed to 14.8% in March 1980, and Paul Volcker, who had become Fed chair in August 1979, had called an emergency press conference on October 6 that year to announce that the Fed would squeeze the money supply directly. The federal funds rate reached a record 20% by the end of 1980.
Gold could not hold up against those rates. By June 1982 it had fallen to about $297.5, roughly 65% below the $850 peak. The bottom kept sinking for years after that and only stopped at $252.80 on July 20, 1999. Gold did not trade above $850 again until January 2008. From peak to peak took 28 years.
So what about this time? On January 29, 2026, spot gold hit a record $5,594.82 an ounce. On October 19 it was $4,147.87, 25.9% below the peak. The Fed raised its policy rate again on September 16, and 16 of its 19 officials expect another hike this year. This report uses numbers to ask whether this 25% drop is also the start of a long rest for gold in front of interest rates.
As of: October 20, 2026. Spot gold is Reuters’ New York afternoon price on October 19; futures are October 20 closes. Won amounts are converted at KRW 1,327.0 per dollar, the Oct 20, 2026 close (Yahoo Finance). Numbers the author calculated are marked as such.
Topics covered: the 1980 and 2013 cases where rates stopped gold, the path gold took in 2026 and the single day of January 30, what real yields and the domestic premium mean (with a hypothetical example), why rates rose again, how the link between gold and real yields broke and came back, the central-bank buying that propped gold up in 2022-2025 and its slowdown, how much of the drop real yields explain, the “bull market to 2030” and “no new high” views, the author’s view and the conditions for a recovery, why Korean investors lost more, related stocks and dates to watch, and the basis of calculation.
1980 and 2026 are alike in one way: rates stopped gold
The 1980 case is the starting point for reading this drop. That year, war and inflation pushed gold up, and interest rates pulled it down. Gold pays no interest and no dividend. It protects the value of money when prices rise, but once interest rates are higher than inflation, whoever holds gold gives up the interest they would have earned in a bank. Volcker’s 20% rate was the policy that made that forgone interest the largest it has ever been.
The 2026 picture fits the same frame. In January, froth inside the gold market made the peak. After war with Iran resumed at the end of February, oil jumped and the Fed could no longer cut. In September the Fed actually raised rates. There are differences too. In 1980 rates were 20%; today the Fed’s target range is 3.75-4.00%. The 1980 fall was 65% over about two and a half years after the peak; this fall is 25.9% over nine months. So this report does not expect 1980 to repeat itself. It starts only from the principle that is the same: interest rates set the direction of gold.
The left side of the figure puts the 1980 peak of $850 next to about $297.5 in June 1982 and the 1999 low of $252.80. The right side compares the size of the falls. After 1980 gold fell -65.0%; in 2026 it has fallen -25.9% so far. In 1980 rates went to 20% to fight 14.8% inflation. In 2026 inflation is not that high, but the real yield, the interest rate after inflation, rose quickly and made holding gold more expensive. The rest of this report asks how much of this drop that real yield explains, and what would have to change for gold to rise again.

In 2026, gold came down twice: once when the January froth cleared, then following rates
Gold did not collapse in one move in 2026. There was a first drop, when it fell sharply in a single day from the late-January peak, and a second drop, a slow slide after March as hopes for rate cuts vanished and the September hike arrived. The two drops have different causes. The first was froth built up inside the market draining away. The second was the cost of holding gold going up.
Spot gold hit a record $5,594.82 on January 29 (Reuters). Peak figures differ slightly from outlet to outlet because they mix spot and futures, intraday and closing prices. This report uses Reuters spot prices for both the peak and today. At the New York afternoon on October 19, spot gold was $4,147.87, 25.9% below the peak. On closing prices of gold futures on the New York Mercantile Exchange, gold went from a January high of $5,318.4 to $4,142.5 on October 20, down 22.1%. Futures closes cannot capture the intraday top, so the fall looks smaller.

The chart links weekly closes of gold futures since the start of 2025. Over 2025, gold rose from the $2,600s to the $4,300s, and it raced up to the January 2026 peak. The line then bent sharply in early February, stepped down from March onward, and reached the year’s lowest futures close of $3,992.1 on July 16. It bounced briefly in August, then fell back to the $4,100s after the Fed’s September hike.
A single day, January 30, shows the froth at the top
On January 30, President Trump named Kevin Warsh as his nominee for the next Fed chair. Warsh was known as strict on inflation, and the market took it to mean rate cuts would come later. That day spot gold fell more than 9.8%, its largest one-day fall since 1983 (Reuters). Silver futures fell 31.4% in a day, their biggest one-day drop since March 1980. The same day, CME, the Chicago Mercantile Exchange, announced it would raise gold futures margins from 6% to 8%, effective after the close on February 2. When margins rise, investors who bought gold with borrowed money have to put up more cash or sell.
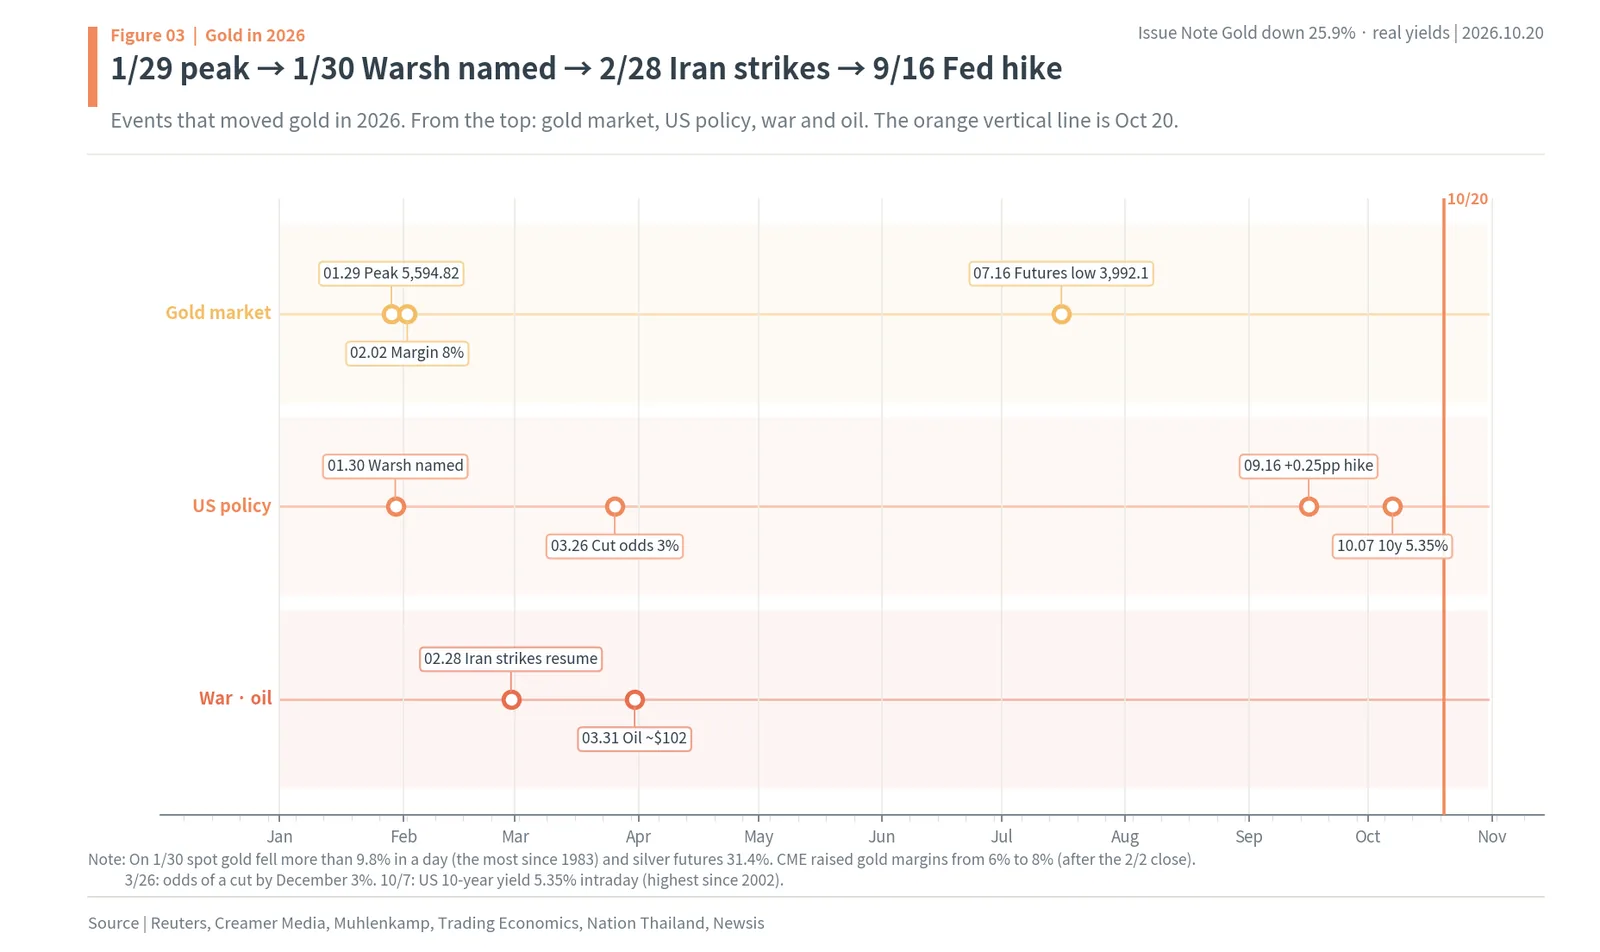
The timeline lays out the events that moved gold in 2026, from the top: the gold market, US policy, and war and oil. The January 29 peak, the January 30 Warsh nomination and the February 2 margin hike are packed into ten days. On February 28, the US and Israel resumed strikes on Iran, and with Iran closing the Strait of Hormuz, oil went from about $65 in February to about $102 at the end of March. On March 26, the odds of a rate cut by year-end dropped to 3%. On September 16 (US time) the Fed raised rates by 0.25 percentage point, and on October 7 the US 10-year Treasury yield touched 5.35% intraday, its highest since 2002.
The size of January 30 is clearer next to other assets. Indexed to January 2, 2026 = 100, silver nearly doubled by late January and is now below half of that peak. GDX, a US-listed ETF of gold mining companies, moved more than gold. Compared with the January 29 close, gold futures are now 22.1% lower, silver futures 49.8% lower and GDX 19.9% lower.

Silver fell more than twice as much as gold because the silver market is small and a lot of its buying was done with borrowed money. The same froth was present in gold, and the part of the drop that came from it draining away is what real yields cannot explain. The chapter “About 60% of the drop is explained by real yields” below splits the 25.9% fall into the part real yields explain and the rest.
Three groups of buyers carried gold to the top
To see why gold fell, first look at how it rose. On futures, gold was $2,641 at the end of 2024, $4,341 at the end of 2025, $4,745 at the end of January 2026 and $5,248 at the end of February (month-end closes). It nearly doubled in a little over two years. The buyers behind that rise fall into three groups: central banks, funds and investors buying gold ETFs, and individuals buying gold bars and coins.
The first group, central banks, bought more than 1,000 tonnes a year from 2022. When Russia invaded Ukraine in February 2022, Western countries froze the Russian central bank’s foreign reserves. Countries that saw that money held in dollars and euros could be frozen by someone else’s decision began adding gold, which no one can freeze. China, Poland, Türkiye and India led the way. In a World Gold Council (WGC) survey, 89% of central banks expected global central-bank gold holdings to rise over the next year, and a record 45% said they planned to raise their own. That thinking has not changed. What has changed is the pace of buying.
The second group is gold ETFs. In 2025, gold ETFs bought 801.2 tonnes, the second-largest amount on record. Compared with net selling of 2.9 tonnes in 2024, more than 800 tonnes of buying appeared in a single year. As the Fed cut rates three times in the second half of 2025, holding gold got cheaper and fund money poured in. While the upper bound of the fed funds rate went to 4.25% on September 18, 4.00% on October 30 and 3.75% on December 11, 2025, gold futures rose from $3,873 at the end of September to $4,341 at the end of December.
The third group is individuals. Bar and coin demand in 2025 was 1,374.1 tonnes, the most in 12 years, and rose further to 476.8 tonnes in the first quarter of 2026. Chinese individuals bought a record 207 tonnes of that in Q1. In Korea, average daily trading value on the KRX gold market reached KRW 241.7bn (about $182.1 million) in January. Total gold demand in 2025 passed 5,000 tonnes for the first time, at 5,002.3 tonnes.
The peak came in January 2026, when all three groups were buying at once. After that, the three slowed down one after another. Central banks cut their buying sharply to 56.5 tonnes in Q1, ETFs sold 44.8 tonnes in Q2, and individuals’ trading value fell 83.8% from January. While buyers were thinning out, the cost of holding gold, the real yield, rose from 1.72% to 2.95%. This drop is gold walking back down the road it came up.
Real yields and the domestic premium explain why Korean investors lost more
A few terms come up again and again in this report. Here is what they mean.
The real yield is the nominal interest rate minus the inflation rate expected ahead. If a bank pays 5% a year and prices rise 3% a year, your purchasing power grows by only a little over 2%. Markets use the yield on 10-year US Treasury Inflation-Protected Securities (TIPS) as the 10-year real yield. TIPS principal grows with inflation, so their yield is the interest left after inflation. This report uses the DFII10 series from the St. Louis Fed’s FRED database.
Breakeven inflation is usually the 10-year Treasury yield minus the 10-year TIPS yield. It shows how much the market expects prices to rise over the next ten years. This report uses FRED’s T10YIE series.
Opportunity cost is the interest you give up to hold gold. Gold pays no interest, so the higher the real yield, the more it costs to hold gold. PIMCO calculated from 2004-2025 data that when the 10-year real yield rose by 1 percentage point, the inflation-adjusted gold price fell 18% on average. The Chicago Fed got 13.1% per percentage point from annual data for 1971-2019. This report uses PIMCO’s 18% as its rule of thumb, because its period is more recent and its numbers are published.
Central-bank net buying is the gold central banks bought minus what they sold. The WGC compiles it every quarter. Because it includes estimates of unreported purchases, it is sometimes revised later.
The domestic premium, which Korean media call the “kimchi premium,” is how much more a gram of gold costs on the Korea Exchange (KRX) gold market than the international spot price converted into won. Domestic gold sometimes trades above the international price because of import costs, taxes and bursts of demand. On February 14, 2025, the gap reached 20.1% on closing prices.
The KRX gold market is a spot gold market run by the Korea Exchange, the operator of Korea’s stock market and its main index, the KOSPI. Gold trades there in 1-gram units, like a stock, and Korean gold spot ETFs track its price.
Hypothetical example: KRW 100 million in KRX gold on January 29
Imagine one investor. On January 29, when gold was hottest, this investor bought KRW 100mn (about $75,400) of gold at the KRX gold market close of KRW 269,810 per gram (about $203.3), roughly 370.6g. On October 20, KRX gold was reported at KRW 661,538 per don (3.75g, a traditional Korean unit for gold), which works out to about KRW 176,410 per gram (about $132.9). The same 370.6g is now worth about KRW 65.38mn (about $49,300). In nine months, about KRW 34.62mn (about $26,100) is gone (author’s calculation).
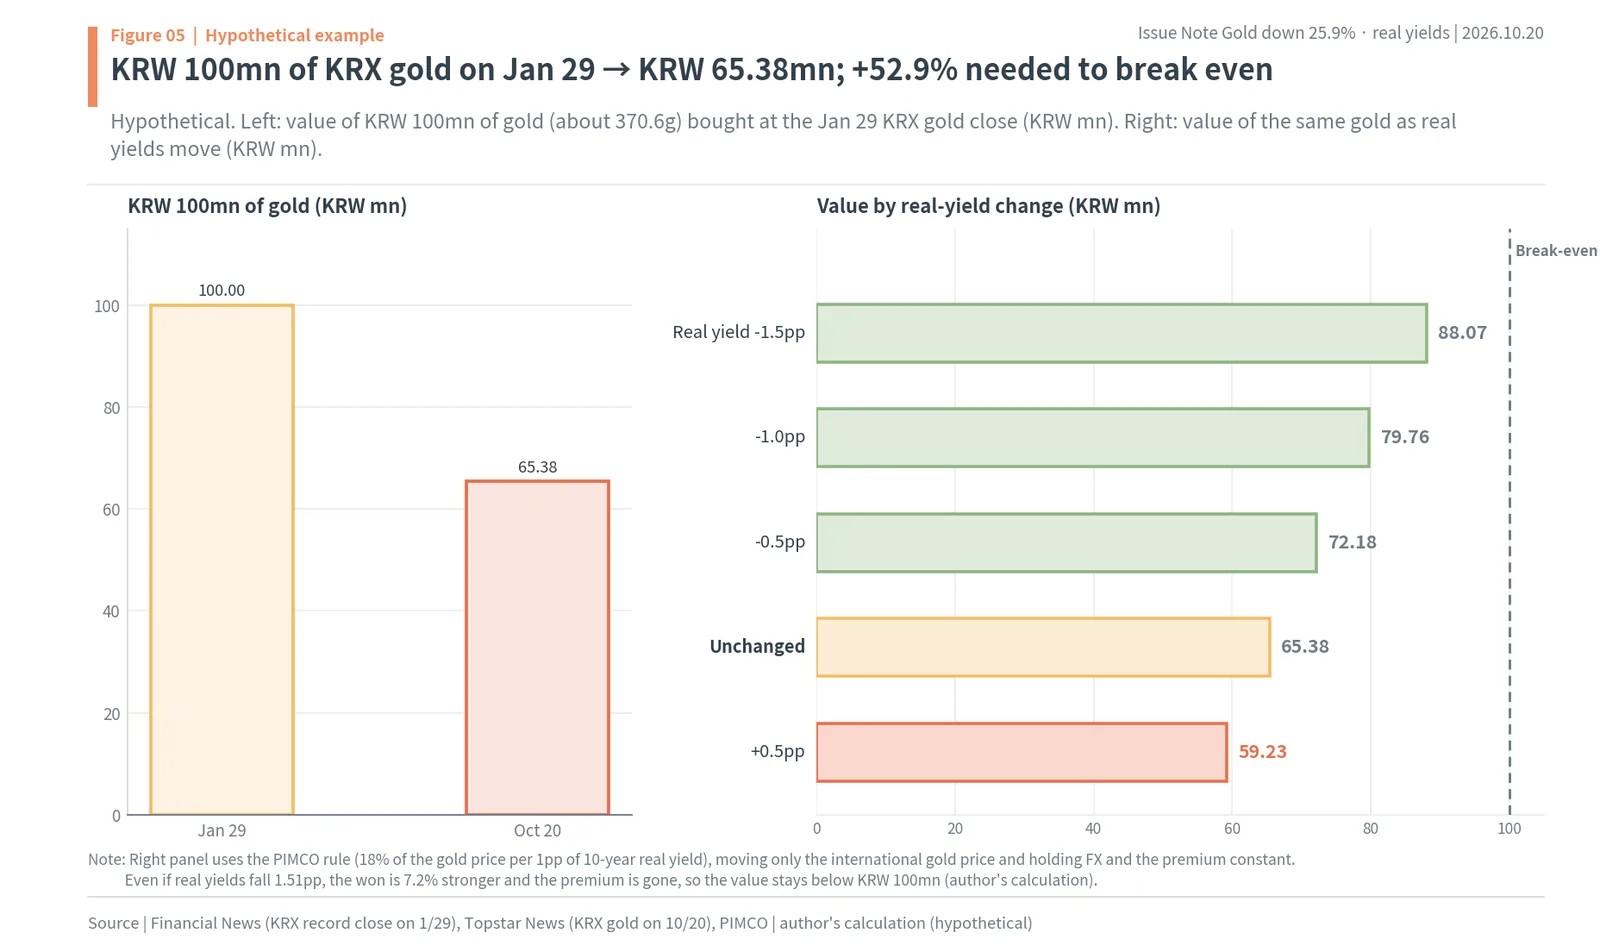
To get back to break-even, gold would have to rise 52.9% from here. The fall was 34.6%, but the climb back needs 52.9%: that is the asymmetry of percentages. If this investor had watched only the international gold price, they would have thought the loss was 25.9%. The actual loss is 34.6%. The difference comes from the won and the premium, and the chapter on Korean investors splits it out piece by piece.
The PIMCO rule also gives a rough idea of where this investor could go from here. Assume FX and the premium stay where they are and only the international gold price moves. If real yields fall 0.5 percentage point, gold rises 10.4% and this investor’s gold is worth about KRW 72.18mn (about $54,400). If they fall 1 point, gold rises 22.0% and the gold is worth about KRW 79.76mn (about $60,100). If real yields fall 1.51 points to 1.23%, the international price returns to around its old high, but because the won is 7.2% stronger than in January and the premium is gone, this investor’s gold is still worth less than KRW 100mn. If instead real yields rise another 0.5 point, gold falls 9.4% and the gold is worth about KRW 59.23mn (about $44,600). For a domestic gold investor, a recovery in the international gold price and getting back to break-even are not the same thing (hypothetical example, author’s calculation).
Rates rose again because of real yields, not inflation expectations
The path US rates took after January is simple. War in the Middle East resumed at the end of February, oil jumped, inflation worries made rate cuts impossible, and in the end the Fed raised rates. But what matters for gold is not how much rates rose but which rate rose. This time inflation expectations stayed put, and the real yield accounted for all of the rise.
Before the war, the market expected the Fed to cut at least twice in 2026. When the US and Israel resumed strikes on Iran on February 28 and the Strait of Hormuz was closed, oil went from about $65 in February to about $102 on March 31. On March 26, Trading Economics data showed the odds of a cut by December had fallen to 3%, while the odds of a hike had risen to 38%. Gold fell about 2% that day, to around $4,460.
On September 16 (US time), the Fed raised its policy rate by 0.25 percentage point to 3.75-4.00%. At his press conference, Chair Warsh said inflation had been too high for too long. In the dot plot, 16 of 19 officials expected another hike this year, with cuts starting in 2028. Spot gold fell 1.2% that day to $4,240.10. According to Global Economic on October 20, the market sees the odds of a hike at about 15% for the October meeting and about 89% for December.
All of the 0.85-point rise in the 10-year yield was real yield
Compare January 29, when gold peaked, with today. The US 10-year Treasury yield rose 0.85 percentage point, from 4.24% to 5.09% on October 16. Over the same period, 10-year breakeven inflation stayed at 2.35%, exactly where it started. So the 10-year real yield rose 0.85 point, from 1.89% to 2.74%. Every bit of the rise in the nominal yield was a rise in the real yield (FRED, author’s calculation).
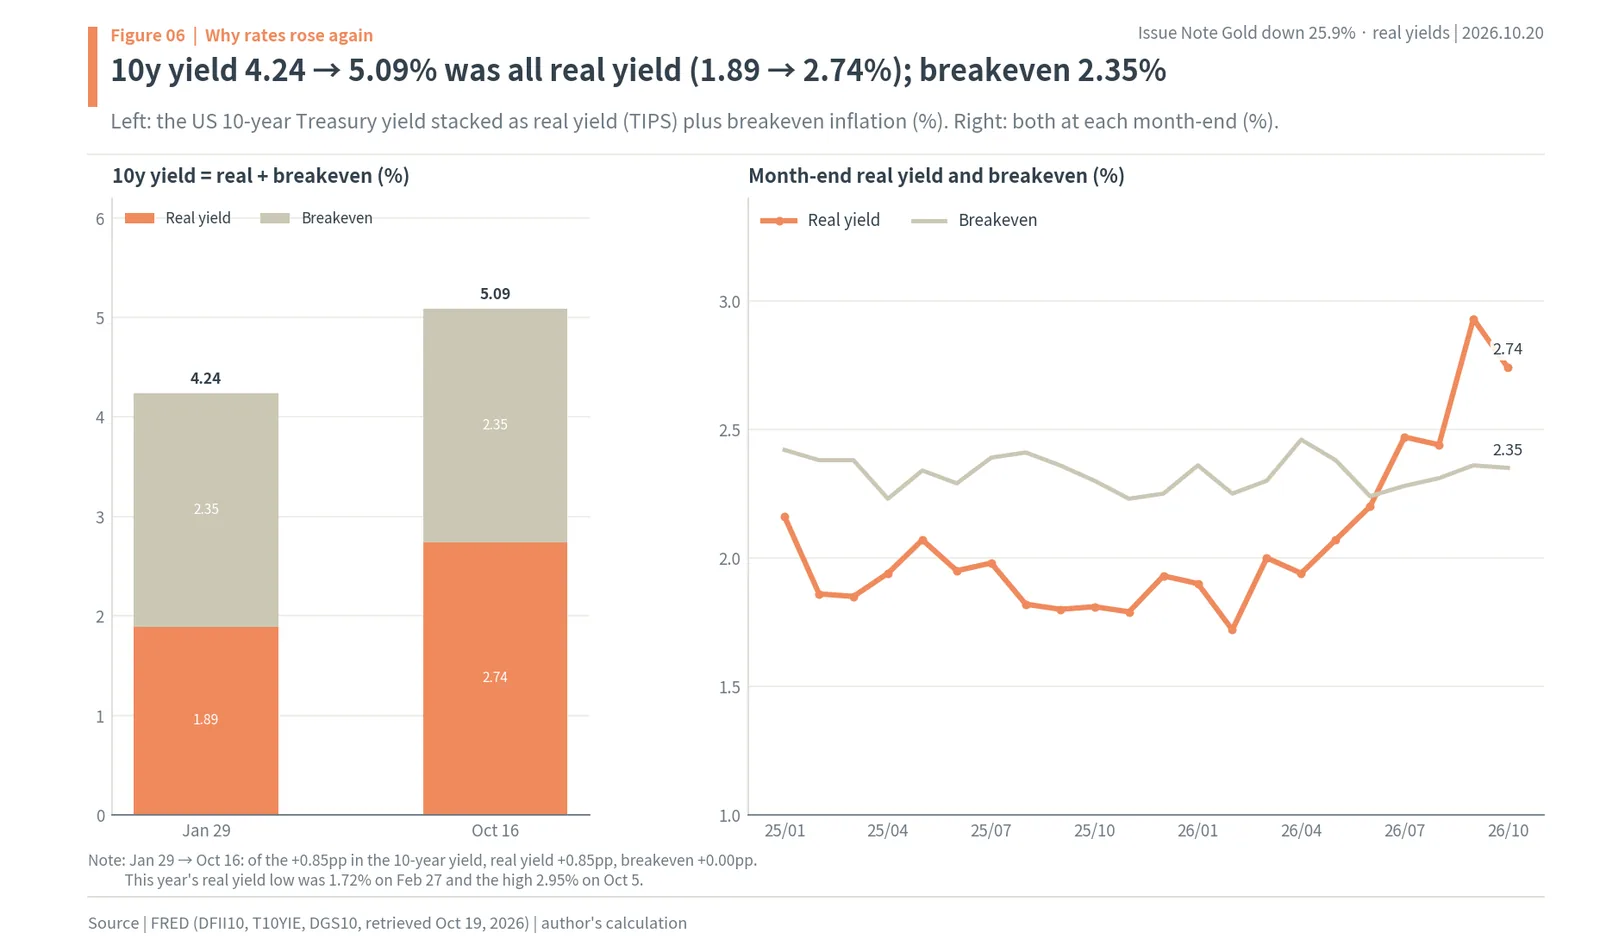
The left side stacks the 10-year yield on January 29 and today into real yield and breakeven inflation. The stack grew from 4.24% to 5.09%, and all of the added height is in the real-yield block at the bottom. The right side links month-end real yields and breakevens since January 2025. The breakeven line is almost flat between 2.2% and 2.4%, while the real-yield line climbed 1.23 points, from 1.72% at the end of February 2026 to 2.95% on October 5.
This distinction matters because of what gold is. If rates rise because inflation expectations rise, gold can actually draw buyers as a hedge against inflation. But when inflation expectations stay put and only real yields rise, gold’s use as an inflation hedge is unchanged while the interest you give up gets bigger. These nine months were the worst kind of rate rise for gold.
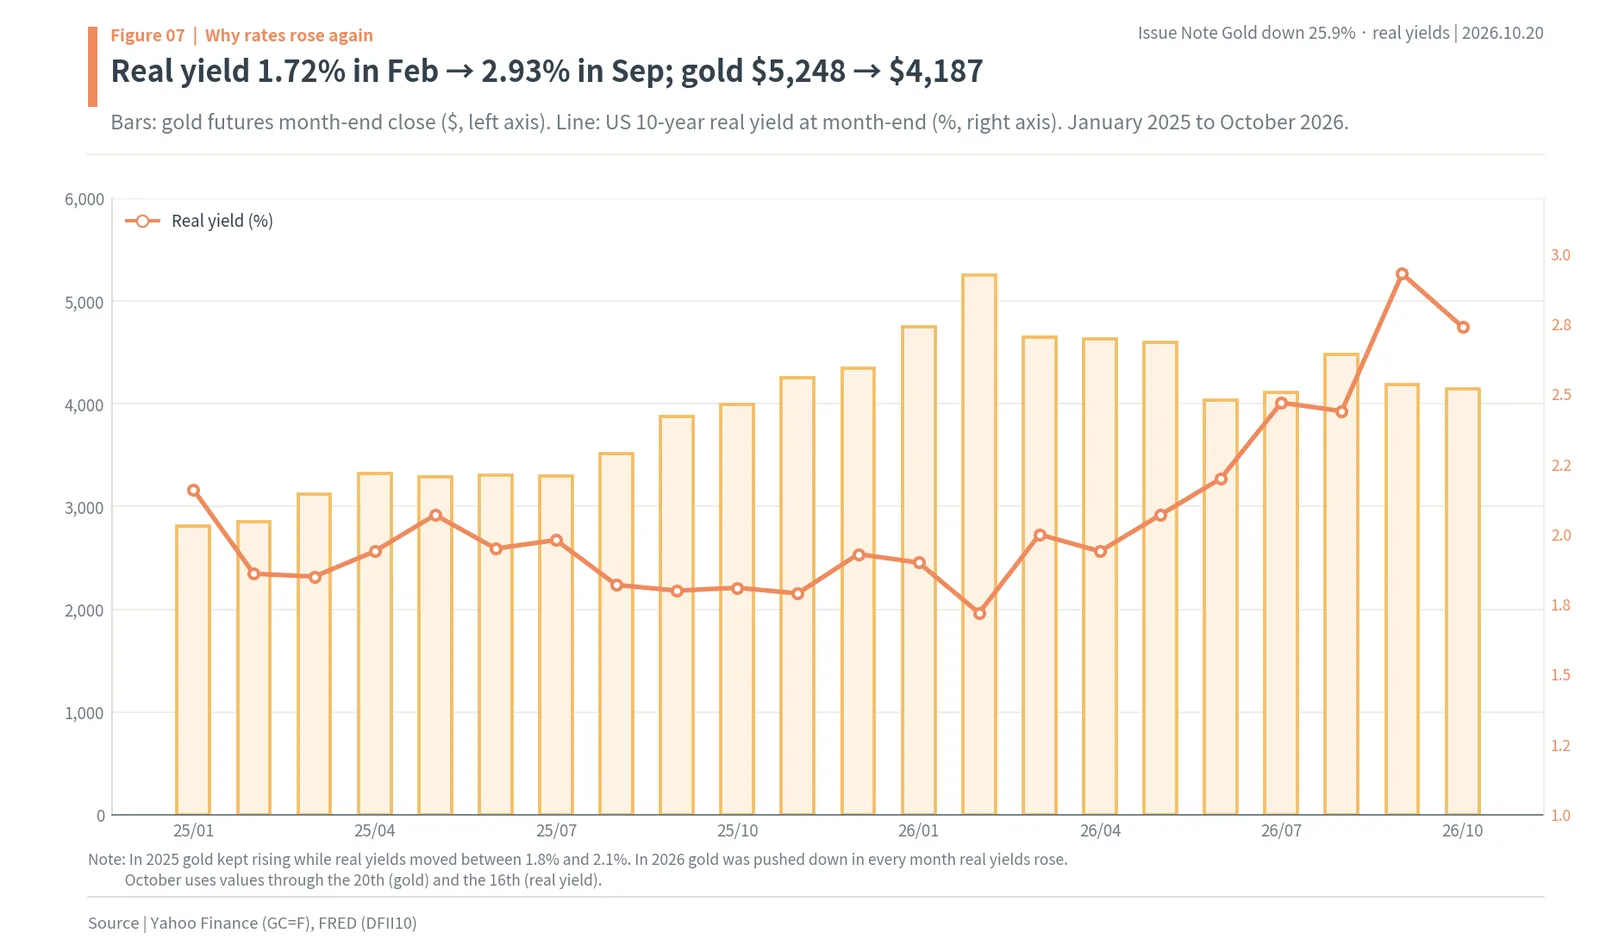
Put gold futures month-end prices and the real yield on one chart, and in 2026 the two lines move in opposite directions. When the real yield was low, at 1.72% in February, gold was high at $5,248 at the end of February; when the real yield rose to 2.93% at the end of September, gold came down to $4,187. The next chapter shows that this opposite movement was not always there: it disappeared in 2022-2025 and came back.
The Fed’s path points against gold, and Chair Warsh is its symbol
The real yield that sets gold’s next move is ultimately driven by the Fed. Laying out the Fed’s steps over the past year shows why gold peaked in January and was pushed down again in September.
The Fed cut three times, on September 18, October 30 and December 11, 2025, lowering the upper bound from 4.50% to 3.75%. Over that time, gold futures went from $3,873.2 at the end of September 2025 to $4,341.1 in December, passed $4,745.1 in January 2026 and reached $5,247.9 in February. While rates were being cut, gold rose. The market expected at least two more cuts in 2026.
The direction changed on two days. The first was the Warsh nomination on January 30. Warsh served as a Fed governor from 2006 to 2011 and is known as a critic of the easy money after the financial crisis. The market took it to mean he would not hurry to cut once he became chair. The second was the resumption of strikes on Iran on February 28. Once oil jumped from $65 to $102, a Fed worried about inflation had no reason left to cut. On March 26, the odds of a cut by December were 3%.
The Fed then held for six months before raising rates by 0.25 point on September 16 (US time). Chair Warsh said at his press conference that inflation had been too high for too long, and no official dissented. The Fed’s 2026 forecast for PCE inflation, released at the same time, was 3.7%. In the dot plot, 16 of 19 officials expected one more hike this year, and cuts were drawn starting in 2028.
This path hurts gold in two ways. One is the level of rates. If the fed funds rate is 4.00% and may go higher, the 10-year real yield will not come down easily. The other is time. If cuts start in 2028, a real yield back at 1.23% is a 2028-or-later picture at the earliest. When Goldman Sachs lowered its end-2026 forecast but kept its end-2027 forecast, it was looking at the same timetable. Goldman expects three cuts between September 2027 and March 2028.
The variables that could change the Fed’s path are oil and jobs. If the Middle East war ends and oil falls, inflation worries ease and the Fed could stop hiking. Daishin Securities sees the second quarter of 2027 as a possible rebound point for that reason, the base effect in oil prices. If employment deteriorates badly, the Fed could cut sooner than expected. These two variables will move before gold does.
The link between gold and real yields broke in 2022-2025 and came back in 2026
That gold and real yields move in opposite directions was long-standing market wisdom. From 2022 to 2025, the rule did not hold. Real yields went from negative to above 2%, yet gold more than doubled. That the rule has come back in 2026 is the central evidence in this report.
The author calculated correlations by period between month-end gold futures prices (in logs) and the 10-year real yield from 2006 to today. A correlation coefficient measures how closely two numbers move together, from -1 to 1. Near -1, one goes up when the other goes down; near 1, they rise together. The correlation for 2006-2021 was -0.92: when real yields rose, gold fell, almost in a straight line. In 2022-2025 the sign flipped to +0.45. And in January-October 2026 it came back to -0.78 (author’s calculation).

The left side shows the three periods’ correlations as bars; the right side is a scatter of month-end points since 2006, with the real yield across and gold up the side. The 2006-2021 points form a band sloping down to the right. The 2022-2025 points left that band and climbed to the upper right, where gold was high even with real yields high. The 2026 points are sliding back down and to the right from that high spot.
Month-to-month changes tell the same story. Measuring how much gold moved when the real yield rose 1 point in a month gives -12.9% for 2006-2021, -5.4% for 2022-2025 and -21.2% for 2026 (author’s calculation). In 2022-2025 gold’s response to rates shrank to less than half; in 2026 it became even more sensitive than before.
Why the link came back is explained by the central-bank numbers in the next chapter. In short, the buyers who ignore rates have thinned out. Central banks do not buy less gold because rates rise 1 point. When such buyers make up a big share of the market, the link between rates and gold weakens. Investors who buy gold through ETFs and futures, on the other hand, act on rates. When real yields rise, they move from gold to Treasuries that pay interest. In 2026, as the central banks’ share shrank and the rate-watching investors’ share grew, gold became a rate-sensitive asset again. That the 2026 slope of -21.2% is steeper than 2006-2021’s -12.9% reads as the part of gold that rose while ignoring rates in 2022-2025 being given back all at once. But 2026 has only ten points, so this report does not use that slope as a rule for the future; its calculations use PIMCO’s 18%.
2013 shows the same principle. When Fed Chair Ben Bernanke talked about tapering bond purchases in May that year, the 10-year real yield rose 1.66 points, from a low of -0.74% in April to a high of 0.92% in September. Gold futures fell 9.3% in a single day on April 15 and about 28% over the year. Gold only found a bottom after falling 45.5%, from a high of $1,921 in September 2011 to $1,046 in December 2015. That bottom came right after December 16, 2015, when the Fed raised rates for the first time since 2006.
The lesson of 1980 and 2013: gold waits until rates change direction
Placing the two big cases where gold stalled in front of rates side by side gives a yardstick for this drop. In both, gold first rose sharply, turned down as rates rose, and rested for a long time until rates came back down.
The 1980 peak was made by inflation and war. US inflation reached 14.8%, and the Iran hostage crisis and the Soviet invasion of Afghanistan overlapped. Gold crossed $800 on January 18 and hit $850 on the 21st. But Volcker’s Fed had been squeezing the money supply since October 1979, and the fed funds rate reached 20% at the end of 1980. Inflation came down to 6.1% in early 1982 (on the PCE price index), and gold fell to about $297.5 in June 1982. Inflation falling while rates stayed high, in other words the time when real yields were highest, was the worst time for gold.
The 2013 peak was made by the easy money after the financial crisis. Gold rose to $1,921 in September 2011. When Fed Chair Bernanke signaled in May 2013 that bond purchases would be reduced, the 10-year real yield went from negative to positive. It rose 1.66 points, from a low of -0.74% in April to a high of 0.92% in September. On April 15, gold futures fell 9.3% in a day, which Reuters described as the biggest one-day percentage fall since 1983. Gold fell about 28% in 2013 and found a bottom at $1,046 in December 2015, 45.5% below the 2011 peak.
The two cases have three things in common. First, the first drop after the peak is fast and big. That was January 22, 1980 and April 15, 2013, and it was January 30, 2026 too. Second, the drop after that is set by rates. While rates rose, gold stepped down. Third, the bottom came around the end of rate hikes. The 2015 bottom came right after December 16, 2015, when the Fed raised rates for the first time in nine years. Gold started rising again only after the market had fully priced the hikes.
Hold 2026 up to that lesson: the Fed has just started hiking in September, and most officials expect more. In 2013 terms, this is the middle stage, where hikes are still being priced in. There is a clear difference, though. In 2013 and 1980 there were no central banks buying gold on a large scale. In 2026, even at a slower pace, central banks still bought 170 tonnes in January-August. So this report does not expect this drop to go as deep as the 45.5% of 2013-2015. There is a hand holding up the floor, but the hand that lifts the price is held by rates. That is the lesson of the two cases.
Central banks buying over 1,000 tonnes a year carried those four years, and that buying has slowed
Gold beat rates in 2022-2025 because the buyers changed. After Russia’s foreign reserves were frozen in 2022, central banks began piling up gold instead of dollars. Central banks buy for safety decades ahead rather than for yield, so they are less shaken by rising rates. PIMCO also explains that the rise in central-bank buying from early 2022 cut the link between gold and real yields for a while.
By WGC data, central-bank net buying was 1,136 tonnes in 2022, 1,037 tonnes in 2023 and 1,092.4 tonnes in 2024, an average of 1,088.5 tonnes over the three years. In 2025 it was 863.3 tonnes, down 21.0% from the year before. For 2026, Q1 was first reported at 244 tonnes and then revised to 56.5 tonnes, and Q2 was 288.9 tonnes. Annualizing the first-half total of 345.4 tonnes gives 690.8 tonnes, 36.5% below the 2022-2024 average (author’s calculation).
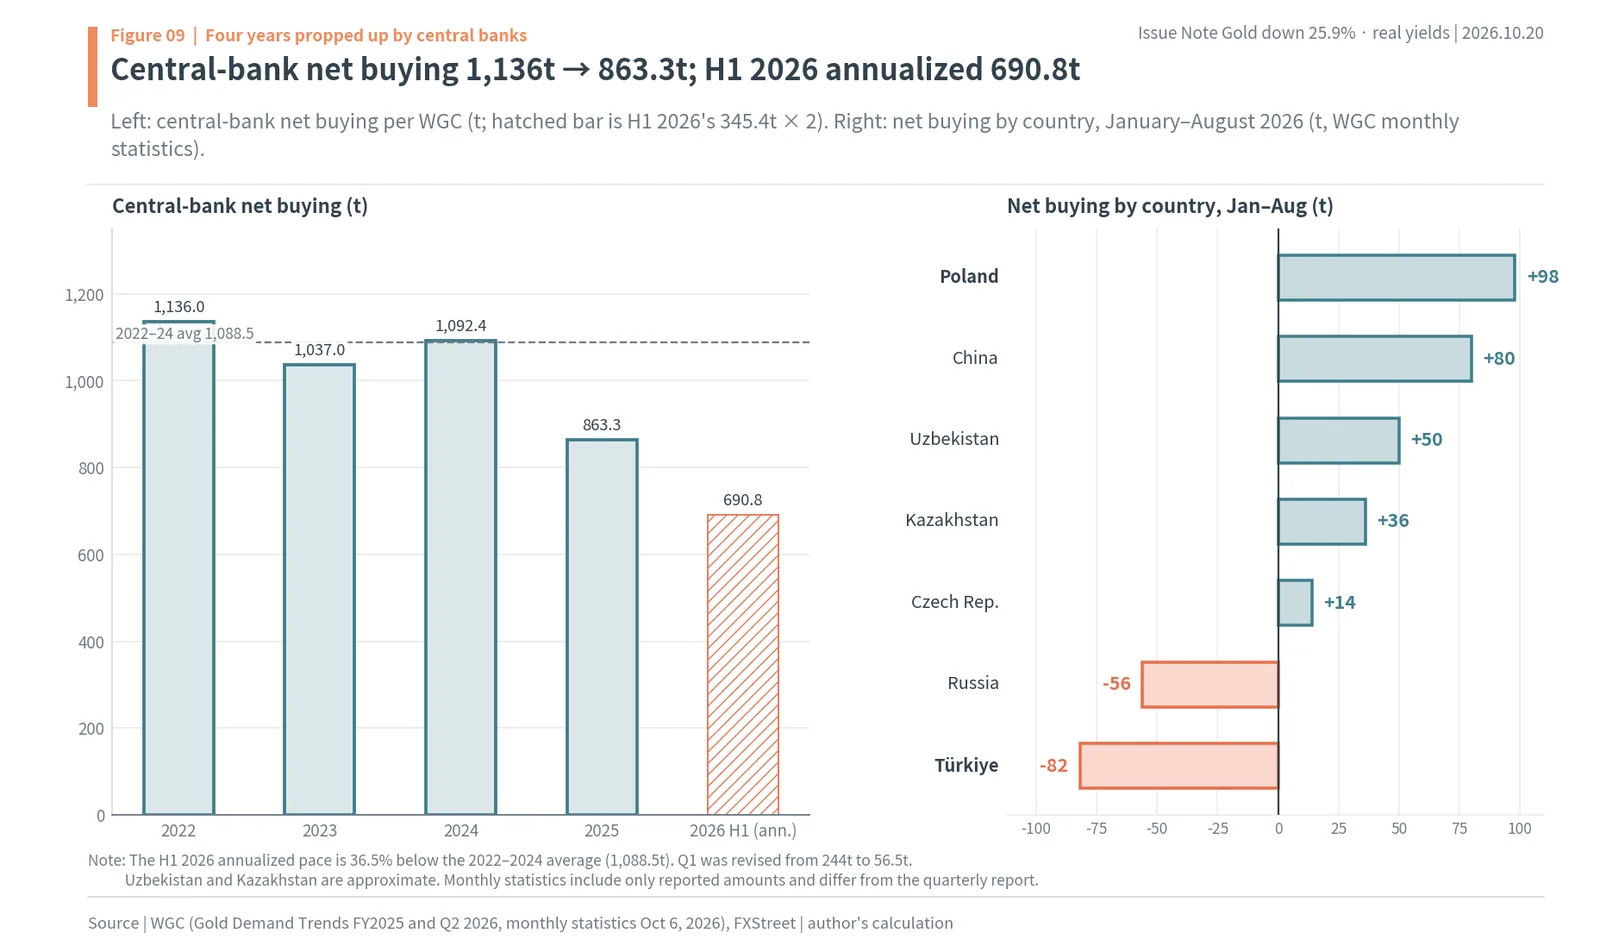
By country, buyers and sellers split. By WGC monthly statistics, Poland bought 98 tonnes and China 80 tonnes in January-August. The People’s Bank of China, the Chinese central bank, bought another 20.2 tonnes in August, its 22nd straight month of buying. Türkiye, on the other hand, sold 82 tonnes and Russia 56 tonnes. Countries that needed foreign currency because of war and oil sold gold to raise cash. Since some countries are still buying, central banks have not left the gold market, but they are no longer buying enough to beat rates the way they did in 2022-2024.

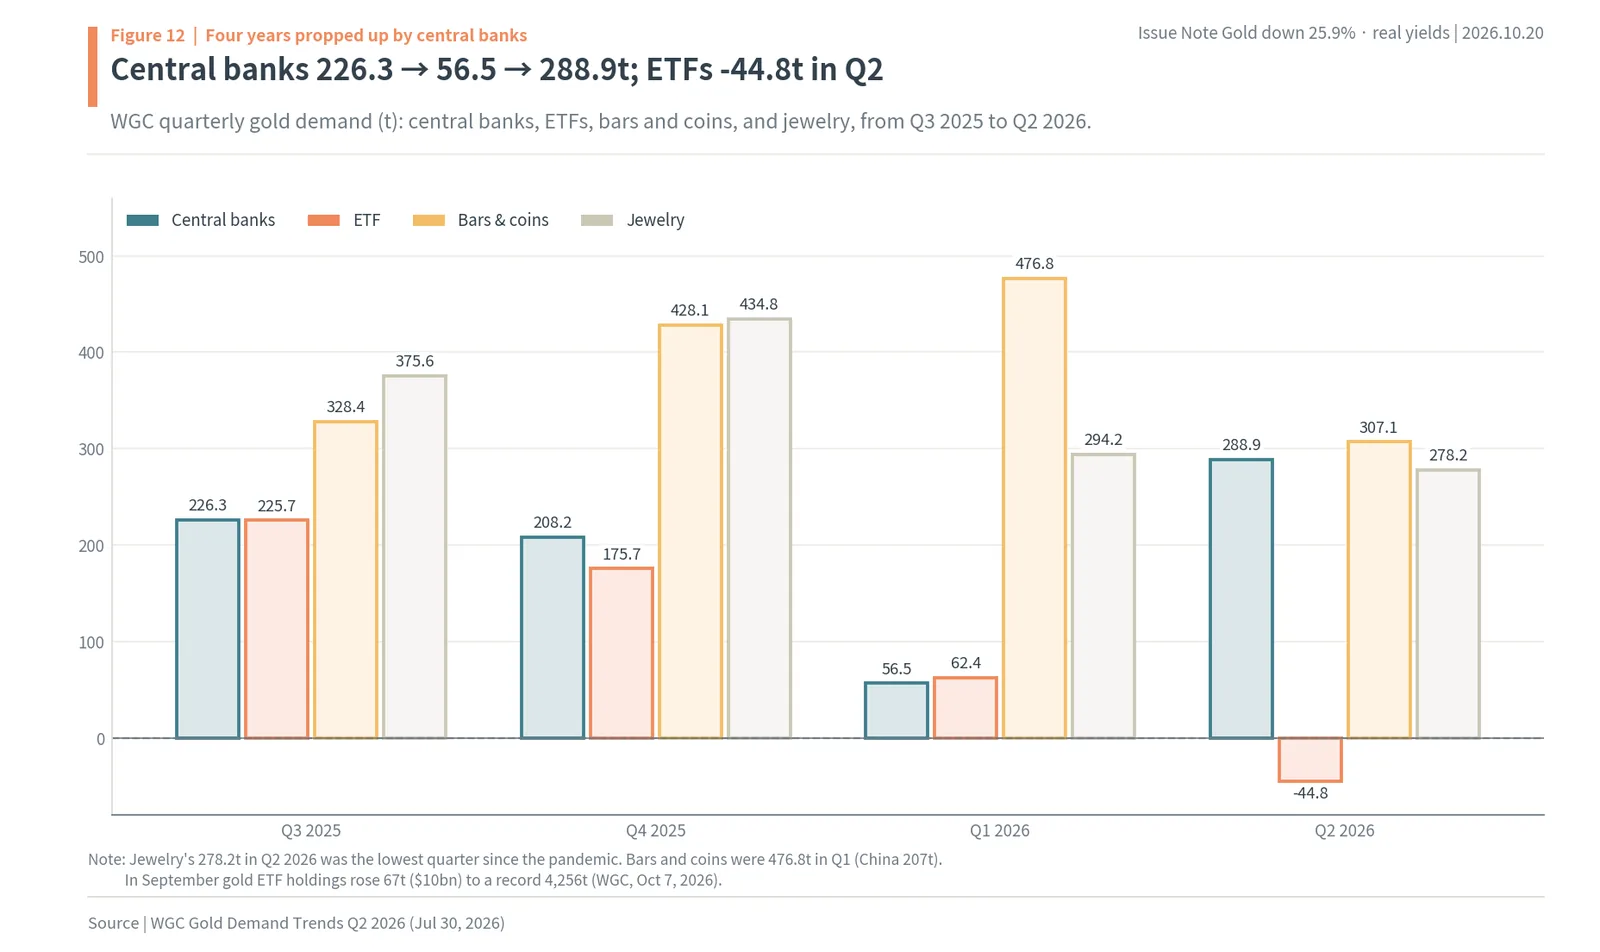
Nor did individuals and funds fill the gap left by the central banks. In 2025, gold ETFs bought 801.2 tonnes and were the other force pushing gold up. In 2026 they bought 62.4 tonnes in Q1 and sold 44.8 tonnes in Q2, ending the first half at just 17.6 tonnes. The WGC pointed to rising expectations for both inflation and rates, and a stronger dollar, as the reasons for ETF selling in Q2.
Money came back in the third quarter. In September alone, $10bn flowed into gold ETFs, holdings rose 67 tonnes, and world gold ETF holdings reached a record 4,256 tonnes. Inflows for the whole third quarter were $31bn, the most for any quarter. Yet gold fell in September. That ETF buying did not lift the price means the power to set the price lies more with rates than with the volume bought and sold.
The chart splits four quarters of demand, from Q3 2025 to Q2 2026, into central banks, ETFs, bars and coins, and jewelry. Central banks went from 226.3 and 208.2 tonnes to 56.5 tonnes in Q1 2026, then came back to 288.9 tonnes in Q2. ETFs went from 225.7 tonnes to -44.8 tonnes in Q2. Jewelry was 278.2 tonnes in Q2, the lowest since the pandemic: as gold got expensive, demand for rings and necklaces fell first. Bars and coins, on the other hand, were a strong 476.8 tonnes in Q1 2026 and still 307.1 tonnes in Q2. Individuals kept buying gold as it fell.
Supply has not pushed gold down yet, and the strong dollar was another face of rates
Start with supply, the basis of the “bull market to 2030” view. World mine production in 2025 was a record 3,671.6 tonnes, and recycling (old gold melted down and sold again) rose 3% to 1,404.3 tonnes. Even with gold at record highs, mine output rose only 21.2 tonnes from 3,650.4 tonnes in 2024. That fits the explanation by Cho Kyu-won, CEO of Stackers, that a new mine takes 10-15 years to open. Quarterly mine output in 2026 was 901.3 tonnes in Q1 and 965.6 tonnes in Q2, not a big increase.
Recycling follows the gold price. When gold rises, more people sell the gold they have at home; when it falls, fewer do. Recycling was 373.8 tonnes in Q1 2026 and fell to 326.1 tonnes in Q2. As gold fell, less old gold came onto the market. On the supply side alone, the force pushing gold down is actually getting weaker. In that sense, Cho’s framework, that the bull market ends when supply rises, does not contradict today’s numbers.
Then why did gold fall when supply did not rise? The gold price is set less by how much is mined each year than by who wants to hold the gold already above ground. Decades of production have piled up, and a year’s mine output is only a small part of it. So gold is more sensitive to demand than to supply, and within demand, to the interest rates that set the cost of holding it. That is why this report looks at real yields before supply growth.
The dollar matters too. Gold is priced in dollars, so when the dollar strengthens, gold becomes more expensive in other currencies and demand falls. The dollar index rose 5.7%, from 96.28 on January 29 to 101.75 on October 20. But the reason the dollar strengthened was also US rates. When US rates rise faster than other countries’, money flows into dollars and the dollar strengthens. The strong dollar was another face of rising rates, and it pushed gold the same way.
For Korean investors, something in the opposite direction piled on. While the dollar index rose, the won-dollar rate fell from KRW 1,429.3 to KRW 1,327.0 per dollar. The won got stronger even against the dollar. So apart from the strong dollar that pressed on gold internationally, Korean investors saw gold in won lose another 7.2% because of the stronger won. The chapter on Korean investors breaks this gap down in numbers.
Buyers and sellers split, and the sellers were countries that needed cash
Slower central-bank buying does not mean every central bank stepped away. Look country by country and there is a clear split between countries that keep buying and countries that are now selling. The dividing line is each country’s financial position.
Poland was the biggest buyer in 2026. By WGC monthly statistics it bought 98 tonnes in January-August, and its holdings were about 640 tonnes at the end of July. The National Bank of Poland has set a target of 700 tonnes. That leaves about 60 tonnes to go, so Poland’s buying may slow as it nears the target.
The People’s Bank of China bought 80 tonnes in January-August, 20.2 tonnes of it in August alone. That was its biggest monthly purchase since October 2023 and its 22nd straight month of buying. Its holdings are about 2,387 tonnes. China clearly wants to reduce its share of dollar assets and has been buying more when gold falls. Uzbekistan (about 50 tonnes), Kazakhstan (about 36 tonnes) and the Czech Republic (14 tonnes) were also net buyers in January-August.
On the other side are Türkiye and Russia. Türkiye was a net seller of 82 tonnes in January-August. In a country with unstable inflation and currency, the central bank sells gold to raise foreign currency. Russia sold about 6 tonnes a month, 56 tonnes in January-August, and holds 2,271 tonnes. It is in effect using gold to cover war costs and its budget deficit. Even with higher oil prices raising Russia’s income from crude sales, its gold selling did not stop.
The split shows the structure of this drop. In 2022-2024, almost every emerging-market central bank was buying in the same direction. In 2026, countries with money to spare buy, and countries short of cash sell. When there were only buyers, net buying exceeded 1,000 tonnes a year; once sellers appeared, net buying fell well below that. The 170 tonnes of net buying in January-August is the buyers’ purchases minus the 138 tonnes sold by Türkiye and Russia.
The Bank of Korea, Korea’s central bank, is also among the buyers. Its holdings were 104.4 tonnes at the end of August, 39th in the world and 3.4% of foreign reserves at market value. At book value the share is only 1.1%. The Bank of Korea bought $250 million of gold ETFs in Q2, and from December 14 it plans to buy, in won, about 1 tonne of gold that a domestic refiner had intended to export. The bank said it would raise its gold share, which is lower than that of major peers, to build up safe assets for a crisis.
About 60% of the 25.9% drop is explained by higher real yields
If rates are back in charge of the gold price, how much of this drop can rates alone explain? Put the 0.85-point rise in real yields since January 29 into the PIMCO rule (-18% in the inflation-adjusted gold price per 1 point of 10-year real yield), and gold should have fallen 15.5% (author’s calculation). The actual fall in spot gold was 25.9%. The share explained by real yields is about 59.9%.
Here is the calculation spelled out. PIMCO’s 18% is the effect of a full 1-point rise, so for 0.85 point you multiply (1-0.18) by itself 0.85 times, which gives 0.845. Gold shrinks to 84.5% of its level, a fall of 15.5%. Splitting the actual 25.9% fall the same way leaves 12.3% for the rest. A 15.5% fall followed by a further 12.3% fall makes 25.9%.
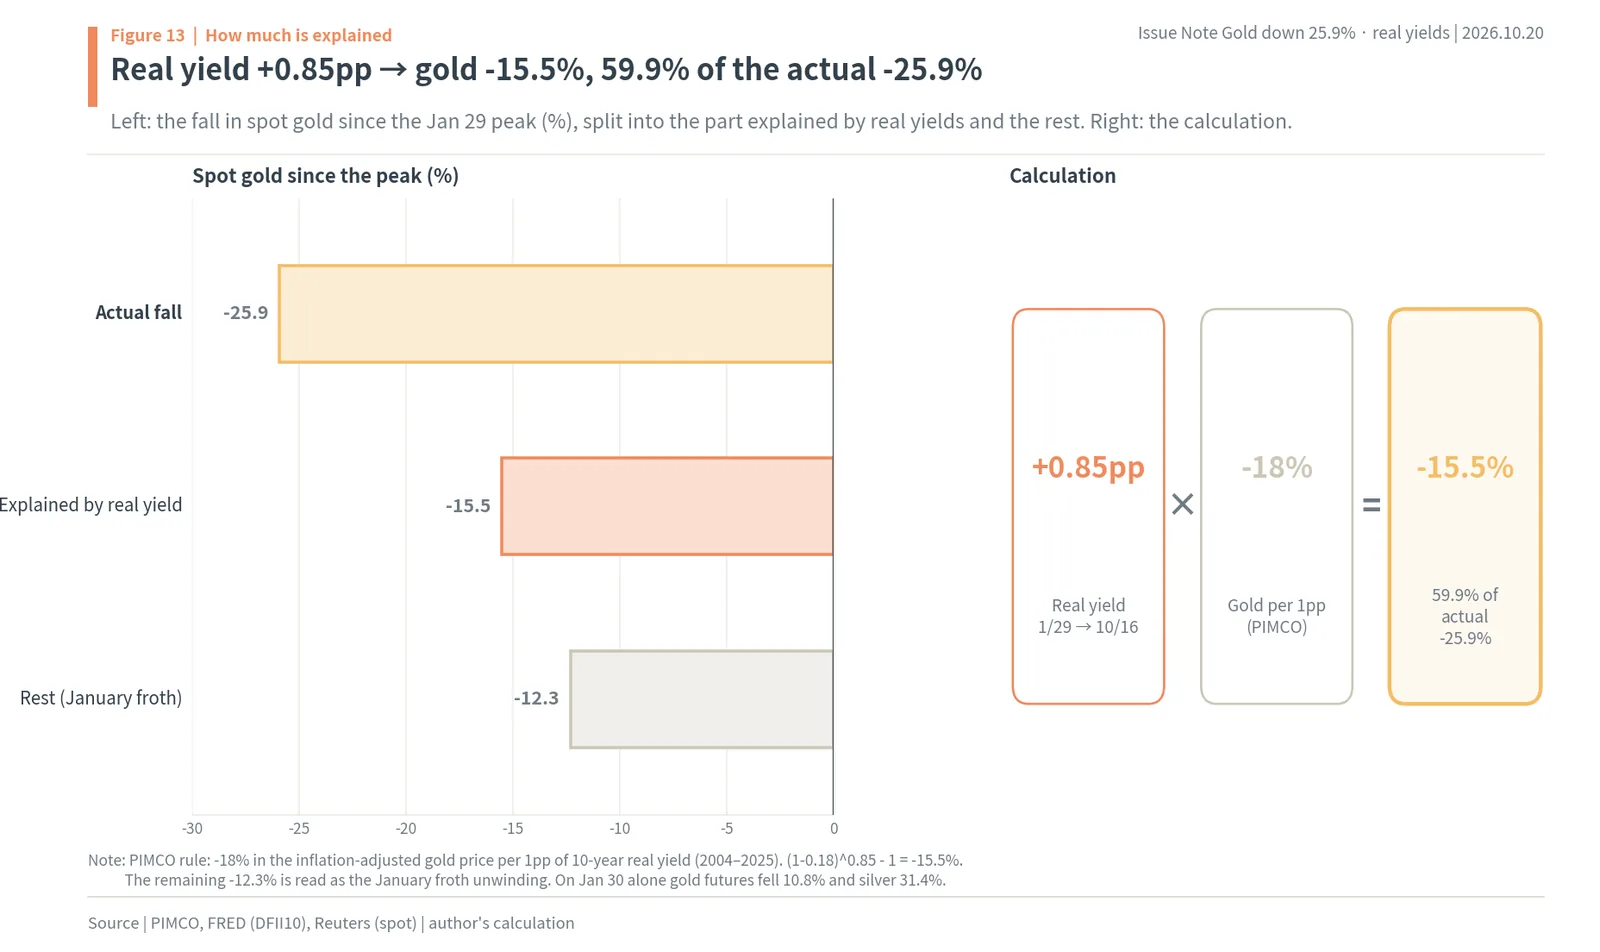
What is the remaining 12.3%? This report reads it as the froth built up at the January peak draining away. On January 30 alone, gold futures closed -10.8%, and silver fell 31.4% the same day. Around then, daily trading value on the KRX gold market averaged KRW 241.7bn in January, six times September’s KRW 39.1bn. The real yield did not move much from 1.89% on January 29 to January 30, yet gold fell more than 10% in a day. That is evidence that the day’s fall came from leverage and crowding inside the market, not from rates.
This split is useful for looking ahead. The froth has already drained away, and it takes time to build up again. The variable left is rates. If rates stay where they are, gold should stay near where it is; if rates rise, gold falls further; only if rates fall can gold rise. The next chapters test that conclusion against the “bull market to 2030” view and the “no return to the old high” view.
Silver and gold miners swung harder because leverage and profit structure sit on top of the same rates
Over the same nine months, silver fell more than twice as much as gold. Silver futures hit the year’s high of $115.08 on January 26 and were $57.26 on October 20, 50.2% below that peak. Against the January 29 close the fall is 49.8%. Compared with gold futures’ 22.1% fall over the same period, that is 2.3 times deeper.
Silver swung harder because of its market size and its uses. The silver market is far smaller than the gold market, so the same amount of money going in or out moves the price more. Silver is also an industrial metal used in solar panels and electronic parts, so its demand falls when worries about the economy grow. The 31.4% one-day fall in silver futures on January 30 shows that many investors had bought silver with borrowed money, and when CME raised silver margins from 11% to 15% the same day, leveraged buyers found it even harder to hold on.
Gold mining stocks swing for a different reason. Most of a gold miner’s costs are fixed, so when gold rises its profit grows faster than gold, and when gold falls its profit shrinks faster. The gold miners ETF GDX peaked at $115.84 on February 27 and is now $86.47, 25.4% lower. It peaked a month after gold futures, which reads as the expectation of results and dividends earned at high gold prices lingering into February even after gold had turned.
In Korea, Korea Zinc is a refiner that produces both gold and silver. In the first half, it sold KRW 4,108bn (about $3.10 billion) of silver and KRW 1,225bn (about $0.92 billion) of gold, KRW 5,333bn of the two precious metals together. Silver sales are more than three times gold sales, so Korea Zinc is more sensitive to silver than to gold. Korea Zinc’s 12.42% drop on February 2 also came the trading day after silver’s crash, which was bigger than gold’s. But Korea Zinc’s share price also reflects a fight over control of the company and zinc prices, so this report does not explain its fall by precious metal prices alone.
In short, gold, silver, gold miners and refiners all stand on the same real yield. On top of it, silver carries a small market and leverage, miners carry fixed costs, and refiners carry their silver share and company-specific issues. When real yields come down and gold turns, these can rise more than gold for the same reasons, but the starting point is still rates.
The author’s view: not the end of the bull market, but a return to a market priced by rates
After gold’s 25% drop, market opinion splits in two. One side sees the long bull market as still only midway; the other sees gold struggling to beat its old high even next year. This chapter checks both sides’ arguments in their original sources, then tests them with numbers.
The case that the bull market runs to around 2030
Cho Kyu-won, CEO of Stackers, said in an interview with the Segye Ilbo on October 20 that the gold up-cycle that began in 2019 is still under way and could last until around 2030. His argument is supply. A new gold mine takes 10-15 years from discovery to production, so supply does not rise right away even when gold rises. Based on the schedules of mines now in development, he sees supply rising from around 2029 at the earliest, and he takes that as the signal that the up-cycle is ending. He also noted that past up-cycles have lasted anywhere from 9 to 13 years.
Global investment banks also lean toward higher prices over the long run. On September 23, Goldman Sachs cut its end-2026 forecast from $4,900 to $4,650 but kept $5,400 for end-2027, explaining that tightening changes the timing, not the destination. UBS forecast $5,400 for the end of September 2027, and Metals Focus an average of $5,330 for 2027. Against spot gold today at $4,147.87, Goldman’s end-2027 forecast is 30.2% higher and Metals Focus’s 28.5% higher.
The case that gold will struggle to beat its old high even next year
Choi Jin-young, an analyst at Daishin Securities, wrote in an October 19 commodities report that gold will find it hard to beat its old high next year. The reasons were the tightening shown by the gap between short- and long-term rates, the 30-year US Treasury yield above 5%, and inflation from Middle East supply chains. His view is that gold could rebound in Q2 2027 on the base effect in oil prices, but that positions should be trimmed near the old high. Bank of America cut its 2026 average forecast by 14% to $4,360 in July.

The conditions for a return to the old high, in numbers
The author ran the same PIMCO rule in reverse. For spot gold to get from $4,147.87 back to the old high of $5,594.82, it has to rise 34.9%. If a 1-point fall in real yields raises gold by a factor of 1/(1-0.18), the fall needed is 1.51 points, taking the real yield from 2.74% to 1.23% (author’s calculation). The last day the US 10-year real yield was below 1.23% was May 11, 2023.
By the same rule, a 0.5-point fall in real yields would raise gold 10.4% to about $4,581, a 1-point fall would raise it 22.0% to about $5,058, and a 1.5-point fall would take it to about $5,586. If real yields instead rise another 0.5 point, gold falls 9.4% to about $3,756.
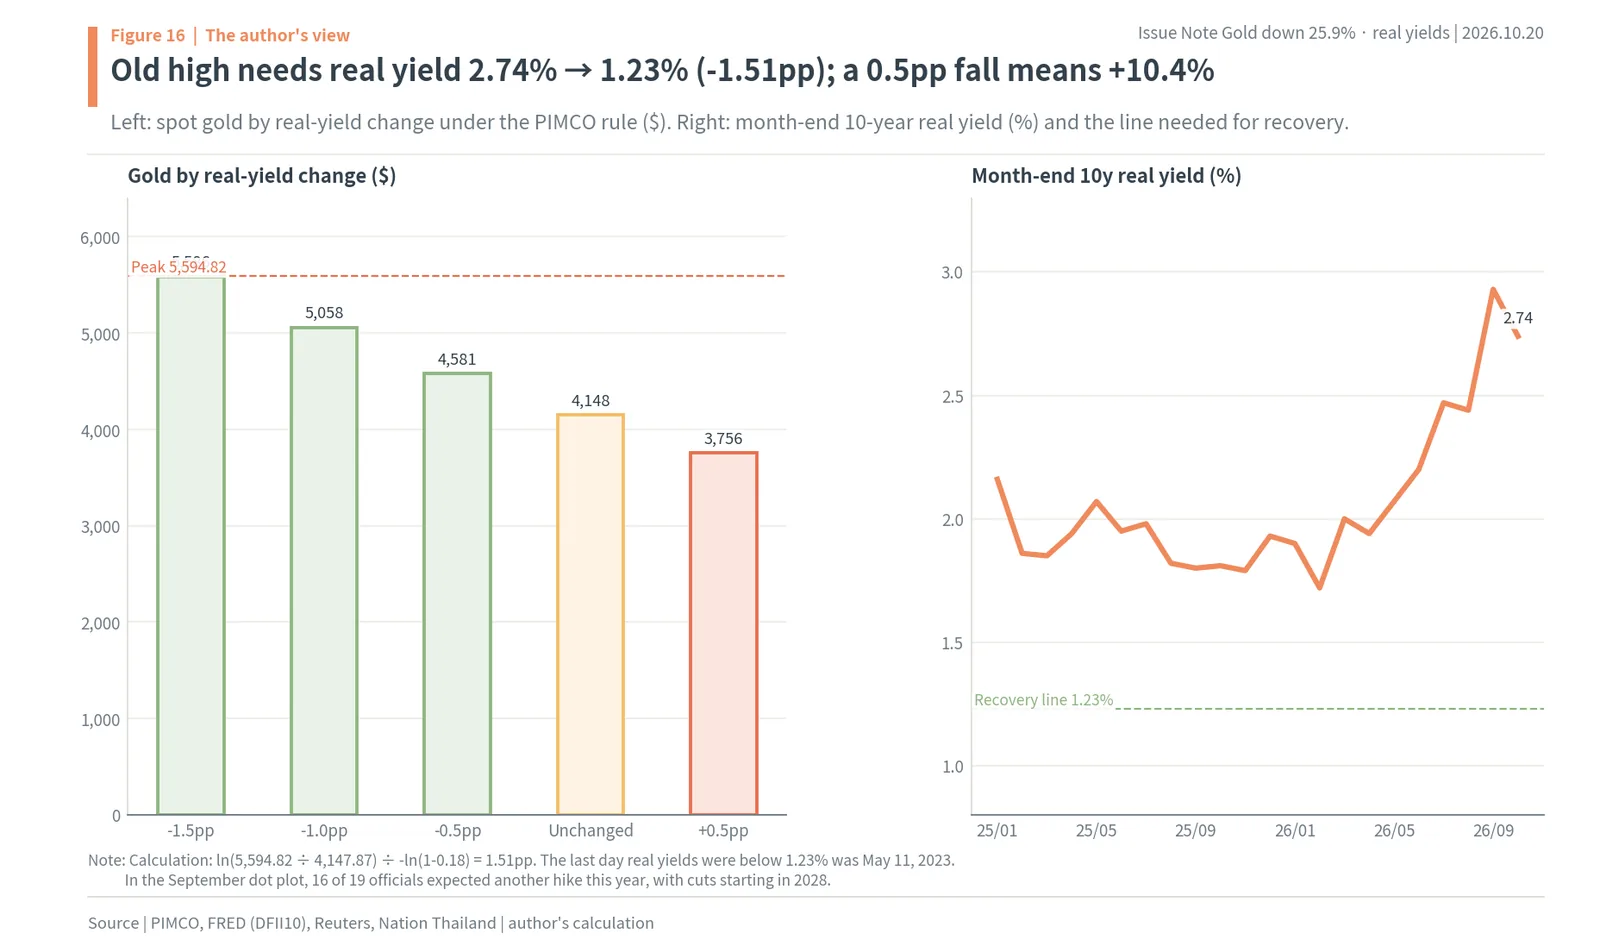
Now set these conditions against the Fed’s path. In the September dot plot, 16 of 19 officials expected another hike this year, with cuts starting in 2028. The market puts the odds of a December hike at about 89%. On that path, it is hard to picture real yields falling 1.5 points within a year. The supply shortage that the “bull market to 2030” view points to is real, but that force beat rates in 2022-2025 only when central banks were buying more than 1,000 tonnes a year. Central-bank buying today is running 36.5% slower than that.
The author’s view is that the gold bull market has not ended so much as returned to a market where rates set the price, and that a return to the old high is unlikely before real yields fall into the 1% range. No one knows whether the end is 2030, but until then, gold’s direction will be set by the Fed’s next move and by how much central banks buy. The author would treat real yields starting to fall, or central-bank buying returning to a pace of 1,000 tonnes a year, as signals to change this view. This issue is not tied to any party’s policy position, so the judgment rests on the evidence alone.
Common questions, answered with numbers
Here are the questions readers ask most about gold’s fall, answered with this report’s numbers.
First, gold is a safe asset, so why did it fall 25%? A safe asset is not an asset whose price never moves; it is one that protects your wealth from a particular risk. Gold has been used to guard against a big fall in the value of money. These nine months were a time when rate risk outweighed that risk. Breakeven inflation stayed at 2.35% while only the real yield rose 0.85 point. Worries about money losing value did not grow, but holding gold got more expensive. The risk gold protects against stayed the same, and only the cost of holding it went up.
Second, if central banks keep buying, why is the price falling? Central banks are still buying. Net buying in January-August was 170 tonnes, and China has been buying for 22 months. But compared with the pace of more than 1,000 tonnes a year in 2022-2024, the annualized first-half 2026 pace of 690.8 tonnes is 36.5% slower. And there are now sellers too, like Türkiye and Russia. Prices respond not to whether there are buyers but to whether the pace of buying has changed.
Third, why isn’t gold rising when money is flowing into gold ETFs? In September, $10bn went into gold ETFs and holdings reached a record 4,256 tonnes, yet gold fell that month. ETF buying alone could not overcome the downward pressure from rising rates. Larger ETF holdings signal that some people want to buy at lower prices, which reads as a force supporting the floor.
Fourth, is gold cheap now? By this report’s calculation, if real yields stay where they are, it is natural for gold to stay near where it is. A 0.5-point fall in real yields would mean about $4,581; a 0.5-point rise, about $3,756. Whether gold is cheap or expensive depends on real yields’ next move. Most Fed officials expect more hikes, and the market puts the odds of a December hike at about 89%.
Fifth, is the “rising until 2030” view wrong? This report does not think so. The arguments that supply rises slowly and that central banks will keep adding gold over the long run hold up in the numbers. But the path gold takes in between is set by rates. Even while gold fell 45.5% from 2011 to 2015 there were people talking about a long-term rise, and gold did not pass its 2011 peak again until 2020. History’s numbers say that even if the long cycle is right, the rest in the middle can last years.
Sixth, why did Korean gold fall more than international gold? Because the won-dollar rate fell 7.2%, and the 4.9% premium that domestic gold carried in January has disappeared, to -0.1% now. Multiplying the three pieces gives -34.5%, matching the KRX drop of -34.6%. With the premium gone, domestic gold now trades at the international price, so from here you only need to watch two things: the international gold price and the exchange rate.
Three roads lead to higher gold, and all of them run through real yields or central banks
Here are the three roads by which the author’s view would change. All three start outside the gold market and reach gold by lowering real yields or reviving central-bank buying.
The first road is oil. After strikes on Iran resumed at the end of February, oil jumped from about $65 to $102 and the Fed could no longer cut. If the war ends or traffic through the Strait of Hormuz returns to normal and oil falls, inflation worries ease and the Fed could stop hiking. If the Fed stops, the 10-year real yield has room to come down from its 2.95% peak. Daishin Securities also cited the base effect of oil prices falling below year-earlier levels when it pointed to Q2 2027 as a rebound point. On this road, gold rises slowly, following the rule of about 10% for every 0.5-point fall in real yields.
The second road is the economy. If US employment deteriorates badly, the Fed will worry about growth before inflation, and the cuts penciled in for 2028 could come sooner. This road is fast. Just as gold futures went from $3,873.2 to $4,341.1 at month-end while the Fed cut three times in the second half of 2025, gold moves ahead once cuts begin. But in the early phase of a sharp downturn, gold can also be sold along with everything else as people rush to cash. Gold welcomes a recession only after rate cuts are confirmed.
The third road is central banks. If central-bank buying returns to a pace of 1,000 tonnes a year, gold could rise even with high rates, as it did in 2022-2025. The signals for this road are central-bank net buying in the WGC’s quarterly report and the People’s Bank of China’s monthly announcements. Q2’s 288.9 tonnes, annualized, is 1,155.6 tonnes, already close to that pace, but Q1’s 56.5 tonnes pulled down the first half as a whole. If Q3 comes in like Q2, it can be read as this road opening up. Whether Türkiye’s and Russia’s selling stops is the same kind of signal.
Of the three, the second road is the farthest away right now, because most Fed officials expect further hikes. The closest is the third road. Central-bank buying swings a lot from quarter to quarter, so a single Q3 release at the end of October could change the direction. This report has put the signals for all three roads into the gauges below.
Korean investors lost 34.6% because of a stronger won and a vanished premium
While international gold fell 25.9%, Korean gold fell more. The KRX gold market’s price per gram fell 34.6%, from the year’s highest close of KRW 269,810 (about $203.3) on January 29 to about KRW 176,410 (about $132.9) on October 20 (author’s calculation). That is 8.7 points more than the international price.

The KRX gold price is the international spot price times the won-dollar rate, plus a domestic premium on top. So the fall can be split into three pieces. First, gold in dollars fell 25.9%. Second, the won-dollar rate fell 7.2%, from KRW 1,429.3 on January 29 to KRW 1,327.0 on October 20, making the same dollar gold cheaper in won. Third, the premium shrank. Converted into won, the January 29 international spot peak was KRW 257,094 per gram, and the KRX record close was 4.9% higher than that (author’s calculation; the two prices are from different times). On October 20, KRX gold at KRW 661,538 per don was actually 0.1% below the international price converted into won, KRW 662,262 per don. The disappearing premium took off another 4.8%.
The chart sets the peak at 100 and subtracts the three pieces in turn. Dollar gold takes it to 74.1, the stronger won to 68.8, and the vanished premium to about 65.5. Multiplying the three pieces gives -34.5%, almost the same as the actual KRX drop of -34.6%. The two pieces that investors watching only the international price missed add up to 8.7 points.

The premium disappearing also means the market has gone back to normal. On February 14, 2025 the premium was 20.1% on closing prices, and once, it fell from 18.56% on October 15, 2025 to 5.25% six days later, and domestic gold dropped 12.7% in three days. NH Investment & Securities said the gap should be around 1% when the market works properly. That is where it is now. Anyone buying KRX gold from here needs to watch only two things, the international gold price and the exchange rate, rather than whether the premium returns.
Froth in the KRX gold market cooled first in trading value. Average daily trading value was KRW 241.7bn (about $182.1 million) in January and KRW 39.1bn (about $29.5 million) in September, 83.8% less than January. The month-end price per gram fell from KRW 253,000 in January to KRW 182,940 in September.


The same trend shows up in the physical market, such as the jewelry district of Jongno in Seoul. Gold banking balances at banks (KB Kookmin, Shinhan and Woori) fell 33.1%, from KRW 2,443.4bn (about $1.84 billion) at the end of January to KRW 1,635.6bn (about $1.23 billion) on October 15. Gold banking accounts are valued at weight times price, so balances shrink when prices fall even if few people sell. Gold bar sales at the five largest banks, by contrast, reached KRW 43.03bn (about $32.4 million) in October 1-15 alone. That is 1.5 times all of September (KRW 29.08bn) and the most since April (KRW 49.01bn). Retail investors also put a net KRW 111.4bn (about $84 million) into the ACE KRX Gold Spot ETF over the past three months. Individuals are buying gold as it falls.

Gold ETFs have also grown. As of October 6, net assets of ACE KRX Gold Spot were KRW 3,741bn and of TIGER KRX Gold Spot KRW 1,114.8bn, KRW 4,855.8bn (about $3.66 billion) for the two together. Their three-month returns were -12.23% and -12.22%. The Kukmin Ilbo summed it up: investors hold more gold by weight, but it is worth less. Money keeps flowing into gold ETFs yet net assets shrank, which means the price decline was bigger than the new money. Individuals are lowering their average cost by buying more on the way down, but when that average cost turns into a profit also depends on real yields.
The Bank of Korea is also buying gold. At the end of August its gold holdings were 104.4 tonnes, 3.4% of foreign reserves at market value. Starting December 14, the Bank of Korea will buy, in won, about 1 tonne of gold (about KRW 200bn, or about $151 million) that a domestic refiner had planned to export. It is the bank’s first purchase of physical gold since 2013. One tonne is small next to global central-bank buying, but it signals that Korea has joined the trend of central banks adding gold. On the gold banking side, balances fell from KRW 2,443.4bn to KRW 1,635.6bn while gold bar buying picked up to KRW 43.03bn in the first half of October.

Buying by individuals and the Bank of Korea is a force that supports gold when it falls. But as the earlier chapter calculated, what sets gold’s direction now is the real yield. For the hypothetical investor who put KRW 100mn into gold on January 29 to get back to break-even, both the international gold price and the won have to come back.
Gold holders watch real yields and the central-bank pace before the gold price
This chapter turns the report’s conclusion into a checking order for those who already hold gold and those thinking of buying. It does not recommend buying or selling; it lays out where to find the numbers for a decision.
The first thing to watch is the US 10-year real yield. You can check it daily in FRED’s DFII10 series or the US Treasury’s TIPS yields. It is 2.74% now, and the level needed to return to the old high is 1.23%. If it starts falling into the low 2% range, the force pressing on gold is weakening. If it goes above 3%, gold could fall another step. By the PIMCO rule, gold moves about 10% for every 0.5 point.
The second is breakeven inflation. If 10-year breakeven inflation starts rising from 2.35%, the real yield falls even if nominal rates stay the same. If the Middle East war drags on and oil jumps again, breakevens could rise. In that case gold could again draw buyers as an inflation hedge. Telling apart whether inflation expectations are rising or real yields are rising is the biggest lesson of this drop.
The third is the pace of central-bank buying. Check it in the WGC’s quarterly Gold Demand Trends and its monthly central-bank statistics. The 2022-2024 average was 1,088.5 tonnes a year, and the annualized first-half 2026 pace is 690.8 tonnes. If this returns to a pace of 1,000 tonnes a year, gold could beat rates as it did in 2022-2025. Also watch the People’s Bank of China’s monthly announcements and Poland’s target of 700 tonnes.
The fourth is the numbers that matter only to Korean investors: the won-dollar rate and the premium. If the won gets stronger than KRW 1,327.0 per dollar, gold in won falls more than international gold; if the won weakens, it falls less. The premium has disappeared, at -0.1% now. If it climbs back above 5%, domestic gold is trading above international gold, and as in October 2025, losses can come when the premium drains away, whatever international gold does.
The fifth is the container you hold gold in. The KRX gold market and gold spot ETFs follow the domestic price; international gold ETFs and gold futures ETFs follow dollar gold, with the won’s effect depending on whether the currency is hedged. Gold miners move more than gold, and refiners like Korea Zinc also carry silver, zinc and management issues. Depending on the container, losses over these nine months ranged from -19.9% (GDX) to -35.3% (ACE KRX Gold Spot).
To sum up: now that the hand setting the gold price is back with rates, the order is to watch three numbers before the gold price itself: the 2.74% real yield, the 690.8-tonne annual central-bank pace, and KRW 1,327.0 per dollar. Gold pays no interest, so when rates rise, gold waits. The signal that the wait is over will come first from the bond market, not the gold market.
Related stocks moved more than gold, and the dates to watch are the FOMC and WGC releases
Gold’s fall passed straight through to products that hold gold and companies that mine or produce it. Against the January 29 close, the ACE KRX Gold Spot ETF is 35.3% lower, silver futures 49.8% lower and the gold miners ETF GDX 19.9% lower (October 20 closes). ACE KRX Gold Spot follows the KRX gold price, so it took the stronger won and the vanished premium from the earlier chapter as well. It went from KRW 37,890 on January 29 to KRW 24,520 on October 20 (about $18.5).
Korea Zinc produces gold and silver in its refining process. In the first half, its gold sales rose 58.5% to KRW 1,225bn and its silver sales rose 170.4% to KRW 4,108bn. First-half operating profit was KRW 1,333bn (about $1.0 billion). Precious metal prices have become one pillar of Korea Zinc’s profit, which is why its shares fell 12.42% on February 2, the trading day after silver’s crash. The October 20 close was KRW 916,000 (about $690), 58.2% below the 52-week high of KRW 2,189,000. Korea Zinc’s share price also reflects a control dispute and zinc prices, so it is not explained by gold alone.

Gold mining stocks normally move more than gold. The cost of mining gold is almost fixed, so a 10% fall in gold cuts profit by far more than 10%. This time, GDX is 19.9% below January 29, a smaller fall than gold futures (22.1%), but measured from its February 27 peak it is down 25.4%. Gold miners peaked a month after gold.
Eight signals the author watches
The author sums up the signals that would change this view as eight gauges: whether the 2.74% real yield falls into the low 2% range, whether breakeven inflation of 2.35% rises, the Fed’s next move from 4.00%, the pace of central-bank buying (690.8 tonnes annualized in the first half), gold ETF flows (+67 tonnes in September), the KRX premium (-0.1%), the won-dollar rate (KRW 1,327.0), and whether the Bank of Korea actually starts buying gold in December.

Dates to watch
The Fed meets on October 27-28 (US time). The market puts the odds of a hike at this meeting at about 15%. The WGC is expected to release Q3 Gold Demand Trends around October 29 (Q2 came out on July 30). September central-bank statistics come out in early November. The December 8-9 (US time) Fed meeting, with hike odds of about 89%, is the biggest date for this issue. The Bank of Korea’s first gold purchase is on December 14.

Here is the number to watch on each date. At the October 28 (US time) Fed meeting, what moves real yields is less the rate decision than how clearly the press conference points to a December hike. In the WGC’s Q3 demand report around October 29, watch whether central-bank net buying held near Q2’s 288.9 tonnes and how far ETF flows turned from Q2’s -44.8 tonnes. With September’s 67-tonne ETF inflow already known, Q3 ETF flows are likely to be positive. In the September monthly central-bank statistics in early November, watch whether Türkiye’s and Russia’s selling continued. At the December 8-9 (US time) meeting, watch both whether rates go up and whether the new dot plot adds more cuts for 2027. The Bank of Korea’s first purchase on December 14 is only 1 tonne, so it will leave a small mark on domestic gold trading and the premium rather than on the gold price.
Put the three drops side by side, and this time the question is duration, not depth
Put the three peaks of 1980, 2011 and 2026 on the same yardstick. In 1980, gold fell 65.0% over about two and a half years, from $850 to about $297.5 in June 1982. In 2011, it fell 45.5% over more than four years, from $1,921 to $1,046 in December 2015. In 2026, it has fallen 25.9% in nine months from $5,594.82.
The difference in depth matches the difference in rate levels. In 1980 the fed funds rate was 20%, and as inflation came down, real yields became the highest in history. In 2013 the 10-year real yield rose 1.66 points, from -0.74% to 0.92%. In 2026 the real yield rose 1.23 points, from 1.72% in February to 2.95% in October, and 0.85 point since January 29. The bigger the rise in real yields, the deeper gold fell.
Central banks are what limit the depth. After 1980 and after 2011, central banks were not buying gold on a large scale, and around 1999 some countries, like the UK, were selling. In 2026, even at a slower pace, they bought 170 tonnes in January-August. Because of that difference, this drop may be shallower than the previous two.
Duration is another story. It took 28 years to pass the 1980 peak again and about 9 years to pass the 2011 peak. Both times, the bottom came around the end of rate hikes, and the return to the peak came after rates had fallen far enough. In 2026, the Fed has only just started hiking. Central banks can limit the depth, but rates set the duration. That is why this report looks at the near condition of a 1.23% real yield before the distant end point of 2030.
Basis of calculation: how spot and futures, the real-yield rule and the won breakdown were counted
This chapter states where each number in the report comes from. As a rule, each item uses only one source.
Gold’s peak and current price are both Reuters spot prices. The peak is $5,594.82 on January 29 (a Reuters article of February 2, 2026 republished by BNN Bloomberg), and the current price is $4,147.87 at 2:09 p.m. New York time on October 19 (cited in a Topstar News article of October 20). The price path chart, the correlations and the comparison with other assets use Yahoo Finance’s continuous closing prices for New York Mercantile Exchange gold futures (GC=F). On futures closes, the peak is $5,318.4 and October 20 is $4,142.5, a fall of 22.1%. The gap between the two measures is the gap between the intraday top and the close.
Real yields, breakeven inflation, the 10-year Treasury yield and the upper bound of the fed funds rate are FRED’s DFII10, T10YIE, DGS10 and DFEDTARU. The latest real yield is 2.74% on October 16, and breakeven inflation is 2.35% on October 19. The 0.85 point is the difference between those values and the January 29 values.
Correlations use the log of month-end gold futures prices and the real yield, over 2006-2021, 2022-2025 and January-October 2026. The monthly slope is the regression slope of the one-month change in log gold on the change in real yield, expressed in percent. The 2026 period has only ten points, so its slope can swing a lot; the explained-share and recovery calculations use PIMCO’s 18% instead.
The share explained by real yields is 59.9%: (1-0.18) raised to the power 0.85, minus 1, which is -15.5%, divided by the actual spot fall of -25.9%. The remaining -12.3% is (1-0.259) divided by (1-0.155), minus 1. The recovery condition, 1.51 points, is the log rise from $4,147.87 to $5,594.82 divided by the log of (1-0.18). The PIMCO rule applies to the inflation-adjusted gold price, so applying it to the nominal price introduces an error equal to inflation. Over a short nine-month period that error is small, so the rule was used as is.
The KRX gold breakdown multiplies three pieces. Dollar gold -25.9%, the won-dollar rate (Yahoo KRW=X closes of KRW 1,429.3 on January 29 and KRW 1,327.0 on October 20) -7.2%, and the change in the premium from 4.9% to -0.1%, -4.8%, multiply to -34.5%. The January 29 premium of 4.9% is the KRX record close of KRW 269,810 divided by KRW 257,094, the Reuters spot peak of $5,594.82 converted at that day’s won-dollar rate; the two prices are from different times, so it is approximate. The October 20 premium of -0.1% uses KRX gold at KRW 661,538 per don and the international price converted into won at KRW 662,262 per don, both from the same article. The KRX price of KRW 176,410 per gram is the per-don price divided by 3.75.
Central-bank buying uses the WGC’s quarterly reports (annual and quarterly) and monthly statistics (by country). The quarterly reports include estimates of unreported buying, while the monthly statistics include only reported amounts, so the two differ. The 2022 and 2023 values are the 1,136 tonnes and 1,037 tonnes published at the time; later revisions could not be confirmed and are not used. The 2024 figure of 1,092.4 tonnes and the 2025 figure of 863.3 tonnes are from the 2025 annual report.
Stock returns are October 20 closes from Yahoo Finance (ACE KRX Gold Spot 411060.KS, silver futures, GDX) and the KRX Data System (Korea Zinc). Korea Zinc’s precious metal sales are from reports on its first-half results; some characters in one article’s body were garbled, so the gold and silver figures were matched against its headline (“silver sales alone KRW 4 trillion”) and other reports.
Maochaedung’s take. Gold pays no interest, so when real yields rise, holding it and waiting gets more expensive. In 2022-2025, central banks buying more than 1,000 tonnes a year hid that rule, but in 2026 their buying slowed to a pace 36.5% below that, and gold is following real yields again. Of spot gold’s -25.9% fall since the January peak, about 60% is explained by real yields rising 0.85 point while inflation expectations stayed flat, and the rest is the January froth draining away. Korean investors lost 34.6%, adding a stronger won and a vanished premium on top. The author sees not the end of the gold bull market but a return to a market priced by rates, and because the old high needs real yields down at 1.23%, watches the Fed’s next move and the pace of central-bank buying first.
Gold price and real yields: quick answers
Q. How much has the gold price fallen in 2026?
Spot gold hit a record $5,594.82 an ounce on January 29, 2026 and was $4,147.87 on October 19, 25.9% below the peak (Reuters). On gold futures closes the fall is 22.1%, from $5,318.4 to $4,142.5.
Q. Why did gold fall if central banks are still buying?
The 10-year US real yield rose from 1.89% to 2.74% while breakeven inflation stayed at 2.35%. By PIMCO’s rule of -18% per percentage point, that explains a 15.5% fall, about 59.9% of the drop. Central banks still buy, but at an annualized 690.8 tonnes in H1 2026, 36.5% below the 2022-2024 average of 1,088.5 tonnes.
Q. What would it take for gold to return to its record high?
By the same PIMCO rule, gold needs to rise 34.9% to get back to $5,594.82, which requires the 10-year real yield to fall 1.51 points, from 2.74% to 1.23%. The last day it was below 1.23% was May 11, 2023.
Q. Why did Korean investors lose more on gold?
KRX gold fell 34.6%, from KRW 269,810 per gram on January 29 to about KRW 176,410 on October 20. Dollar gold fell 25.9%, the won-dollar rate fell 7.2% from 1,429.3 to 1,327.0, and the domestic premium went from 4.9% to -0.1%.
Q. Is the gold bull market over?
The author’s view is that it has not ended but has returned to a market priced by real yields. The gold-real yield correlation was -0.92 in 2006-2021, +0.45 in 2022-2025 and -0.78 in 2026. Goldman Sachs still sees $5,400 at end-2027, 30.2% above today.
Sources
- Reuters (via BNN Bloomberg), Gold, silver fall further as CME margin hike stokes selling (link), Feb 2, 2026; Creamer Media, CME margin hike (link), Feb 2, 2026
- Newspim, Precious metals shock and Korea Zinc (link), Feb 2, 2026; Yonhap News (via Nate), Korea Zinc close (link), Feb 2, 2026
- Topstar News, Today’s gold price (link), Oct 20, 2026
- Muhlenkamp quarterly commentary (link), Apr 9, 2026; Trading Economics (link), Mar 26, 2026
- Nation Thailand, Fed rate rise on September 16 (link), Sep 16, 2026; Financial News (Newsis), US 10-year yield and gold ETFs (link), Oct 9, 2026; Global Economic, FOMC odds (link), Oct 20, 2026
- Federal Reserve Bank of St. Louis FRED, DFII10, T10YIE, DGS10, DFEDTARU, retrieved Oct 19, 2026
- PIMCO, Understanding Gold Prices, as of Jun 30, 2025; Chicago Fed Letter No. 464, What drives gold prices?, Nov 2021
- World Gold Council, Gold Demand Trends Full Year 2025 (link), Jan 2026; Q2 2026 (link), Jul 30, 2026; central bank statistics for August (link), Oct 6, 2026; Gold ETF Flows September 2026 (link), Oct 7, 2026
- FXStreet, central-bank buying in 2022 and 2023 (link), Feb 8, 2024; Kitco, People’s Bank of China in August (link), Sep 8, 2026
- investingLive, Goldman Sachs gold forecast (link), Sep 23, 2026; BNN Bloomberg, BofA forecast (link), Jul 8, 2026; KPI News, UBS and Metals Focus (link), Oct 13, 2026
- Segye Ilbo, Gold fell 25% but it isn’t over (link), Oct 20, 2026; Financial Post (Korea), Daishin Securities gold outlook (link), Oct 20, 2026
- Financial News, KRX gold record close (link) and monthly trading value (link), Oct 11, 2026; Asia Economy, gold bars and gold banking (link), Oct 20, 2026; Money Today, kimchi premium (link), Oct 16, 2025; Money Today, Bank of Korea gold purchase (link), Oct 1, 2026
- Nate (Asia Today and others), Korea Zinc first-half results (link), Aug 6, 2026
- Federal Reserve History, Volcker’s Announcement of Anti-Inflation Measures (link); US Bureau of Labor Statistics, TED (link); LBMA, The Alchemist issue 18 (link); Wikipedia, Gold fixing (link)
- Business Standard (Reuters), gold’s crash on April 15, 2013, Apr 16, 2013
- Yahoo Finance (gold and silver futures, GDX, USD/KRW, ACE KRX Gold Spot), KRX Data System (Korea Zinc close), Oct 20, 2026
- Photos: Federalreserve (public domain), 維基小霸王 (CC BY-SA 4.0), Ibex73 (CC BY 4.0), Chuq (CC BY-SA 4.0), Narubaru7 (CC BY 4.0), The Seoul Institute (CC BY 4.0), Stevebidmead (CC0), via Wikimedia Commons
Was this note useful?
Thanks. Your answer helps decide what to cover next.
Korea market snapshot · Oct 23, 2026
New to Korean stocks? Start here for the basics.
Most read
1France Protests 2026: Why Students Are Blocking Schools and Which Stocks Benefit (Munich Re, SCOR)
Get the Saturday note on Korean stocks
One email every Saturday with the week’s new research on Korean listed companies and links to the updated data pages. Built from DART filings and KRX data. Free; unsubscribe in one click. See past issues