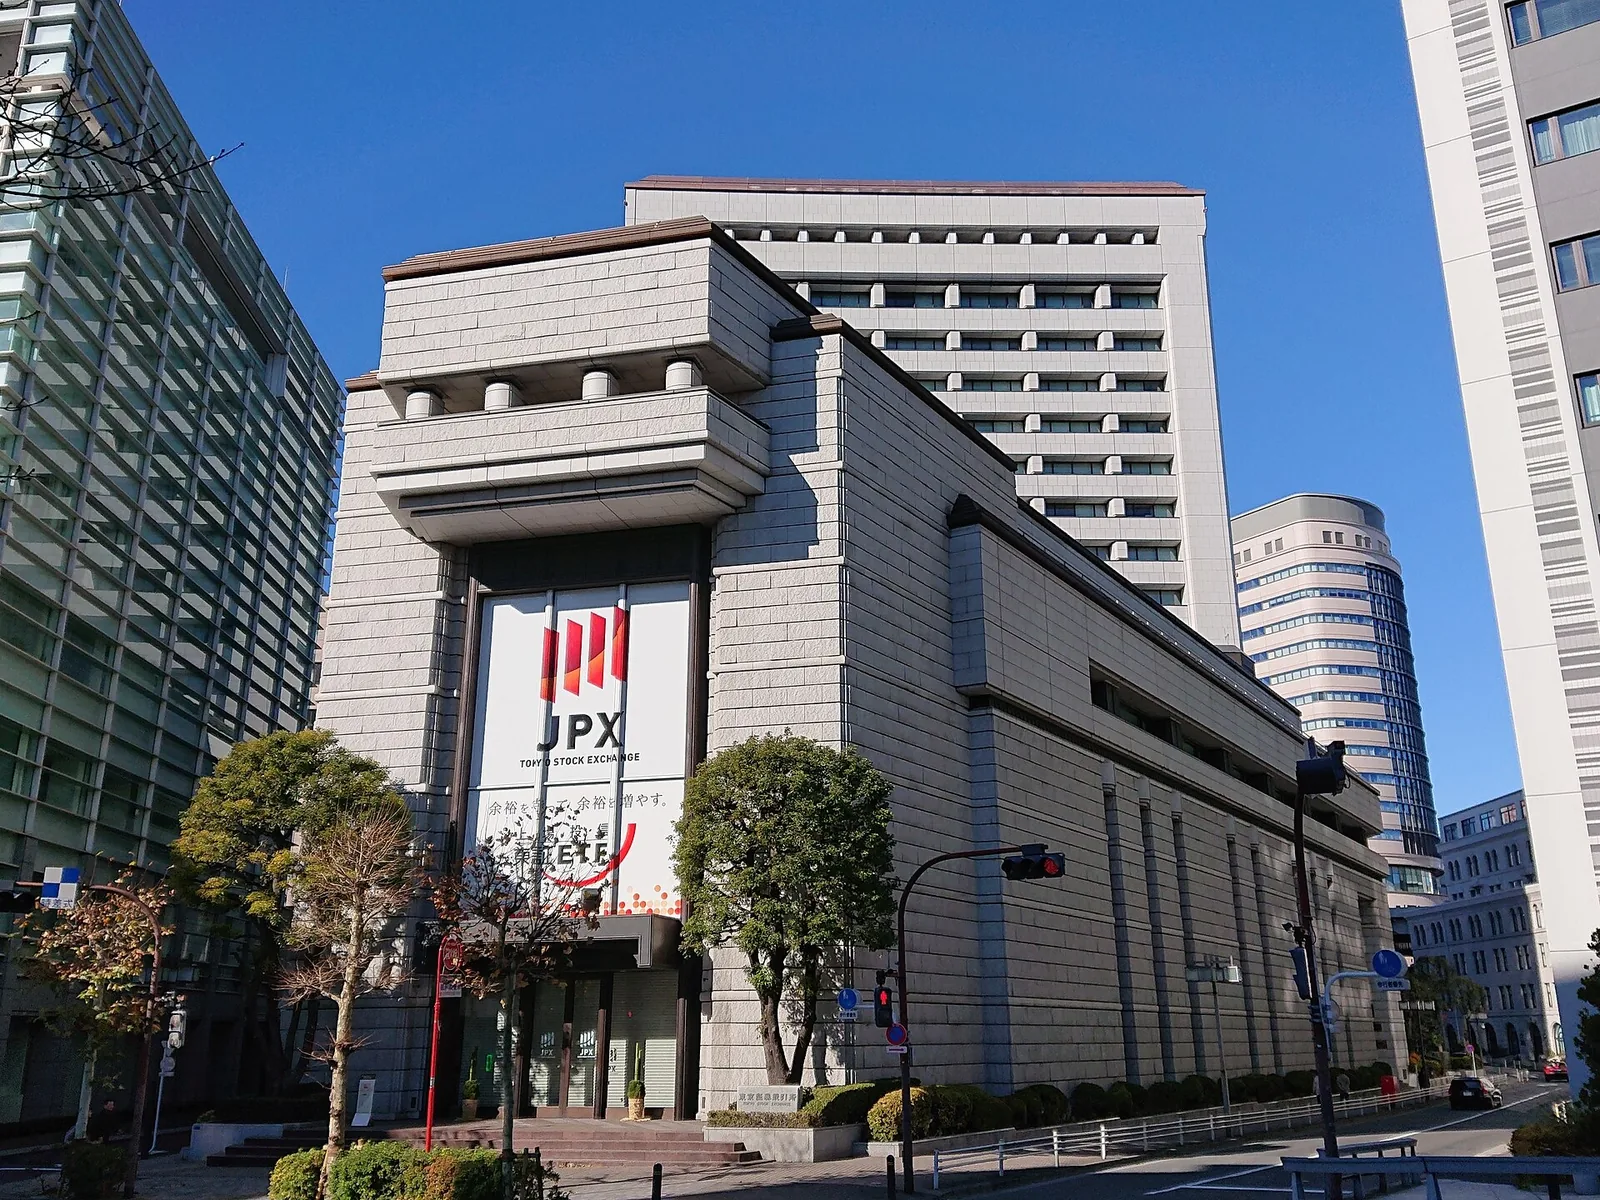
Balance Sheet Recession: Japan’s Lost Years and Korea’s KRW 2,000 Trillion Household Debt (2026)
English edition of the author’s Korean note on Japan’s balance sheet recession and Korea’s household debt.
On February 10, 2010, Richard Koo, chief economist at the Nomura Research Institute, summed up what Japan went through from 1990 to 2005 in written testimony to the U.S. House Financial Services Committee. “No economics or business textbook recommends that the private sector pay down debt when interest rates are at zero, but that was precisely what happened in Japan for a full ten years.” Companies whose land and shares had collapsed, he wrote, found that “with their balance sheets in a shambles, people had no choice but to reorient their economic priorities from the usual profit maximization to debt minimization in order to put their financial houses in order.” By his count, “in some years, net debt repayment reached 30 trillion yen, or 6 per cent of Japan’s GDP.”
Koo called this a balance sheet recession. In an ordinary downturn, a central bank cuts rates, firms and households borrow and spend again, and the economy recovers. In a balance sheet recession nobody wants to borrow, so money stops circulating however far rates fall. Koo stressed the point in his testimony: a bank that refuses to lend makes the front page, but a borrower who refuses to borrow hardly makes the news at all.
So this time the question is: Korea’s household debt has just passed KRW 2,000 trillion for the first time. Is Korea heading down Japan’s road, where money stops moving because everyone is busy repaying? This report first explains a balance sheet recession with a hypothetical example. It then follows how Japanese firms paid down debt after asset prices collapsed, why rate cuts and government spending lost their bite, how growth, prices and banks froze together, and how the United States and Spain went through a household version after 2008. It then turns to Korea: how big the household debt is and who holds it, house prices, consumption that has already slowed, new loans that swung to variable rates just as rates started to rise, and an aging population faster than Japan’s. Finally it traces how the chain reaches the Korean stock market and lists the indicators the author is watching.
As of: October 26, 2026 (Korean household credit to end-June 2026, BIS sector credit to Q1 2026, Japan’s flow of funds to fiscal 2025, share prices are October 26 closes). Won amounts are converted at KRW 1,326.45 per dollar, the USD/KRW rate on October 26, 2026.
Topics covered: what a balance sheet recession is, with a hypothetical example; the collapse of Japanese shares and land; Japanese firms’ financial surplus and debt repayment; why rate cuts did not work; government borrowing and public debt; Japan’s growth, nominal GDP and prices; bank lending and bad loans; household deleveraging in the United States, the United Kingdom and Spain; Korean household credit and its global rank; how private debt splits between firms and households in Japan and Korea; Korean house prices; consumption and saving; variable-rate loans and the base rate; debt service and delinquency; aging; how sectors fared in the Japanese and Korean stock markets; the author’s view and the indicators to watch; and the basis of calculation.
Stocks mentioned: E-Mart (139480.KS), Lotte Shopping (023530.KS), KB Financial Group (105560.KS), Hana Financial Group (086790.KS), Shinhan Financial Group (055550.KS), Hyundai Engineering & Construction (000720.KS), GS Engineering & Construction (006360.KS), Samsung Electronics (005930.KS) and SK Hynix (000660.KS). Tickers ending in .KS trade on the KOSPI, the main board of the Korea Exchange. For Japan: Sumitomo Mitsui Financial Group (8316.T), Toyota Motor (7203.T) and Mitsui Fudosan (8801.T).
When asset prices collapse the debt stays, and while it is repaid the economy stops spending
The conclusion of this chapter is that a balance sheet recession comes not from a shortage of money but from debts that have grown larger than assets. When a company or a household has negative net worth, it uses its income to repay debt first, however well business is going, and it will not borrow even at very low rates. For one company that is the sensible choice. When every company and household in a country does it at once, the link by which one person’s spending is another person’s income breaks.
A balance sheet is one line: assets = debt + equity
A balance sheet lists, at one point in time, what you own and what you owe. On the left are assets such as land, buildings, shares and deposits; on the right are the borrowed money (debt) and your own money (equity, or net worth) used to buy them. Assets always equal debt plus equity. In that equation the debt is a number fixed by contract, so it does not change when asset prices change. When asset prices fall, only equity shrinks.
Take a hypothetical company. It bought land worth 100 with 80 of borrowed money and 20 of its own. If the land price halves, assets fall to 50 while the debt of 80 stays, so equity goes from 20 to -30. On paper the company could sell everything it owns and still not repay its debt.
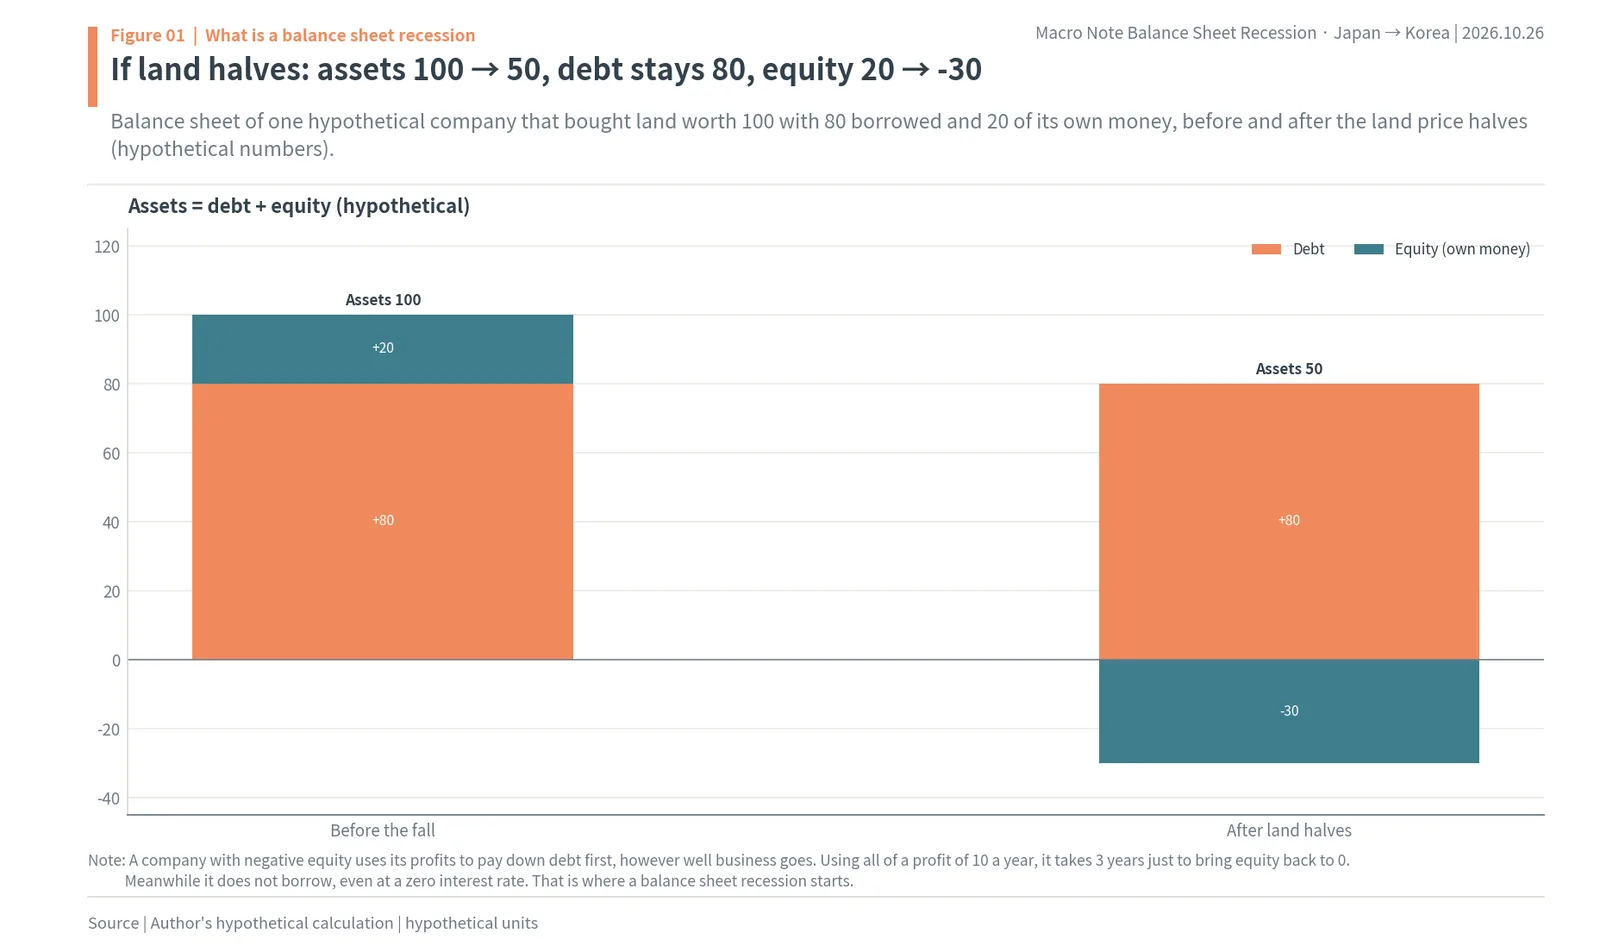
Suppose this company earns a profit of 10 a year. The first thing the managers of a company with negative equity do is to use that 10 to repay debt. Even if all of it goes to repayment, it takes 3 years just to bring equity back to zero. Meanwhile the company builds no new factories, hires no one, and does not borrow from the bank even at a zero interest rate. That is Koo’s shift “from the usual profit maximization to debt minimization.”
When one household’s sensible choice becomes everyone’s, the economy cools
Across a whole economy, money someone saves becomes income again only when someone else borrows and spends it. If households earn 100, spend 90 and put 10 in the bank, firms must borrow that 10 and build factories for the 100 to come back as income next year. In a balance sheet recession, firms do not borrow; they too save in order to repay debt, so both the households’ 10 and the firms’ repayments pile up in the banks. Money that sits there is nobody’s income. Total spending falls by that much, lower spending means lower income, and lower income means it takes even longer to repay the debt.
In this process central bank rate cuts lose their power. Interest rates are a medicine that works only when there are borrowers. For someone with negative net worth, a 0% interest rate is no reason to borrow. That is why Koo argued that at such times government borrowing and spending is the only support left: the government has to borrow what the private sector saves for the chain of incomes to continue. From the next chapters this report follows, in numbers, how that chain ran in Japan.
Key terms, and a hypothetical Korean household
The conclusion of this chapter is that when a balance sheet recession is carried over to Korean households, two numbers decide what a household does: house prices and interest rates. House prices set its net worth and interest rates set what it pays every month. When both turn bad, households behave like Japanese firms did: they cut spending and repay debt first.
Terms used in this report
A sector’s financial surplus or deficit is what one sector (firms, households or the government) earns in a year minus what it invests and spends. A deficit means it borrowed the shortfall; a surplus means it repaid debt or built up deposits with what it saved. Nominal GDP is the size of the economy without removing inflation, and real GDP is output after inflation. Debt is fixed in nominal terms, so if nominal GDP does not grow, the weight of debt does not shrink.
How it works in Korea: household credit is the Bank of Korea’s (BOK, the central bank) measure of all household debt, adding household loans from banks, insurers, card companies and others to sales credit, meaning purchases on cards and installment. The debt service ratio (DSR) is the share of income that goes on principal and interest in a year. The BIS DSR used in this report treats all households in a country as one; it is calculated differently from the borrower-level DSR that Korean regulators use when approving loans. The “stress DSR” is a Korean rule that calculates loan limits as if the loan rate were higher than it is, to allow for future rate rises.
A variable-rate loan resets its rate, usually every 6 or 12 months, when the reference market rate changes; a fixed-rate loan keeps its starting rate for a set period. When rates are rising, a high share of variable-rate loans passes rate hikes quickly into households’ monthly payments. “Vulnerable borrowers” are borrowers with loans from several lenders who are also in the bottom 30% by income or have low credit scores.
A hypothetical example: a KRW 1 billion apartment and a KRW 600 million loan
Take a hypothetical household. It bought an apartment worth KRW 1 billion (about $754,000) with a KRW 600 million loan (about $452,000) and KRW 400 million of its own money. While the price holds, its net worth is KRW 400 million. If the price falls 30% to KRW 700 million, the KRW 600 million loan stays and its net worth falls to KRW 100 million: three-quarters of its own money is gone. At that point the household’s choices change. While prices were rising the loan was the cost of buying an asset; when prices fall it becomes a burden that must be repaid. The household cuts dining out and travel and uses what it saves to repay principal first (hypothetical numbers).
Now suppose the same household took the KRW 600 million loan at a variable rate and rates rise by 1 percentage point. Its interest bill rises by KRW 6 million a year (about $4,520), or KRW 500,000 a month (about $377), before any principal repayment (hypothetical numbers). That KRW 500,000 comes out of what the household used to spend on other things. When falling house prices shrink net worth and rising rates swell monthly payments at the same time, a household moves hard toward cutting debt. When that choice happens in millions of households at once, it is a household balance sheet recession.
Japan started with shares down four-fifths and commercial land down almost nine-tenths
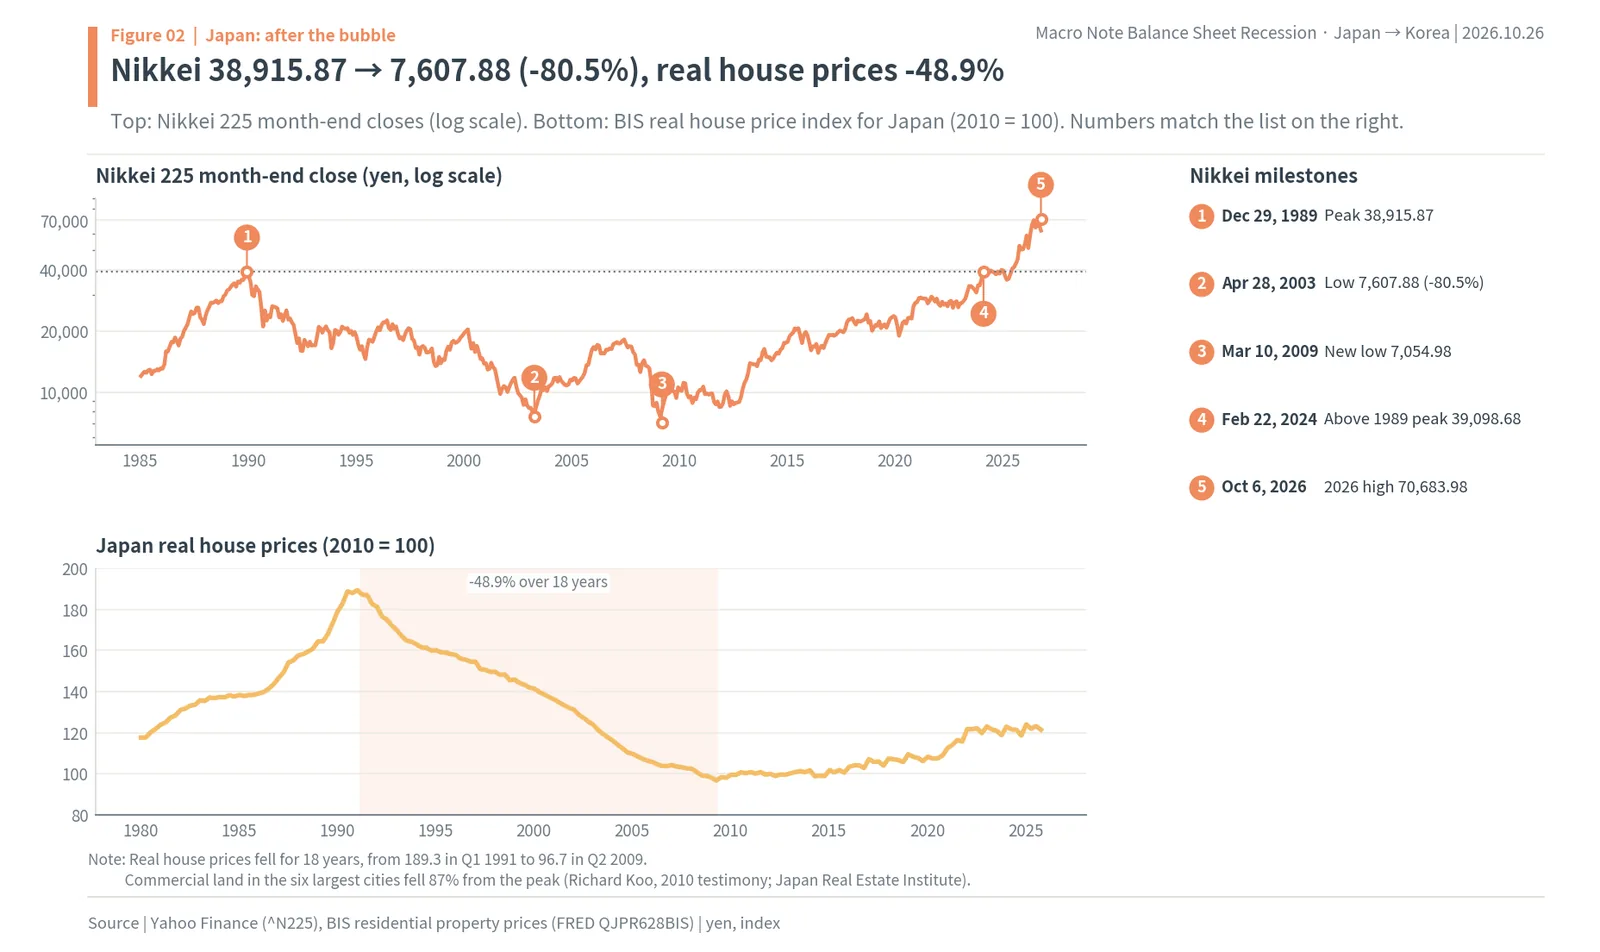
The conclusion of this chapter is that Japan’s starting point was one of history’s great asset price collapses. The Nikkei 225 fell 80.5% from 38,915.87 on December 29, 1989 to 7,607.88 on April 28, 2003, and commercial land in the six largest cities fell 87% from its peak. Japan’s real house prices fell 48.9% over 18 years, from Q1 1991 to Q2 2009. With assets falling that far, the net worth of firms that had borrowed against them collapsed all at once.
It took 34 years for shares to pass their old peak
The Nikkei 225 soared with land prices in the late 1980s. Its close of 38,915.87 on the last trading day of 1989 became a number it could not pass for a very long time. Shares began falling in 1990 and by April 28, 2003 stood at 7,607.88, 80.5% below the peak; after the 2008 financial crisis they hit a second low of 7,054.98 on March 10, 2009. The first close above the 1989 peak came on February 22, 2024 (39,098.68), 34 years later. Japanese shares then rose as high as 70,683.98 on October 6, 2026 and closed at 62,189.65 on October 26.
Land weighed more than shares. In the same testimony Koo wrote that Japan “suffered a staggering 87 per cent nationwide drop in the value of commercial real estate when its bubble burst.” The commercial land index for the six largest cities from the Japan Real Estate Institute that he cited peaked in September 1990. The BIS real house price index for Japan (2010 = 100) also fell almost without pause for 18 years, from 189.3 in Q1 1991 to 96.7 in Q2 2009. It was not one big fall followed by a recovery but a slow slide that lasted a generation.
When the collateral collapsed, balance sheets turned upside down
In the 1980s Japanese firms and banks borrowed and lent against land. Rising land prices raised collateral values, which allowed more borrowing, and the money went back into land and shares. When the loop ran in reverse, the left side of corporate balance sheets (assets) shrank with land and share prices while the debt on the right side stayed. Firms like the hypothetical company in the first chapter, with shrinking or negative equity, appeared all over Japan. From then on the goal of Japanese firms changed from raising profits to cutting debt.
Japanese firms went from borrowing 8% of GDP to saving 7%
The conclusion of this chapter is that the core evidence for a balance sheet recession lies in Japanese firms’ financial surplus or deficit. By the Bank of Japan’s flow of funds, private non-financial firms borrowed ¥41.3 trillion (8.2% of GDP) in fiscal 1991 and saved ¥39.2 trillion (7.4% of GDP) in fiscal 2003. In twelve years the corporate sector’s spending swung by 15.6% of GDP (author’s calculation). Over the same period rates fell to zero, but firms did not borrow.
The financial balance is the gap between what a sector borrows and saves in a year
A sector’s financial balance is its saving in a year minus its investment. When firms spend more than they save to build factories, they must borrow the difference, a deficit; when they save more than they invest, they use the money to repay debt or build up deposits, a surplus. In a normal economy firms are always the borrowers and households the savers. Firms borrowing what households deposit and investing it is the basic shape of money going round.
Japanese firms were borrowers throughout the 1980s. In fiscal 1987 they borrowed more than 9% of GDP, and even after the bubble burst they borrowed ¥36.9 trillion in fiscal 1990 and ¥41.3 trillion in fiscal 1991 (FY1991). Then the deficit shrank fast, turned into a first surplus in fiscal 1994, and from fiscal 1998 firms saved every year: ¥27.3 trillion in fiscal 1999 and ¥39.2 trillion in fiscal 2003 (FY2003). They ran a surplus in 25 of the 28 fiscal years from 1998 to 2025, including ¥21.0 trillion (3.2% of GDP) in fiscal 2025. The Bank of Japan itself concluded in 2005 that “the private nonfinancial corporations sector replaced the households sector as the leading financial surplus entity.”
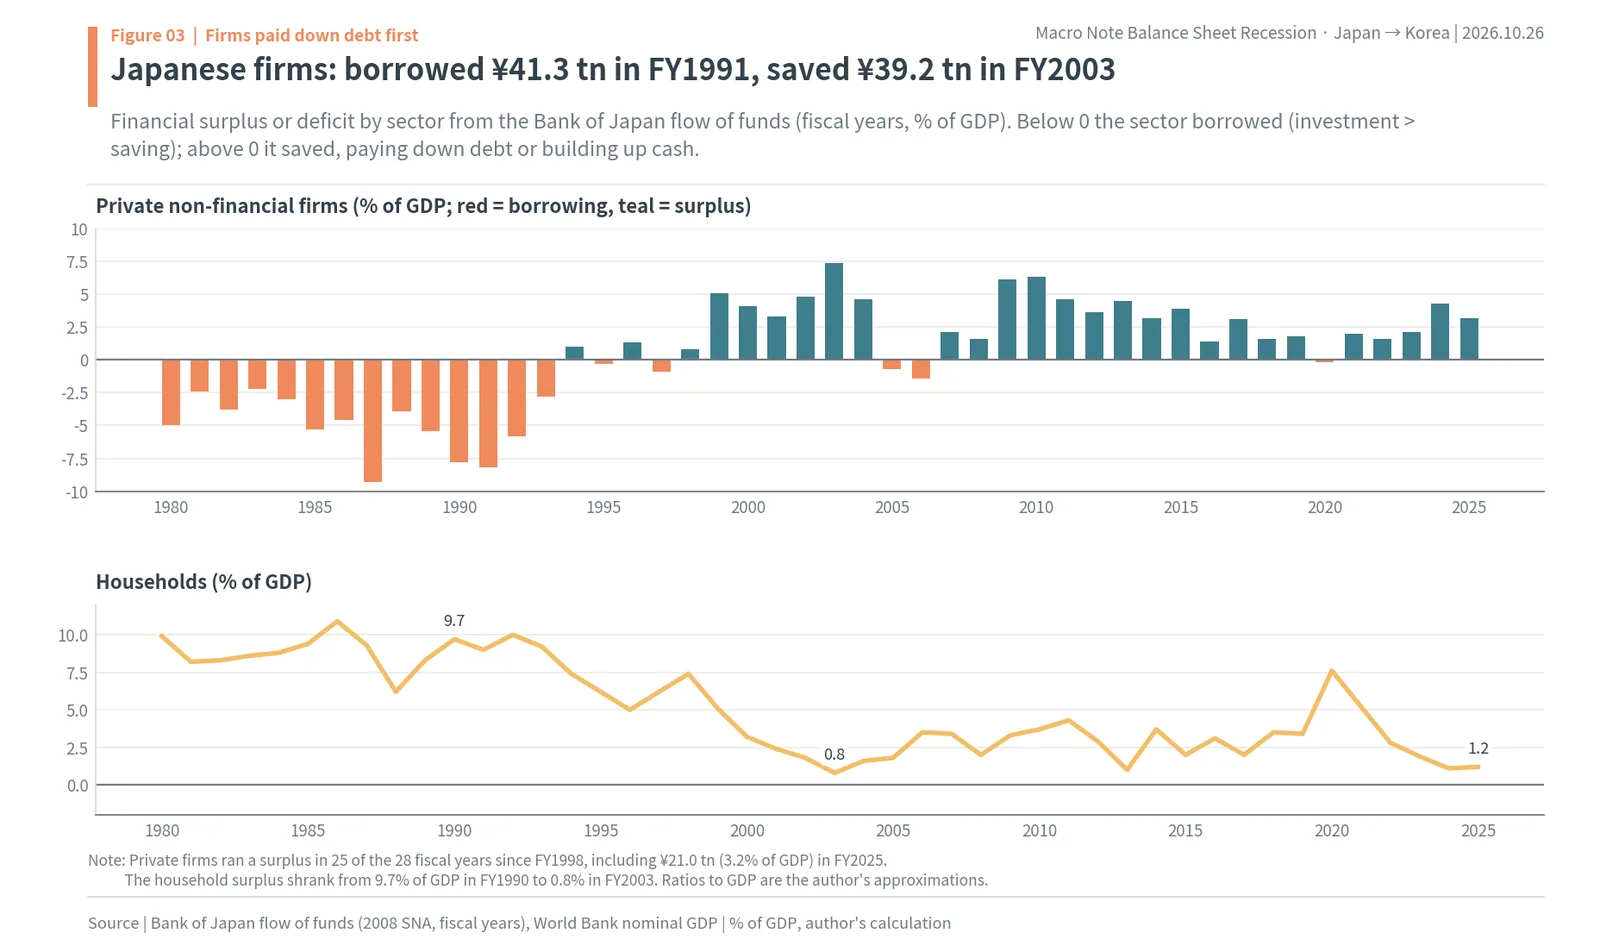
Households, meanwhile, saved less. The Japanese household surplus fell from 9.7% of GDP in fiscal 1990 to 0.8% in fiscal 2003. With incomes not rising, households could not save as much as before. The owner of the economy’s surplus shifted from households to firms, and the firms’ surplus came from halting investment to repay debt: that is the shape of a balance sheet recession.
Rates went to zero and corporate debt only fell
The Bank of Japan cut rates quickly. The official discount rate peaked at 6.0% in August 1990 and was down to 0.5% by September 1995. In 1999 the short-term call rate went effectively to zero, and in 2001 the bank began quantitative easing, increasing the quantity of money itself. In an ordinary downturn, cuts on that scale would have brought a big rise in corporate investment and borrowing.
Yet corporate debt in Japan, as measured by the BIS, peaked at 144.9% of GDP in Q4 1993 and then fell 53.0 percentage points to 91.9% in Q1 2016. Through more than twenty years in which rates sat at zero, the discount rate having gone from 6.0% to 0.5%, firms kept cutting debt.
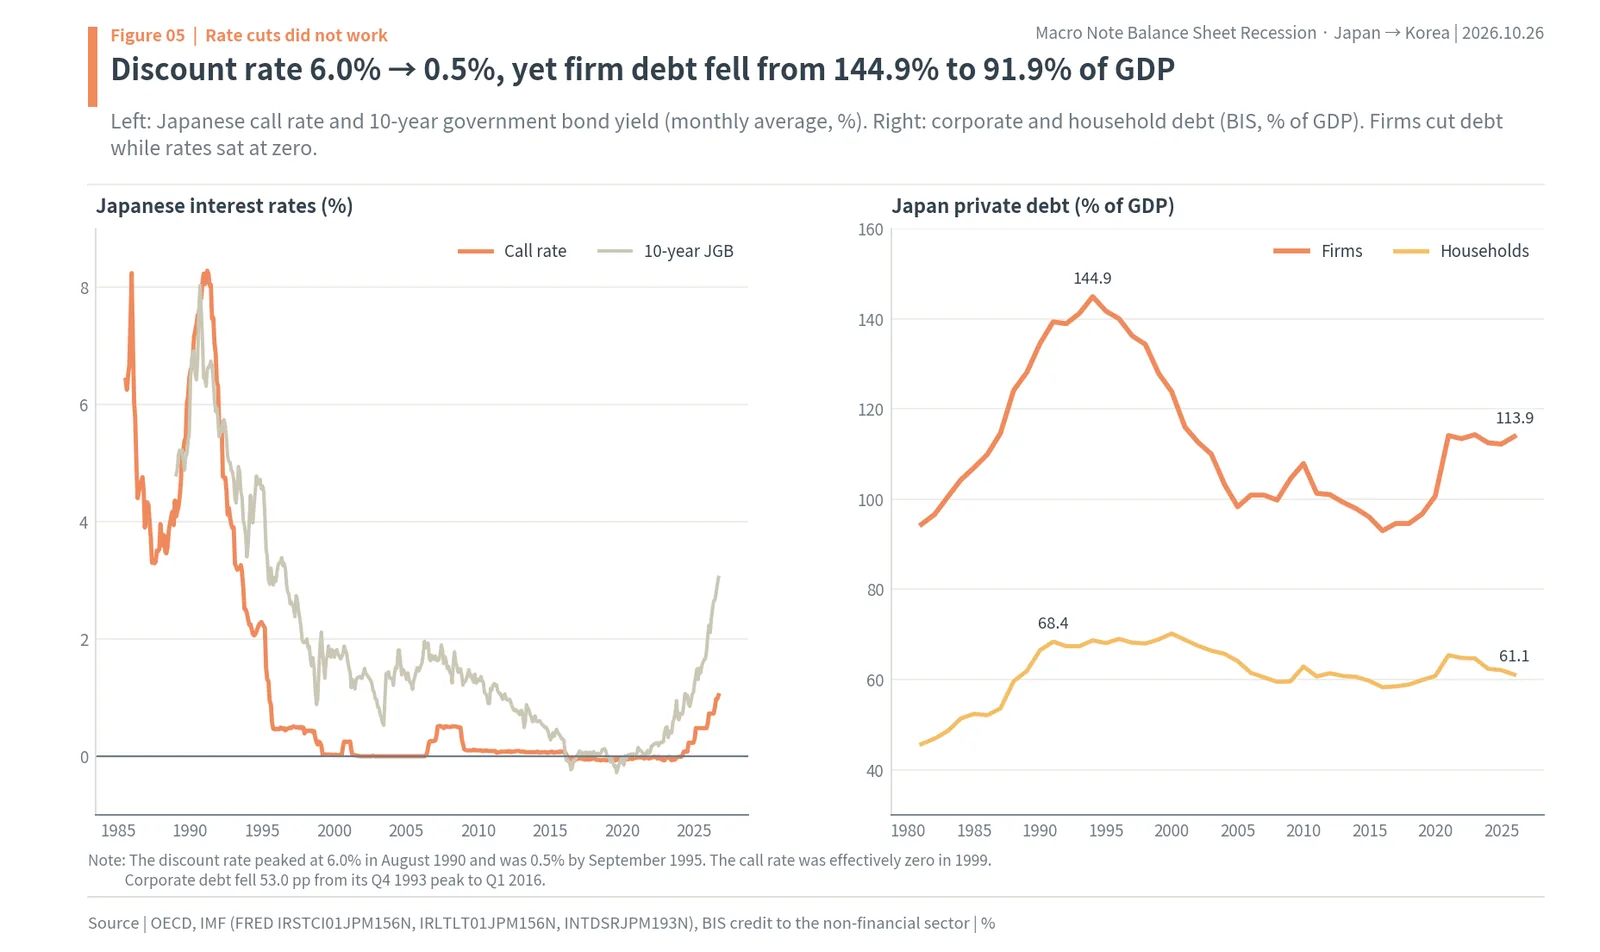
Koo put it this way: “By 1995 Japanese interest rates were almost at zero, but instead of borrowing more, Japan’s corporate sector became a net repayer of debt until 2005”, fully ten years later. The reason the medicine of low rates failed is simple. Firms did not avoid borrowing because interest was expensive; they avoided it because their balance sheets were broken. Until equity is restored, a firm will not add debt even at zero interest. Japanese household debt barely moved from 68.4% of GDP at the end of 1990, peaked at 70.2% in Q4 1999 and then slowly came down.
What firms saved the government borrowed, and public debt rose from 63.2% to 258.4% of GDP
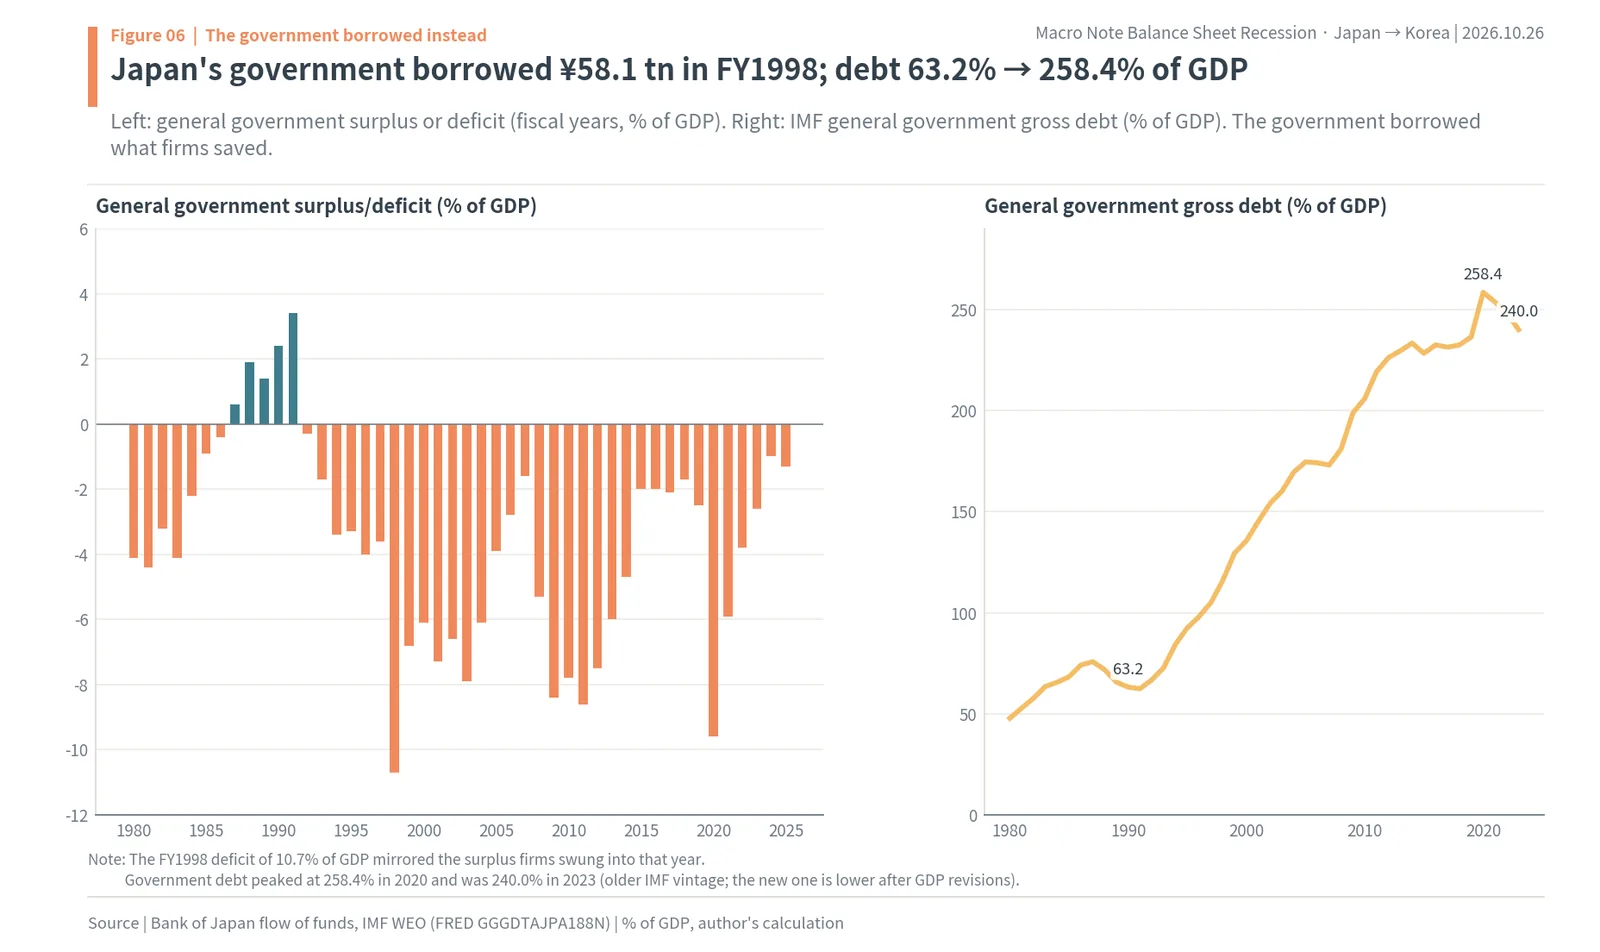
The conclusion of this chapter is that Japan’s government deficits were not profligacy but the mirror image of corporate saving. Japan’s general government ran a surplus of ¥16.9 trillion in fiscal 1991 and borrowed ¥58.1 trillion (10.7% of GDP) in fiscal 1998 (FY1998). In that same year private firms flipped from borrowers to savers. For the chain of incomes to continue, someone must borrow what someone else saves, and the government filled the gap left by firms.
Government deficits moved as a mirror of corporate surpluses
Overlaying the flow of funds charts, the government bars and the corporate bars move almost exactly opposite. In the late-1980s bubble, tax revenue poured in and the government saved, while firms borrowed heavily. After the bubble, stimulus and falling tax revenue pushed the government into deficit, and the more firms saved, the bigger the deficit grew. The fiscal 1998 deficit of 10.7% of GDP was the largest, with big increases again in the 2008 financial crisis and in 2020 with COVID.
General government gross debt in Japan, as measured by the IMF, was 63.2% of GDP in 1990, peaked at 258.4% in 2020 and was 240.0% in 2023 (older IMF vintage; the current vintage gives slightly lower ratios after GDP revisions). Government borrowing spared Japan a Great Depression-style collapse in income, but at the price of public debt more than twice its GDP.
The prop held the economy up but did not revive growth
Government spending only made up for falling private spending. Growth returns only when the private sector finishes repaying and starts borrowing again, and Japanese firms kept repaying into the mid-2000s. Meanwhile the Japanese economy did not collapse, but it did not grow either. The next chapter looks at the result through growth, nominal GDP, prices and banks.
This also gives Korea a yardstick. When the private sector turns to repaying debt, the government needs room to spend in its place to prevent a sharp contraction. Korea’s government debt was 44.9% of GDP in Q1 2026 on the BIS measure, lower than Japan’s when its bubble burst in 1990 (63.2% on the IMF measure; the two measures differ, so this is a rough comparison). There is still a prop available for when households spend less.
As a result, Japan’s nominal GDP went nowhere for 16 years and bank lending fell too
The conclusion of this chapter is that an economy that is repaying debt freezes slowly and for a long time. Japan’s real growth fell from an average of 4.33% in the 1980s to 1.43% in the 1990s and 0.49% in the 2000s. Nominal GDP actually shrank 7.1%, from ¥554.1 trillion in 1997 to ¥514.6 trillion in 2013, and only passed its 1997 level at ¥556.0 trillion in 2016. Bank lending fell 16.8%, from ¥598.7 trillion at the end of 1998 to ¥498.1 trillion in Q3 2004, and bad loans at all banks reached ¥43.2 trillion at the end of March 2002.
Growth from 4% to 0%, and seven straight years of falling prices
The 10-year average of real growth from World Bank data was 4.33% in the 1980s, 1.43% in the 1990s, 0.49% in the 2000s and 1.31% in the 2010s. Even more striking is nominal GDP, before adjusting for inflation. It was ¥554.1 trillion in 1997, fell to ¥499.4 trillion in 2009 and was still ¥514.6 trillion in 2013: the economy did not get any bigger for 16 years. Flat nominal GDP means the sum of corporate sales and the sum of household incomes stayed flat, and debt had to be repaid out of that, so deleveraging took even longer.
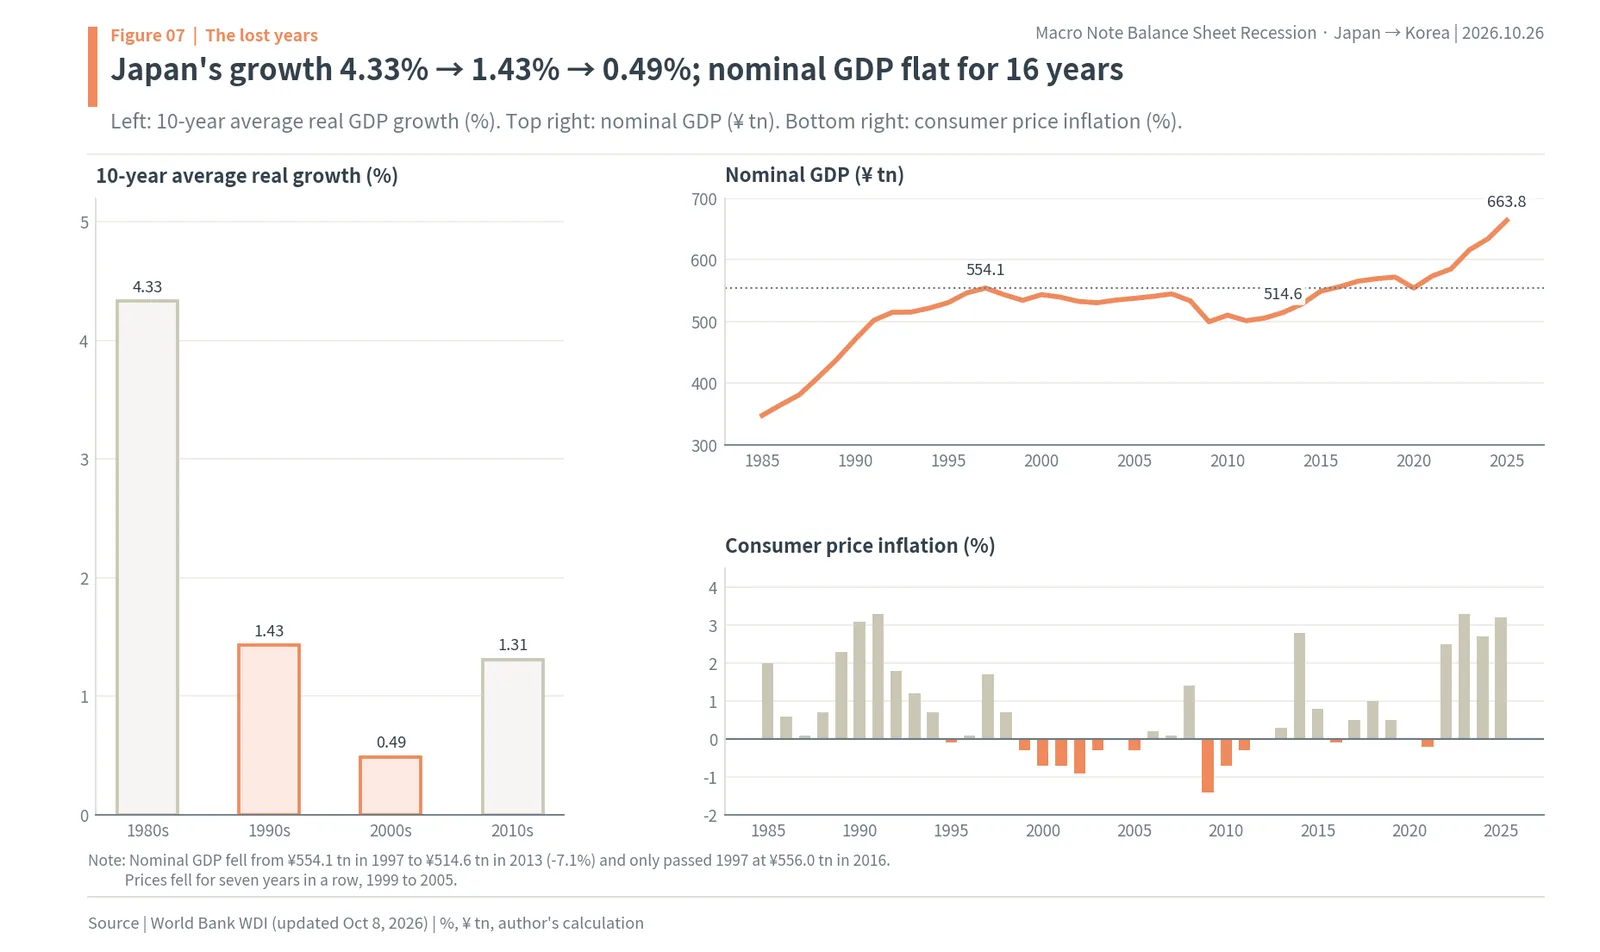
Prices sank as well. Japanese consumer prices were lower than a year earlier in 1995, in 1999 to 2005 (seven years in a row), in 2009 to 2012, and in 2016, 2020 and 2021. Falling prices make the real burden of debt heavier: the debt is fixed in yen, so when prices and wages fall, it takes more work to repay the same debt. Debt repayment cut spending, lower spending pushed prices down, and falling prices made debt heavier. That loop held Japan through the 1990s and the early 2000s.
Borrowers and lenders froze together
Banks lost their borrowers, and the loans they had already made went bad. Hokkaido Takushoku Bank, known as Takugin, failed in November 1997, and in the same month Yamaichi Securities decided to close. The Long-Term Credit Bank of Japan was nationalized in October 1998 and Nippon Credit Bank in December. According to Japan’s Financial Services Agency, bad loans at all banks were ¥33.9 trillion at the end of March 1999 and ¥33.6 trillion at the end of March 2001, rising to ¥43.2 trillion at the end of March 2002.
Bank lending to Japan’s private non-financial sector, as measured by the BIS, peaked at ¥598.7 trillion in Q4 1998 and fell 16.8% to ¥498.1 trillion by Q3 2004. This is why Koo wrote that a “balance sheet recession is always a two-front war, with both borrowers and lenders repairing balance sheets instead of maximizing profits.” Borrowing firms would not borrow because they were repaying, and lending banks could not lend because they were carrying bad loans.
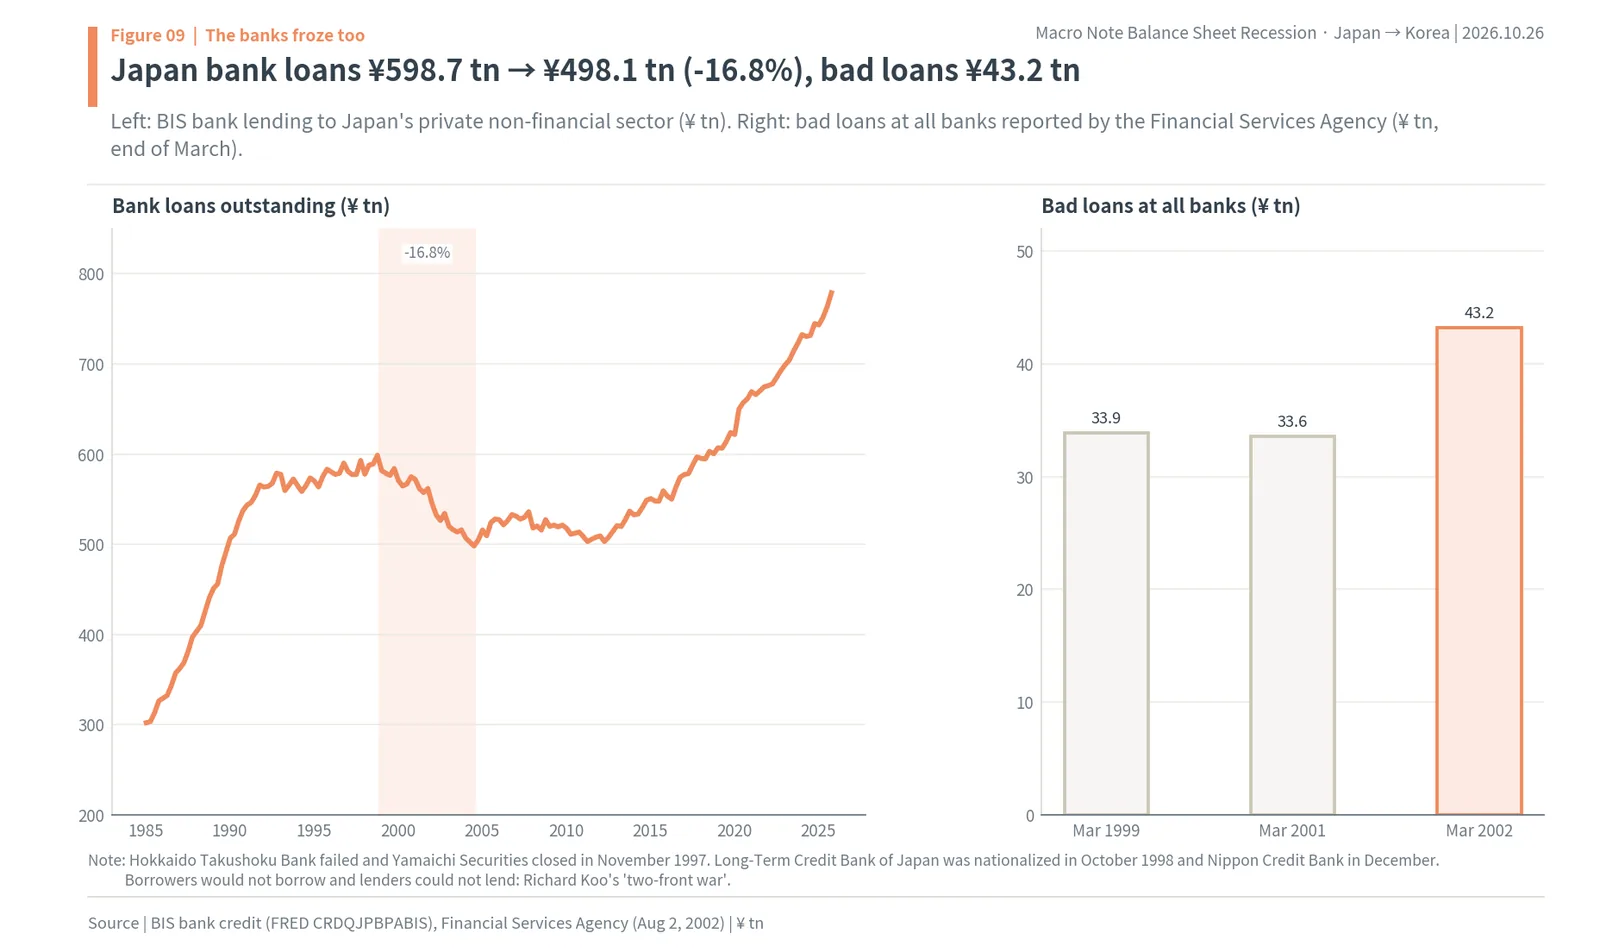
That same bank lending had grown back to ¥778.7 trillion by Q4 2025. Only now, after firms finished repaying and rates began to rise, has money begun to circulate again.
After 2008, the United States and Spain went through the same thing in households
The conclusion of this chapter is that balance sheet recessions are not only a corporate affair. After the 2008 financial crisis, when house prices collapsed in the United States and Spain, indebted households cut spending and repaid debt. U.S. household debt fell from 98.4% of GDP (Q1 2008) to 78.7% (Q4 2014), and Spain’s from 85.7% (Q2 2010) to 42.8% (Q4 2025). In Japan the main actors were firms; in these countries they were households.
A household balance sheet recession starts with a jump in the saving rate
Most American household assets were homes, and most of their debt was mortgages. When house prices fell, more households owed more than their homes were worth, and they cut consumption and repaid debt. The U.S. personal saving rate jumped from 2.6% in January 2008 to 7.8% in May 2009. Saving a few more percent of income means buying that much less in goods and services. U.K. household debt also fell from 97.6% of GDP in Q1 2010 to 73.6% in Q4 2025, while U.S. household debt went from 98.4% to 78.7% of GDP and Spain’s from 85.7% to 42.8%.
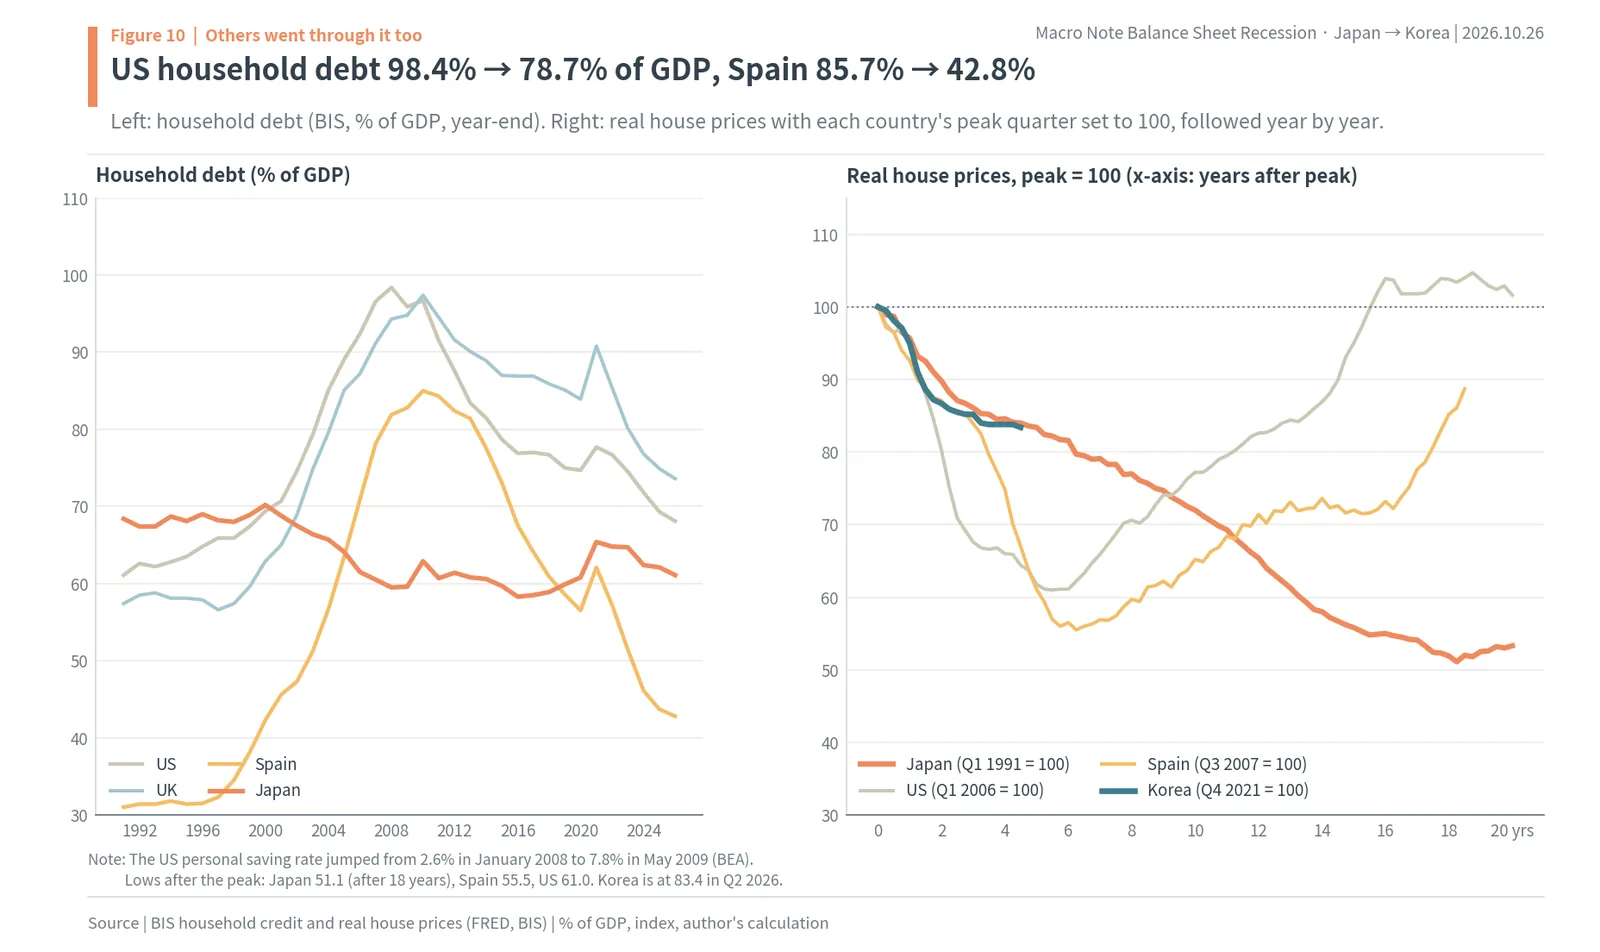
How far and how long house prices fell set the length of deleveraging. With each country’s peak quarter in BIS real house prices set to 100, the United States fell to 61.0 within five and a half years of its Q1 2006 peak and then recovered, and Spain fell to 55.5 after its Q3 2007 peak. Japan slid for 18 years after its Q1 1991 peak and bottomed at 51.1. In the United States households started borrowing again once house prices bottomed, but in Japan asset prices slid for 18 years and deleveraging did not end.
Korea’s real house prices have sat at 83.4 for four and a half years after the 2021 peak
Put Korea on the same chart and, with its Q4 2021 peak at 100, Korea’s real house prices stood at 83.4 in Q2 2026. That is almost exactly where Japan was at the same point, four and a half years after its peak. The figure is a national average after inflation, so it mixes places that have risen again, such as Seoul apartments, with places that have kept falling, such as the provinces. Which way Korea moves from here is where it parts from, or follows, Japan’s road. The following chapters turn to Korea.
Why the United States got out faster than Japan
U.S. household debt kept falling after reaching 78.7% of GDP in Q4 2014 and was 68.1% in Q4 2025. Real house prices bottomed five and a half years after the Q1 2006 peak and were back at 101.6% of that peak in Q1 2026. Unlike Japan, where house prices slid for 18 years, the U.S. bottom came quickly, and once it came, deleveraging headed for its end. The length of a balance sheet recession is set by when asset prices bottom and how quickly debt is worked off. When the bottom comes early, repayment ends, and when repayment ends, rates and money start to work again.
Japan took a generation to get out: repayment ended, prices returned, rates rose
The conclusion of this chapter is that the exit from a balance sheet recession is the end of debt repayment. Japanese corporate debt fell from 144.9% of GDP in Q4 1993 to 91.9% in Q1 2016 and has since risen again to 113.9% in Q4 2025. Nominal GDP reached ¥663.8 trillion in 2025, well above 1997 (¥554.1 trillion), and consumer prices rose more than 2% for four years in a row from 2022 (3.2% in 2025). The Bank of Japan ended negative rates in March 2024 and raised its policy rate to 1.25% on September 18, 2026. Counting from 1990, when the bubble burst, the road took almost 35 years.
Firms that had repaid began to borrow again
Around 2016, when corporate debt bottomed, Japanese firms’ balance sheets had become healthy. Firms that had cut debt and built up cash no longer had a reason to make debt minimization their goal. Corporate debt then rose again to 113.9% of GDP in Q4 2025, and BIS bank lending grew from ¥498.1 trillion in Q3 2004 to ¥778.7 trillion in Q4 2025. The normal shape, firms borrowing and banks lending, came back. Even so, private firms still saved ¥21.0 trillion (3.2% of GDP) in fiscal 2025; the habit of saving more than they invest remains.
Prices and rates came back, and shares passed their peak after 34 years
Once repayment ended, prices moved. Japanese consumer price inflation was 2.5%, 3.3%, 2.7% and 3.2% in 2022 to 2025. The Bank of Japan raised its policy rate to 0% to 0.1% on March 19, 2024, ending negative rates, then to 0.25% in July 2024, 0.5% in January 2025, 0.75% in December 2025, 1.0% in June 2026 and 1.25% in September 2026. The 10-year Japanese government bond yield bottomed at -0.28% in August 2019 and was 3.05% in September 2026. Shares first passed the 1989 peak on February 22, 2024 and rose as high as 70,683.98 on October 6, 2026.
Japan’s lesson for Korea is about time. In an economy repaying debt, rate cuts and government spending prevented a collapse but did not shorten the time it took. The speed at which debt shrank was the speed of recovery. That is why a Bank of Korea Issue Note, drawing lessons from Japan, wrote that a real-estate-driven build-up of debt is best managed gradually and in advance, and that once the debt has gone bad it must be restructured quickly.
Korea’s debt is about as large as Japan’s at the top of its bubble, but it is held by households, not firms
The conclusion of this chapter is that Korea resembles Japan in the size of its debt but differs in who holds it. Korean household credit reached KRW 2,019.8 trillion (about $1.52 trillion) at the end of June 2026, passing KRW 2,000 trillion for the first time. On the BIS measure Korean household debt is 85.1% of GDP (Q1 2026), 9th of 43 countries and 16.7 percentage points above Japan in its bubble (68.4% at the end of 1990). Private debt, households plus firms, is 191.5% of GDP, close to Japan’s peak (213.6% in Q4 1993), but the household share of it is 44.4%, far larger than Japan’s 32.2%.
KRW 2,019.8 trillion of household debt, six-tenths of it tied to housing
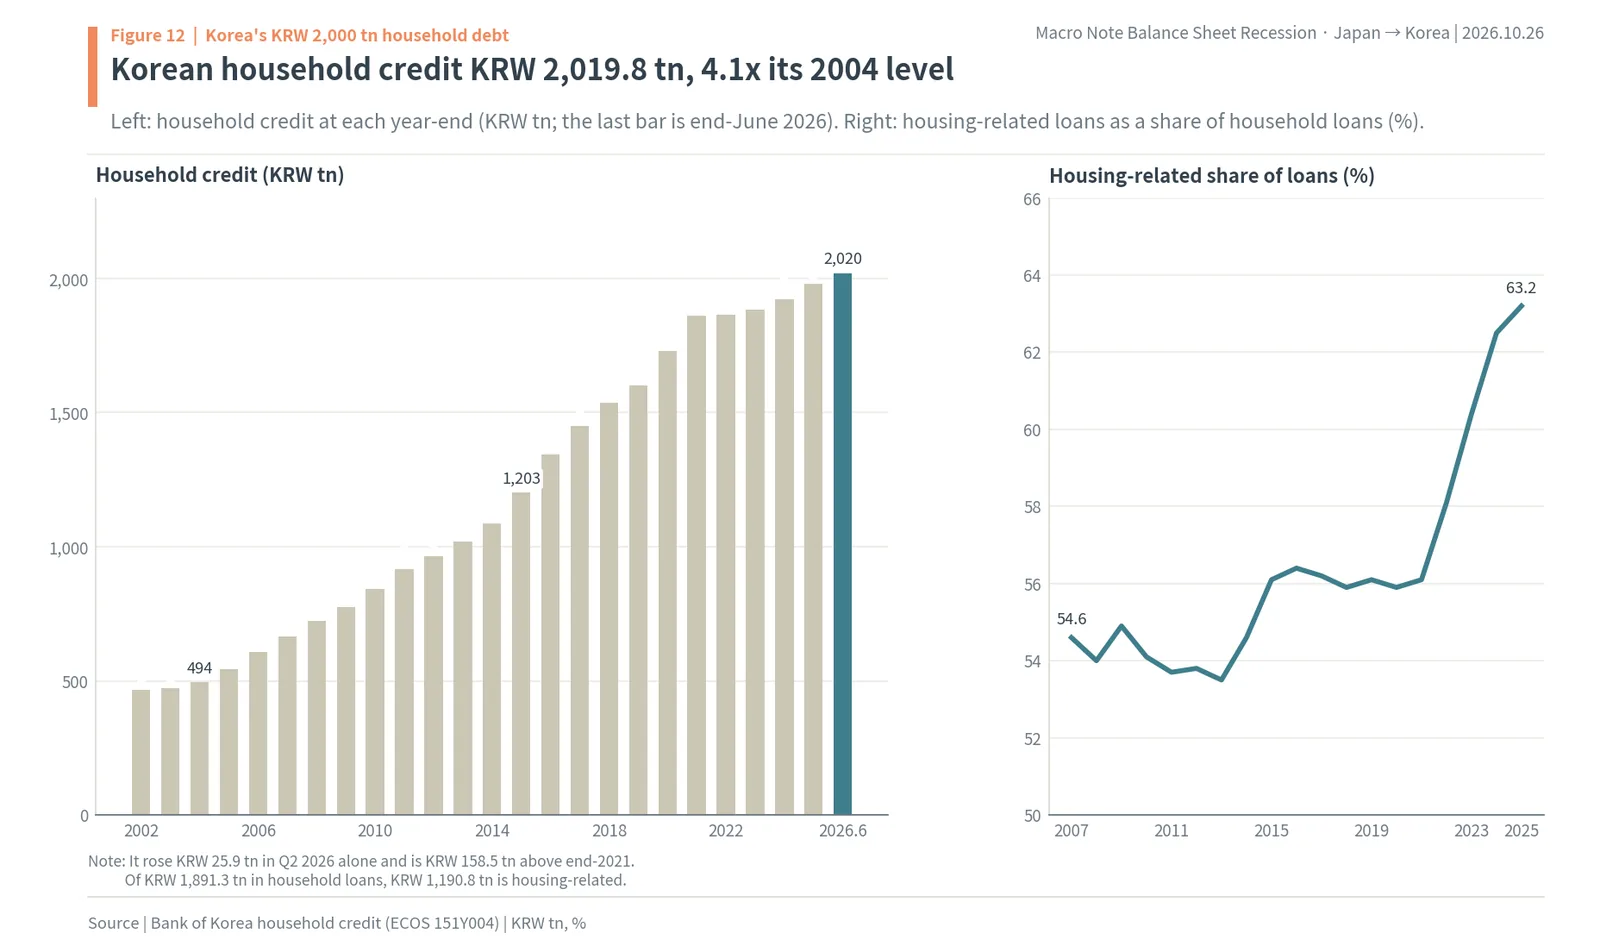
By the Bank of Korea’s household credit statistics, Korean household debt rose from KRW 494.2 trillion at the end of 2004 to KRW 1,203.1 trillion at the end of 2015 and KRW 1,861.3 trillion at the end of 2021, reaching KRW 2,019.8 trillion at the end of June 2026, 4.1 times its 2004 level. It grew by KRW 25.9 trillion (about $19.5 billion) in Q2 2026 alone and is KRW 158.5 trillion (about $119.5 billion) above the end of 2021. Of KRW 1,891.3 trillion in household loans, KRW 1,190.8 trillion (about $898 billion), or 63.0%, is housing-related. That share rose from 54.6% at the end of 2007 to 63.2% at the end of 2025. Most Korean household debt was taken on to buy an apartment or is secured on one.
9th of 43 countries relative to GDP, and the ratio is coming down from its 2021 peak
To allow for the size of the economy, debt has to be divided by GDP. In BIS data for Q1 2026, Korea’s household debt was 85.1% of GDP, 9th of 43 countries. Switzerland (127.0%), Australia (114.1%) and Canada (100.0%) are ahead, while the United Kingdom (72.6%), the United States (67.2%), Japan (60.8%) and China (57.5%) are below Korea. Korea was 6th at the end of 2025 and has slipped since. The ratio peaked at 99.1% in Q3 2021 and is 13.5 percentage points below the 98.6% of Q4 2021. Korea’s Financial Services Commission, the financial regulator, has set a goal of bringing it down to about 80% by 2030 (household debt management plan, April 1, 2026). Japan’s figure when its bubble burst was 68.4% at the end of 1990.
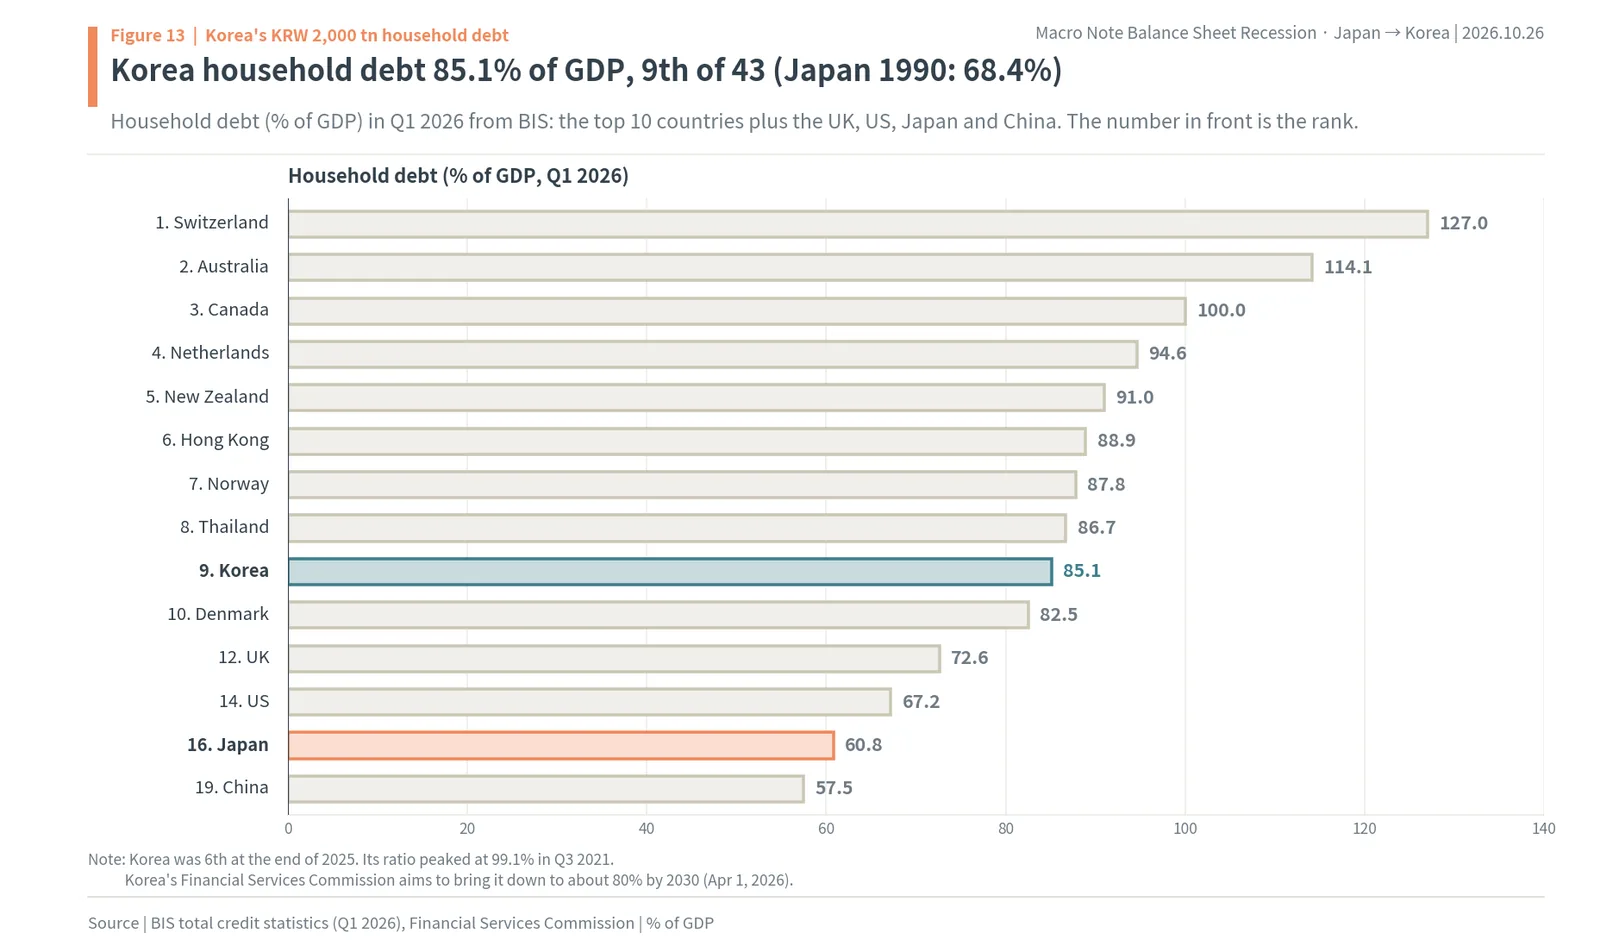
The falling ratio should not be read as falling debt. Over the same period the household debt balance rose by KRW 158.5 trillion. The ratio fell because GDP grew faster than debt. That is a different shape from the deleveraging in the United States and Spain, where debt was actually repaid; it is a shape in which households carry their debt and wait for income to catch up.
Japan’s debt was two-thirds corporate; Korea’s is almost half household
Japan’s bubble-era debt sat mainly with firms. Of Japan’s private debt of 213.6% of GDP in Q4 1993, firms held 144.9% and households 68.7%. Korea’s private debt is 191.5% of GDP in Q1 2026, with firms at 106.4% and households at 85.1%. Korean corporate debt is 38.5 percentage points below Japan’s peak, and household debt 16.7 points above Japan’s end-1990 level. The household share of private debt is 44.4% in Korea and 32.2% in Japan (author’s calculation). The Bank of Korea also noted in a June 2025 Issue Note that Korea’s private debt (207.4% of GDP in 2023 on the IMF measure) was approaching Japan’s bubble-era high (214.2% in 1994) and that it had come from real estate.
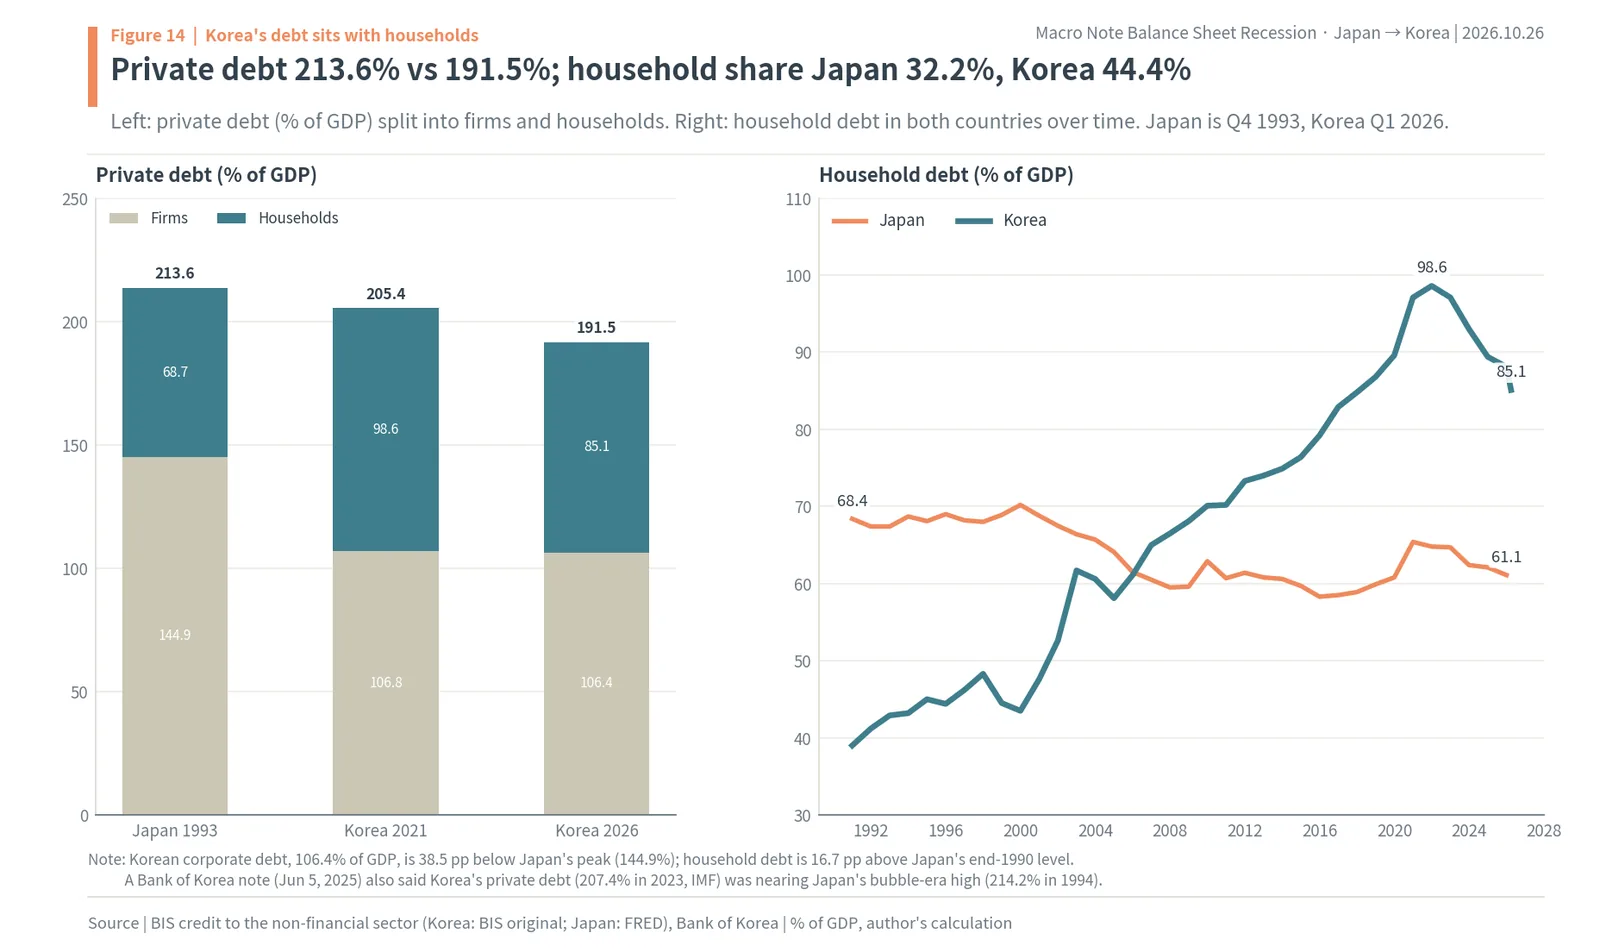
When the owner of the debt differs, the shape of the balance sheet recession differs too. In Japan firms stopped investing and factories and jobs froze. If the same thing happens in Korea, the main actors are households, and what households stop is consumption rather than investment. So a Korean balance sheet recession would show up first in supermarkets, restaurants and domestic services rather than factories. The consumption chapter below shows the evidence.
In 2026 debt grew more in “other loans” than in housing, and borrowers who struggle to repay began to rise again
The conclusion of this chapter is that this year’s growth in household debt looks different from before. Household credit grew by KRW 25.9 trillion in Q2 2026, the biggest rise since Q3 2021, and the Bank of Korea explained that it was the first time since Q2 2021 that other loans grew faster than housing-related loans (Herald Economy report, money for share purchases). At the end of June 2026 other loans stood at KRW 700.5 trillion (about $528 billion) and sales credit at KRW 128.5 trillion. Meanwhile the share of borrowers whose annual principal and interest exceed their income was 7.1% in Q2 2026, the first rise in 14 quarters (Bank of Korea material submitted to the National Assembly, as reported by Yonhap and Financial News).
Money borrowed to buy shares has a different trigger from house prices
Housing-related loans are secured on a home and have long maturities. Other loans, such as unsecured credit loans, have short maturities and higher rates and are mostly variable. A household that bought shares with such loans is, when share prices fall, in the same position as a household whose home has fallen in value: the debt stays and the asset bought with it is worth less. With the KOSPI down 20.0% from 6,838.0 at the end of September to 5,469.5 on October 26, this link could become a small balance sheet shock that moves faster than house prices. The delinquency rate on bank credit loans and similar was 0.91% at the end of August, nearly three times that on mortgages (0.31%).
Borrowers who struggle are concentrated at the lower end of incomes
The Bank of Korea’s Financial Stability Report (June 2026) put vulnerable borrowers at 6.7% of borrowers (Q1 2026) and 5.2% of loans, up from 6.4% and 4.9% in Q3 2025. These are borrowers who cut consumption or fall into arrears when repayments rise even a little. Even if the national debt service burden (BIS DSR 11.5%) looks low, when debt is concentrated at the bottom of the income ladder, the arteriosclerosis deepens there first. That is why self-employed loans of KRW 1,095.5 trillion (about $826 billion) and the 0.86% delinquency rate on sole proprietors’ loans need to be watched together.
Korean assets have not collapsed: Seoul has risen again and national real house prices have slid slowly
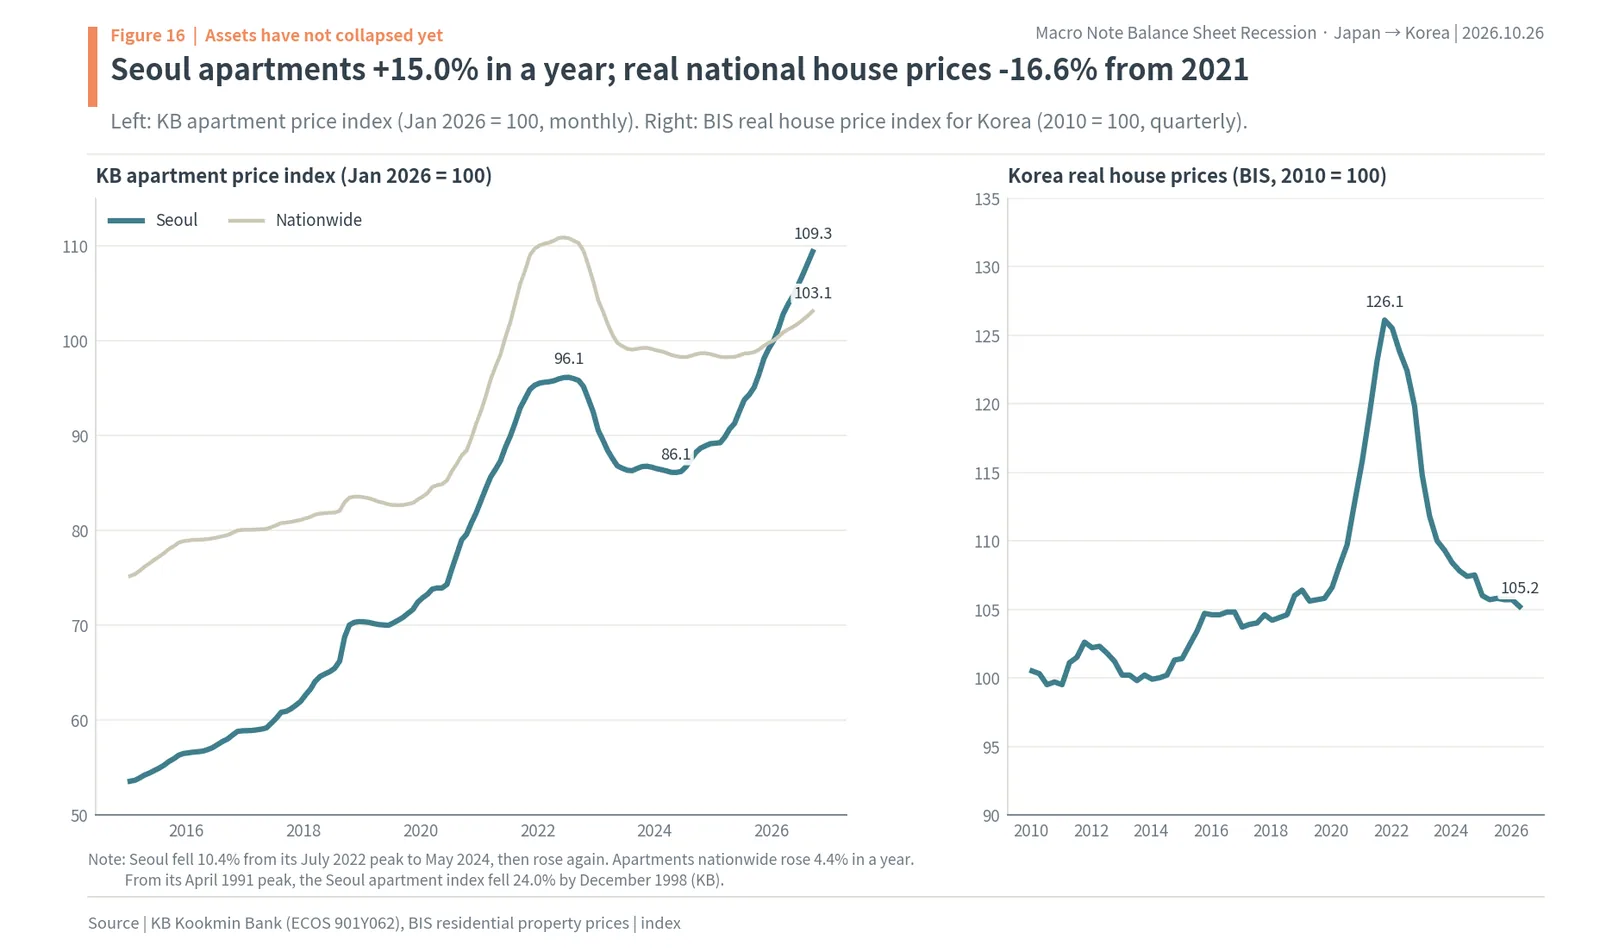
The conclusion of this chapter is that Korea has not yet had the first link of a balance sheet recession, an asset price collapse. The KB Seoul apartment price index rose 15.0% in the year to September 2026 and is 13.8% above its July 2022 peak. The BIS real house price index for Korea, after inflation, fell 16.6% from 126.1 in Q4 2021 to 105.2 in Q2 2026, but not in a Japan-style crash; nominal prices held up while general prices rose.
Seoul apartments have passed their old peak
The KB Seoul apartment index (January 2026 = 100), published by KB Kookmin Bank, peaked at 96.11 in July 2022. As rates rose quickly it fell 10.4% to 86.08 in May 2024, then rose again to 109.35 in September 2026, a 15.0% rise over a year. Apartments nationwide rose 4.4% over the same year. Seoul prices rose again despite the June 27, 2025 measures (mortgages in the Seoul region and regulated areas capped at KRW 600 million) and the October 15, 2025 measures (all of Seoul designated a land transaction permit zone, loan limits by home value, and a 3.0% floor on the stress rate).
Widen the view to the whole country and remove inflation, and the picture is different. BIS real house prices (2010 = 100) are 16.6% below 2021, at 105.2 in Q2 2026 against 126.1 in Q4 2021. Seoul’s nominal prices have passed their peak, but nationally and after inflation, prices have been lower for four and a half years. Korea has also had a big fall before: the KB Seoul apartment index fell 24.0% from its April 1991 peak to December 1998.
While house prices hold, there is little reason to repay debt
A balance sheet recession starts when assets are worth less than the debt. For households owning assets that are rising, like Seoul apartments, debt is still closer to the cost of buying an asset than a burden to be repaid. So Korean households chose to carry their debt rather than repay it, and debt grew. If house prices fall broadly, households whose loans exceed their home values appear, and from then on Korean households would act like Japanese firms or American households: cutting spending and repaying debt first. That is why house prices are the trigger for a Korean balance sheet recession.
The fact that Seoul and the provinces move separately also changes the chain. Prices have risen again in Seoul, so few Seoul homeowners have seen their net worth collapse. Households that borrowed against homes in the provinces where prices fell, and households without homes who carry credit loans and self-employed loans, are already on the side where net worth has shrunk. A Korean balance sheet recession is more likely to spread up from that lower end, step by step, than to hit the whole country at once.
Assets held up, but consumption is already slowly stiffening
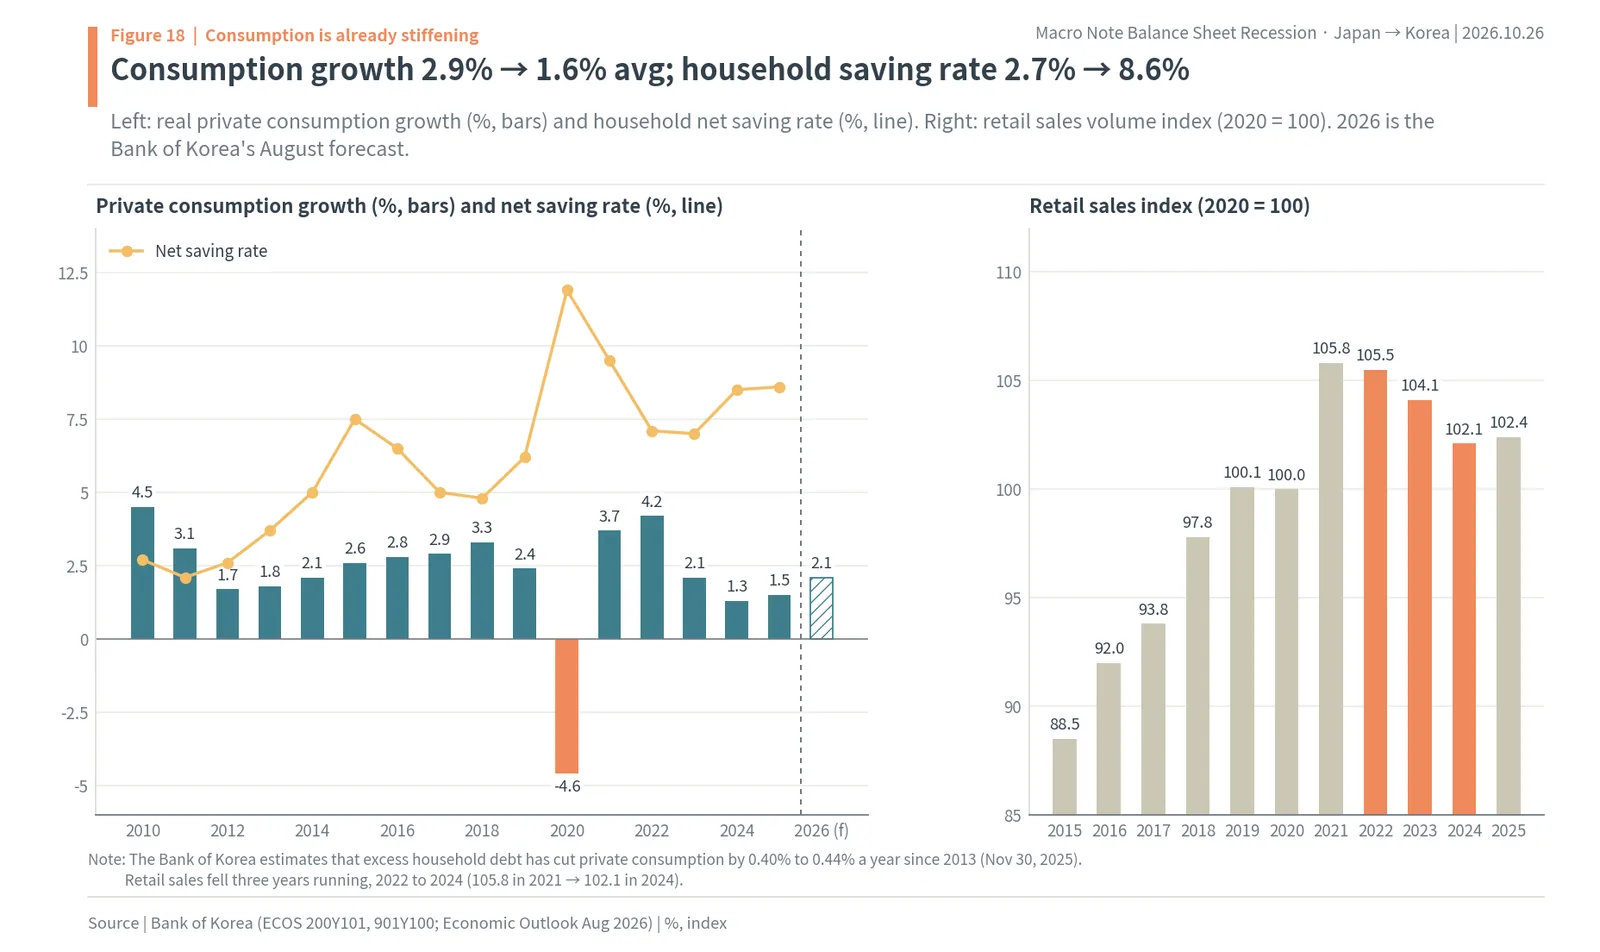
The conclusion of this chapter is that Korea is already living through some of the results of a balance sheet recession without an asset collapse. Real private consumption growth fell from an average of 2.9% in 2015 to 2018 to 1.6% in 2023 to 2025, and was 1.5% in 2025. The household net saving rate rose from 2.7% in 2010 to 8.6% in 2025. The Bank of Korea estimates that excessive household debt has slowed private consumption by 0.40% to 0.44% a year since 2013. Households carrying debt have been cutting their spending little by little.
Consumption growth halved, the saving rate tripled
By the Bank of Korea’s national accounts, real private consumption grew 2.6% in 2015, 2.8% in 2016, 2.9% in 2017 and 3.3% in 2018, and after the post-COVID rebound of 2021 and 2022 it slowed to 2.1% in 2023, 1.3% in 2024 and 1.5% in 2025. Over the same period the household net saving rate rose from 2.7% in 2010 to 11.9% in 2020 and was 8.6% in 2025. Households keeping a bigger share of what they earn means they are spending a smaller share, and much of what they keep goes on principal and interest. The Bank of Korea expects private consumption to grow 2.1% in 2026 (August 2026 forecast).
Goods sales went the same way. Statistics Korea’s retail sales index (constant prices, 2020 = 100) fell three years in a row, from 105.8 in 2021 to 105.5 in 2022, 104.1 in 2023 and 102.1 in 2024, before 102.4 in 2025. While the economy grew, the volume of goods households bought actually fell. Average consumption growth went from 2.9% to 1.6% while the saving rate went from 2.7% to 8.6%.
The Bank of Korea’s words: not a heart attack but arteriosclerosis
In a November 30, 2025 report, the Bank of Korea wrote that over the past ten years Korea’s household debt-to-GDP ratio had risen third-fastest in the world after China and Hong Kong (+13.8 percentage points), while private consumption as a share of GDP had actually fallen (-1.3 points). It also calculated that if household debt had stayed at its 2012 level, private consumption in 2024 would have been 4.9% to 5.4% higher. And it concluded that the household debt problem, “rather than triggering a sudden crisis like a heart attack, is slowly shrinking consumption like arteriosclerosis” (author’s translation).
That sentence sums up the present form of Korea’s balance sheet recession better than any other. In Japan, when asset prices collapsed, firms turned to debt repayment all at once and the economy froze sharply. In Korea, with asset prices holding, households are cutting consumption a little at a time by as much as their repayments, so the economy is stiffening slowly. Because the debt is carried rather than actually reduced, the stiffening lasts longer. Shin Hyun Song, who became Bank of Korea governor in April 2026, also said in his inaugural speech that Korea’s growth engines are weakening because of problems in the property market and household debt.
When consumption stiffens, domestic firms’ sales and jobs come next
Household consumption is someone else’s sales. When households cut dining out and shopping to make repayments, sales at supermarkets, department stores, restaurants and travel firms fall first. Domestic firms whose sales do not grow hire less and raise wages less, and when the incomes of the households working at those firms do not grow, debt takes longer to repay. In Japan the loop started from corporate investment; in Korea it starts from household consumption. Even if export earnings at chipmakers soar, as long as that money does not spread into domestic wages and jobs, the arteriosclerosis on the domestic side remains. That is Korea today, where growth and consumption move separately: real GDP grew 1.1% and private consumption 1.5% in 2025, and the Bank of Korea forecasts 3.3% growth for 2026 but only 2.1% for consumption.
Five reasons the same size of debt can take a different road
The conclusion of this chapter is that the differences between Korea and Japan in 1990 decide between a sharp freeze and arteriosclerosis. The owner of the debt (44.4% household in Korea versus 32.2% in Japan), the position of asset prices (Seoul +15.0% versus Japanese land -87%), the state of the banks (household delinquency 0.45%, capital ratio 15.83%), the direction of rates (rising) and demographics (65 and over at 20.3% versus 12.2%) push in different directions. The first three keep Korea from a Japan-style crash; the last two make the arteriosclerosis longer.
Who owes the debt, and asset prices, are preventing a crash
Japan’s debt was concentrated in firms, and when land collapsed firms halted investment and hiring at once. Korea’s debt is in households, and most household assets are homes: in the 2025 Survey of Household Finances and Living Conditions, 75.8% of Korean household assets were real assets. With Seoul prices back above their peak, most households do not yet have negative net worth, and households that still have net worth do not rush to repay. So Korea has seen nothing like Japan’s 1990s wave of debt repayment.
The banks differ too. Japanese banks went through a chain of failures and nationalizations in 1997 and 1998 as corporate loans went bad. The household loan delinquency rate at Korean banks was 0.45% at the end of August 2026, and the BIS total capital ratio of domestic banks was 15.83% at the end of 2025 (preliminary). When lenders are sound, one front of the two-front war stays closed.
Rates and demographics make the arteriosclerosis last longer
Japan was cutting rates after its bubble burst. Korea raised its base rate in July and August 2026 and then held it at 3.00%, and 64.7% of new mortgages are variable-rate. Money that could go to repayment goes to interest first, so deleveraging takes longer. As former governor Rhee Chang-yong said in April 2025, when household debt is high it is hard to raise rates, and cutting them sends money into property: a dilemma. Demographics weigh even more. Korea’s share of people aged 65 and over was 20.3% in 2025, far above Japan’s 12.2% in 1990, and its working-age population has been shrinking since 2018. The number of people earning the income to repay the debt is falling.
Regulation has capped the speed at which debt can grow
Korea has put regulations at the points where debt grows. The stress DSR was widened in three steps, in February 2024, September 2024 and July 1, 2025, and the June 27, 2025 measures capped mortgages in the Seoul region and regulated areas at KRW 600 million (about $452,000). The October 15 measures designated all of Seoul a land transaction permit zone and introduced loan limits by home value (KRW 600 million for homes worth KRW 1.5 billion or less, KRW 400 million for KRW 1.5 billion to 2.5 billion, and KRW 200 million above KRW 2.5 billion) and a 3.0% floor on the stress rate. On April 1, 2026 the Financial Services Commission decided not to allow maturity extensions on apartment loans to owners of several homes in the Seoul region and regulated areas. Its chairman, Lee Eog-weon, said then that excessive flows of money into the property market were hurting growth and vitality across the economy. Regulation stops debt from growing faster, but it does not shorten the time households spend carrying the debt they already have.
Just as rates began to rise, new mortgages swung to variable rates
The conclusion of this chapter is that the second link that could turn Korea’s slow stiffening into a sharp freeze is interest rates. The Bank of Korea’s base rate rose to 2.75% in July 2026 and 3.00% in August and was held on October 22. Yet the variable-rate share of new mortgages at deposit banks jumped from 13.4% in December 2025 to 64.7% in August 2026. Loans that take rate changes straight onto the borrower grew just as rates turned up. The debt service burden (DSR 11.5%) and delinquency (bank household 0.45%) are still low.
Two in three new loans are variable-rate
By Bank of Korea statistics, the variable-rate share of new mortgages at deposit banks was 10.6% at the end of 2023 and 13.4% in December 2025, little more than one in ten. In 2026 it climbed quickly, to 62.3% in June, 68.1% in July and 64.7% in August. For all new household loans, 76.5% were variable-rate in August. By outstanding balance, 57.3% of household loans and 38.3% of mortgages are variable-rate. Over the same period the average rate on new mortgages rose 0.34 percentage point, from 4.32% in May to 4.66% in August, while the base rate went up to 3.00%.
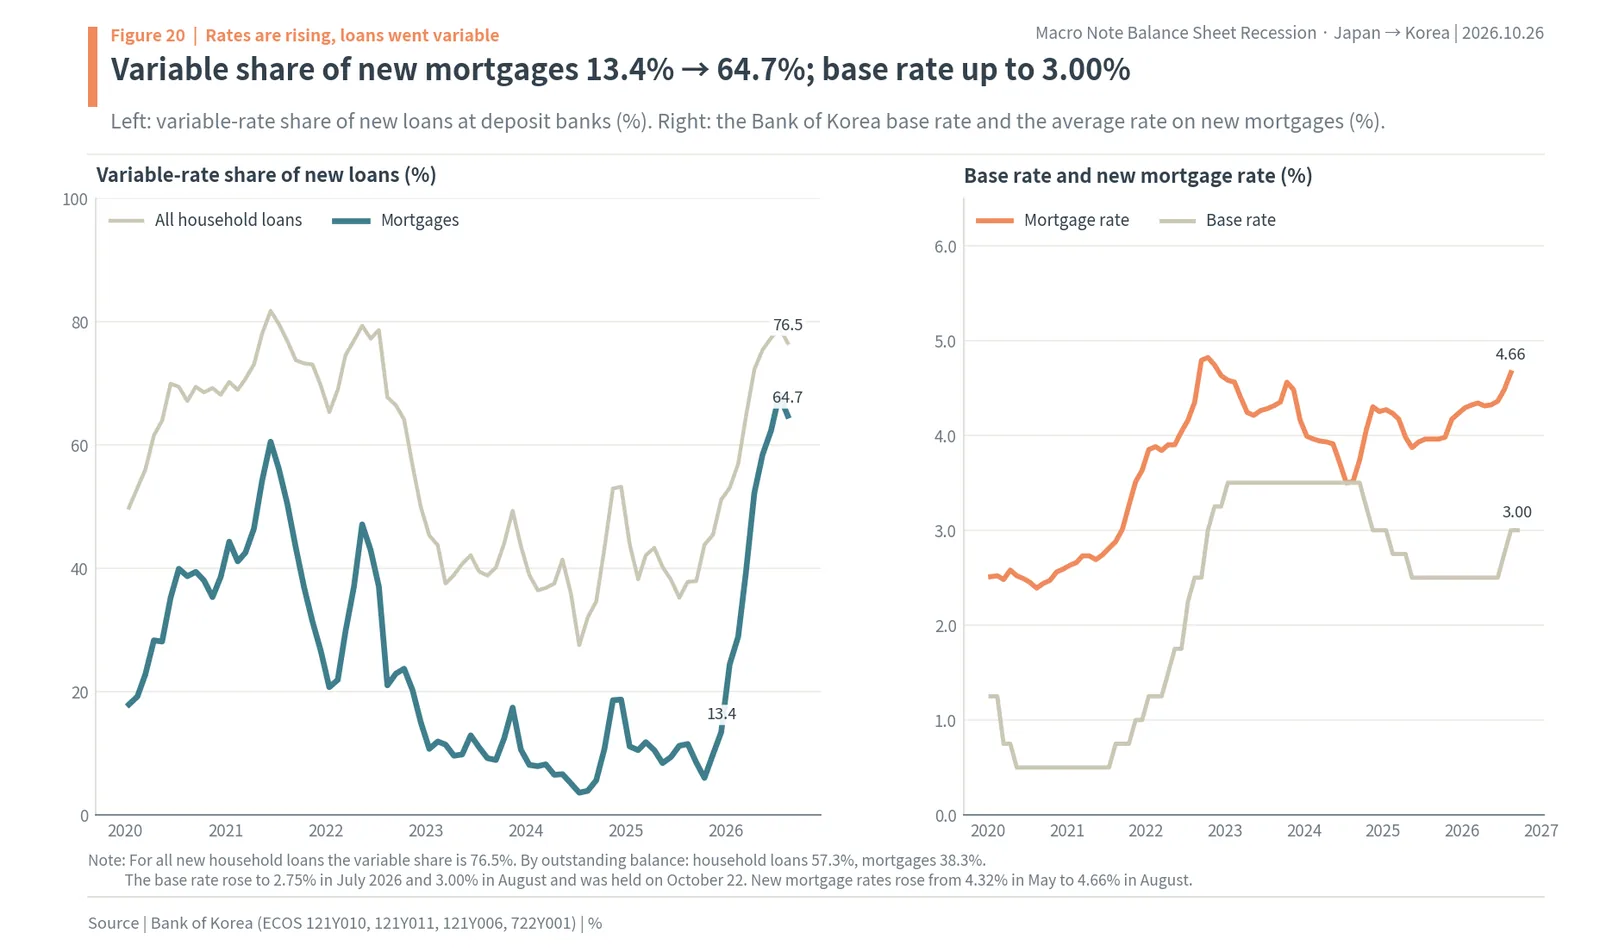
A big reason the variable-rate share moved like this is that fixed rates became higher than variable rates. In August the average new fixed-rate mortgage was 4.88% and the variable rate 4.53%. Borrowers chose what was cheaper right now, so if the base rate rises further, the burden will land on repayments at each rate reset every 6 to 12 months. Former governor Rhee said in an April 2025 dialogue that household debt was so large, and so much of it variable-rate, that raising rates caused too much pain.
Debt service and delinquency are still low
The BIS debt service ratio for Korean households (the share of income going on principal and interest) peaked at 12.3% in Q3 2024 and was 11.5% in Q1 2026, still reflecting the base rate cuts of 2025. According to the Financial Supervisory Service, the delinquency rate on household loans at domestic banks was 0.45% at the end of August 2026 (mortgages 0.31%, credit loans and others 0.91%), against 0.86% for sole proprietors, 1.10% for small and medium firms and 0.39% for large firms.
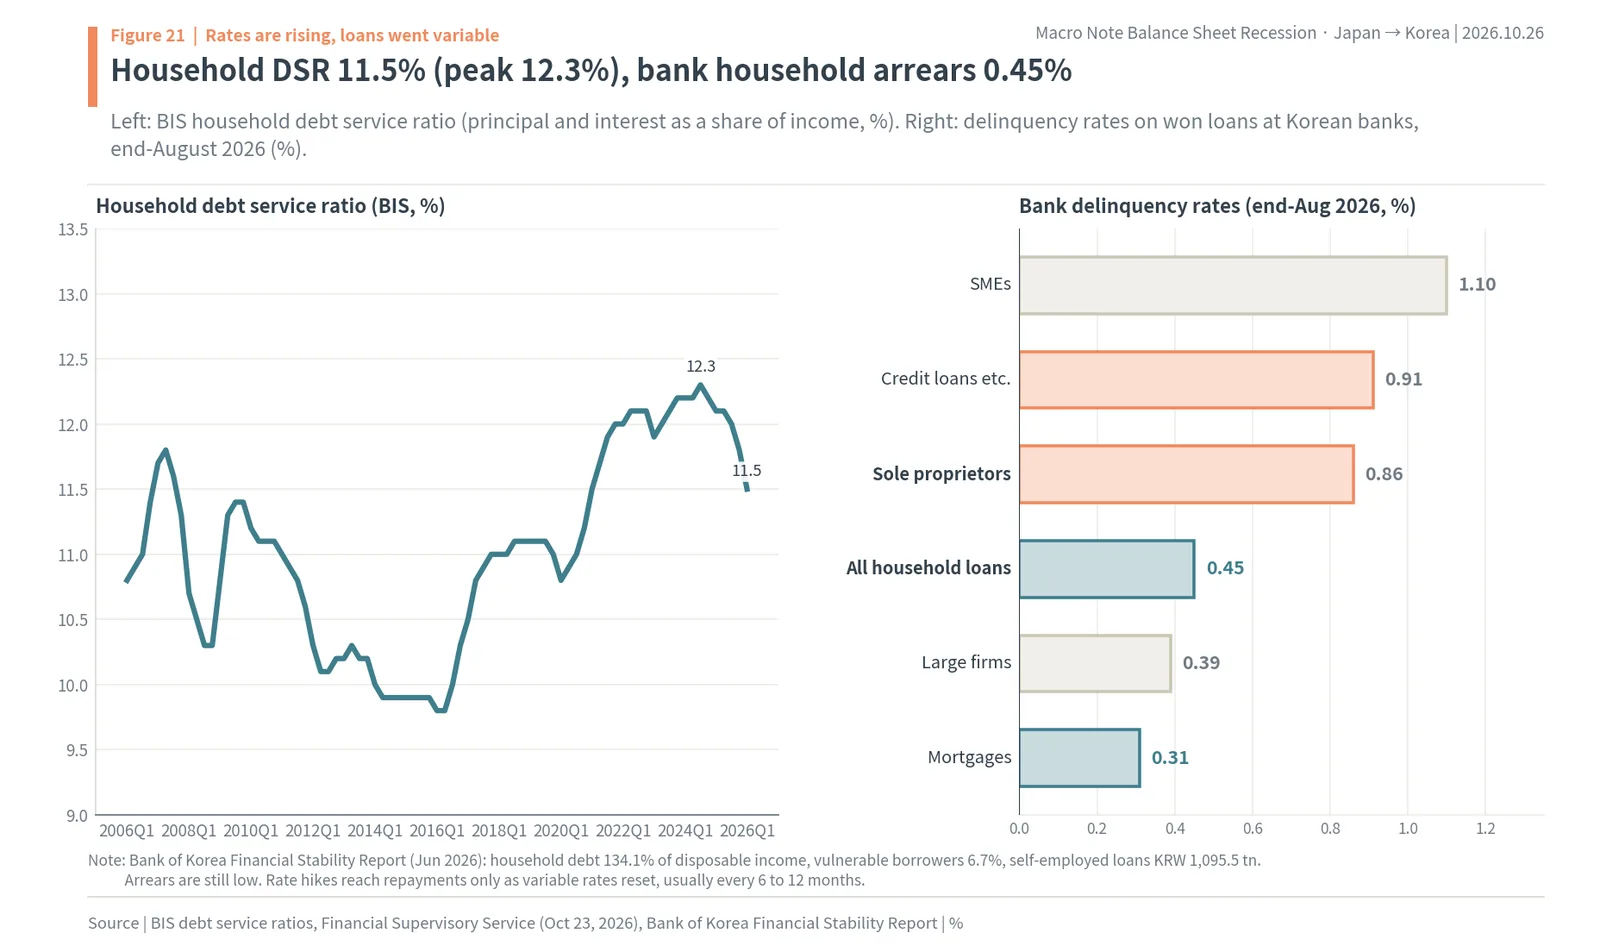
The Bank of Korea’s Financial Stability Report (June 2026) put household debt at 134.1% of disposable income (Q1 2026). Vulnerable borrowers are 6.7% of all borrowers, and self-employed loans total KRW 1,095.5 trillion. With delinquency low, this is the arteriosclerosis stage. When rate rises pass through to variable-rate repayments and house prices also turn down, higher repayments and lower net worth arrive together, and the economy tips toward a sharp freeze.
Korea is aging faster than Japan, so it has less time to repay
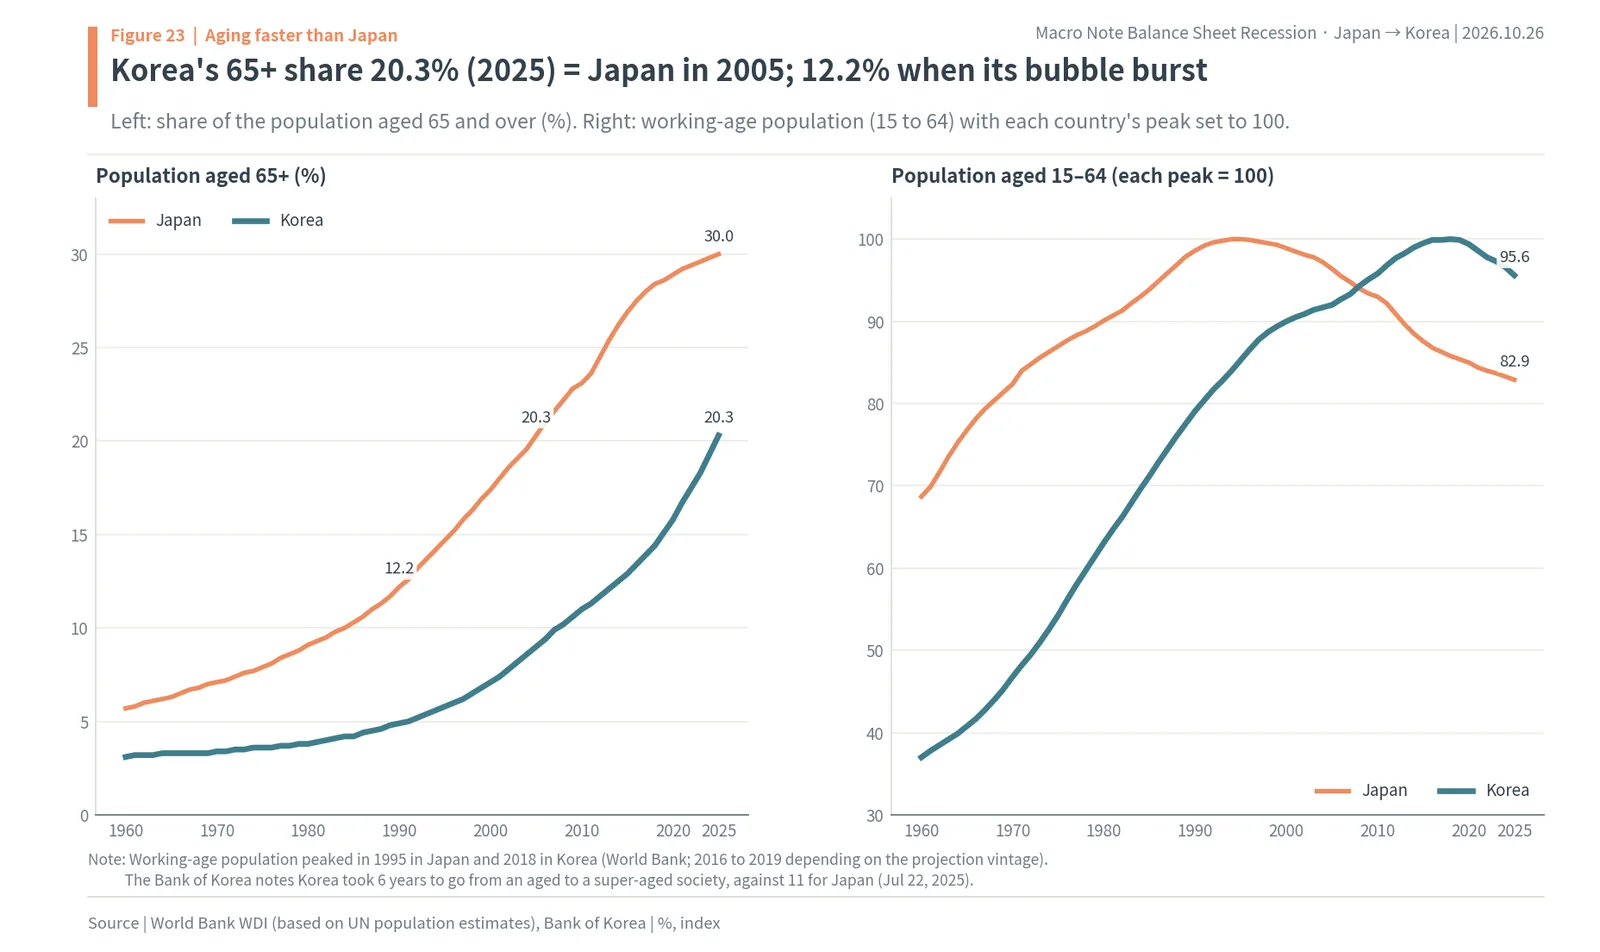
The conclusion of this chapter is that demographics set the speed of repayment. Korea’s share of people aged 65 and over was 20.3% in 2025, the level Japan reached in 2005. When Japan’s bubble burst in 1990 the share was 12.2%. Korea carries its household debt at a far older age than Japan did, and its working-age population, which earns the income to repay, has already started to shrink.
Working-age population peaked in 1995 in Japan and 2018 in Korea
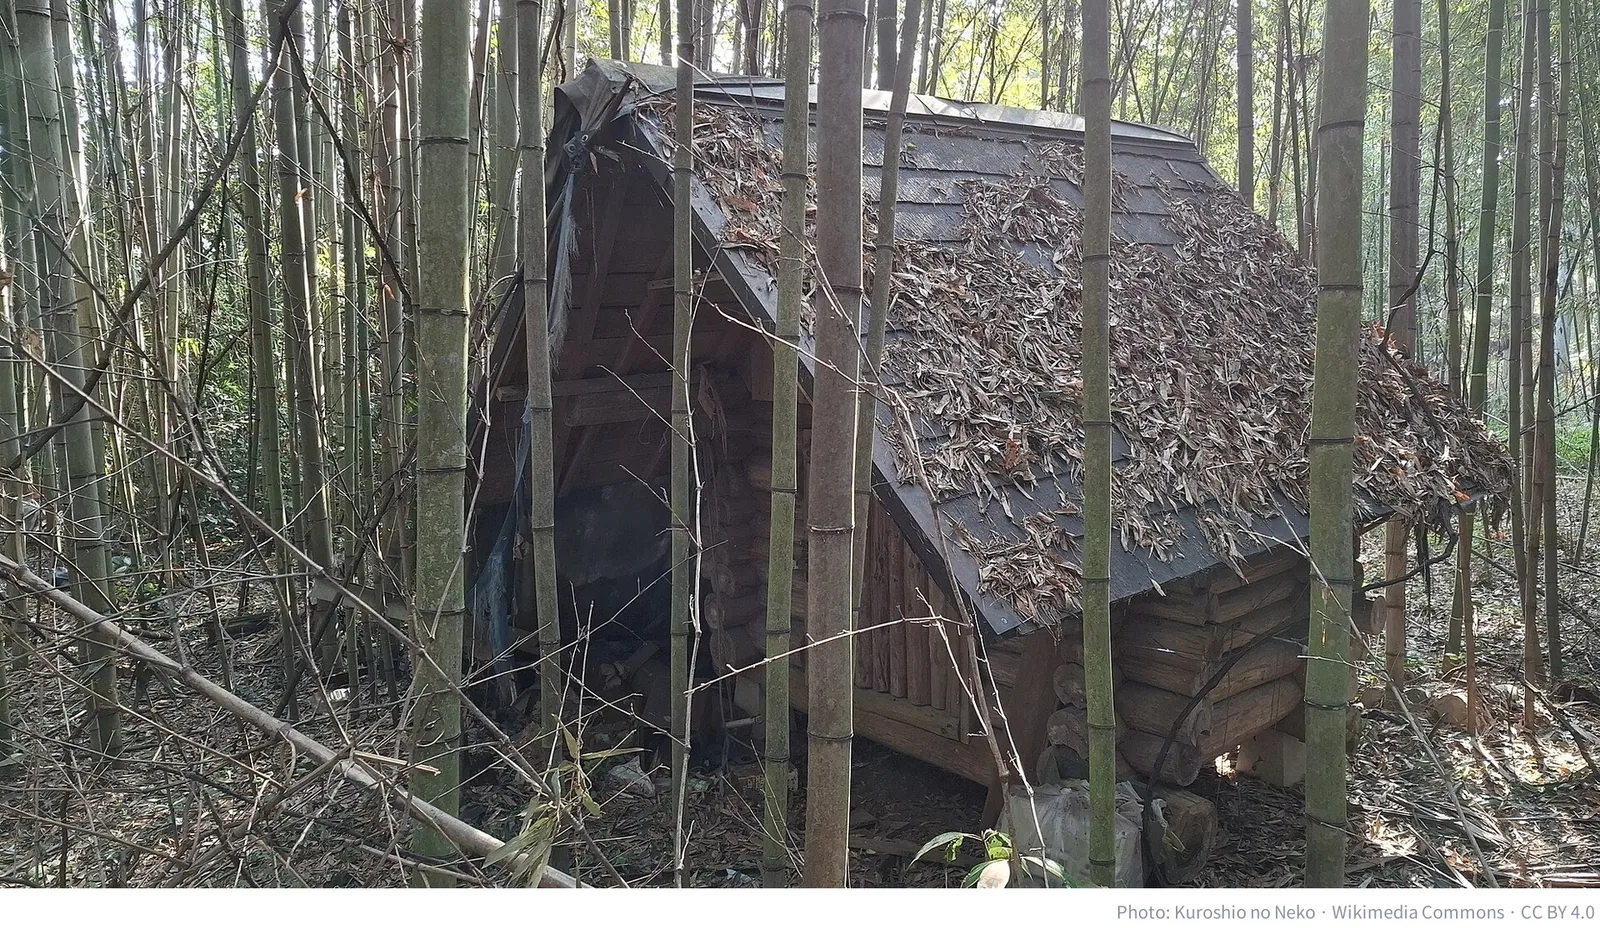
By World Bank data, the population aged 15 to 64 peaked in 1995 in Japan and 2018 in Korea (2016 to 2019 depending on the Statistics Korea projection vintage). With each country’s peak set to 100, Japan was at 82.9 in 2025 and Korea at 95.6. The spread of vacant homes, known in Japan as akiya, and the hollowing out of rural areas in Japan reflect, in part, fewer people left to hold up land prices. In a July 2025 explainer video, the Bank of Korea noted that Japan took 11 years to go from an aged to a super-aged society, while Korea took only 6.
Aging weighs on a balance sheet recession in two ways. Retired households have less income, so their capacity to repay weakens, and as more households must sell assets to pay living costs, sellers of homes outnumber buyers. Given that 75.8% of Korean household assets are real assets such as homes, the point at which older households start selling could become a trigger for house prices. Korea’s 65+ share of 20.3% in 2025 equals Japan’s in 2005, against 12.2% when Japan’s bubble burst. That is also why the Bank of Korea Issue Note cited a triple wave of real-estate-driven debt build-up, population aging and global horizontal specialization as Japan’s lessons.
Demographics also change the yardstick for debt. Household debt divided by GDP falls on its own when the economy grows, but when the working-age population shrinks, the pace of GDP growth itself slows. Japan’s working-age population began falling in 1995, and from around then its nominal GDP stood still for 16 years. Korea’s current approach, lowering the debt ratio through income growth rather than repayment, rests on the assumption that growth continues. As the number of workers falls, that assumption weakens, and the day when debt must actually be repaid comes sooner.
What it means for Korean stocks and your account: sectors that rely on indebted households’ wallets have already been priced down
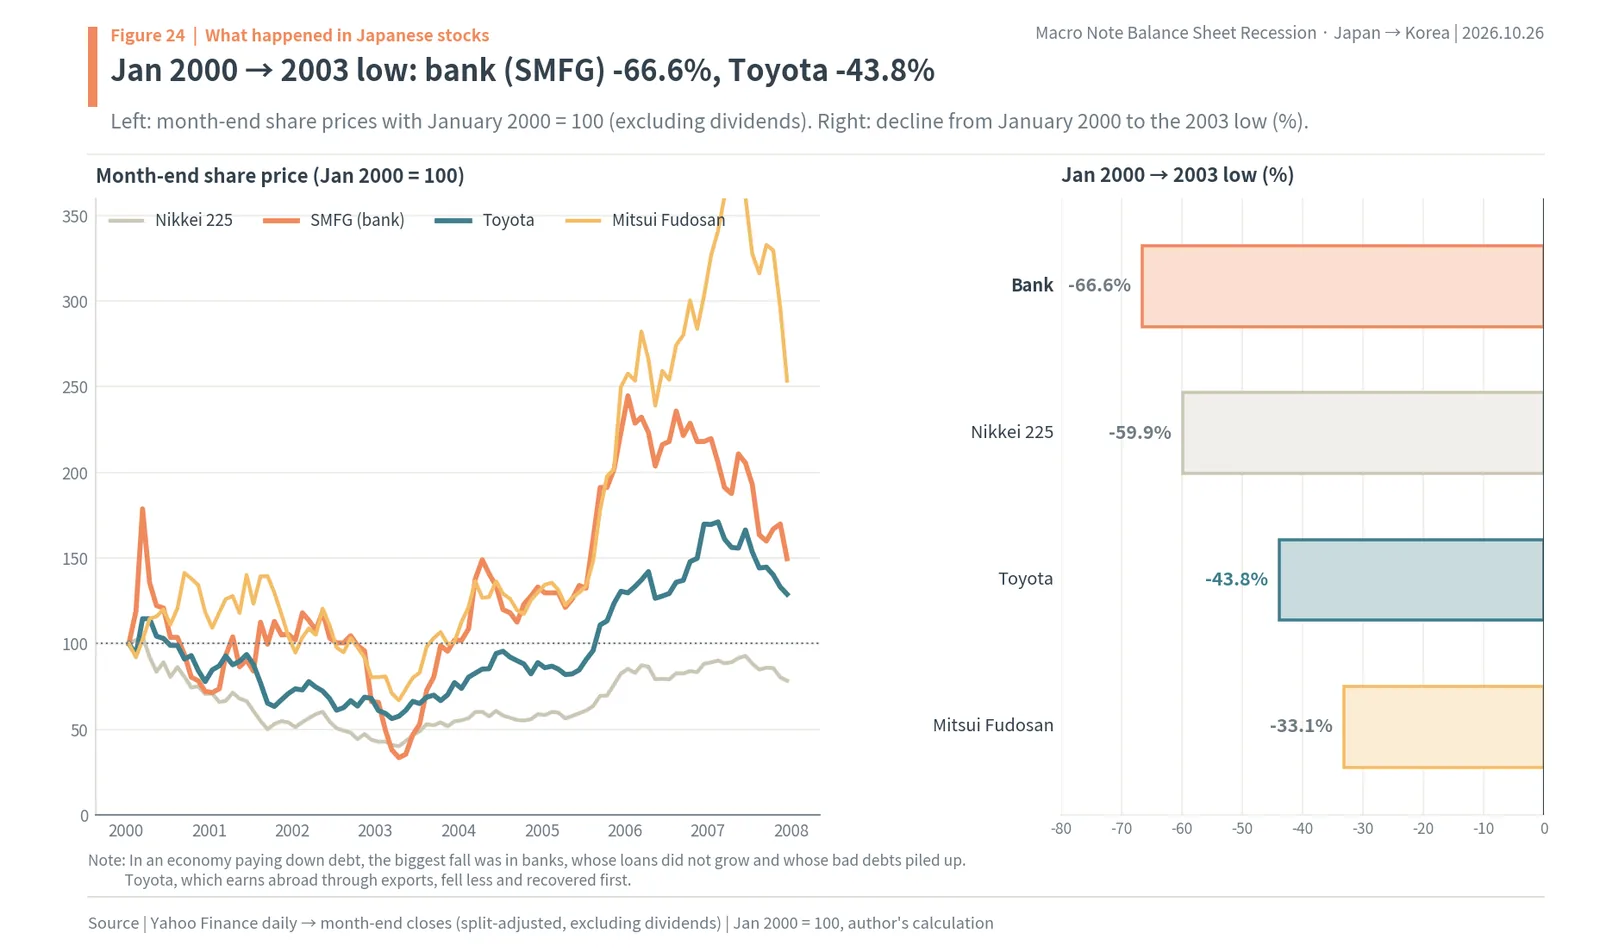
The conclusion of this chapter is that in a balance sheet recession, share prices split by who is in debt and who earns money abroad. In Japan, from January 2000 to the 2003 low, the bank stock (Sumitomo Mitsui Financial Group) fell 66.6% and the Nikkei 225 59.9%, while Toyota, which earns from exports, fell less, 43.8%, and recovered first. In Korea, from January 2015 to October 26, 2026, E-Mart fell 68.0% and Lotte Shopping 65.7%, both reliant on household consumption, while KB Financial rose 300.0% and Samsung Electronics 680.2%.
Japan: banks fell hardest, exporters recovered first
In the Japanese market the sector that bore the most weight of an economy repaying debt was banks. Bank shares, whose lending did not grow and whose bad loans piled up, fell 66.6% from January 2000 to the 2003 low (SMFG, excluding dividends). Over the same period the Nikkei 225 fell 59.9%, Mitsui Fudosan 33.1% and Toyota 43.8%. By early 2007 Toyota was 71% above January 2000 and had recovered well before the bank. When money did not circulate at home, the companies that earned money abroad held up.
Korea: big-box retailers down to a third, banks and chips up
In Korea, the two big-box retailers that rely directly on household consumption returned -68.0% (E-Mart) and -65.7% (Lotte Shopping) from January 2015 to October 26, 2026. The arteriosclerosis of households carrying debt and cutting consumption is already in their prices. Builders were mixed: Hyundai E&C +107.8% and GS E&C +12.4%, with GS E&C 37.1% below May 2021. Chipmakers, which earn abroad, pulled the KOSPI (+180.6%) up: SK Hynix +2,575.8% and Samsung Electronics +680.2%. Over the same period KB Financial returned +300.0%.
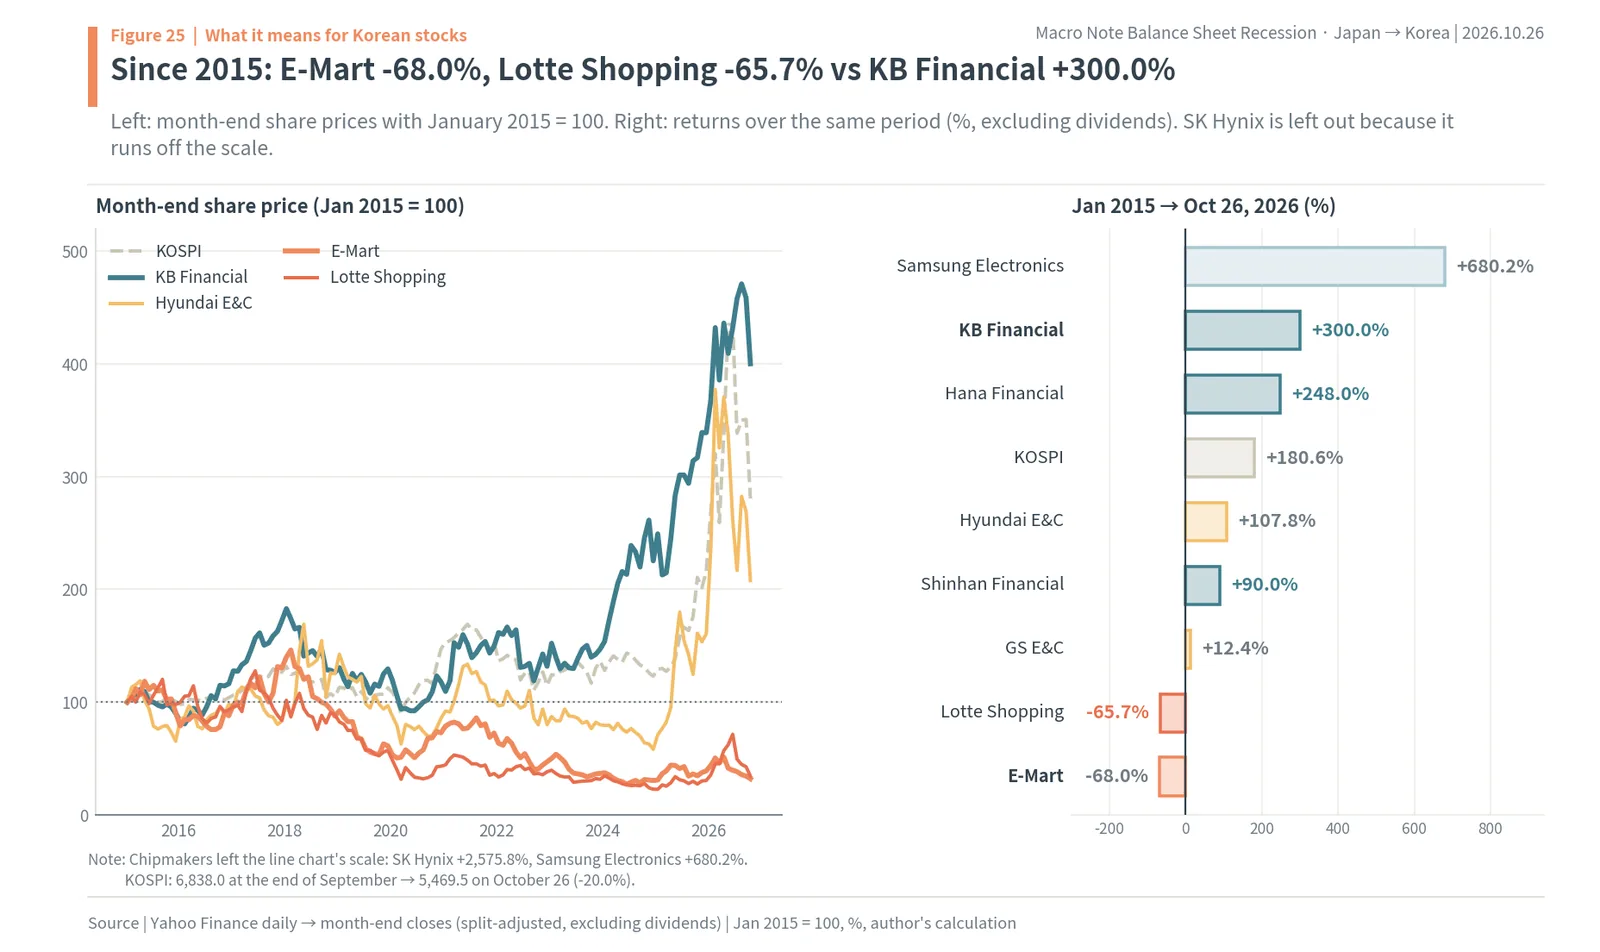
The sharpest difference from Japan is banks: KB Financial +300.0%, Hana Financial +248.0% and Shinhan Financial +90.0%. Japanese banks collapsed when corporate loans went bad, while Korean banks’ household loans have low delinquency (0.45% for bank household loans), are mostly mortgages, and sit on high capital ratios (domestic banks’ BIS total capital ratio 15.83%, end-2025 preliminary). Rising rates widening interest margins also supported bank shares. This link turns the other way the moment house prices fall broadly and delinquency rises.
The order of checks for your account
First, sort sectors by whose wallet they rely on. Domestic household consumption (supermarkets, department stores, restaurants, domestic services), domestic house prices (builders, building materials, interiors) and household interest (banks, card companies) are directly exposed to a Korean balance sheet recession. Exporters such as chips, shipbuilding and defense are far from Korean household debt. Second, for domestically exposed sectors, first check whether house prices and the variable-rate indicators are moving the wrong way. Third, for banks, look at delinquency and credit costs before interest margins: Japanese banks fell because of bad loans, not because of rates. Fourth, with the KOSPI down 20.0% from 6,838.0 at the end of September to 5,469.5 on October 26, keep in mind that even when exporters are shaken, the domestic household debt link moves on its own.
The author’s view: Korea is not heading for a Japan-style crash; it is already in an “arteriosclerosis-type” squeeze
The conclusion of this chapter is the author’s judgment. The author believes Korea is not in a Japan-style balance sheet recession that collapses, but has already entered an arteriosclerosis-type one, in which households carry their debt and slowly cut consumption. The size of the debt (private debt at 191.5% of GDP) is similar to Japan at the top of its bubble, but because the debt is owed by households and asset prices have not collapsed, there has been no rush into repayment. Instead the results came first: consumption growth halved and the saving rate rose.
The chain, rewritten
Japan’s chain ran: asset price collapse → negative net worth → corporate debt repayment → rate cuts that do not work → government deficits → growth, prices and banks freezing together. Korea’s current chain runs: rising house prices → rising household debt → heavier debt service → slower consumption → weak domestic sectors. The two chains meet at house prices. If house prices fall broadly, Korean households’ net worth shrinks, and then they will act like Japanese firms: cut spending and repay debt first. New loans swinging to variable rates just as rates are rising is the link that would amplify the shock at that moment.
Three roads and their conditions
The author sees Korean household debt taking one of three roads. The first is a continuation of today’s arteriosclerosis. While Seoul house prices hold and rates stay around 3%, households carry their debt and cut consumption by as much as their repayments. The debt balance grows slowly, the ratio to GDP falls slowly through income growth, and consumption growth stays in the mid-1% range. The author takes this as the base case.
The second is a sharp freeze. If house prices fall broadly, Seoul included, and rates rise further, households with shrinking net worth turn to repayment all at once. Consumption then falls sharply, and as in Japan, there comes a stretch in which households will not borrow even after rates are cut again. With today’s high variable-rate share, the shock on this road would be larger. The third is a thaw. If incomes grow faster than debt so that the household debt ratio falls below the government’s 80% target, and house prices move only in line with inflation, household spending picks up again. This road opens when profits at sectors that earn abroad, such as chips, spread into wages and jobs.
Eight indicators to watch
The author watches eight indicators. ① The one-year change in Seoul apartment prices (KB, +15.0% in September) is the trigger: while it rises there is little reason to repay, and when it turns broadly, repayment starts all at once. ② The variable-rate share of new mortgages (64.7% in August), ③ the base rate (3.00%) and ④ the new mortgage rate (4.66% in August) show how fast the debt service burden grows. ⑤ The household debt service ratio (BIS, 11.5%) and ⑥ the bank household delinquency rate (0.45%) show whether the burden is spilling into arrears; ⑦ household debt to GDP (85.1%, target 80%) shows whether deleveraging is happening through income growth; and ⑧ private consumption growth (1.5% in 2025, 2.1% forecast this year) shows whether the arteriosclerosis is easing or deepening. In the eight gauges, ② and ⑧ are in the warning zone and ①, ③ and ④ in the caution zone.
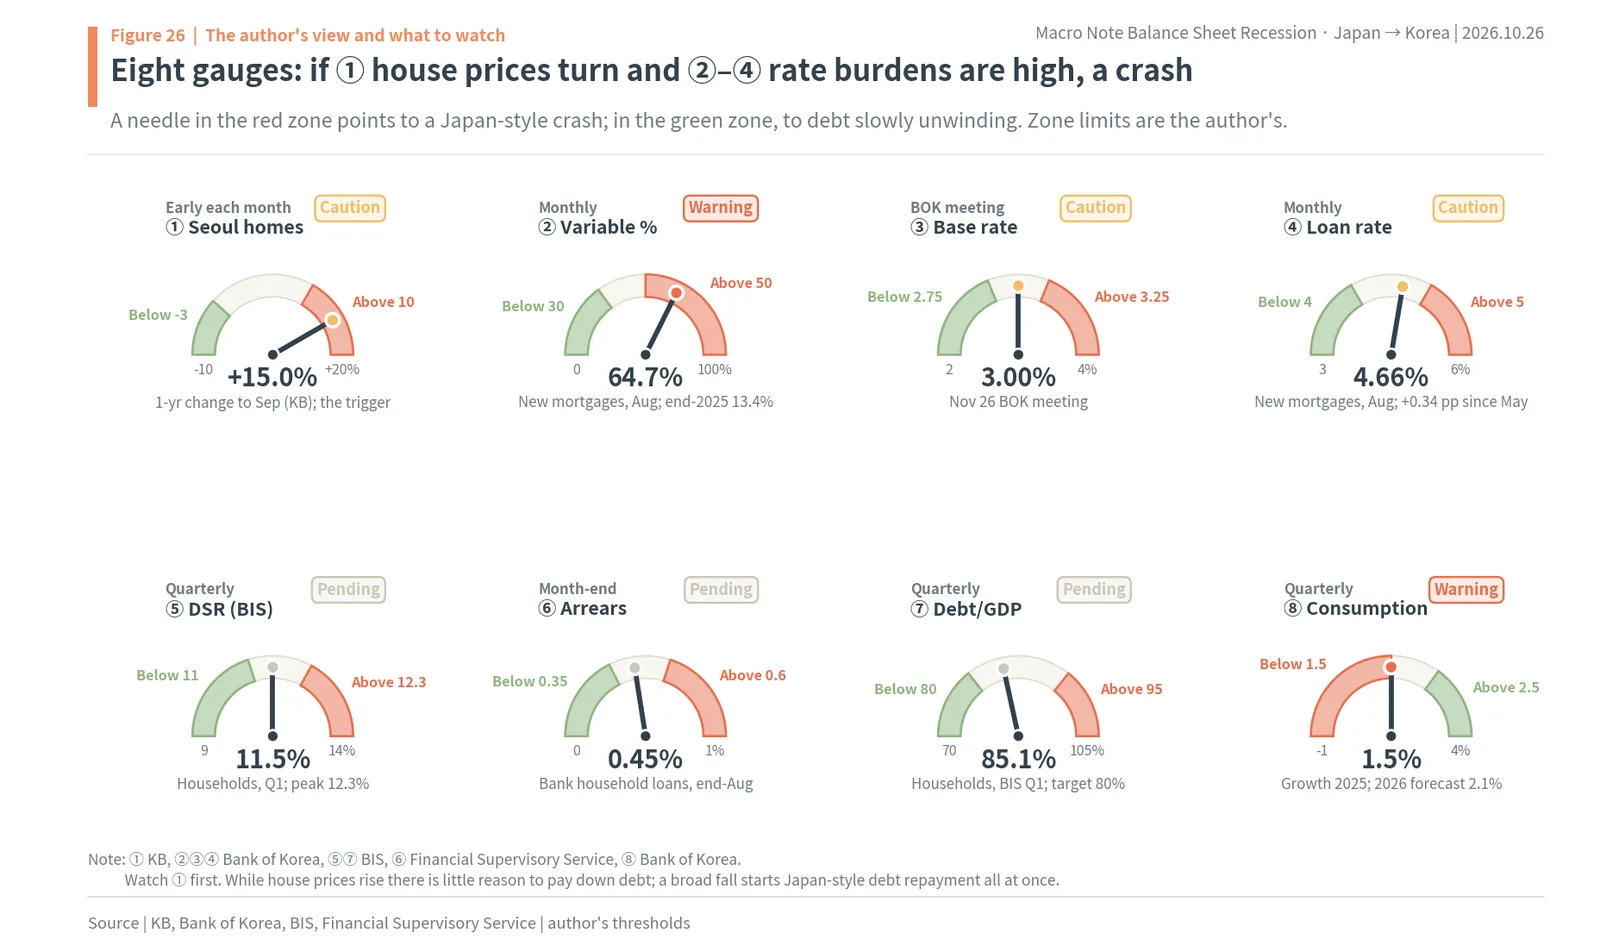
The dates to check are October 27, when Korea’s advance estimate of third-quarter GDP (including private consumption) comes out; November 26, the Bank of Korea’s Monetary Policy Board meeting and revised economic outlook; late November, when third-quarter household credit is released; the end of each month for the Financial Supervisory Service’s bank delinquency rates; and the start of each month for KB’s house price report. With rates and the variable-rate share rising together while house prices climb, the author reads the present as arteriosclerosis deepening, and if ① shows signs of turning, the author’s response is to cut exposure to sectors tied to Korean households first.
Frequently asked questions: six things that confuse people new to balance sheet recessions
This chapter restates the report as questions and answers. In one line: while debts are being repaid, money does not circulate. The questions below are the ones that come up most when applying that chain to Korea and to your own account.
Paying down debt is good. Why does it cause a recession?
When one household repays debt, that is good. The problem is when everyone repays at the same time. One person’s spending is another’s income, so when everyone cuts spending to repay, total income in the economy falls, and when income falls, repayment takes longer. Japan’s nominal GDP not growing for 16 years while firms saved every year from fiscal 1998 is what that looks like.
Wouldn’t cutting rates fix it?
Rates work when there are borrowers. Firms or households with negative net worth will not borrow even at zero. Japan cut its discount rate from 6.0% to 0.5% and pushed the call rate effectively to zero in 1999, yet corporate debt kept falling. When Koo said that no textbook recommends repaying debt at zero rates, he meant the situation lay outside the textbook.
Korea’s household debt ratio has come down. Isn’t deleveraging over?
The ratio is 85.1% of GDP, 13.5 percentage points below its 2021 peak, but the balance is KRW 2,019.8 trillion, KRW 158.5 trillion more than at the end of 2021. The ratio fell not because debt shrank but because GDP grew faster than debt. While households carry the debt, repayments keep going out, and the arteriosclerosis of consumption shrinking by that much continues.
Will Korean bank stocks go the way of Japanese banks?
Japanese banks collapsed because corporate loans went bad on a huge scale. Korean banks’ household loans are mainly mortgages, with a low 0.45% delinquency rate and high capital ratios. The path of bank shares will be set by house prices and delinquency. Until a broad fall in house prices and rising delinquency are confirmed, the author does not see them on the same road as Japan’s banks.
What should I check first in my own account?
Separate sectors that rely on Korean household wallets (supermarkets, department stores, restaurants, builders, interiors) from those that earn abroad (chips, shipbuilding, defense). For the domestic ones, watch Seoul apartment prices, the variable-rate share of new loans, the base rate and delinquency first. If the indicators move toward a sharp freeze, cut domestically exposed sectors first.
Will Korea also take decades, like Japan?
The length depends on how long asset prices keep sliding. Japan’s real house prices fell for 18 years and its shares took 34 years to pass their old peak. The U.S. house price bottom came within five and a half years. Korea’s real house prices have been near 83.4 for four and a half years since the 2021 peak, and Seoul’s nominal prices have risen again. For Korea to take a road as long as Japan’s, house prices would have to fall broadly and for a long time. Without that signal, Korea’s question is not how long it will collapse, but how long it will stay stiff.
Basis of calculation and data
This chapter explains where the numbers in this report come from and how they were calculated. All of the author’s calculations were done in one calculation script, and the charts and text use only its results. All raw data were downloaded on October 26, 2026.
Japan’s sector financial balances are the private non-financial corporations, general government and household series of the Bank of Japan flow of funds (2008 SNA, fiscal years, ¥ trillion). Ratios to GDP divide fiscal-year values by World Bank calendar-year nominal GDP, an approximation that may differ slightly from official ratios. For fiscal 1998 the series for all non-financial corporations, including public corporations, jumps because of an accounting treatment, so the private series was used. The swing in corporate spending (15.6% of GDP) is the difference between the fiscal 1991 ratio (-8.2%) and the fiscal 2003 ratio (+7.4%).
Sector debt (% of GDP) uses BIS total credit statistics (market value, quarterly). For Japan these are the BIS series carried on FRED (QJPHAM770A, QJPNAM770A, QJPPAM770A); for Korea the original series from the BIS website (to Q1 2026). The Korean series on FRED is an older vintage, so its Q4 2025 value differs slightly. Korean private debt is households plus non-financial corporations, and the household share is households divided by that total. The country ranking covers 43 countries in BIS Q1 2026 data, excluding aggregates.
House prices are BIS real residential property price indices (2010 = 100) and the KB apartment price index (Bank of Korea ECOS, January 2026 = 100). The after-the-peak comparison sets each country’s peak quarter in real house prices (Japan Q1 1991, U.S. Q1 2006, Spain Q3 2007, Korea Q4 2021) to 100 and divides the following quarters by it. Korean household credit is Bank of Korea ECOS 151Y004; variable-rate shares and loan rates are for new loans at deposit banks (121Y010, 121Y011, 121Y006); the base rate is 722Y001. Private consumption and the saving rate come from the national accounts (200Y101), and retail sales from the constant-price index (901Y100).
Japan’s growth, nominal GDP and prices are from the World Bank WDI (updated October 8, 2026), and ten-year averages are simple averages. Japanese interest rates are OECD and IMF series (FRED), public debt the older IMF WEO vintage (FRED GGGDTAJPA188N), bank lending BIS bank credit (¥ trillion), and bad loans the Financial Services Agency’s figures. Population is from the World Bank WDI, with working-age population indexed to each country’s peak. Share prices are Yahoo Finance daily closes grouped into month-end values (split-adjusted, excluding dividends), and returns are measured from the starting month’s close; October 2026 values are October 26 closes. The USD/KRW rate is KRW 1,326.45 per dollar on October 26, 2026.
Quotations come from the original texts of Richard Koo’s February 10, 2010 testimony to the U.S. House, Bank of Korea reports (June 5, 2025 Issue Note, November 30, 2025 key issue report, June 2026 Financial Stability Report, August 2026 Economic Outlook), the Financial Services Commission (April 1, 2026) and the Financial Supervisory Service (October 23, 2026). Koo’s words are quoted in his original English; translations from Korean are the author’s.
Maochaedung’s take. While debts are being repaid, money does not circulate. Japan’s firms, their land down 87%, switched from maximizing profits to minimizing debt, swinging their spending by 15.6% of GDP, and neither zero rates nor government borrowing could do more than buy time: nominal GDP stood still for 16 years. Korea’s private debt (191.5% of GDP) is close to Japan’s bubble peak, but nearly half of it sits with households and asset prices have not collapsed, so instead of a crash Korea has slower consumption and a higher saving rate. The author reads Korea as already in an arteriosclerosis-type balance sheet recession, and sees the trigger for a Japan-style freeze in a broad fall in house prices arriving while new loans are mostly variable-rate.
Balance sheet recession and Korea’s household debt: quick answers
Q. What is a balance sheet recession?
Richard Koo’s term for a downturn that starts when asset prices fall below the debts taken on to buy them. Firms or households with negative net worth use their income to repay debt instead of spending or investing, and do not borrow even at zero interest rates, so money stops circulating and rate cuts lose their effect.
Q. How did it play out in Japan?
After the Nikkei fell 80.5% and commercial land 87%, Japanese private firms went from borrowing ¥41.3 trillion in fiscal 1991 to saving ¥39.2 trillion in fiscal 2003. Corporate debt fell from 144.9% to 91.9% of GDP even with rates near zero, the government borrowed what firms saved, and nominal GDP stood still from 1997 to 2013.
Q. How big is Korea’s household debt?
Korean household credit was KRW 2,019.8 trillion (about $1.52 trillion) at the end of June 2026, the first time above KRW 2,000 trillion. On the BIS measure household debt is 85.1% of GDP, 9th of 43 countries, and 44.4% of Korea’s private debt is owed by households, against 32.2% in Japan at its peak.
Q. Is Korea heading for a Japan-style balance sheet recession?
The author’s view is that Korea is not in a Japan-style crash but already in an arteriosclerosis-type squeeze: house prices have not collapsed, so households carry their debt and cut consumption slowly. Real consumption growth fell from an average of 2.9% in 2015 to 2018 to 1.6% in 2023 to 2025, and the household net saving rate rose to 8.6%.
Q. What could turn the slow squeeze into a crash?
A broad fall in house prices while most new loans are variable-rate. The variable-rate share of new mortgages jumped from 13.4% in December 2025 to 64.7% in August 2026, just as the Bank of Korea raised its base rate to 3.00%. Delinquency is still low at 0.45% for bank household loans.
Q. Which dates should investors watch?
October 27 for Korea’s advance estimate of third-quarter GDP and private consumption, November 26 for the Bank of Korea’s rate decision and revised outlook, and late November for third-quarter household credit, plus monthly KB house prices and Financial Supervisory Service delinquency data.
Sources
- Richard Koo, “U.S. Economy in Balance Sheet Recession: What the U.S. Can Learn from Japan’s Experience in 1990-2005”, written testimony to the U.S. House Financial Services Committee (link), Feb 10, 2010
- Bank of Japan, flow of funds statistics (link), updated Sep 17, 2026; Bank of Japan, “Japan’s Financial Structure since the 1980s” (link), Jul 8, 2005; Bank of Japan policy decision (link), Sep 18, 2026
- BIS total credit, debt service ratio and residential property price statistics (link), Q1 2026; FRED (BIS, OECD and IMF series, https://fred.stlouisfed.org/), accessed Oct 26, 2026; World Bank World Development Indicators, updated Oct 8, 2026
- Japan Financial Services Agency, “The Status of Non Performing Loans as of the end of March 2002” (link), Aug 2, 2002; nippon.com, “Lessons of the 1997 Financial Crisis in Japan” (link), Oct 30, 2017
- Bank of Korea ECOS (household credit, loan rates, variable-rate shares, base rate, national accounts, KB house prices), accessed Oct 26, 2026; Bank of Korea monetary policy decision (link), Oct 22, 2026; Bank of Korea Economic Outlook, Aug 27, 2026
- Bank of Korea Issue Note, “Lessons to Revisit from the Japanese Economy” (link), Jun 5, 2025; Bank of Korea, “The Effect of Real-Estate-Driven Household Debt on Consumption” (link), Nov 30, 2025; Bank of Korea Financial Stability Report (link), Jun 24, 2026
- Financial Services Commission, 2026 household debt management plan (link), Apr 1, 2026; Financial Services Commission, October 15 housing measures (link), Oct 15, 2025; Financial Supervisory Service, delinquency rates on won loans at domestic banks, end-August 2026 (link), Oct 23, 2026
- Rhee Chang-yong special dialogue (link), Apr 3, 2025; Governor Shin Hyun Song’s inaugural speech, Apr 21, 2026; Herald Economy (domestic bank capital ratios), Mar 30, 2026; Newsis (Survey of Household Finances and Living Conditions), Dec 4, 2025; Yahoo Finance closes (Jan 2000 to Oct 26, 2026)
- Photos: Lombroso (CC BY-SA 4.0), Wiiii (CC BY-SA 3.0), Kuriki (public domain), kallerna (CC BY-SA 4.0), Brücke-Osteuropa (CC0), Ox1997cow (CC BY-SA 3.0), LandAndTree (CC0), Kuroshio no Neko (CC BY 4.0), via Wikimedia Commons
Was this note useful?
Thanks. Your answer helps decide what to cover next.
Korea market snapshot · Oct 28, 2026
New to Korean stocks? Start here for the basics.
Most read lately
Get the Saturday note on Korean stocks
One email every Saturday with the week’s new research on Korean listed companies and links to the updated data pages. Built from DART filings and KRX data. Free; unsubscribe in one click. See past issues