Nebius (NBIS) Stock Forecast 2026: GPU Price Hikes, 5GW of Power and Sovereign AI — How Much Is Priced In at $242.81?
Nebius (NBIS) stock forecast: thanks to the GPU shortage, Nebius is raising prices and adding power at the same time, and nations (sovereign AI) are lining up as the next customer after Big Tech. This report explains how neoclouds make money, works through the economics of a single MW, builds the author’s own 2026–2028 model, and measures how much of the plan the $242.81 share price already reflects. Data as of October 2, 2026.
- GPU prices raised twice in 2026 (June 1 and October 1): H100 $2.95 → $4.50, B300 $6.10 → $9.50, up 53–56% cumulatively.
- Annual revenue per MW: baseline ~$12M → $20–25M on four large Q2 deals → $40–50M on 3–6-month short-term deals.
- Year-end contracted power goal raised four times, from 1GW to 5GW; Microsoft ($17.4bn) and Meta (up to $27bn) deals total up to ~$49.4bn.
- 1MW math: break-even is $13.3M per MW a year; at the Q2 price ($22.5M) the equipment pays back in 2.2 years, at $12M it never does within 5 years.
- Today’s $242.81 already prices in ~1.3GW of new power in 2027–28 at $18.5M per MW (76% of the author’s 1.7GW base); watch Q3 results and 2027 guidance.
Key takeaways
- Thanks to the GPU shortage, Nebius raised GPU prices twice this year (+53–56% cumulative), and the price on new large Q2 contracts is $20–25M per MW a year, about twice this year’s baseline.
- The year-end contracted power goal went from 1GW to 5GW in one year, and nations (sovereign AI) are becoming customers alongside Big Tech and AI labs, so “more” and “pricier” are arriving together.
- However, today’s share price already prices in selling about 1.3GW of new power in 2027–28 at $18.5M per MW (author’s calculation), so what is left to drive the stock is switching on faster, holding prices, and funding growth with less dilution.
As of: October 5, 2026
Ticker: Nebius Group (NBIS, Nasdaq)
Reference close: $242.81 (Nasdaq close, October 2, 2026)
This is the author’s personal analysis and opinion.
The author’s calculations and estimates are not confirmed facts.
The author does not own Nebius shares.
1. This report is the detailed English version of the author’s Korean Naver blog post “Nebius (NBIS) stock outlook: raising prices and adding power, and the next customer is nations (sovereign AI).”
2. We first look at how neoclouds make money and what Nebius sells.
3. Then we take three questions in turn: why it is in the spotlight, why it can rise now, and why it deserves this multiple.
4. The thread running through it is whether customers buy more of what Nebius sells (power, nations as customers) and whether they pay more for it (price).
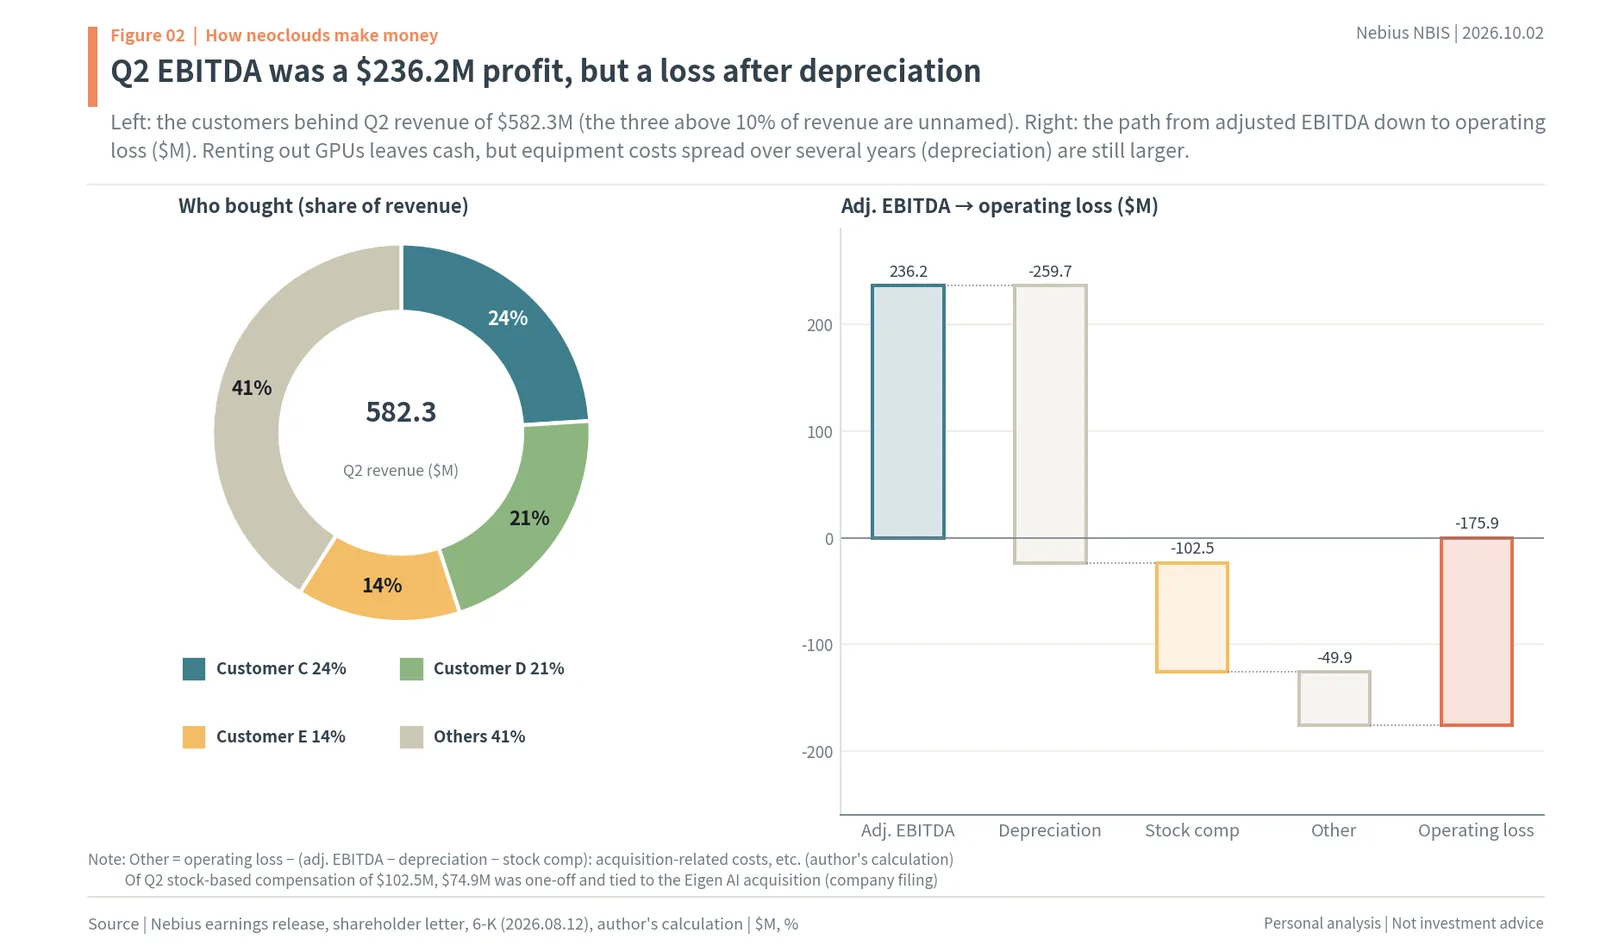
5. We do not set a price target; instead we measure whether the expectations will come true, how much they are worth if they do, and how much the share price has already priced in.
6. The conclusion first: both “more” and “pricier” are showing up in the numbers, but today’s share price already reflects about three-quarters of the company’s plan, so what is left is speed, price and funding.
1. How Neoclouds Like Nebius Make Money
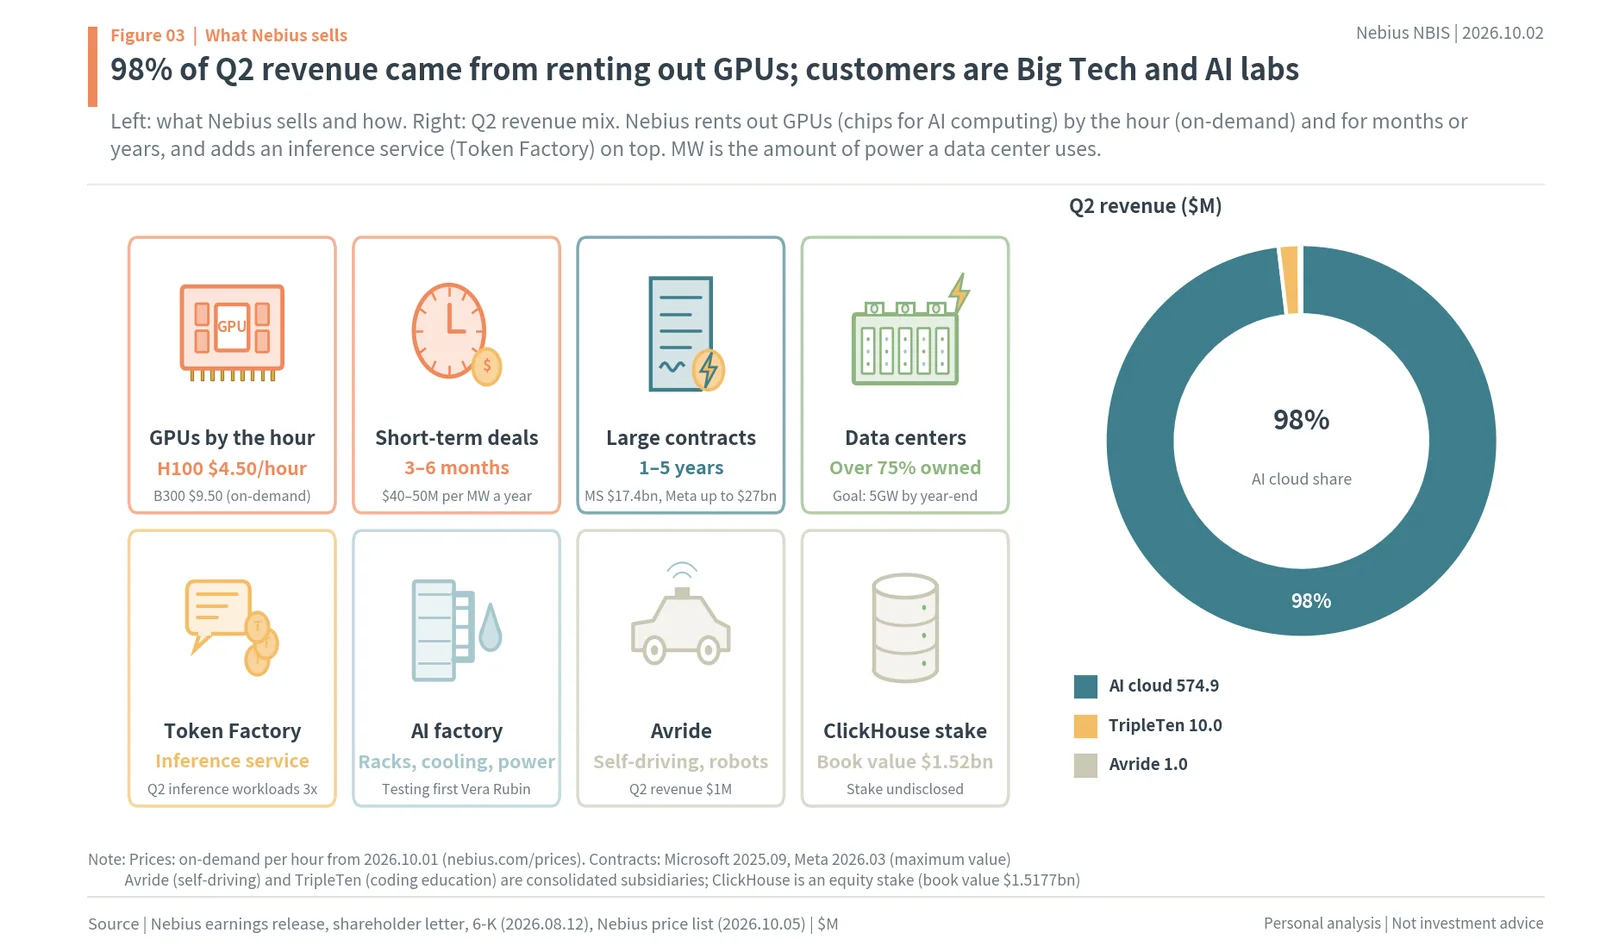
7. A neocloud is an AI-only cloud that rents GPUs to AI companies; CoreWeave, Nebius, Crusoe and Lambda are the leading names (Synergy Research).
8. Unlike big clouds such as Amazon and Microsoft (hyperscalers) that sell every kind of service, neoclouds focus on GPU computing alone.
9. Neocloud revenue passed $25bn in 2025 and is forecast to grow to nearly $400bn by 2031 (Synergy Research).
10. Customers fall into three groups: AI labs, Big Tech, and, increasingly, nations (governments and the public sector).
11. Big Tech rents instead of building because securing power and data centers takes years.
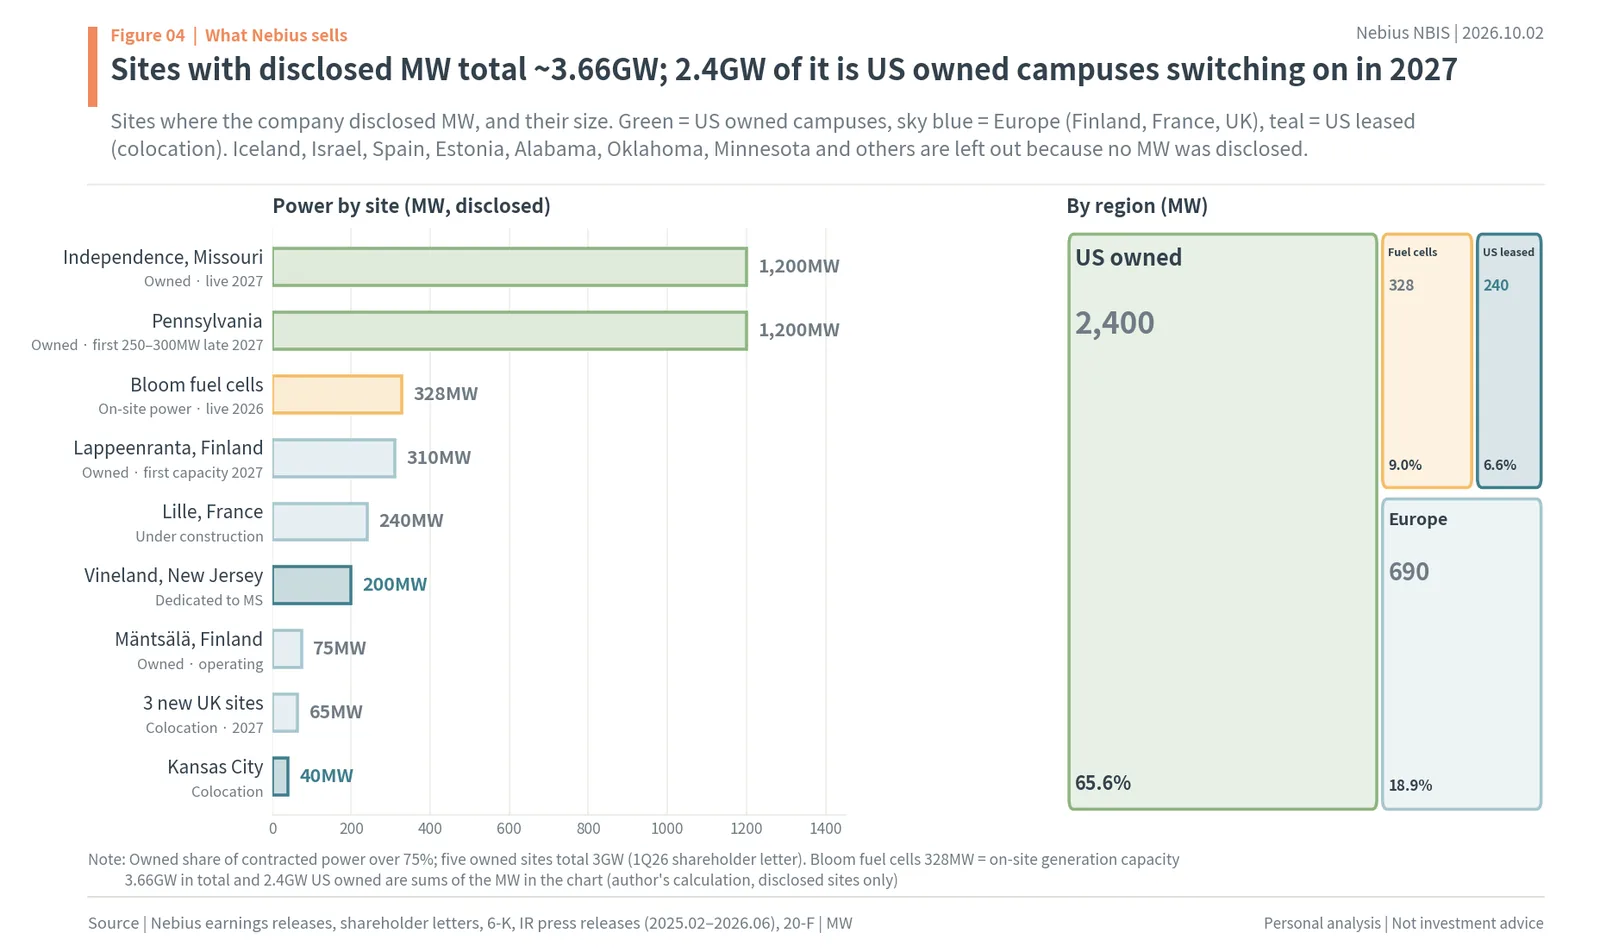
12. This year’s capex guidance from the four Big Tech companies (Amazon, Alphabet, Microsoft, Meta) adds up to $735–750bn (Platformonomics).
13. Even so, GPU rental prices rose again in 2026, and that is the key signal for this industry.
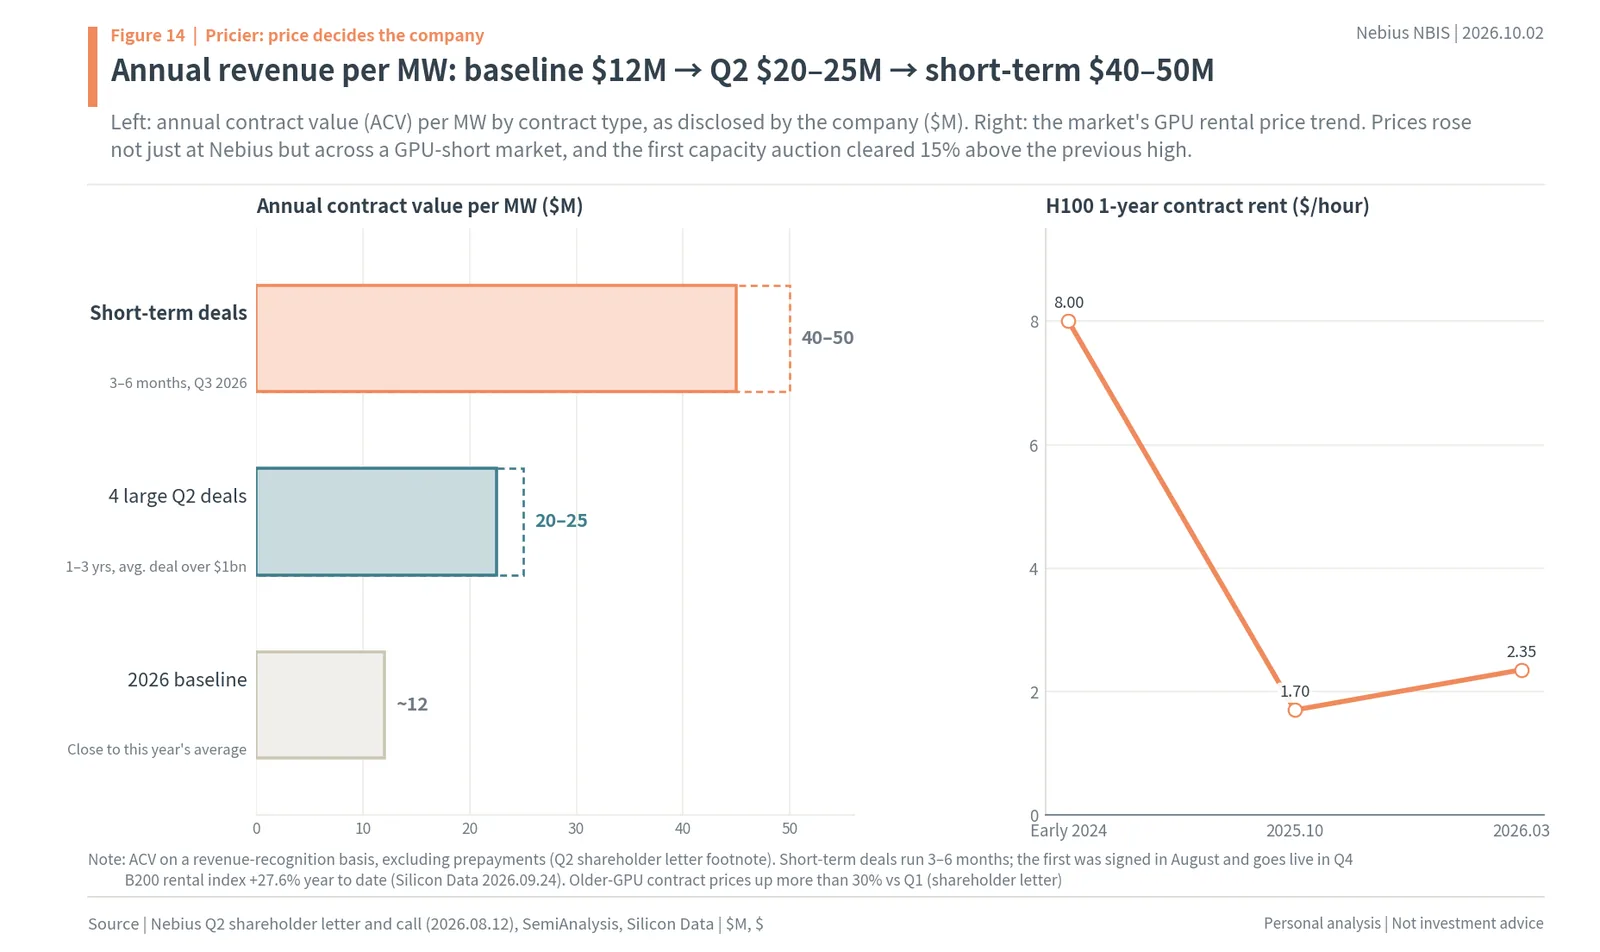
14. The hourly H100 rental price fell from about $8 in early 2024 to $1.70 in October 2025, then rebounded to $2.35 in March 2026 (1-year contracts, SemiAnalysis).
15. Rents rising even as the four Big Tech companies spend $735bn means usage is growing faster than capacity is being built.

16. There are three main ways to sell.
17. The first is hourly on-demand: customers pay for what they use, and it is the most expensive.
18. The second is 3–6-month short-term contracts, where customers in a hurry pay a premium.
19. The third is 1–5-year large contracts: the price is lower, but years of revenue are locked in and prepayments are sometimes received.
20. As for how the money flows, the cash from renting out GPUs comes in right away, but depreciation, which spreads equipment costs over several years, is large.
21. Nebius’s Q2 adjusted EBITDA was a $236.2M profit, but after $259.7M of depreciation it was a loss.
22. Three customers each above 10% of revenue accounted for 24%, 21% and 14%, and the company did not name them.
2. What Nebius Sells: GPUs, Token Factory and Data Centers
23. Nebius, headquartered in Amsterdam, is the former Yandex N.V.: it sold its Russian businesses in May 2024 and, with the remaining international businesses, resumed trading on Nasdaq in October 2024.
24. Of Q2 revenue of $582.3M, about 98% came from AI cloud.
25. The rest came from TripleTen, a coding education business ($10M), and Avride, a self-driving business ($1M).
26. From October 1, the on-demand price is $4.50 per hour for an H100 and $9.50 for the latest B300.
27. On top of that sits Token Factory, an inference service, and production inference workloads more than tripled in Q2.
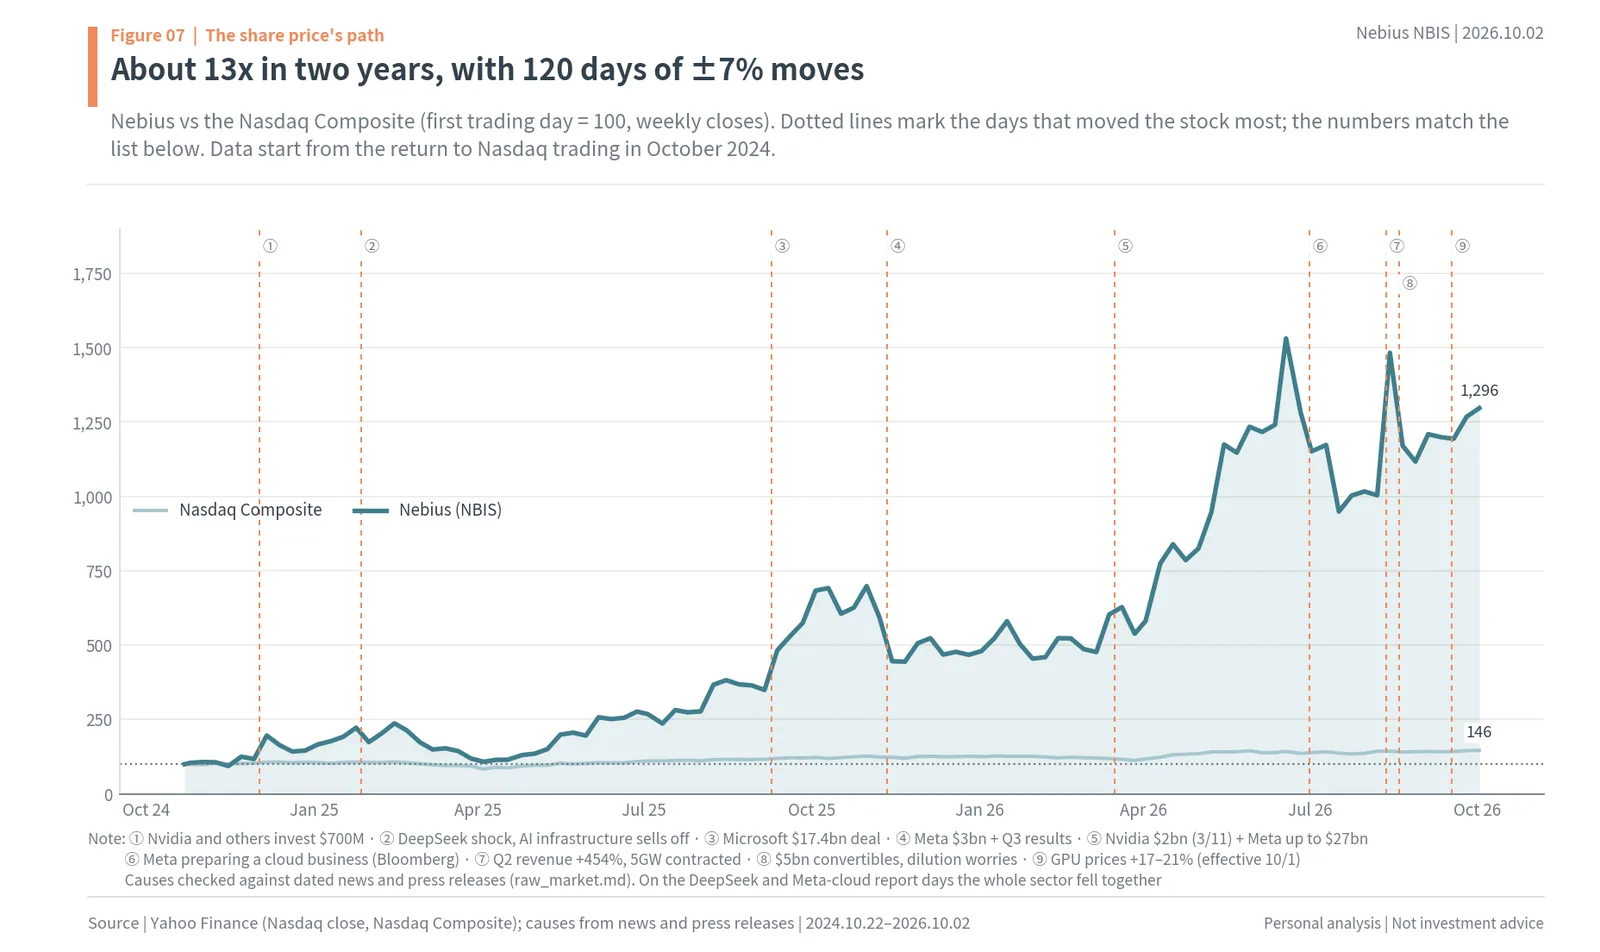
28. Nebius mixes owned sites that it builds itself with leased space in other companies’ buildings (colocation).
29. Owned sites account for more than 75% of contracted power, and five owned facilities add up to 3GW (Q1 shareholder letter).
30. Sites where the company has disclosed MW alone add up to about 3.66GW, and 2.4GW of that is US owned campuses switching on in 2027 (1.2GW in Missouri, 1.2GW in Pennsylvania) (author’s sum).
31. In Europe it has sites in Mäntsälä and Lappeenranta in Finland, Lille in France, and the UK, and being a European company helps it win nations as customers.
32. The 200MW site in Vineland, New Jersey is dedicated to Microsoft, and its power source is being switched to Bloom fuel cells (328MW).
33. 2027, when the US owned campuses switch on, is the year volume and margins change together, and the company has also said margins will improve “from the second half of next year.”
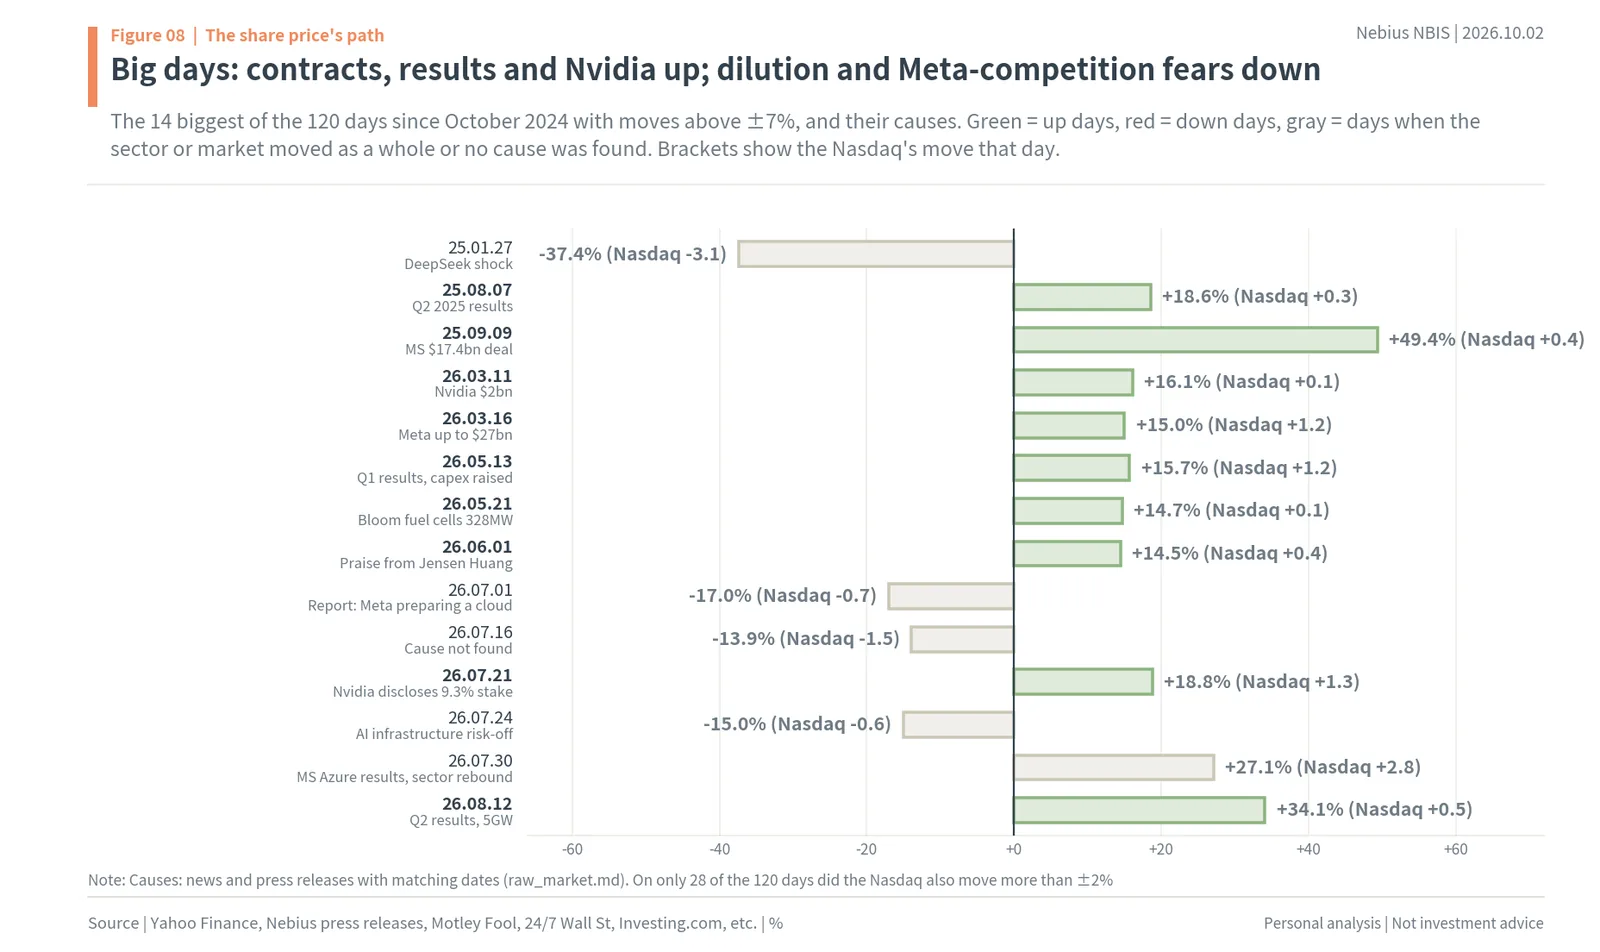
3. Why Nebius Is in the Spotlight: Microsoft and Meta Are Lining Up
34. The first reason it is in the spotlight is its big customers.
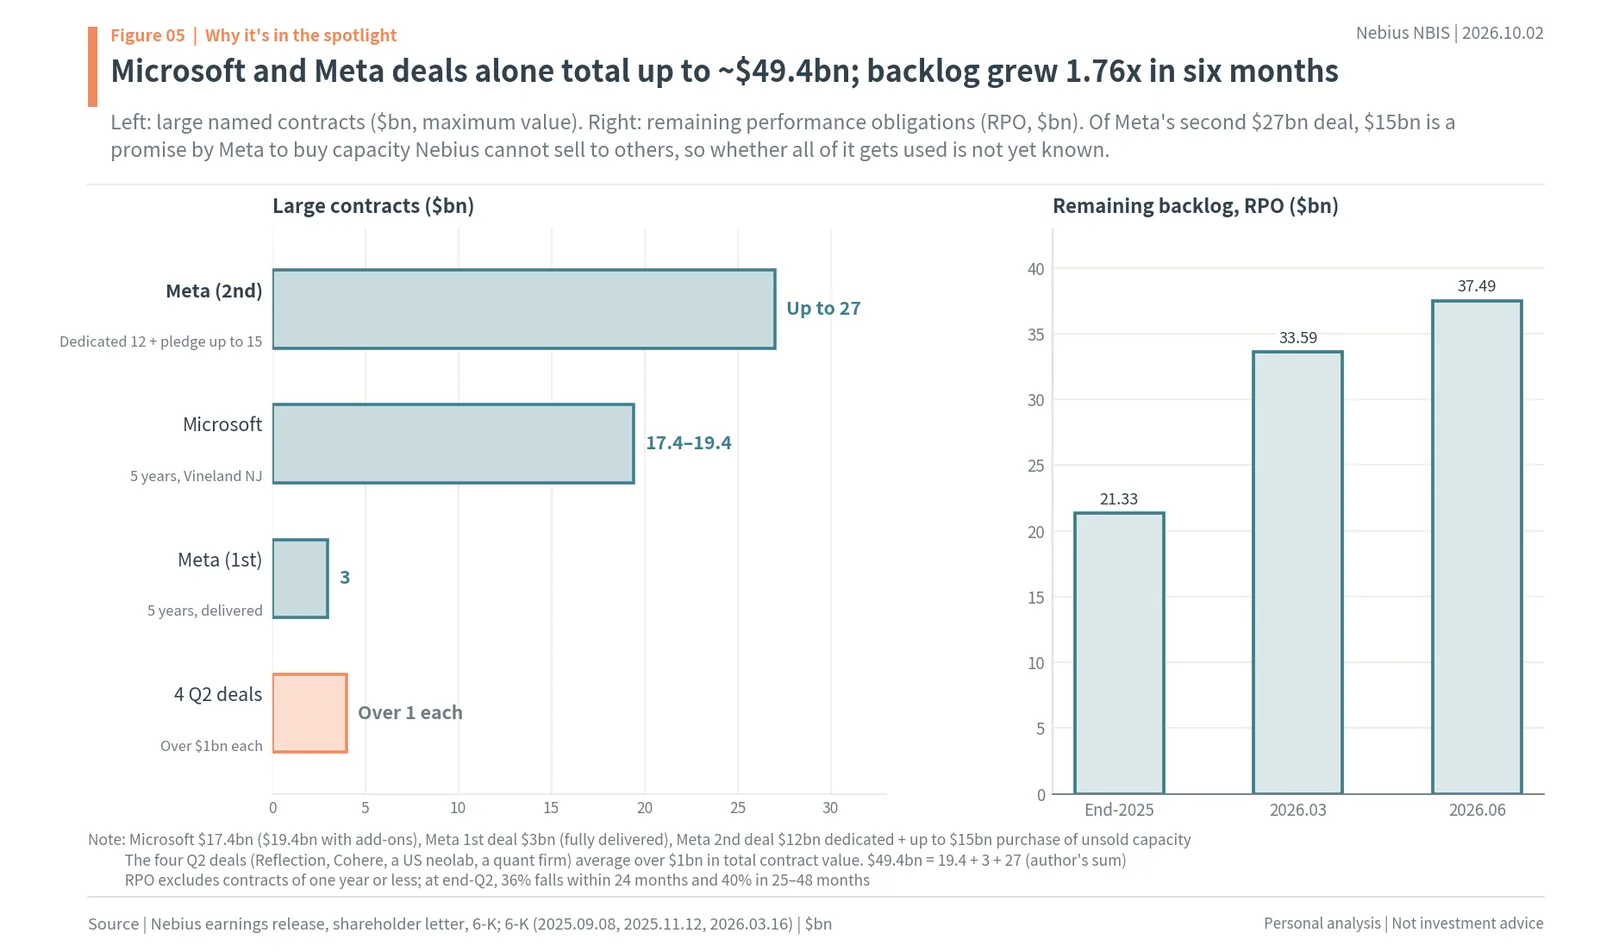
35. In September 2025 Nebius signed a five-year, $17.4bn contract with Microsoft ($19.4bn with add-ons), and it has delivered all capacity due so far.
36. With Meta it signed a contract of about $3bn in November 2025 and one of up to about $27bn in March 2026.
37. Of Meta’s second $27bn deal, $12bn is capacity dedicated to Vera Rubin, and $15bn is a promise by Meta to buy capacity that Nebius cannot sell to others.
38. Large contracts with named customers alone add up to about $49.4bn (author’s sum), and in Q2 Nebius signed four more contracts worth over $1bn each (including Reflection and Cohere).
39. Remaining performance obligations (RPO) rose from $21.33bn at the end of 2025 to $37.49bn at the end of June, 1.76x in half a year.
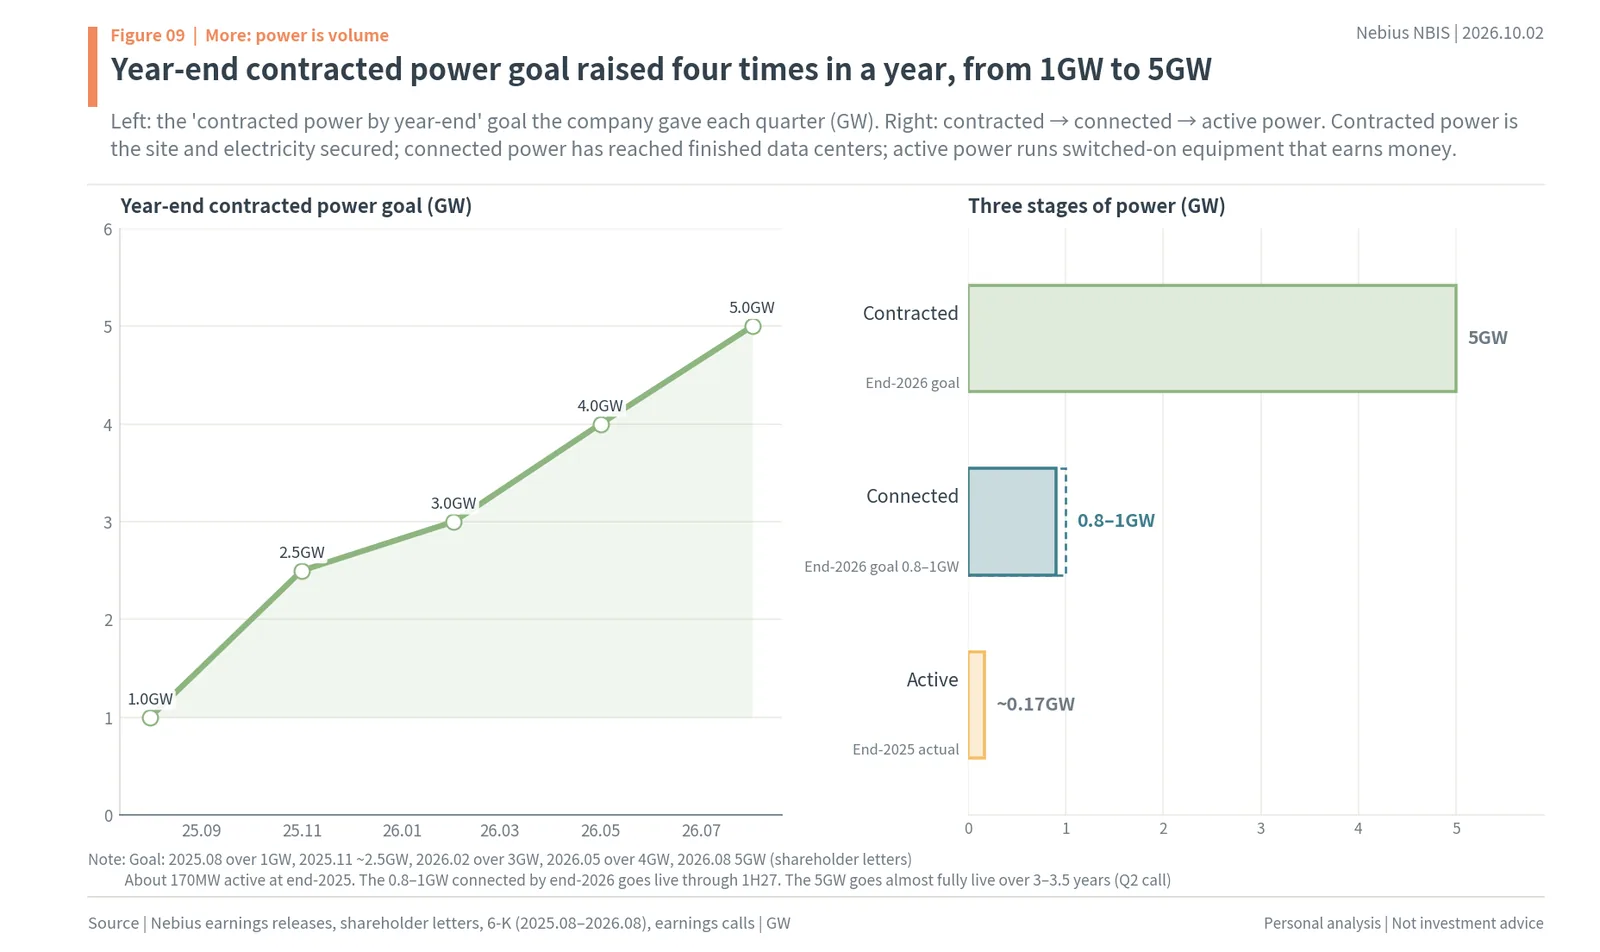
40. Nvidia invested $2bn in March 2026 (pre-funded warrants for 21.07M shares) and agreed to help Nebius build more than 5GW by 2030.
41. The second reason is that the numbers really are growing fast.
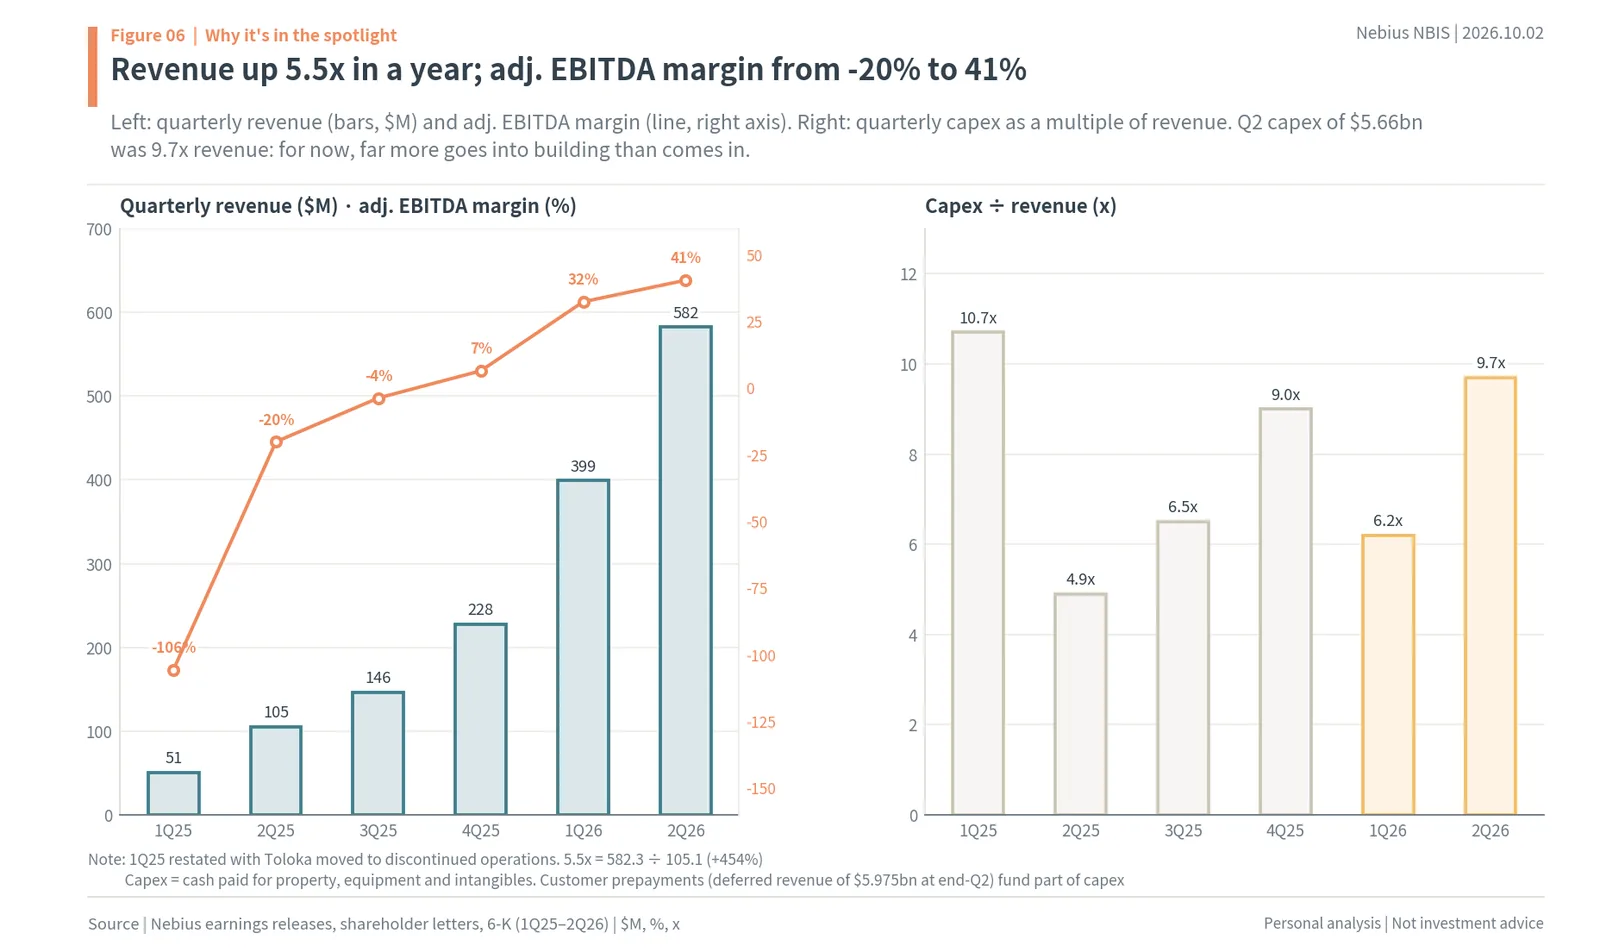
42. Q2 revenue rose 454% year over year, 5.5 times in one year.
43. The adjusted EBITDA margin went from -20% in Q2 2025 to 41% in Q2 2026.
44. Capex, on the other hand, was $5.66bn in Q2 alone, 9.7 times revenue.
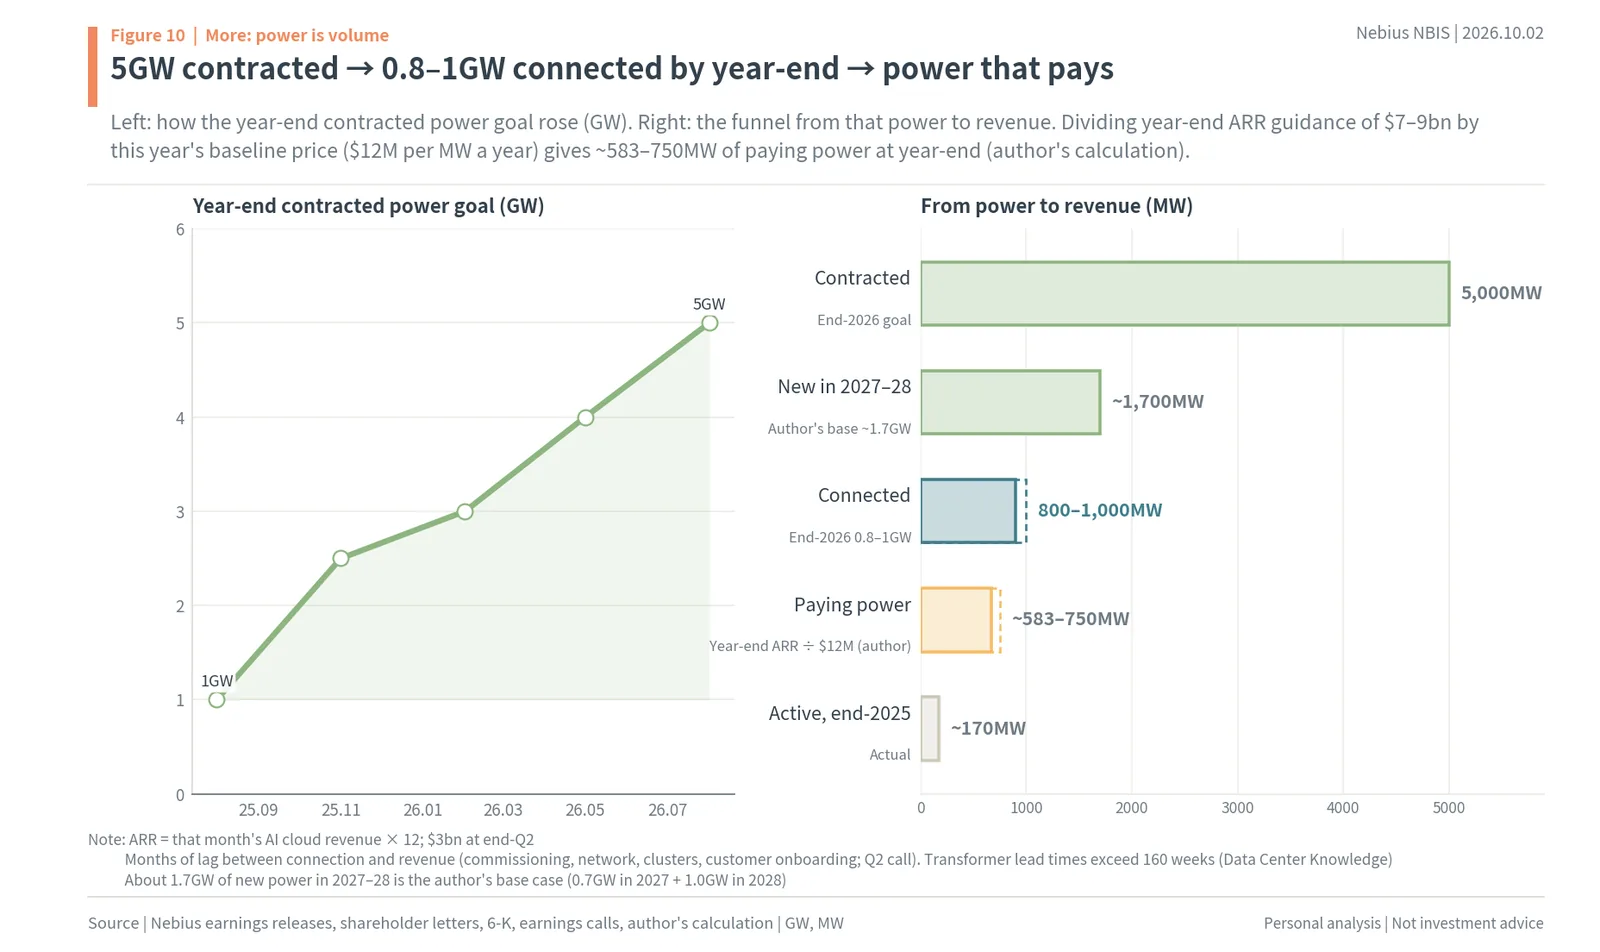
45. Customers and revenue have grown to Big Tech scale, but this is still a stage where far more money goes into building than comes in.
4. NBIS Share Price: Big Moves Whenever Expectations Shift
46. The share price rose about 13 times, from $18.73 on its first day back in trading in October 2024 to $242.81 on October 2, 2026.
47. Over the past year the stock rose 92.9%, far ahead of the Nasdaq (+19.0%).
48. It moved more than ±7% in a day on 120 days, and the Nasdaq also moved more than ±2% on only 28 of them, so most moves were driven by company-specific news.
49. The biggest one-day gain came the day after the Microsoft contract (September 9, 2025, +49.4%).
50. The biggest one-day drop was the DeepSeek shock (January 27, 2025, -37.4%), when AI infrastructure stocks were sold all at once.
51. The record close was $286.69 on June 18, 2026, and the stock is now 15.3% below it.
52. The up days were driven by large contracts, results, and Nvidia’s investment and stake disclosures.
53. The down days were driven by dilution (-10.4% and -9.9% on convertible note announcement days) and competition worries.
54. On July 1 the stock fell -17.0% on a Bloomberg report that Meta was preparing a cloud business to sell its spare computing capacity, on worries that a big customer could become a competitor.
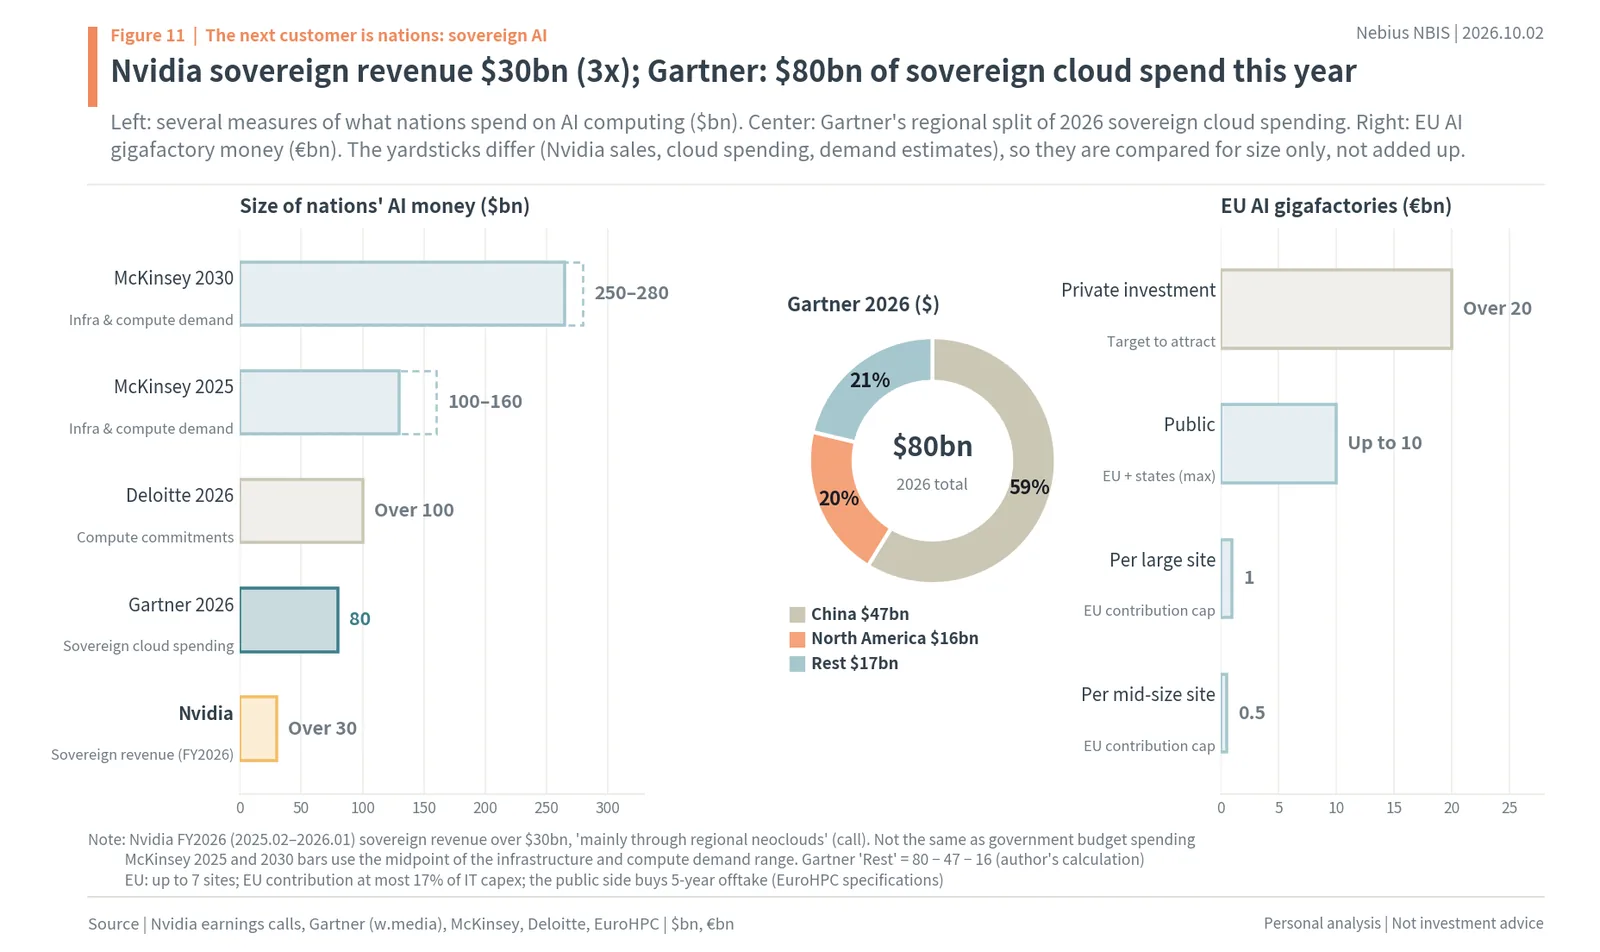
55. On August 6 it fell 13.3% when Michael Burry disclosed a short position, and in late September there were reports that he had switched to June 2027 put options.
56. From its 2026 peak to July 29 the stock fell as much as 48.3%, so when expectations break, it can halve quickly.
57. The share price has responded less to earnings than to expectations of “more and pricier” and to the money that funds those expectations (dilution).
5. More: Contracted Power Is Volume
58. In this industry, volume is counted in the power (GW) available to plug GPUs into.
59. Nebius’s “contracted power by year-end” goal rose from 1GW in August 2025 to 2.5GW in November, 3GW in February 2026, 4GW in May and 5GW in August.
60. That is four increases in one year, from 1GW to 5GW.
61. Contracted power is the site and electricity secured; connected power is power delivered to finished data centers; active power is power where equipment is switched on and earning money.
62. Active power at the end of 2025 was about 0.17GW (170MW).
63. The year-end connection goal is 0.8–1GW, and this power goes live through the first half of 2027 (Q2 call).
64. Dividing year-end ARR guidance of $7–9bn by this year’s baseline price ($12M per MW a year) gives about 583–750MW of paying power at year-end (author’s calculation).
65. ARR is that month’s AI cloud revenue multiplied by 12, and it was $3bn at the end of Q2.
66. The plan is to build more than 1GW of new capacity every year from 2027 and to bring almost all of the 5GW contracted online over 3–3.5 years.
67. The author’s base scenario switches on 0.7GW of new power in 2027 and 1.0GW in 2028, about 1.7GW over the two years.
68. What we do not yet know is how many months it takes to go from connection to revenue; grid connections can be delayed, with transformer lead times exceeding 160 weeks (Data Center Knowledge).
69. In the funnel that narrows from 5GW contracted to 0.8–1GW connected by year-end, and again to paying power, what will move the stock is “how fast the narrow end widens.”
6. The Next Customer Is Nations: Nebius and Sovereign AI
70. The new source of “more” is nations.
71. Sovereign AI is the push by nations to keep AI computing and data on their own soil and under their own laws (Nvidia’s definition).
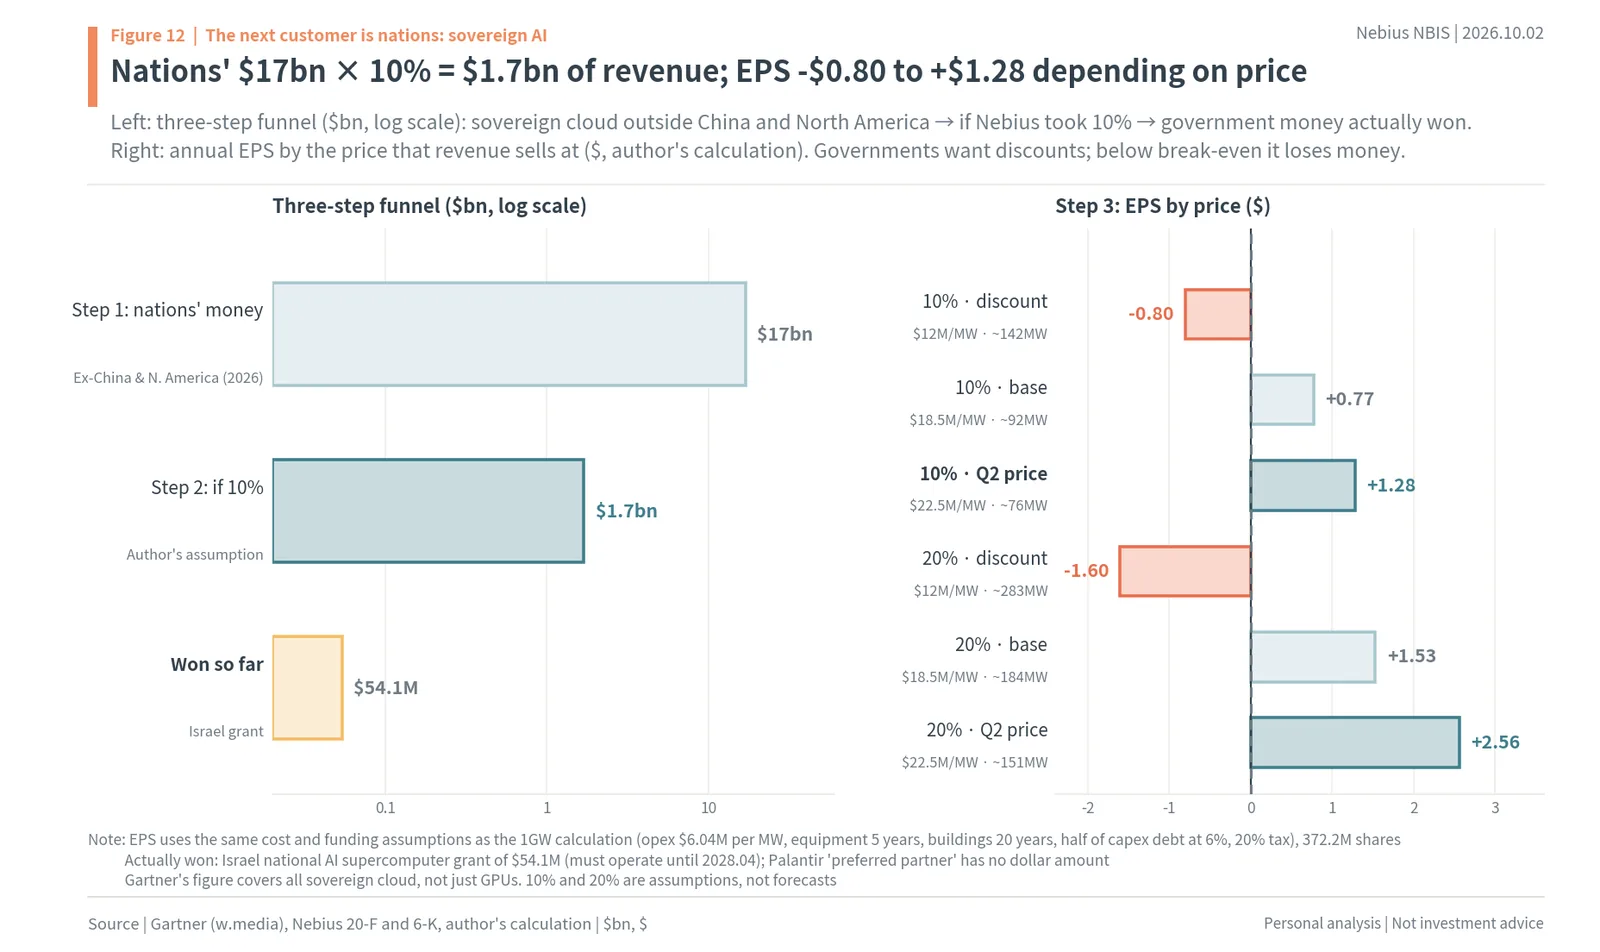
72. In Europe there is strong concern that data entrusted to US clouds could be handed to US authorities under US law (the CLOUD Act).
73. Microsoft France’s head of legal affairs also told the French Senate that he “cannot guarantee” data would not be handed over (The Register).
74. Nvidia has explained that nations and regions can allocate land and power directly to regional clouds that they would not give to foreign hyperscalers.
75. Nvidia’s sovereign revenue more than tripled in fiscal 2026 to over $30bn, with Canada, France, the Netherlands, Singapore and the UK as the main customer countries.
76. It grew another 35% quarter over quarter in Q2 of fiscal 2027, and Nvidia said this revenue comes mainly through regional neoclouds, naming CoreWeave, Nebius and Nscale.
77. However, Nvidia’s figure includes GPUs sold to neoclouds, so it is not the same as national budget spending.
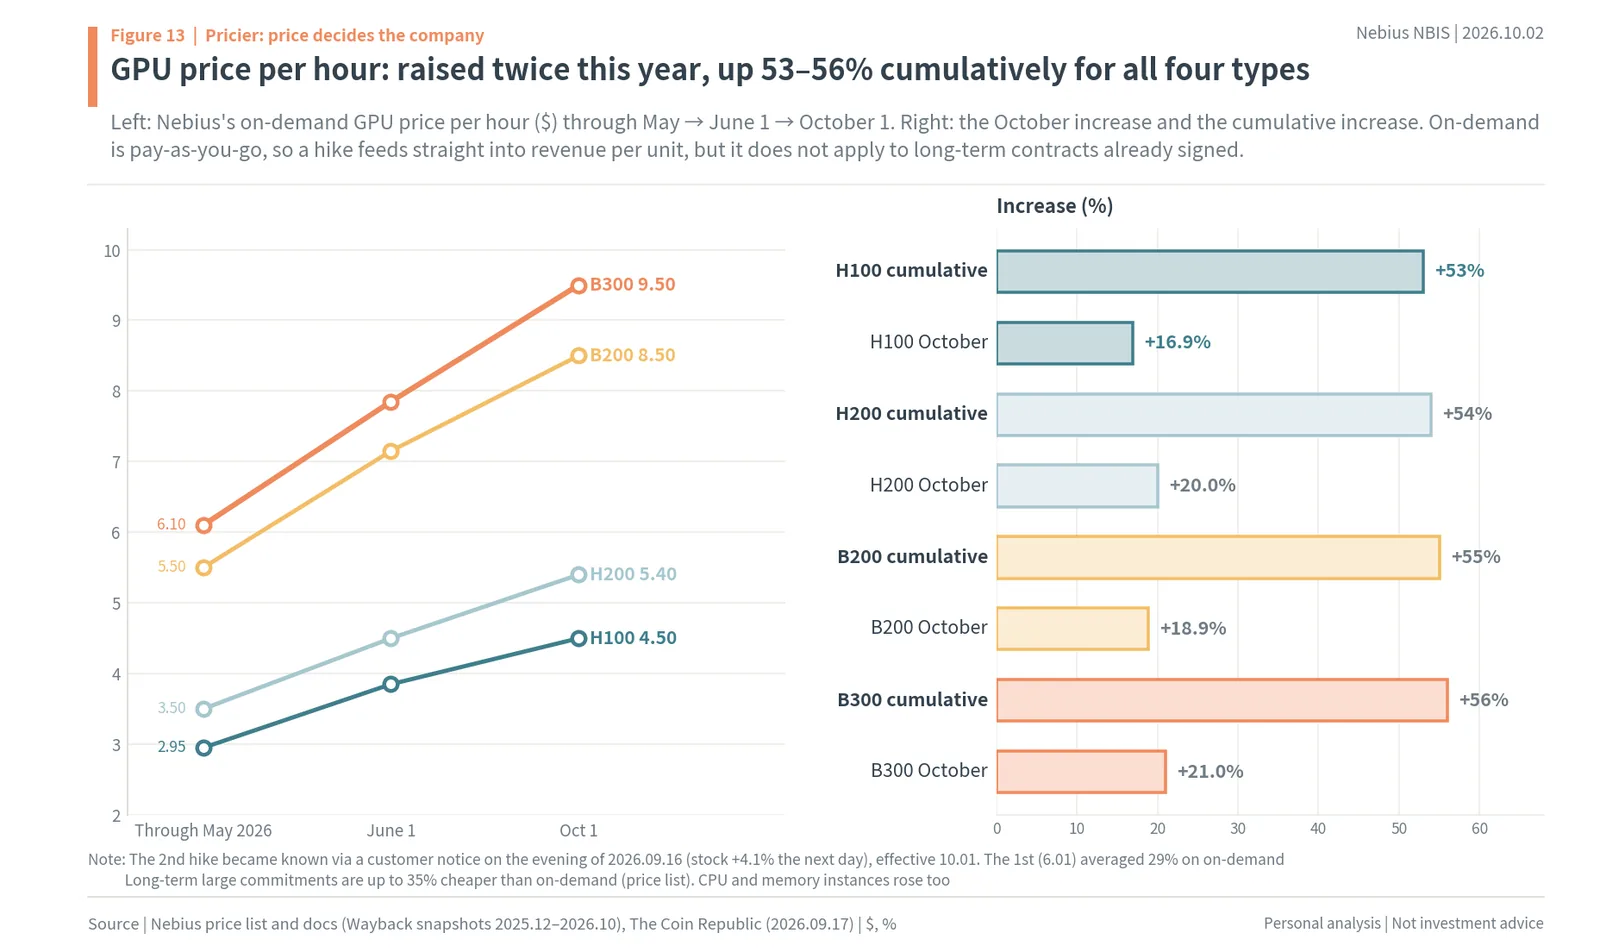
78. Gartner puts 2026 sovereign cloud spending at $80bn; excluding China ($47bn) and North America ($16bn), the rest is about $17bn (author’s calculation).
79. McKinsey sees sovereign AI infrastructure and compute demand growing from $100–160bn in 2025 to $250–280bn in 2030.
80. The EU plans up to seven AI gigafactories, with up to €10bn of public money (EU plus member states) aimed at attracting more than €20bn of private investment.
81. Public money is capped at 17% of IT capex and buys compute time over five years, so the rest has to be filled by private customers.
82. Nvidia’s sovereign revenue tripled to $30bn and flows through regional neoclouds, so nations are a customer that is genuinely growing.
83. So how much of that could go to Nebius? We look at it in three steps.
84. Step 1, nations’ money: we take sovereign cloud spending outside China and North America, about $17bn (2026).
85. Nebius’s strengths are being a European company headquartered in Amsterdam, more than 750MW of contracted power in Europe, the Middle East and Africa (EMEA), and sites in Finland, France, the UK and Israel.
86. Of the four Q2 contracts worth over $1bn, one named “the ability to support future sovereign expansion” as its reason for choosing Nebius (Q2 call).
87. Step 2, government business actually won: there is one, Israel’s national AI supercomputer, for which Nebius received approval for a $54.1M Israel Innovation Authority grant and must operate it until April 2028 (20-F).
88. This grant is 1.6% of the author’s base 2026 revenue, not yet large enough to move the stock.
89. On September 8, when Palantir named Nebius its “preferred sovereign AI infrastructure partner,” the stock rose 7.7%, but there was no dollar amount, capacity or start date, and the targets are Palantir’s private-sector customers.
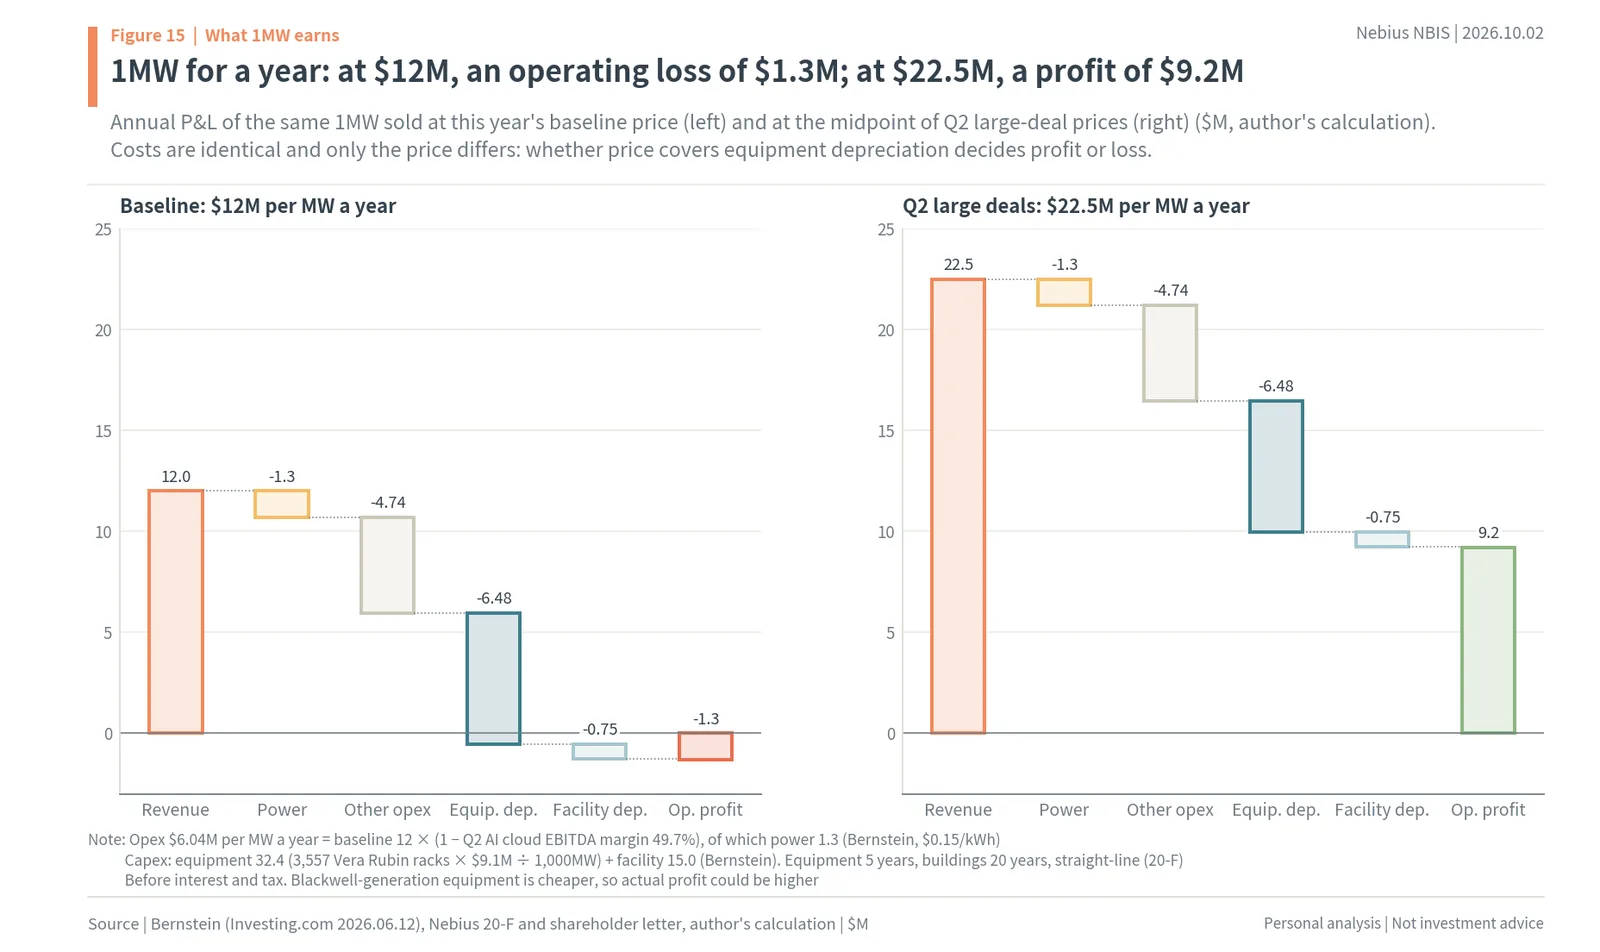
90. There are three catches.
91. First, governments ask for discounts, not premiums: the EU gigafactory tender asks bidders to state “exceptional volume discounts,” and India supplies GPUs at 100 rupees per hour.
92. Second, each nation looks after its own companies first: Korea’s National AI Computing Center went to a Samsung SDS consortium, France leans on Mistral, and Germany on Deutsche Telekom.
93. Third, an EU gigafactory lead must be controlled by EU entities or EU nationals, and with the Volozh family trust holding about 52% of Nebius’s voting rights, it is not confirmed that Nebius could lead one.
94. Step 3: if Nebius took 10% of the remaining $17bn, revenue would be $1.7bn (author’s assumption).
95. Under the same cost and funding assumptions, annual earnings per share would be about $1.28 at the Q2 price ($22.5M per MW) and $0.77 at the author’s base price ($18.5M).
96. At the discounted price governments want ($12M), it would be -$0.80 per share, a loss.
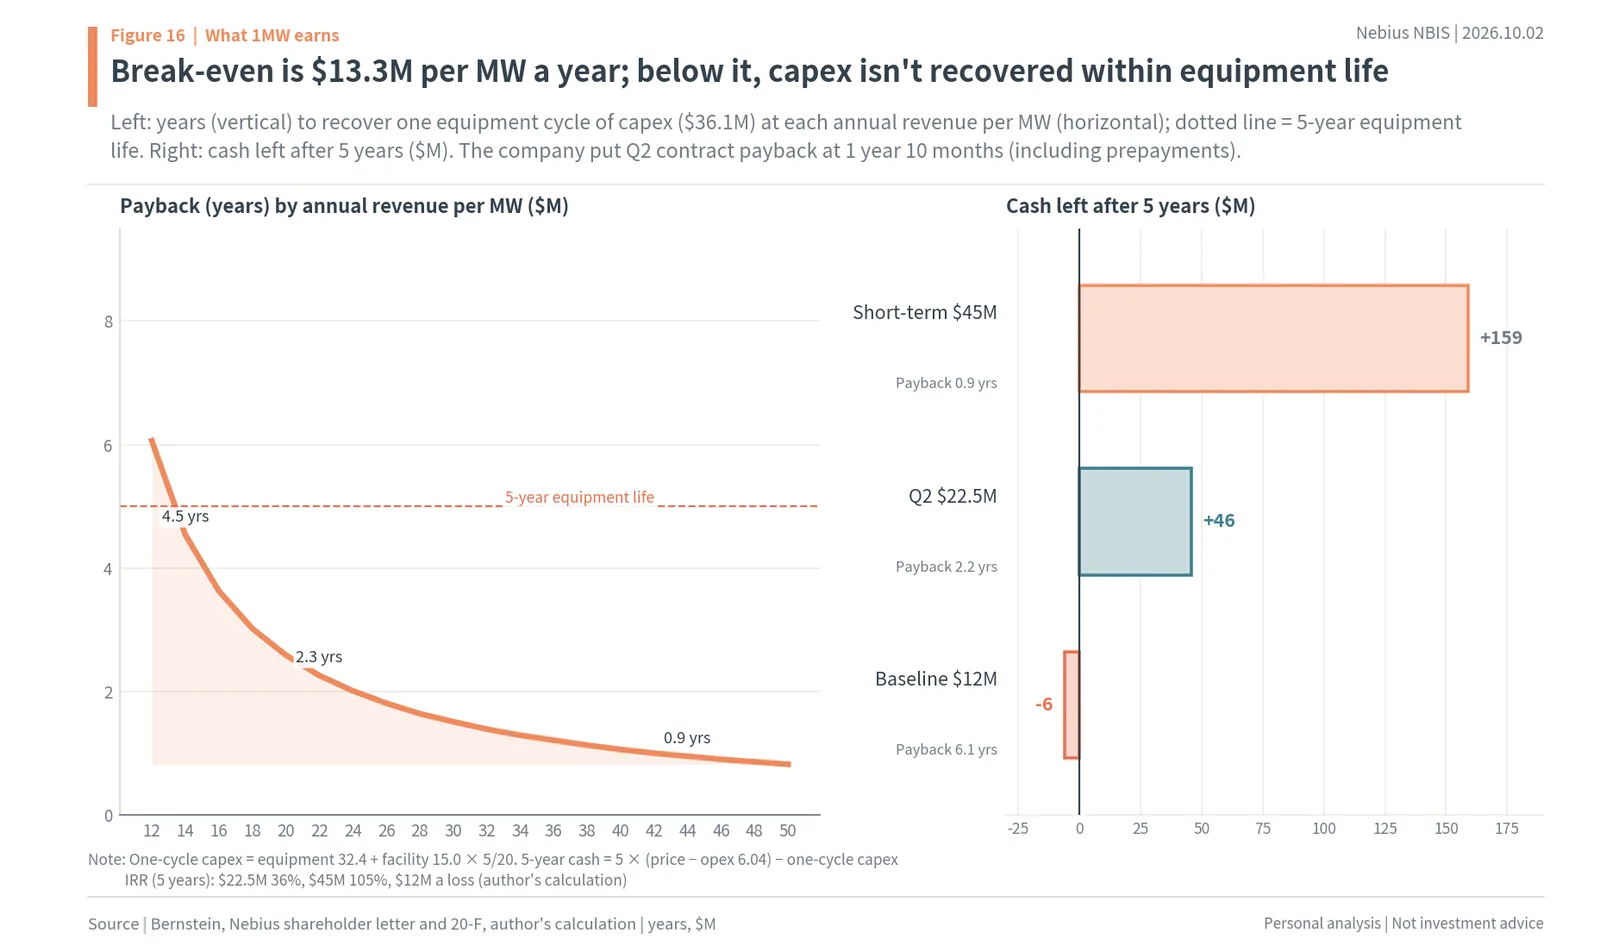
97. Taking 20% would mean $3.4bn of revenue, similar in size to this year’s revenue, but -$1.60 per share at a discounted price and +$2.56 at the Q2 price.
98. Nations are a new customer that adds to “more” but collides with “pricier,” so the author thinks they become a stock catalyst only when government contracts priced above break-even ($13.3M per MW) show up in the numbers.
7. Pricier: Nebius GPU Price Hikes
99. The first evidence of rising prices is the public price list.
100. Nebius raised its hourly GPU prices twice, on June 1 (an average of 29% for on-demand) and on October 1.
101. The H100 went from $2.95 to $3.85 and then to $4.50, and the B300 from $6.10 to $7.85 and then to $9.50.
102. All four GPU types are up 53–56% cumulatively this year, and the October increases were 16.9% for the H100 and 21.0% for the B300.
103. The second increase became known through a customer notice on the evening of September 16, and the next day the stock rose as much as about 11% before the open and closed up 4.1%.
104. However, on-demand is only part of revenue, and the increases do not apply to long-term contracts already signed.
105. More important evidence is the price on large contracts, which the company discloses as “annual contract value (ACV) per MW.”
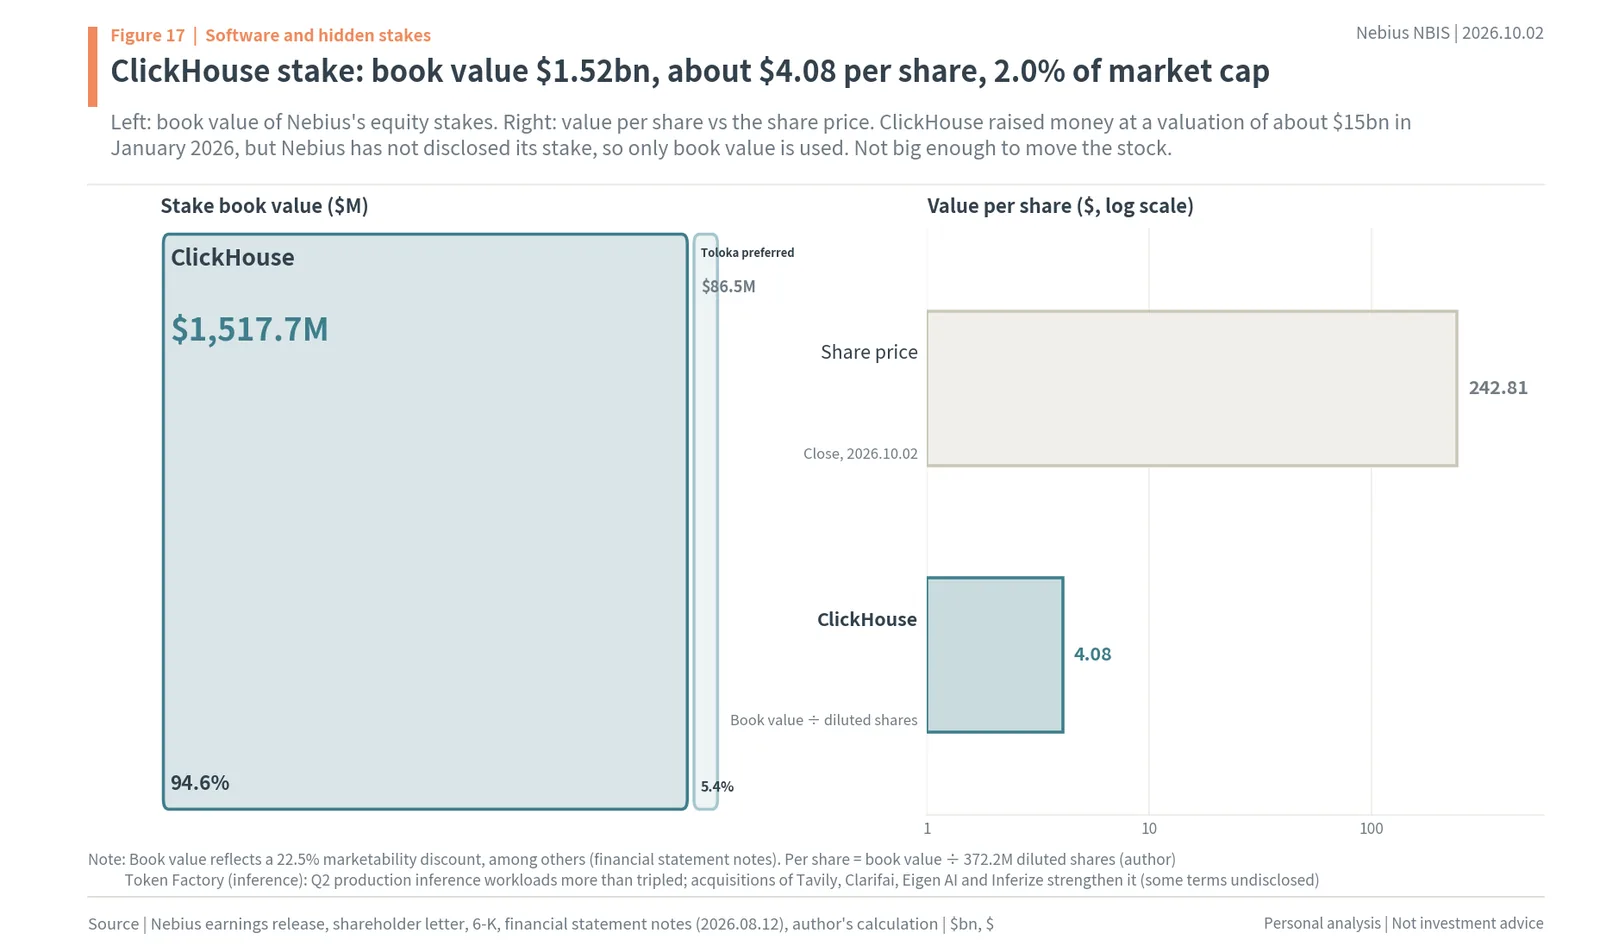
106. Annual revenue per MW rose from a 2026 baseline of about $12M to $20–25M on the four large Q2 contracts.
107. Short-term contracts of 3–6 months fetched $40–50M, and the first one was signed in August and goes live in Q4.
108. The first capacity auction cleared 15% above the previous highest price, and contract prices for older GPUs also rose more than 30% from Q1 (shareholder letter and call).
109. The company said it could sell all of its 2027 capacity on current terms but is holding some back for short-term premium demand.
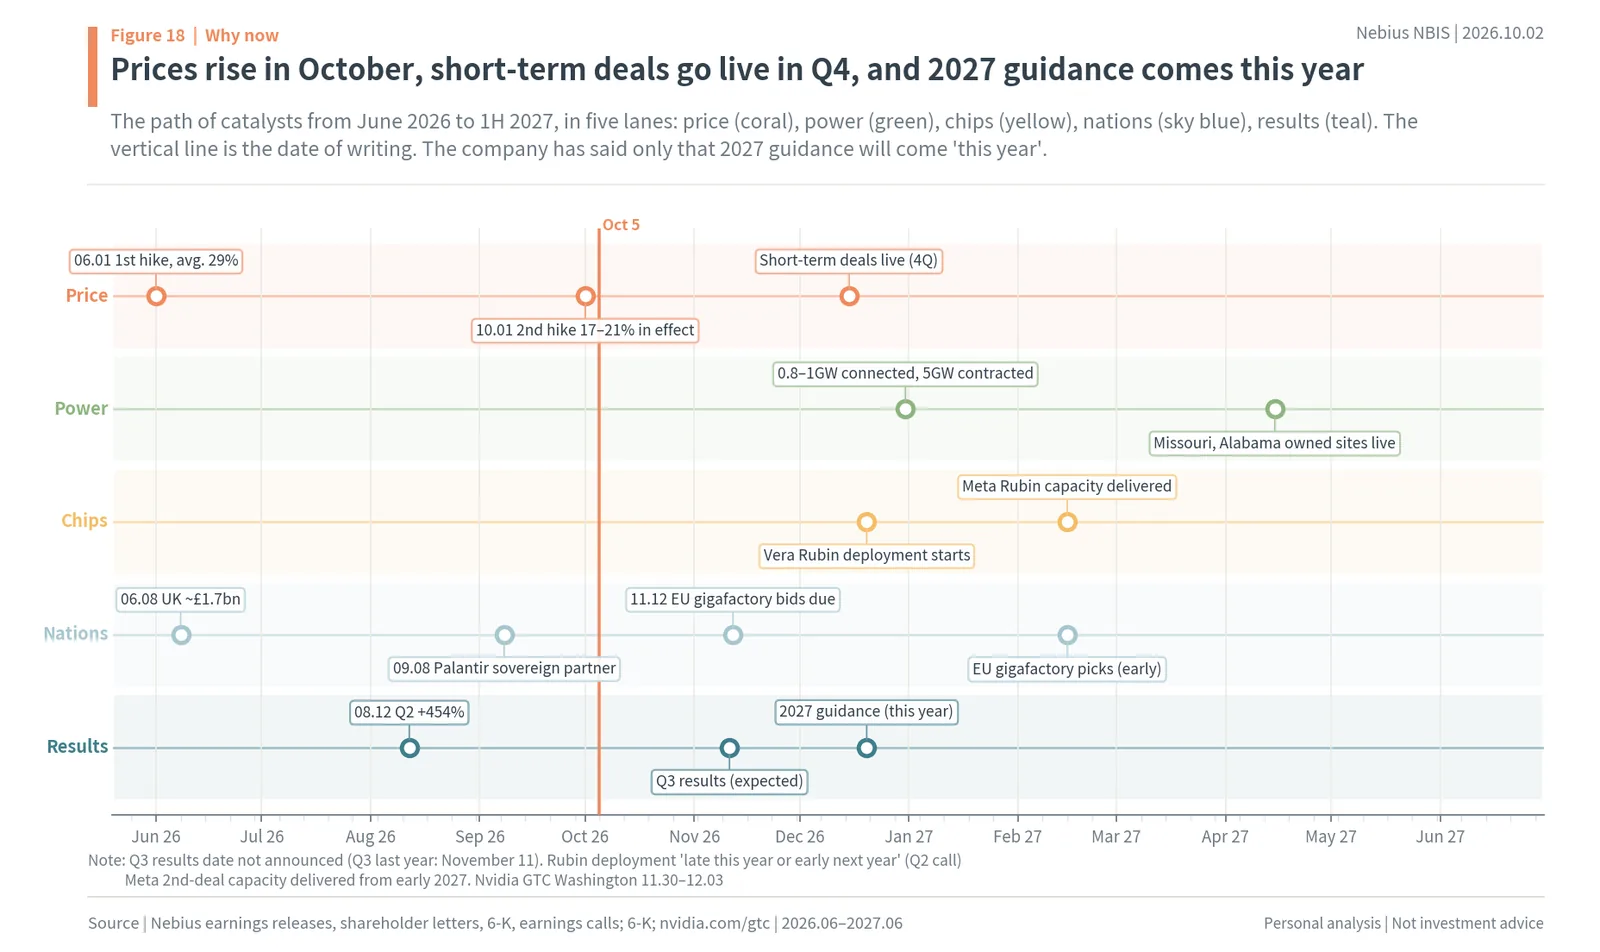
110. Rising prices are not unique to Nebius: a B200 rental index is also up 27.6% since the start of the year (Silicon Data).
111. The ladder of annual revenue per MW, from a $12M baseline to $20–25M and then $40–50M for short-term deals, is what “pricier” really means.
8. What 1MW Earns: Why Price Is Everything
112. Why price matters so much shows up in the annual P&L of a single MW (author’s calculation).
113. One MW takes about $32.4M of equipment plus $15M of buildings and power facilities (Bernstein, Vera Rubin basis).
114. The equipment figure is $9.1M per rack times 3,557 racks per GW, divided down to 1MW.
115. Equipment is depreciated over 5 years and buildings over 20 years (20-F), so annual depreciation is about $7.22M.
116. Operating costs were set at about $6.04M a year, solved backward by applying the Q2 AI cloud EBITDA margin of 49.7% to the baseline price.
117. Of that, electricity is about $1.3M a year at $0.15 per kWh (Bernstein).
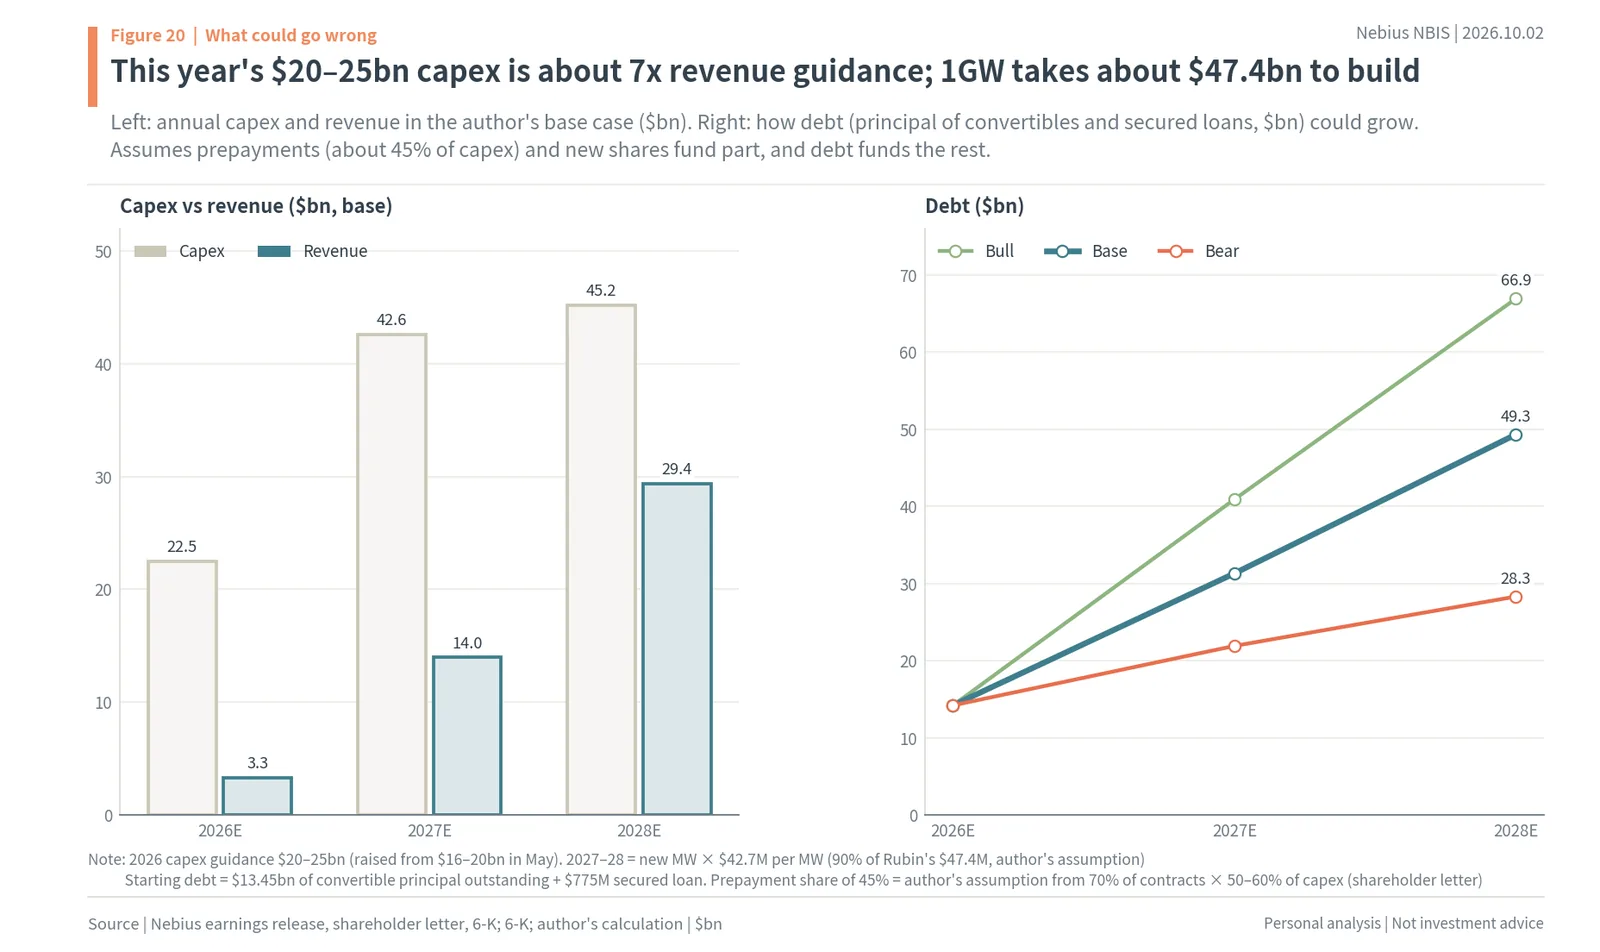
118. Selling the same 1MW at $12M gives an annual operating loss of $1.3M; selling it at $22.5M gives an operating profit of $9.2M.
119. One equipment cycle (5 years) costs about $36.1M: $32.4M of equipment plus a quarter of the facilities.
120. Recovering that at $12M takes 6.1 years, longer than the 5-year equipment life.
121. At $22.5M it takes 2.2 years, and at $45M 0.9 years.
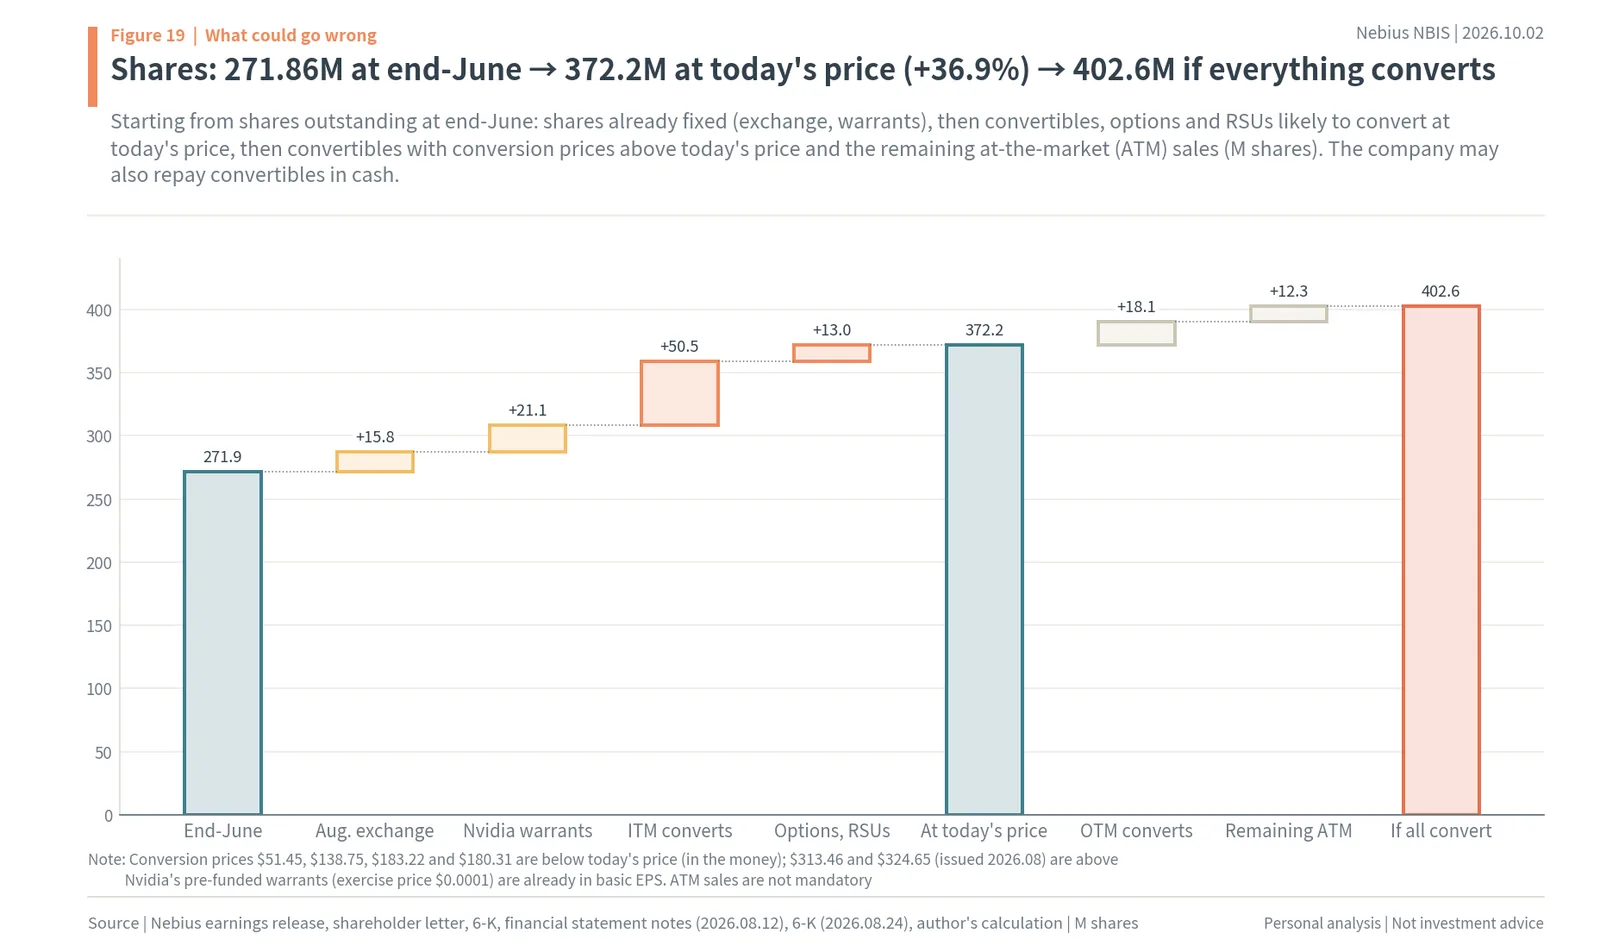
122. Cash left after five years is -$6M at $12M, +$46M at $22.5M and +$159M at $45M.
123. The break-even price is $13.3M per MW a year, almost the same as this year’s baseline.
124. The company put the payback period on Q2 contracts at 1 year 10 months, which the author attributes to prepayments and cheaper Blackwell-generation equipment.
125. The same 1MW can make a company that earns or one that doesn’t depending on price, so price increases are both the biggest catalyst and the biggest risk for this company.
9. Software and Hidden Stakes (ClickHouse)
126. Nebius is not stopping at renting GPUs; it is growing an inference service (Token Factory).
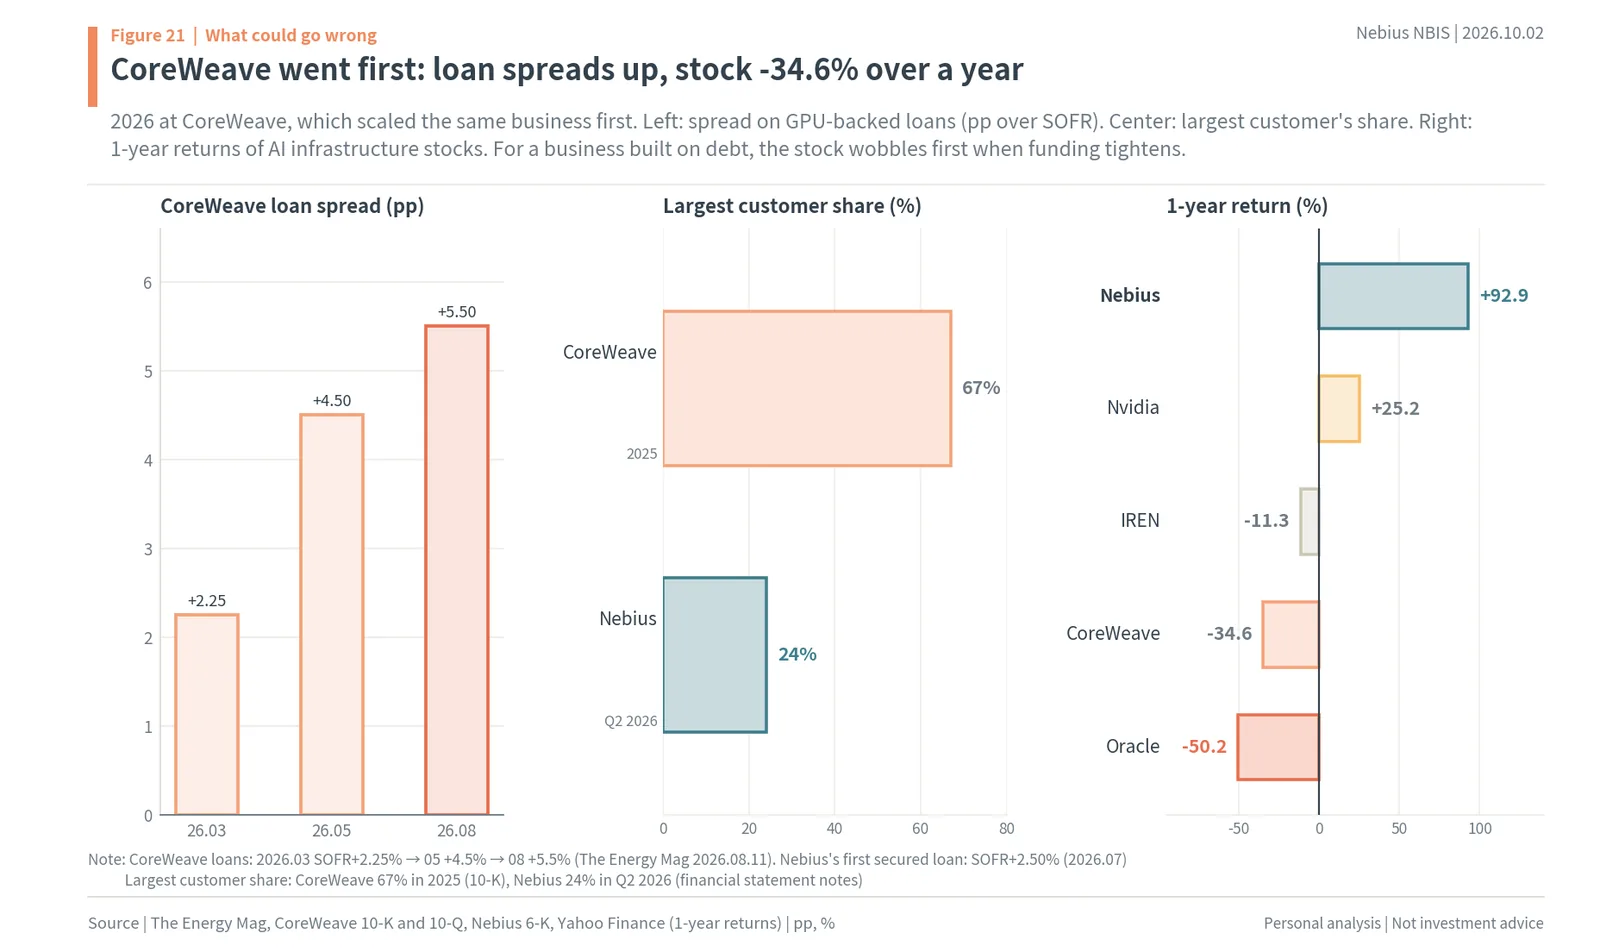
127. This year it bought Tavily (agentic search), Clarifai, Eigen AI and Inferize (terms undisclosed) to strengthen its inference stack.
128. Software revenue is not disclosed separately, so it is hard to see it as large enough to move the stock yet.
129. Among its stakes is the database company ClickHouse, which raised money at a valuation of about $15bn in January 2026.
130. Nebius’s book value for the stake is $1.52bn (end of June), and it has not disclosed its ownership percentage.
131. Divided by the diluted share count, that is about $4.08 per share, 2.0% of market cap (author’s calculation).
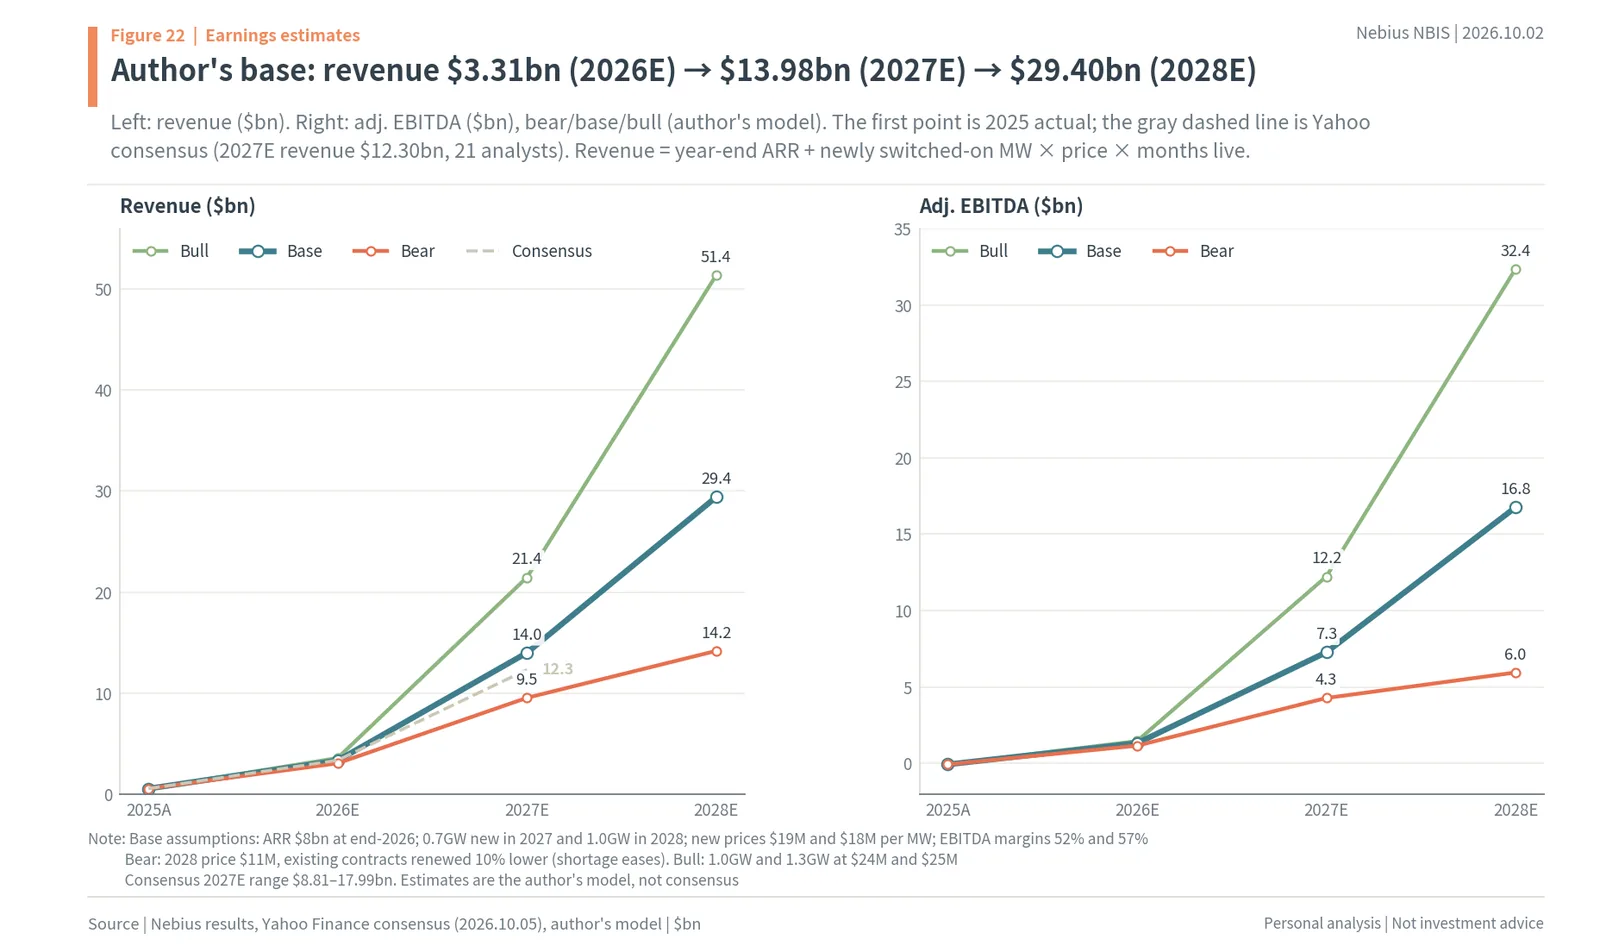
132. Hidden stakes are a nice bonus, but the share price is set by “more and pricier” in the GPU business.
10. Why Now: The Order in Which Catalysts Arrive
133. The second question is “why now?”
134. First, prices went up on October 1 and are starting to feed into revenue.
135. Second, 3–6-month short-term contracts ($40–50M per MW) go live in Q4, so the top of the price ladder becomes actual revenue.
136. Third, at year-end we will see whether 0.8–1GW connected and 5GW contracted are met.
137. Fourth, the company said it would issue official 2027 guidance “within this year,” and consensus 2027 revenue is $12.3bn.
138. Fifth, Vera Rubin deployment starts late this year or early next year, and capacity for Meta’s second contract is delivered from early 2027.
139. Sixth, on the nations side, Palantir named Nebius its “preferred sovereign AI infrastructure partner” on September 8.
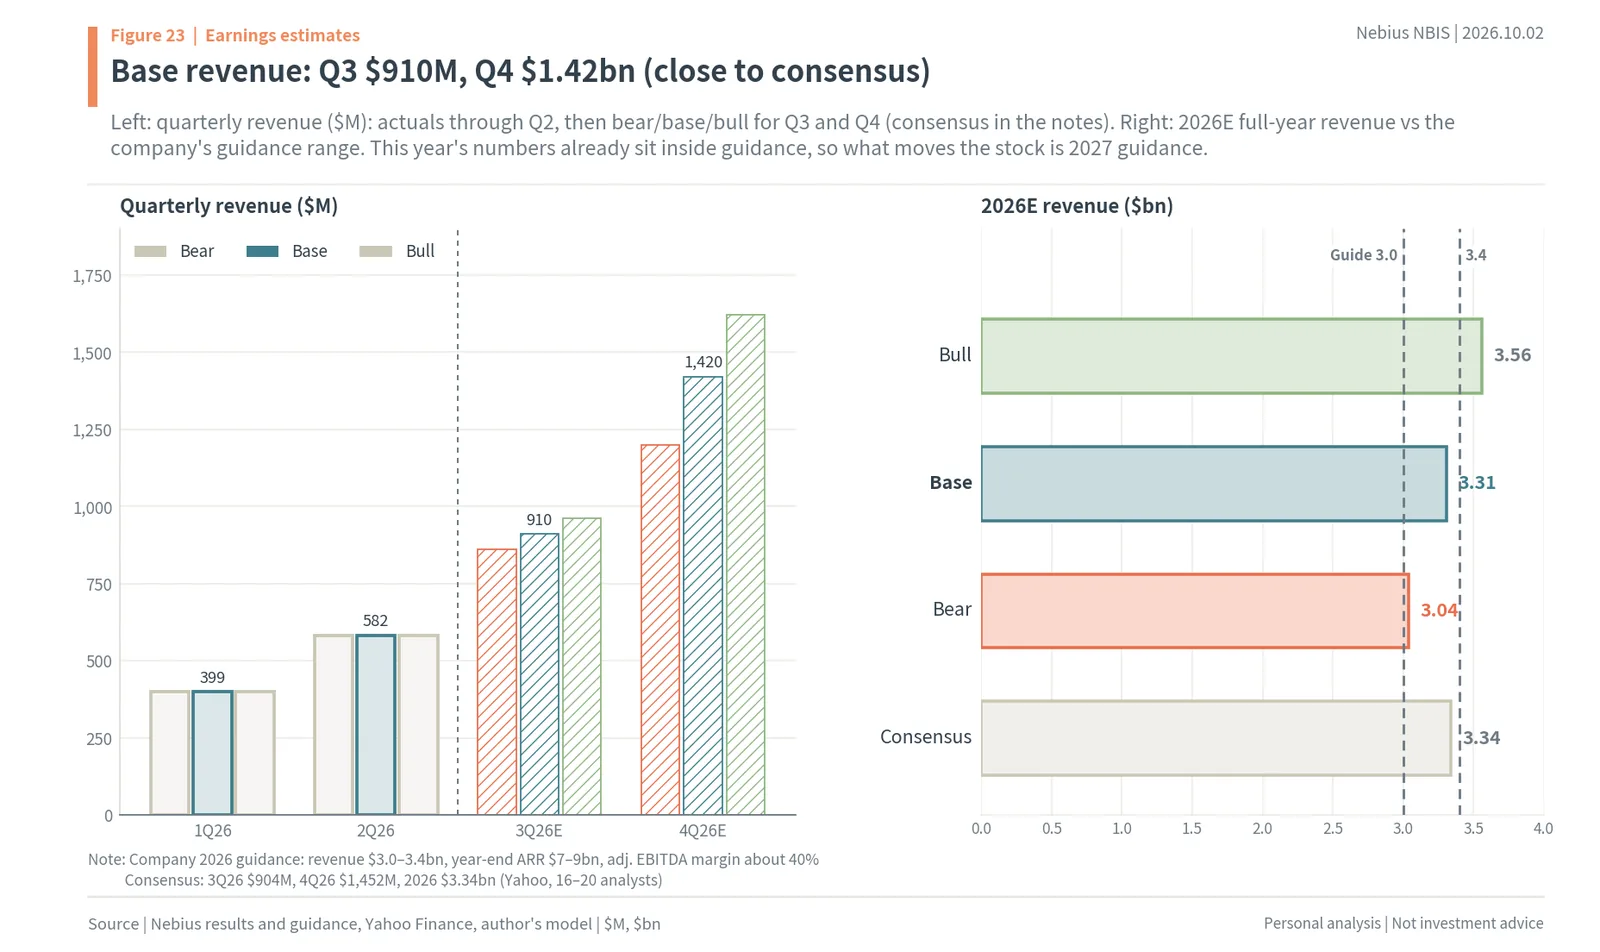
140. Prices rise in October, short-term contracts go live in Q4 and 2027 guidance comes this year, so the next three months are when expectations turn into numbers.
11. Risks: Funding, Dilution and the CoreWeave Mirror
141. The biggest hurdle is money.
142. This year’s capex guidance of $20–25bn is about seven times revenue guidance of $3.0–3.4bn.
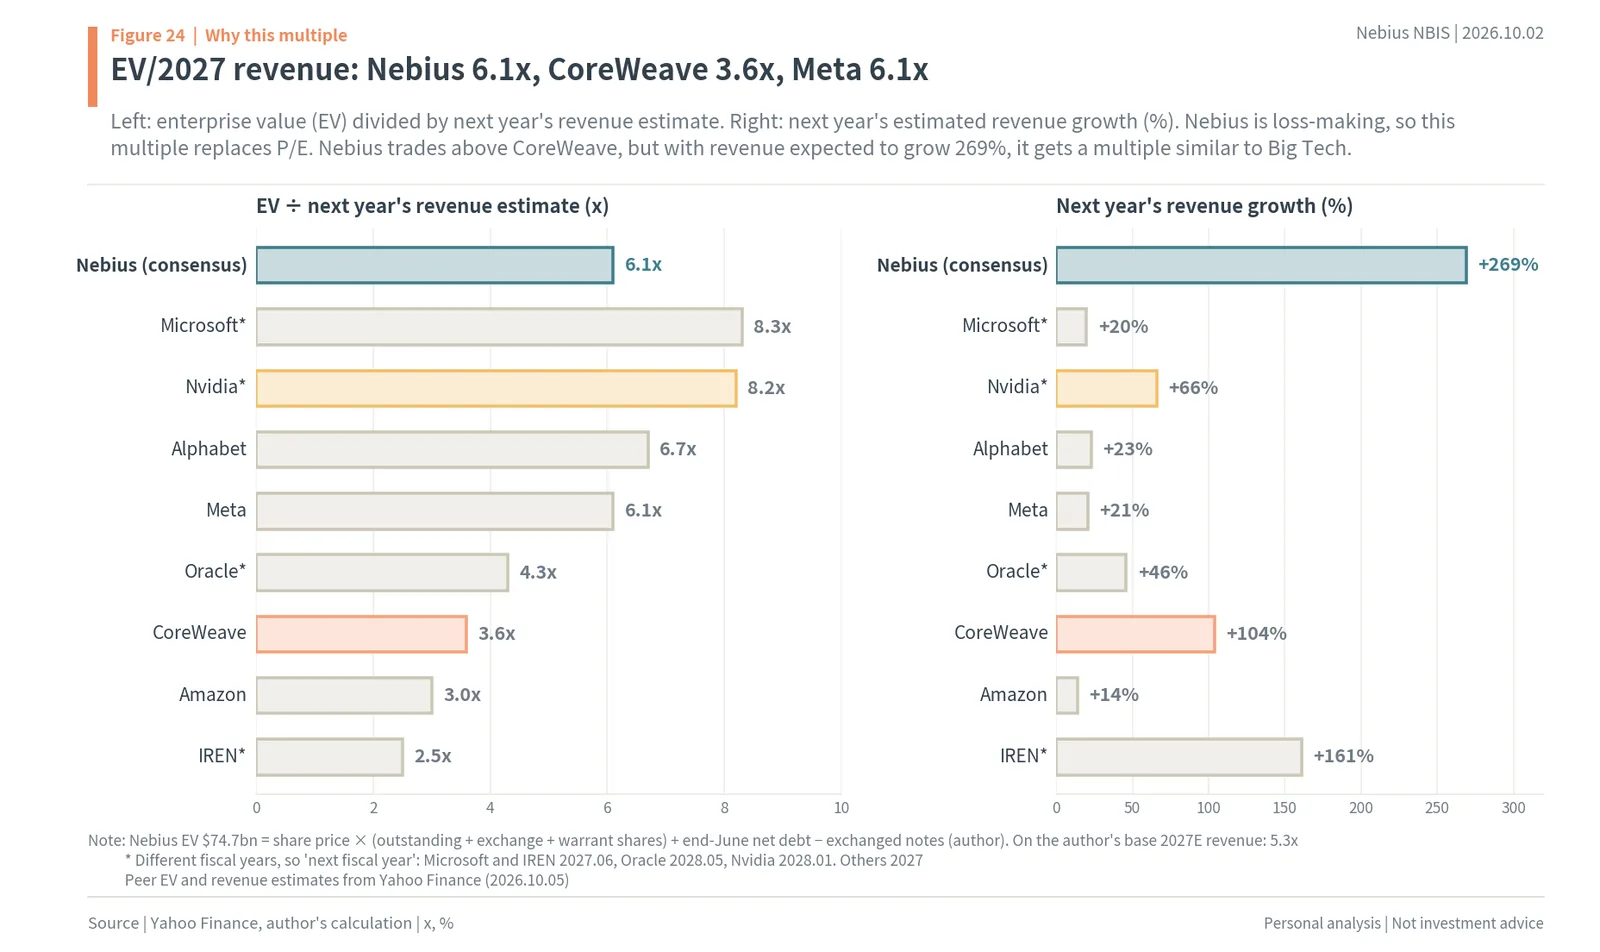
143. Building 1GW with Vera Rubin costs about $47.4bn, so adding 1GW every year means funding that much every year (author’s calculation at Bernstein’s unit costs).
144. The company said about 70% of contracts fund 50–60% of capex through prepayments, and that in July it took its first loan of $775M secured by GPUs and contracts.
145. Even so, the rest has been funded with convertible notes and new shares.
146. As a result, the share count has grown.
147. On top of 271.86M shares outstanding at the end of June came 15.8M shares from the August note exchange and 21.07M from Nvidia’s warrants.
148. Adding 50.5M shares from convertible notes likely to convert at today’s price (conversion prices $51.45–183.22) plus options and RSUs gives 372.2M shares at the current price, 36.9% more than at the end of June.
149. If the August 2026 notes, whose conversion prices are above today’s price, and the remaining at-the-market (ATM) sales were all converted too, the count would be 402.6M shares.
150. The August shareholder meeting authorized the board to issue new shares of up to 20% of shares outstanding over the next five years.
151. CoreWeave, which went down the same road first, is a good mirror.
152. CoreWeave’s spread on GPU-backed loans rose from SOFR+2.25% in March to +5.5% in August, and its stock is down 34.6% over a year.
153. CoreWeave’s largest customer accounted for 67% in 2025, while Nebius is less concentrated at 24% in Q2, though its top three customers make up 59%.
154. As the report that Meta is preparing a cloud to sell its spare computing capacity shows, there is also a risk that a big customer becomes a competitor.
155. There are opposing views too: Rothschild & Co Redburn started coverage on September 21 with a sell rating (target $84), citing worries about falling GPU prices.
156. If prices fall back to the baseline, this is a business where 1MW loses money, funded by debt and new shares, and that is as big a risk as the expectations are a reward.
12. Nebius Earnings Estimates 2026–2028 (Author’s Model)
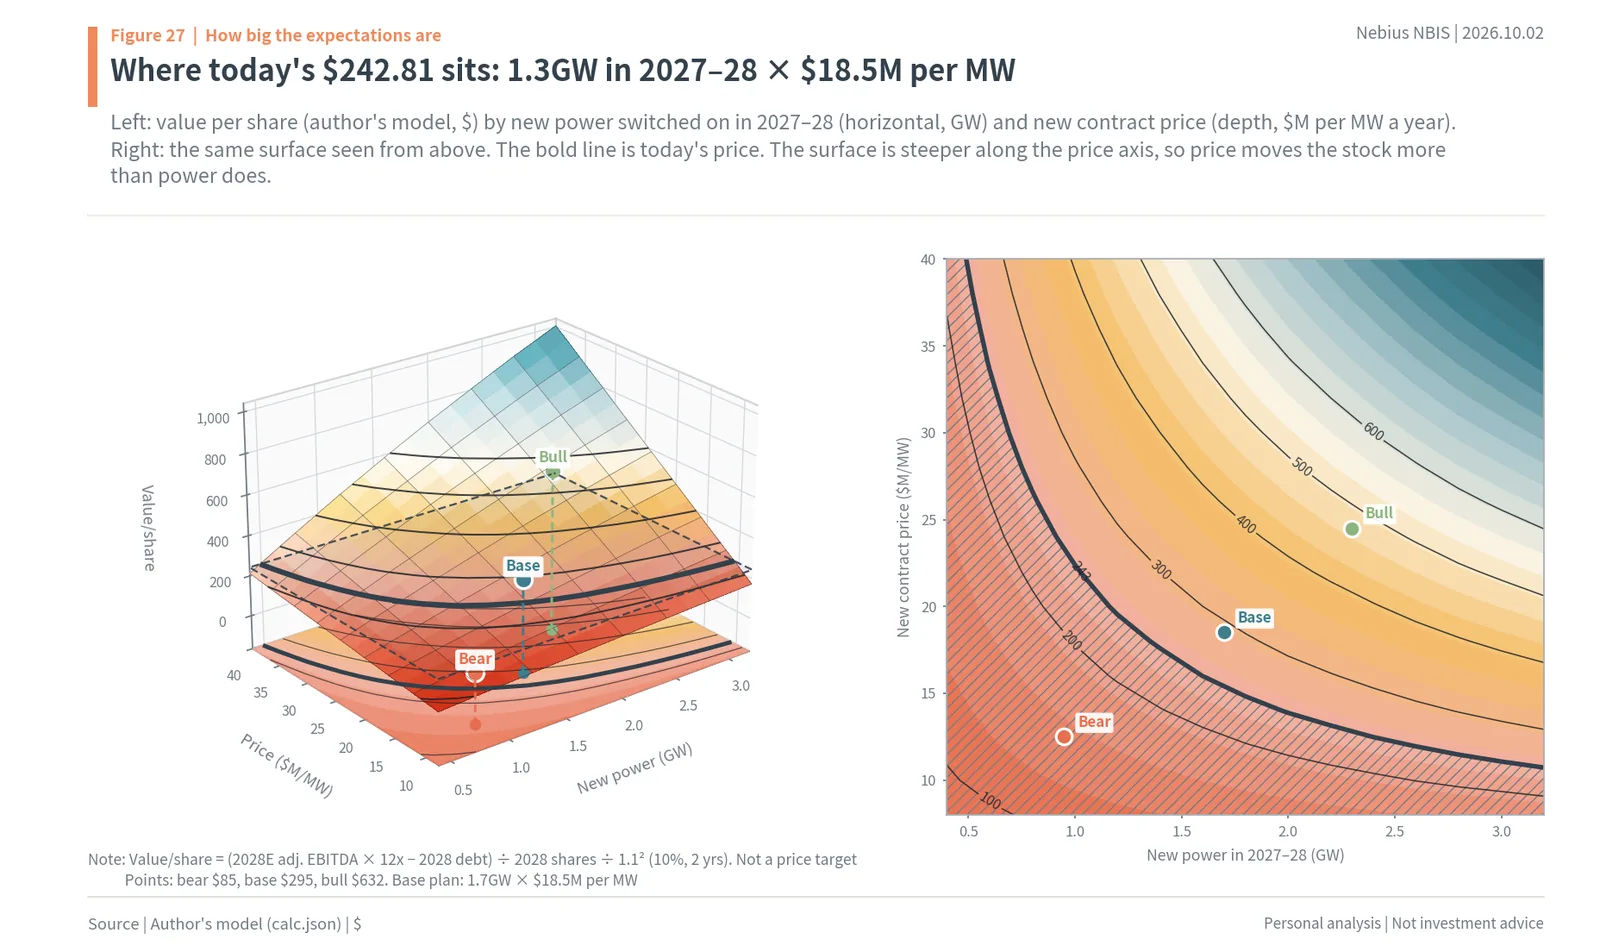
157. In the author’s model, revenue is “year-end ARR + newly switched-on MW × new price × months live.”
158. The base assumptions are ARR of $8bn at the end of 2026, with 0.7GW of new capacity going live in 2027 and 1.0GW in 2028.
159. New prices are set at $19M and $18M per MW, and adjusted EBITDA margins at 52% and 57%.
160. The bear case is the shortage easing, so the new price falls to $11M in 2028 and existing contracts renew 10% lower.
161. The bull case switches on 1.0GW and 1.3GW at prices of $24M and $25M.
162. Base revenue grows from $3.31bn in 2026E to $13.98bn in 2027E and $29.40bn in 2028E.
163. 2027E revenue is 14% above Yahoo’s consensus of $12.3bn (21 analysts, range $8.81–17.99bn).
164. Base adjusted EBITDA is $7.27bn in 2027E and $16.76bn in 2028E.
165. But depreciation and interest are large, so EPS is only -$1.16 in 2027E and $2.92 in 2028E.
166. For the remaining two quarters of this year, the base case is Q3 revenue of $910M and Q4 revenue of $1.42bn.
167. That is almost the same as consensus ($904M for Q3, $1.452bn for Q4), and the 2026 total of $3.31bn is within the company’s guidance of $3.0–3.4bn.
168. This year’s numbers are already within guidance, so what will move the stock is whether 2027 guidance beats the $12.3bn consensus.
13. Why This Multiple: EV/Revenue and EV per GW
169. The third question is whether today’s valuation (multiple) is justified.
170. Nebius is loss-making, so instead of P/E we use enterprise value (EV) divided by next year’s revenue.
171. The author’s EV is about $74.7bn: the share price times outstanding, exchange and warrant shares, plus net debt at the end of June.
172. EV/2027 revenue is 6.1x on consensus and 5.3x on the author’s base case.
173. CoreWeave is at 3.6x, Meta 6.1x, Alphabet 6.7x and Amazon 3.0x (Yahoo; fiscal year-ends differ).
174. With 2027 revenue expected to grow 269%, Nebius gets a higher multiple than CoreWeave (104%), in the author’s view.
175. Measured by power, the picture changes.
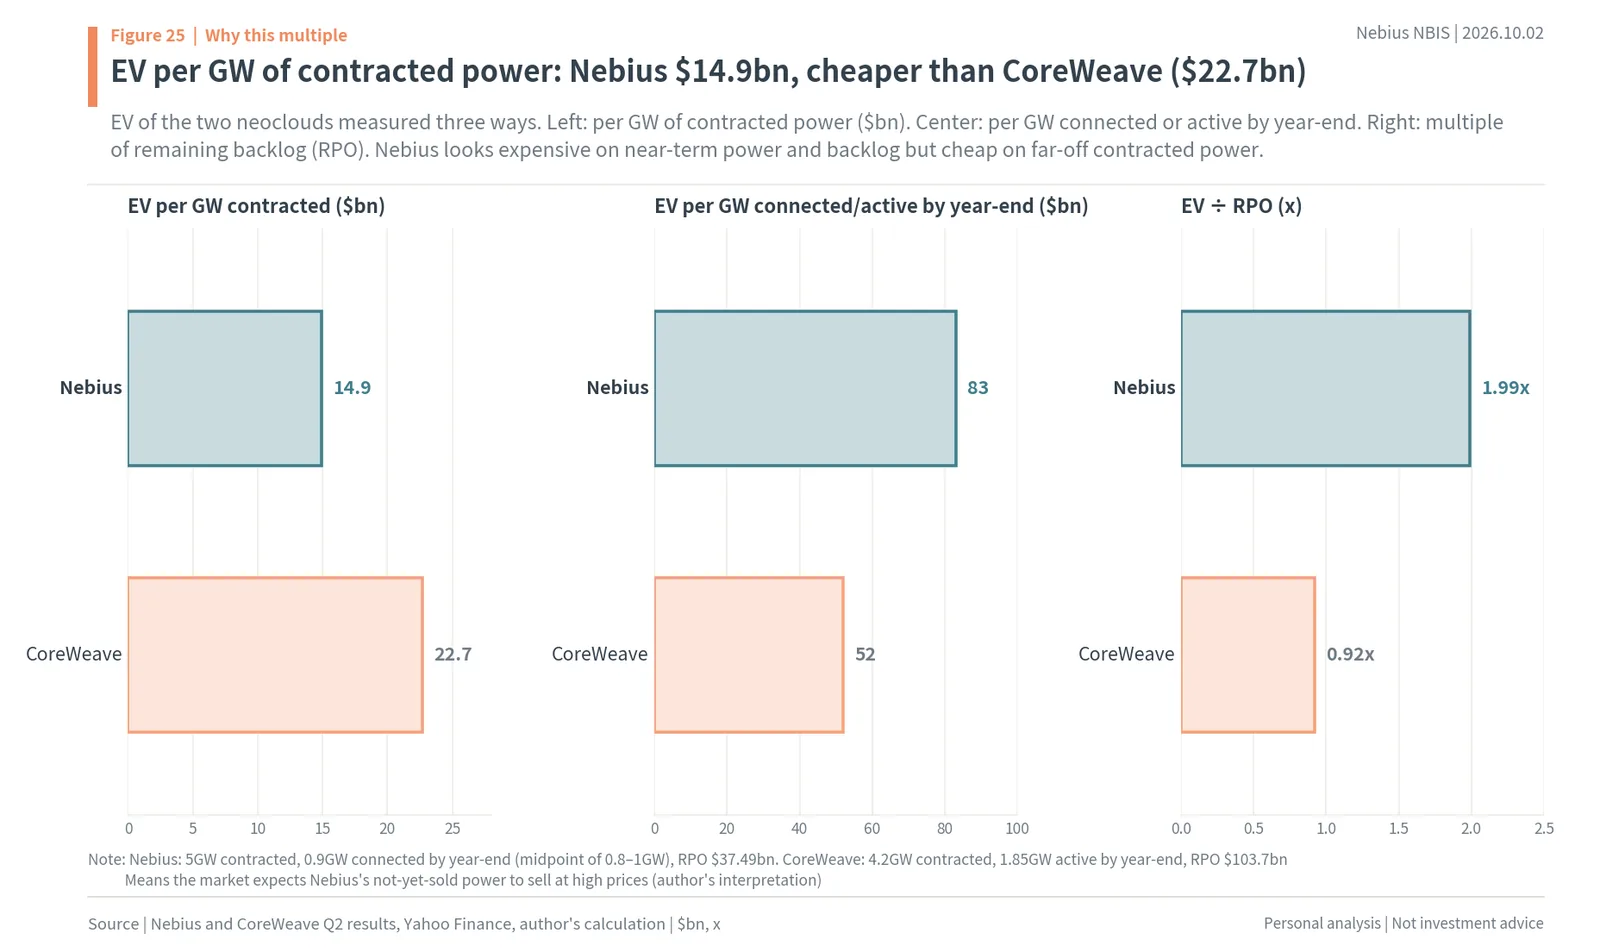
176. EV per GW of contracted power is $14.9bn for Nebius, cheaper than CoreWeave ($22.7bn).
177. Per GW connected or active by the end of this year, by contrast, Nebius is more expensive at $83bn versus CoreWeave’s $52bn.
178. Relative to remaining backlog (RPO), Nebius is also more expensive at 1.99x versus CoreWeave’s 0.92x.
179. The market is paying for Nebius’s “not-yet-sold power” to sell at today’s prices or higher, which is why price increases are what defends this multiple.
14. How Much Is Priced In at $242.81
180. Finally, we measure what the expectations are worth if they come true and how much today’s share price has priced in.
181. Selling all of 1GW at the Q2 price ($22.5M per MW) works out to annual net income of about $6.3bn, or $16.81 per share.
182. The assumptions are half of capex funded with debt at 6% a year, a 20% tax rate and 372.2M shares.
183. Selling the same 1GW at the short-term price ($45M) gives $65.17 per share, and at the baseline ($12M) -$5.76 per share.
184. Today’s price of $242.81 equals 0.58 of “1GW sold at the Q2 price” on a 25x P/E, or 0.72 on 20x.

185. Bringing time into it, we take value per share as 2028E adjusted EBITDA times 12, minus debt, discounted back two years at 10% a year (author’s assumption).
186. On that basis, today’s share price equals a path of selling 1.3GW of new power in 2027–28 at $18.5M per MW.
187. That means 76% of the author’s base case (1.7GW), which is close to the company’s plan, is already in the price.
188. With the same 1.7GW, the price per MW could fall to $15.4M and still match today’s share price.
189. The surface is steeper along the price axis, meaning that for the same power, price moves the stock more.
190. To rise further, the author thinks Nebius has to show in the numbers either that it is switching on faster than planned (power) or that it is holding prices at or above Q2 levels (price).
15. Dates and Signals to Watch
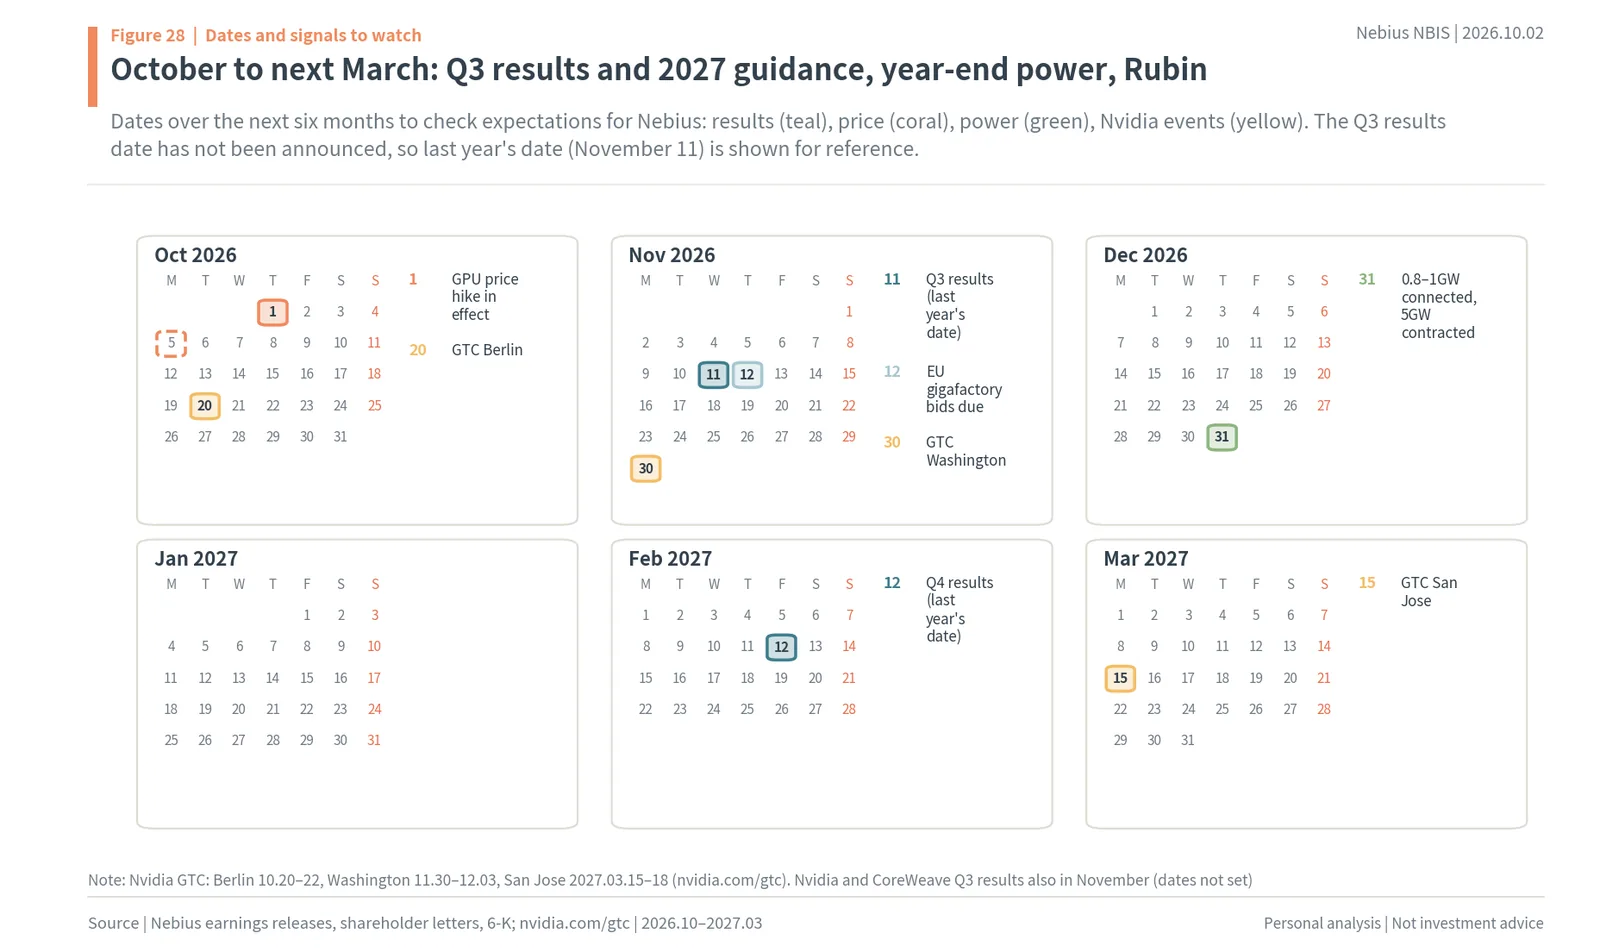
191. The Q3 results date has not been announced yet; last year it was November 11.
192. What to watch then is ARR at the end of September, short-term contract prices and 2027 guidance.
193. At year-end, we will check whether 0.8–1GW connected and 5GW contracted were actually met.
194. Nvidia GTC Washington (November 30–December 3) and San Jose next March are where we can check the pace of Vera Rubin supply.
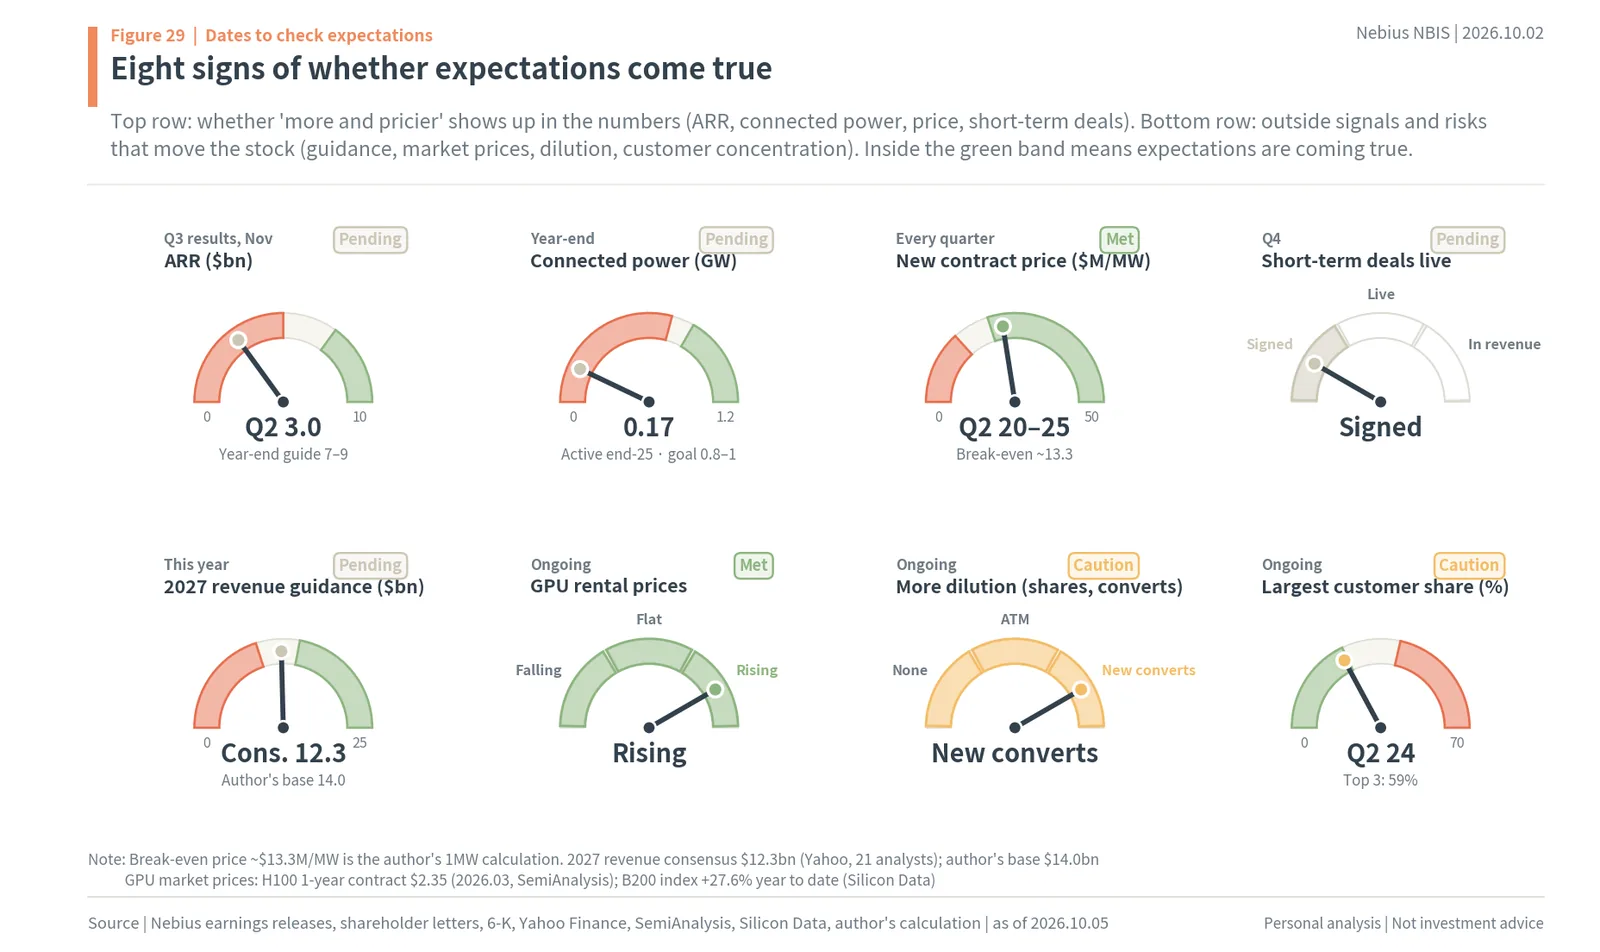
195. The top row of the gauges shows whether “more and pricier” is confirmed in the numbers (ARR, connected power, price, short-term contracts).
196. The bottom row shows outside signals and risks (2027 guidance, GPU market prices, dilution, customer concentration).
197. The author would read new contract prices below the $13.3M-per-MW break-even as a sign that expectations are breaking.
198. If new convertible notes or a large share issue appear, each share’s slice shrinks even with the same expectations.
199. Two numbers, 2027 guidance and short-term contract prices, are likely to set the direction of the share price over the next three months.
16. Summary
Maochaedung’s take
Thanks to the GPU shortage, Nebius is growing both its prices and its power. It raised GPU prices twice this year (+53–56% cumulative), new large contracts are priced at $20–25M per MW a year, about twice the baseline, and its year-end contracted power goal went from 1GW to 5GW in one year. The 1MW math shows that at the baseline price the equipment does not pay for itself within its life, while at the Q2 price it pays back in 2.2 years, so price is both the biggest catalyst and the biggest risk for this company. After Big Tech, nations (sovereign AI) are growing as the next customer, and Nvidia has named Nebius as one of the channels, but governments demand discounts and the only government business actually won so far is in Israel, so nations add to “more” but collide with “pricier.” Today’s share price already prices in selling about 1.3GW in 2027–28 at $18.5M per MW, so the author thinks the stock can climb another step only if Q3 results and 2027 guidance show faster switch-on and price discipline, government contracts priced above break-even appear, and funding becomes less dilutive.
Nebius (NBIS) Stock FAQ
Q. Why did Nebius raise its GPU prices?
GPUs are in short supply: even as the four Big Tech companies plan $735–750bn of capex this year, H100 rents rebounded from $1.70 to $2.35. Nebius raised on-demand prices on June 1 (about 29% on average) and October 1 (16.9% for H100, 21.0% for B300), up 53–56% cumulatively this year.
Q. How much does Nebius earn per MW?
In the author’s calculation, 1MW sold at the $12M baseline makes a $1.3M annual operating loss, while at the Q2 large-deal price of $22.5M it makes a $9.2M operating profit. The break-even price is about $13.3M per MW a year.
Q. Who are Nebius’s biggest customers?
Microsoft ($17.4bn over five years, $19.4bn with add-ons) and Meta (about $3bn in November 2025 and up to $27bn in March 2026). Three unnamed customers made up 24%, 21% and 14% of Q2 revenue.
Q. Is sovereign AI a big opportunity for Nebius?
Nvidia’s sovereign revenue tripled to over $30bn and Nvidia named Nebius as a channel, but governments ask for discounts. Taking 10% of about $17bn of sovereign cloud spending outside China and North America would mean $1.7bn of revenue: -$0.80 per share at a discounted $12M per MW, +$1.28 at the Q2 price.
Q. How much is priced into Nebius stock at $242.81?
In the author’s model, today’s price equals switching on about 1.3GW of new power in 2027–28 at $18.5M per MW, about 76% of the author’s 1.7GW base case. The report sets no price target; the next checks are Q3 results and 2027 guidance (consensus 2027 revenue $12.3bn).
Sources
- Nebius, Q2 2026 earnings release, shareholder letter and financial statements (6-K) (link), 2026.08.12
- Nebius, Q2 2026 shareholder letter (link), 2026.08.12
- Nebius, 2025 annual report on Form 20-F (link), 2026.04.30
- Nebius, 6-K filings on the Microsoft and Meta contracts, Nvidia investment, convertible notes and secured loan (link), 2025.09–2026.10
- Nebius, GPU price list (https://nebius.com/prices, https://docs.nebius.com/compute/resources/pricing), accessed 2026.10.05
- Motley Fool, Nebius Q2 2026 earnings call transcript (link), 2026.08.19
- Motley Fool, Nebius Is Raising the Price of Its AI Compute on Oct. 1 (link), 2026.09.27
- Investing.com (Bernstein), What it costs to deploy 1GW of Nvidia Vera Rubin infrastructure (link), 2026.06.12
- SemiAnalysis, The Great GPU Shortage (link), 2026.04.02
- Synergy Research Group, neocloud market forecast (link), 2026.04.02
- Data Center Knowledge, power connection delays for AI data centers (link), 2026.05.12
- The Coin Republic, Nebius stock jumps as Nvidia GPU rates rise (link), 2026.09.17
- CoreWeave, Q2 2026 results (link), 2026.08.11
- Nvidia, fiscal 2026 and 2027 earnings call transcripts (link), 2026.02.25 and 2026.08.26
- w.media (citing Gartner), Worldwide sovereign cloud IaaS spending will total US$80 billion in 2026 (link), 2026.02.12
- EuroHPC, AI gigafactories call for expression of interest and specifications (link), 2026.07.30
- Nebius, 6-K on the Palantir sovereign AI partnership (link), 2026.09.08
- The Register, Microsoft admits it cannot guarantee data sovereignty (link), 2025.07.25
- Dailian, Samsung SDS consortium selected for Korea’s National AI Computing Center (link), 2026.05.11
- Platformonomics, Follow the capex: Q2 2026 scoreboard (link), 2026.07.31
- Silicon Data, B200 rental price August 2026 update (link), 2026.09.24
- The Energy Mag, CoreWeave AI $2.6 billion wider spread (link), 2026.08.11
- Oracle, fiscal 2027 Q1 results 8-K, 2026.09.10
- McKinsey, European Sovereign AI: aspiration or reality? (link), 2026.06.18
- Deloitte, TMT Predictions 2026: Tech sovereignty (link), 2025.11.18
- Government of India (PIB), India’s AI Revolution (link), 2025.03.06
- Calcalist (CTech), Nebius selected for Israel’s national AI supercomputer (link), 2025.05.14
- Motley Fool, 24/7 Wall St, Investing.com and others, news on Nebius share price events (research/raw_market.md), 2024.12–2026.10
- Yahoo Finance, Nebius prices, consensus and peer data (link), 2026.10.05
Disclaimer
This post records the author’s personal analysis and views based on publicly available information and does not recommend choosing any particular product or company. It does not recommend buying or selling any financial investment product and is not a service provided as investment advisory or quasi-investment advisory business.
Figures in this post are values published as of the time of writing. This report is the detailed version of the author’s Naver post. The 1MW unit economics, profit per GW, 2026–2028 earnings estimates and “what today’s share price has priced in” are calculations from a model the author built using Bernstein’s capex estimates and company filings, not company guidance or broker consensus. Accuracy and completeness are not guaranteed.
The scenarios are estimates based on the assumptions stated in the text (half of capex funded with debt, 6% annual interest, 20% tax rate, 12x 2028 EBITDA and so on), and results will differ if those assumptions do not hold. Items marked ‘author’s calculation’ or ‘author’s estimate’ are the author’s calculations and assumptions, not confirmed facts. This post does not set a price target.
The judgments in this post are the author’s personal views; they do not recommend trading at any particular time or promise any return. Nebius reports results in US dollars, and for overseas stocks, gains and losses in your home currency change with exchange rates.
Author’s position: does not own shares
Responsibility for decisions and their outcomes lies with the reader.
As of: October 5, 2026