SK hynix (000660.KS) Foreign Selling Hits KRW 92 Trillion: Who Takes the Shares After the Buyback Ends
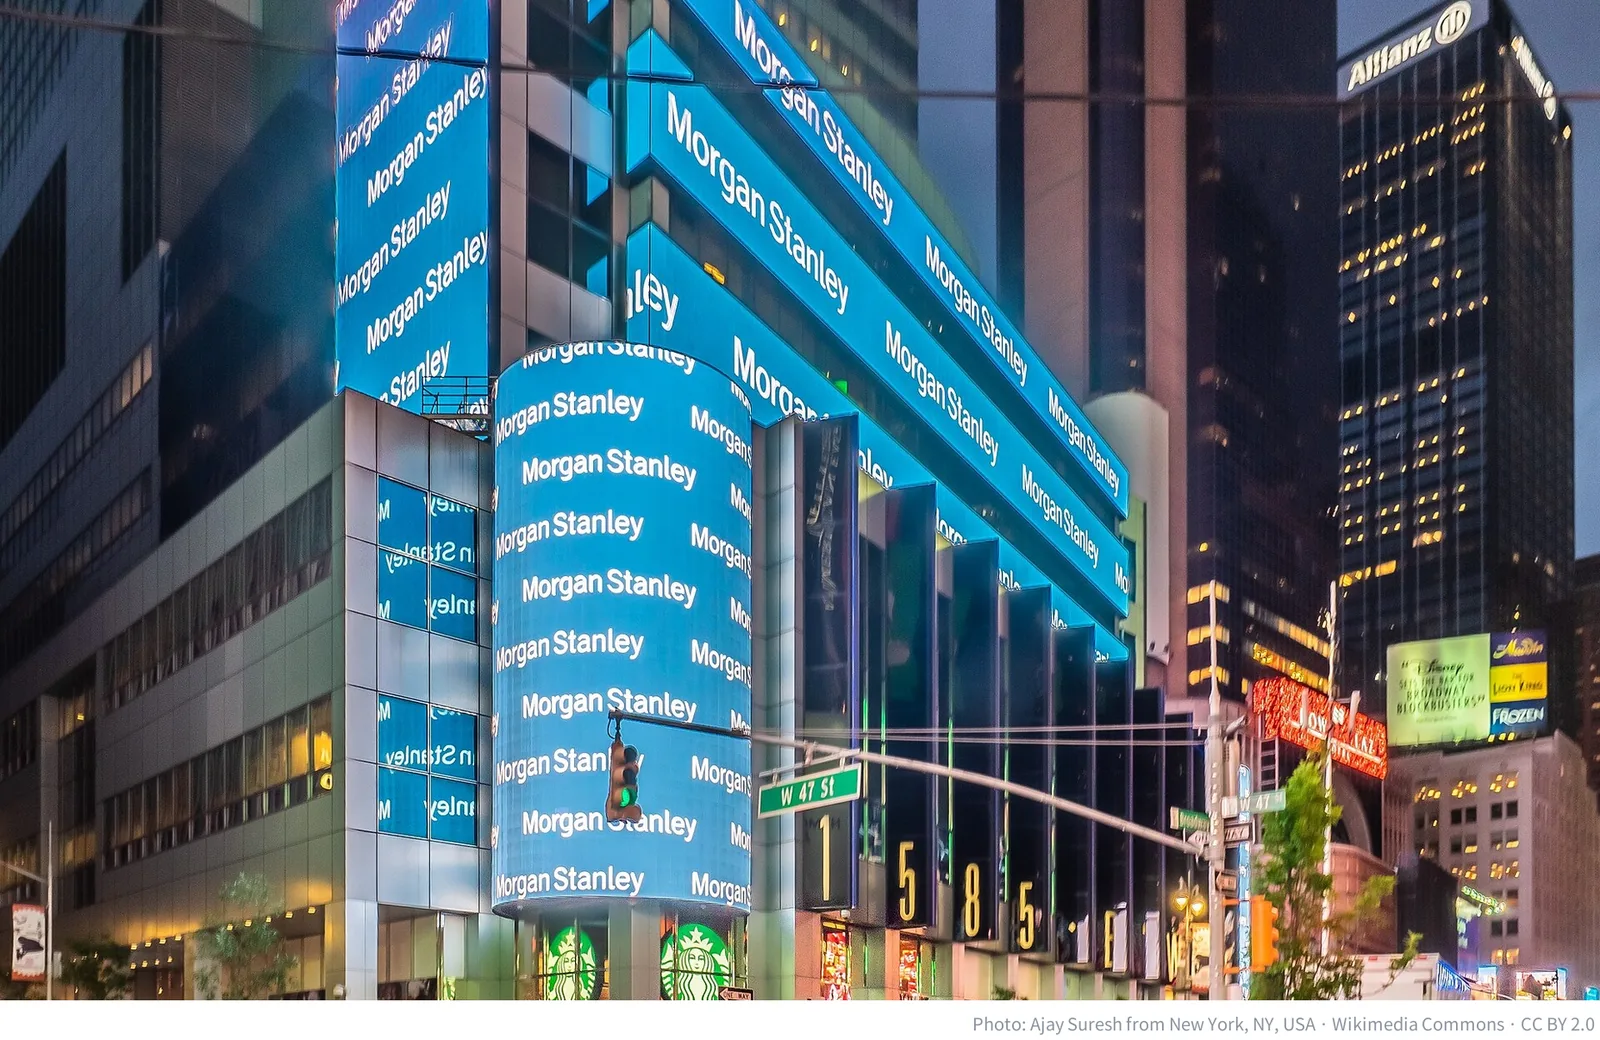
On the afternoon of August 11, 2021, New York time, Morgan Stanley published a report on memory chips titled “Memory – Winter is coming.” It argued that memory supply had peaked and was starting to exceed demand. It cut SK hynix to underweight and lowered its target price by 48.7%, from KRW 156,000 to KRW 80,000. It also cut its Samsung Electronics target from KRW 98,000 to KRW 89,000. Korean media carried the report on the morning of the 12th, and the same day Goldman Sachs kept its buy rating, saying demand was solid. On the 12th SK hynix closed down 4.74% at KRW 100,500.
The numbers from that week are still on record in the Korea Exchange’s (KRX) daily trading data by investor type. From August 9 to 13, foreign investors net sold KRW 2.02tn of SK hynix, and retail investors net bought KRW 2.14tn. Financial investment bought KRW 0.08tn and pension funds sold KRW 0.16tn. In effect, retail took the foreign selling on its own. The share price fell from KRW 116,000 on August 9 to KRW 101,500 on the 13th. Foreign ownership dropped from 48.40% on August 9 to 45.72% on the 17th. That 45.72% is the lowest foreign ownership SK hynix has had since 2017. And from that very day foreigners turned around and bought back KRW 220.4bn over five days.
In October 2026 the same picture is repeating with bigger numbers. From January 2 to October 23 this year, foreign investors net sold KRW 92.37tn (about $69.7bn) of SK hynix. So this time, how many shares do foreigners have left to sell? How much money does retail have left to buy them? And now that the company’s own buyback has ended, will institutions step in? This report answers those three questions with numbers from the KRX, the Korea Financial Investment Association (KOFIA) and DART, Korea’s electronic corporate disclosure system. The conclusion first: the shares left to sell are near the floor, and the buyers are changing.
As of: October 23, 2026 (the share price is the KRX regular-session close of KRW 1,277,000, about $964; net buying by investor type is KRX data for the same day; investor deposits and margin loans are KOFIA data for October 22). Dollar figures use KRW 1,324.86 per dollar, the October 23, 2026 rate (Yahoo Finance KRW=X). Numbers the author calculated are marked as such.
Topics covered: that week in August 2021; key terms; the three acts of this year (retail, the company, institutions); foreign holdings and the shares left to sell; the shareholder map and the Nasdaq ADR; why foreigners sell; investor deposits, margin loans and retail’s average cost; how retail buys; where each type of institution stands and the National Pension Service rule; the return capacity to be announced on October 28 and the author’s view; signals and dates to check; and the basis of calculation.
This is the author’s personal analysis and view. The author’s calculations and estimates are not confirmed facts.
August 2021: on the day foreigners had sold all they would, retail took the shares
That week in August 2021 is the reference point for reading this change of hands, because the lowest foreign ownership since 2015 came on the Tuesday after it. SK hynix closed at KRW 105,500 on August 11, the day of the report, and fell 4.74% to KRW 100,500 the next day. On the 13th it closed at KRW 101,500. Over those five days foreigners sold KRW 2.02tn and retail bought KRW 2.14tn, and foreign ownership fell to 45.72% the following Tuesday.
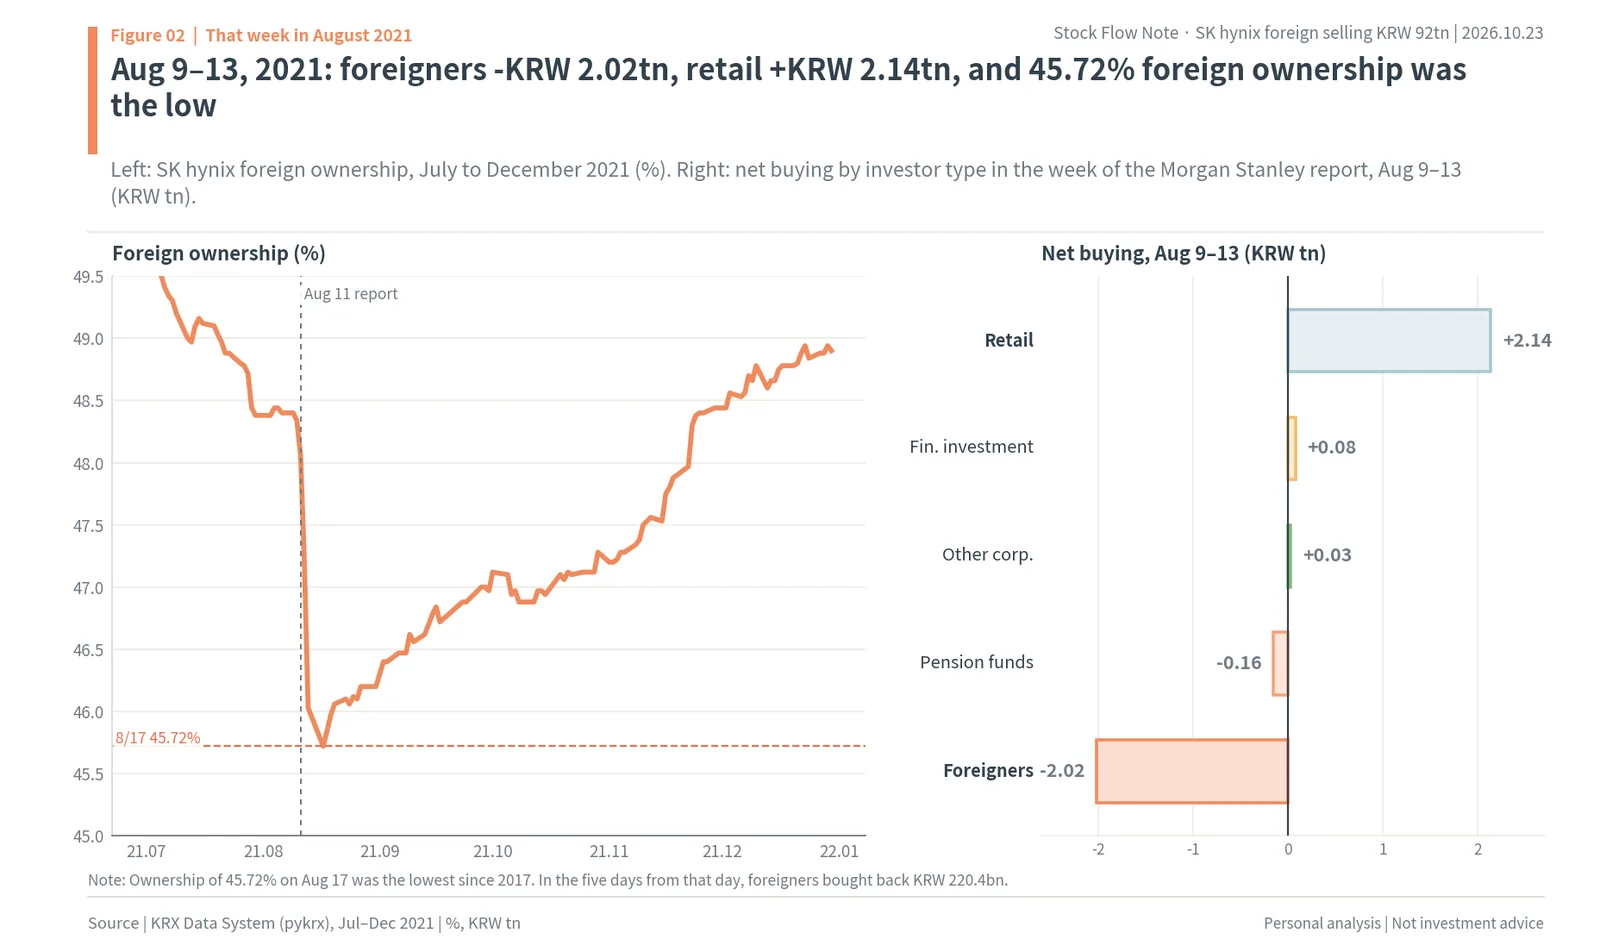
The left of the figure is foreign ownership from July to December 2021. It drops like a staircase in the week of the report, hits its low on August 17, and climbs slowly through the end of the year. The right is net buying by investor type over those five days, with the foreign bar and the retail bar facing each other at almost the same length. The share price dipped once more to KRW 91,500 on October 12, but compared with the August 17 close it was 9.9% higher three months later and 26.6% higher six months later. The day foreigners had sold all they would was the low in foreign ownership, and the buyer of those shares was retail.
This report takes two things from that episode. The first is that foreign ownership had a floor. Even with a report warning of a memory winter and halving the target price, foreign ownership stopped at 45.72% and rose again by the end of the year. The second is that retail took the shares at the bottom. After foreigners had sold all they would, retail buying made the bottom, and what lifted the price afterward was foreigners coming back. Whether the same order holds this time is what this report sets out to check.
Key terms: other corporations, financial investment, foreign ownership, ADR, investor deposits and margin loans
A few terms for reading the flows come first. Every number in this report is split along these lines.
Net buying by investor type is a statistic the KRX publishes every trading day. For each type of investor it shows the amount bought minus the amount sold that day. There are twelve types; this report looks at foreigners, retail (individuals), other corporations, and seven kinds of institutions (financial investment, insurance, investment trusts, private funds, banks, other financial institutions and pension funds). Add up one stock’s net buying across all investors and the total is zero, because whatever someone sold, someone else bought. That is why “who took what foreigners sold” can be counted in numbers rather than guessed. Korea counts large sums in jo (one trillion won) and eok (100 million won); this report shows them as KRW tn and KRW bn.
Other corporations are ordinary companies that are not financial firms. When a company buys its own shares on the market through a broker, the purchase shows up in this column. Most of the other-corporation buying of SK hynix from August to October was SK hynix’s own buyback. Financial investment means securities firms. It includes their trading with their own money and the trading of ETF liquidity providers (LPs) when they create or redeem ETF units. When retail investors buy an ETF, much of that money appears as share buying by financial investment. Investment trusts are asset managers running public mutual funds, and pension funds are pensions and public funds such as the National Pension Service (NPS).
Foreign ownership is the share of listed stock held by foreigners, and the KRX publishes it daily. Even with the same number of shares, the ratio falls when the company issues new shares and rises when it cancels treasury shares. That is why this report looks at share counts alongside the ratio.
An ADR (American depositary receipt) is a certificate traded in the U.S. that represents shares of a foreign company held by a U.S. bank. SK hynix listed ADRs on the Nasdaq under the ticker SKHY in July 2026, and one SKHY share equals 0.1 common share. The common shares held by the depositary count as foreign holdings in KRX statistics.
Investor deposits are the cash that retail investors and institutions keep in brokerage accounts to buy stocks. They fall when investors buy and rise when investors sell or add new money. Margin loans are the balance of stocks bought with money borrowed from brokers. If prices fall and the collateral runs short, the broker sells the shares by force; in Korea this is called a forced sale (bandaemaemae). KOFIA publishes both numbers with a one-day lag. The KOSPI, finally, is the main board index of the Korea Exchange, where SK hynix and Samsung Electronics are the two largest stocks (the index’s level against earnings is tracked on the KOSPI valuation page).
Foreigners’ KRW 92.37tn of selling this year was taken by retail in act one and the company in act two, and institutions opened act three
To start with the conclusion, “foreigners sell and retail buys” was true only until July. Over the 197 trading days from January 2 to October 23, foreigners net sold KRW 92.37tn of SK hynix. Ranked by size, the buyers were retail with KRW 42.19tn (about $31.8bn), the company (other corporations) with KRW 41.26tn and institutions with KRW 8.64tn. Measured against what foreigners sold, retail took 45.7%, the company 44.7% and institutions 9.4%. Retail and the company took almost half each, but at completely different times.
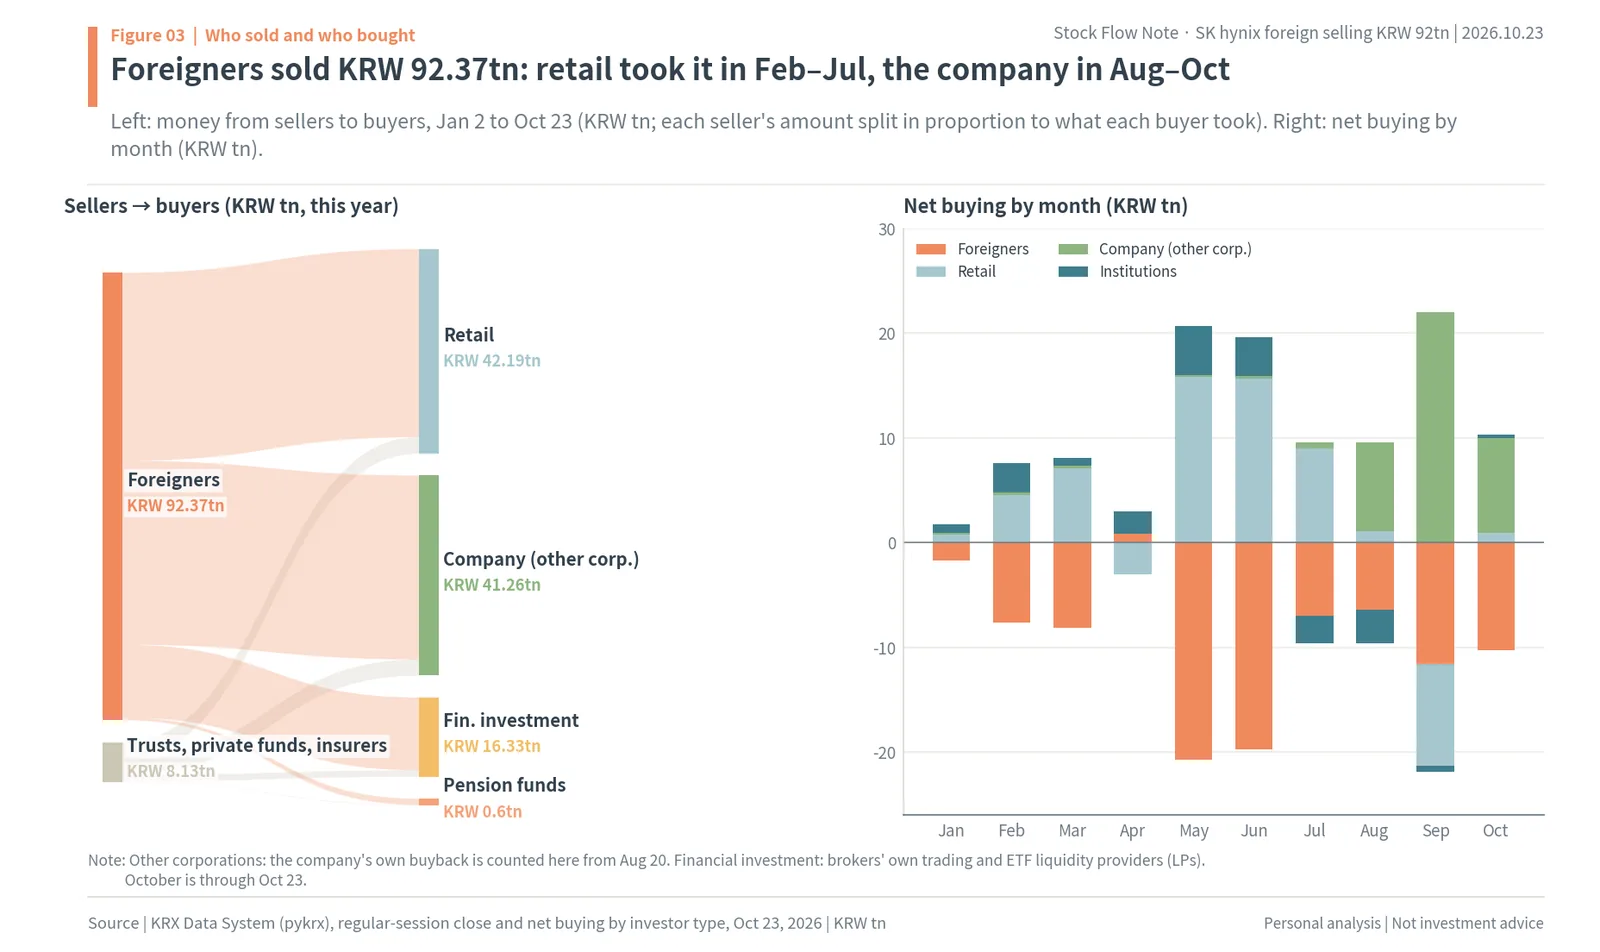
The left of the figure draws in one picture the money that went from sellers to buyers this year. On the selling side are foreigners with KRW 92.37tn and investment trusts, private funds and insurers; on the buying side are retail, the company, financial investment and pension funds. The right is net buying by month. From February to July, retail’s light blue bars stand almost as tall as the foreigners’ coral bars. From August to October the company’s green bars take that place instead.
Act one: January 2 to August 19 belonged to retail
Act one runs for 154 trading days, from January 2 to August 19, the day before the company started its buyback. In this period foreigners sold KRW 66.17tn, while retail bought KRW 53.26tn and financial investment KRW 16.60tn. Investment trusts sold KRW 5.21tn. Financial investment’s buying includes the shares that liquidity providers bought to create the ETFs retail investors purchased, so the support in act one was in effect retail money. SK hynix rose from KRW 677,000 on January 2 to KRW 1,500,000 on August 19, with this year’s high of KRW 2,919,000 on June 22.
By month, May and June were the peak. Foreigners sold KRW 20.72tn in May and KRW 19.71tn in June, and retail bought KRW 15.87tn in May and KRW 15.63tn in June. Investor deposits also hit their high for the year, KRW 139.69tn, on June 4. Foreigners sold the most when retail had the most cash.
A new product also helped retail buying in act one. On May 27, single-stock leveraged ETFs on SK hynix and Samsung Electronics were listed; they track twice the daily move of the stock. The Korea Capital Market Institute counted KRW 4.6tn of retail net buying of SK hynix leveraged ETFs from May 27 to June 19. That money passes through liquidity providers’ buying of shares and futures and lands in the financial investment column. Financial investment’s net buying of SK hynix in the same period was KRW 3.08tn.
Act two: August 20 to October 21 belonged to the company
Act two covers the 41 trading days of the KRW 40tn (about $30.2bn) buyback the company resolved on August 19. The resolution was for 24.07 million common shares worth KRW 40.0043tn, to be bought between August 20 and November 19 for cancellation. In this period foreigners sold KRW 25.66tn, and other corporations, where the company’s purchases are counted, bought KRW 39.67tn, equal to 99.2% of the resolved amount. Retail, by contrast, sold KRW 11.26tn, and institutions also sold KRW 2.68tn.
The company took not only the foreign selling but also what retail sold. In September alone other corporations net bought KRW 21.98tn while retail net sold KRW 9.69tn. In the last 20 trading days of act two (September 21 to October 21) the company bought an average of KRW 820.6bn a day. The share price fell from KRW 1,691,000 on the first day of act two to KRW 1,294,000 on the last. The price fell even while the company was buying KRW 800bn a day because foreigners and retail were both selling.
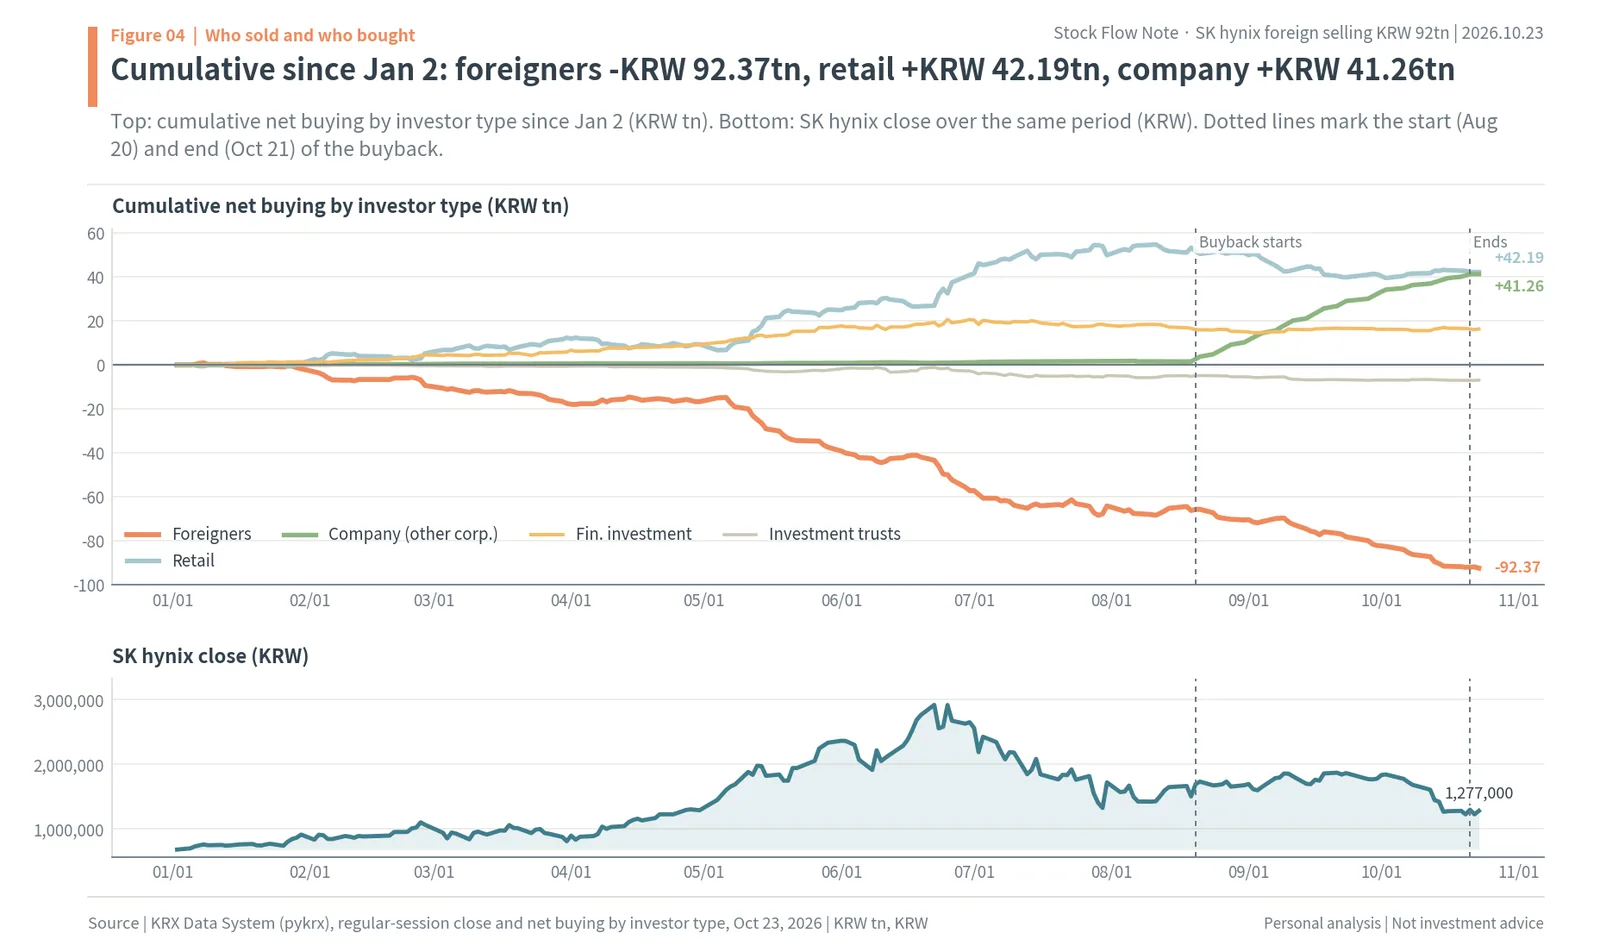
The top of the figure stacks each investor type’s daily net buying from January 2. The foreign line falls steadily to KRW 92.37tn, while the retail line rises until the end of July and turns down from August. The company line stands up abruptly at the vertical dotted line on August 20 and climbs to KRW 41.26tn. Cumulatively from January 2 to October 23, foreigners are at -KRW 92.37tn, retail at +KRW 42.19tn and the company at +KRW 41.26tn. The bottom is the closing price over the same period.
In October alone, retail’s share is KRW 0.97tn
The impression that “retail is buying” probably comes from a few days in October. On October 13 retail bought KRW 1.15tn, and on October 15 KRW 513.2bn. But adding up the 15 trading days from October 1 to 23, retail net buying was only KRW 0.97tn of the KRW 10.31tn foreigners sold. The company took the rest. Foreigners sold an average of KRW 687.2bn a day in October.
Act three: on the first day after the buyback, institutions took the shares
Other corporations net bought KRW 30.3bn on October 22 and -KRW 18.0bn on the 23rd. The company buying of KRW 800bn a day was gone. On the 22nd foreigners also net bought KRW 30.8bn, and trading was quiet. On the 23rd foreigners sold KRW 564.6bn (about $426mn) again. This time the buyer was not retail but institutions, which bought KRW 596.1bn (about $450mn): financial investment KRW 244.6bn, investment trusts KRW 140.7bn, private funds KRW 102.9bn, pension funds KRW 72.3bn and insurance KRW 32.9bn were all net buyers, while retail sold KRW 13.4bn. SK hynix rose 4.42% to KRW 1,277,000. The KOSPI rose 0.30% the same day.
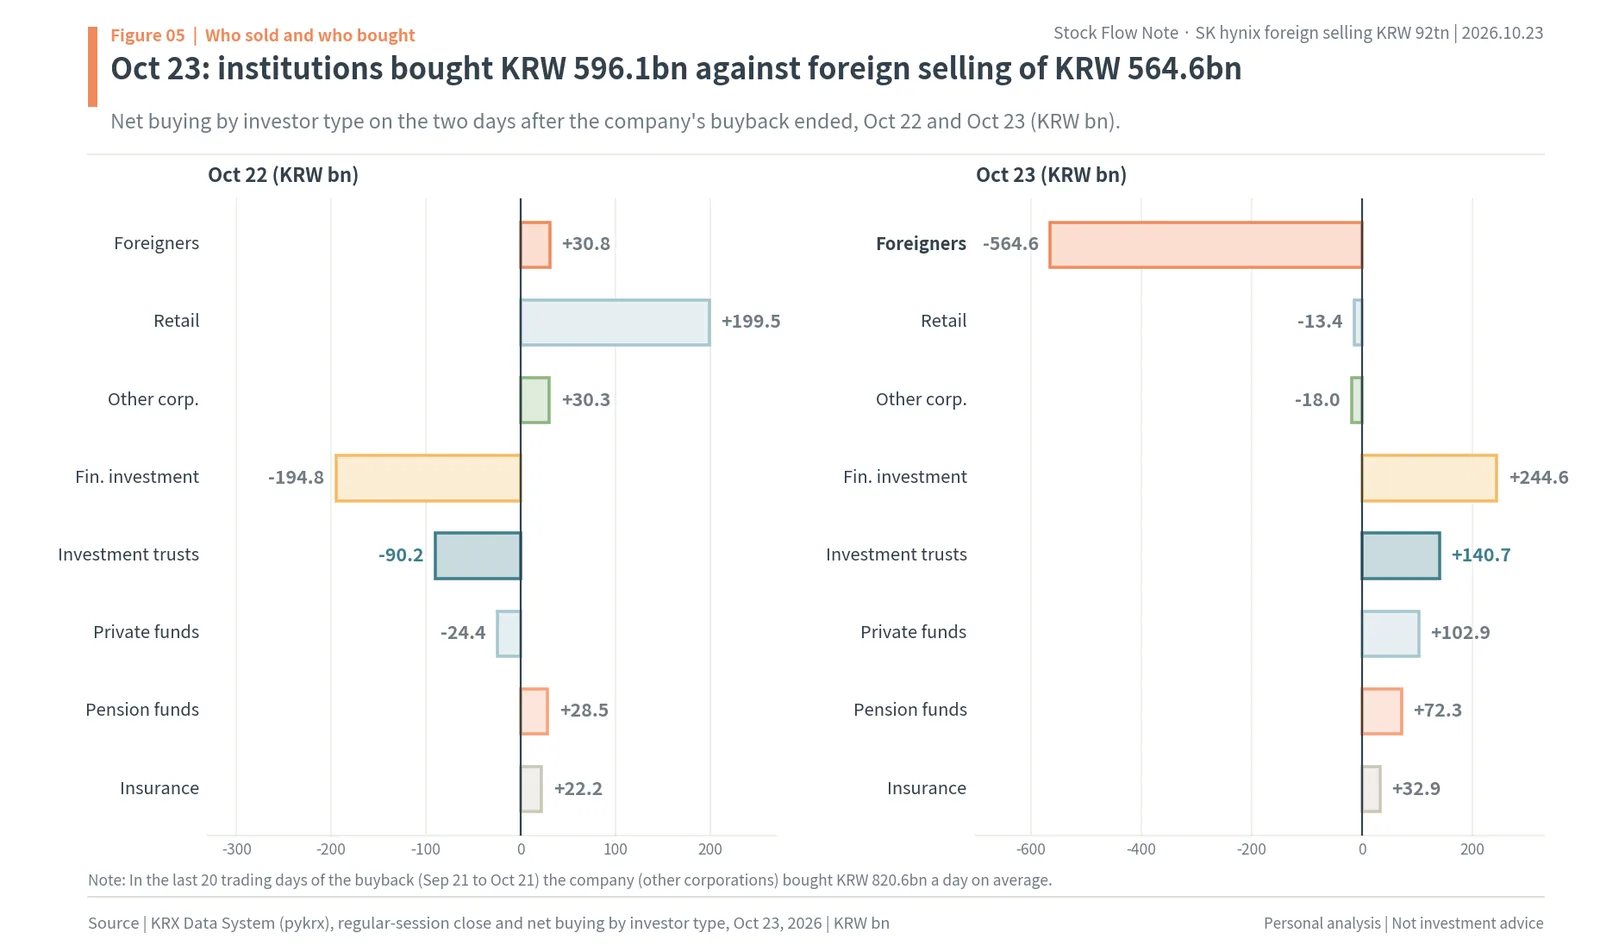
The figure shows net buying by investor type on the two days after the buyback ended. On the 22nd all the bars are short; on the 23rd the long coral foreign bar faces a row of bars from each type of institution. The first to fill the place the company left was institutions. That is why this report splits the year into three acts: act one retail, act two the company, and act three from October 22.
The foreign Seoul stake is 46.33%, leaving 5.57mn shares, or KRW 7.11tn, above the 2021 low
The conclusion of this chapter is that the shares foreigners can still sell in Seoul are fewer than they look. On October 23 foreigners held 356.24 million SK hynix shares, 48.78% of the 730.49 million listed. At the October 23 close of KRW 1,277,000 that is KRW 454.92tn (about $343.4bn). On these numbers alone foreigners still hold almost half the company. But this includes shares that cannot be sold on the Seoul market.
SK hynix listed American depositary receipts (ADRs) on the Nasdaq in July 2026. The ticker is SKHY, and one ADR is 0.1 common share. The 17.79 million new common shares issued for the listing are held by Citibank, the U.S. depositary, and count as foreign holdings in KRX statistics. Indeed, the number of foreign-held shares in KRX data jumped by more than 18 million in a single day, from 355.50 million on July 15 to 373.74 million on July 16. These 17.79 million shares (2.44% of listed shares) are traded only by U.S. holders of the ADRs on the Nasdaq and never come to the Seoul market as supply.
Excluding the ADR shares, foreigners’ Seoul holdings are 13.6% smaller than in January
Excluding the ADR shares, foreigners hold 338.45 million SK hynix shares on the Seoul market, 46.33% of listed shares, worth KRW 432.20tn (about $326.2bn). On January 2 foreigners held 391.92 million shares (53.84%), so foreign holdings on the Seoul market fell by 53.47 million shares this year. That means foreigners sold 13.6% of what they held in January. By KRX trading volume by investor type, foreigners net sold 57.84 million shares this year; dividing the KRW 92.37tn of net selling by that number gives an average of KRW 1,596,955 per share (author’s calculation).
The lowest SK hynix foreign ownership since 2017 came on August 17, 2021, the day in the previous chapter. That day’s 45.72% equals 332.88 million shares. The gap to today’s 338.45 million foreign shares in Seoul is 5.57 million shares, worth KRW 7.11tn (about $5.4bn) at the October 23 close. Foreigners sold an average of KRW 687.2bn a day in October, so at that pace they would reach the 2021 low in 10.4 trading days (author’s calculation).
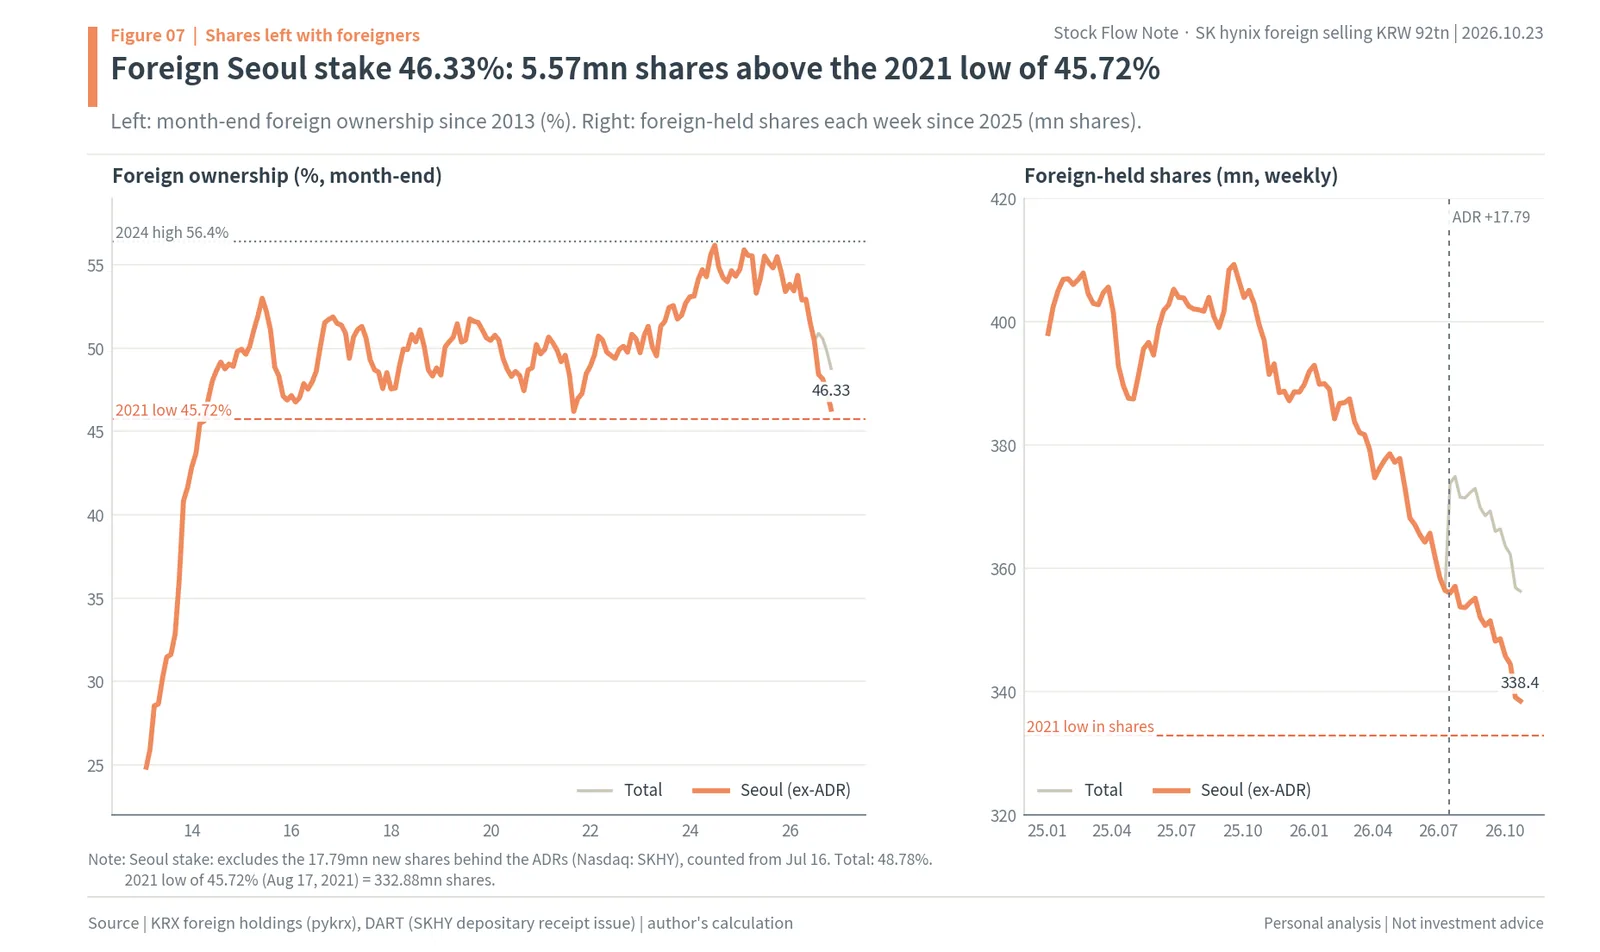
The left of the figure is month-end foreign ownership since 2013. The gray line is the ratio as KRX reports it, and the coral line is the Seoul stake excluding the ADR shares from July 16. After rising from about 24% in early 2013 to near 50% at the end of 2014, foreign ownership mostly moved between 46% and 56%. The lower dotted line is the 2021 low of 45.72%, and the upper one is the June 2024 high of 56.40%. The Seoul stake of 46.33% sits at the very bottom of that band. The right is the number of foreign-held shares at each week’s end since 2025. It jumped once when the new ADR shares arrived on July 16, then came back down to sit right on top of the 2021-low share line.
72.25mn shares below the 2024 high, 5.57mn above the 2021 low
Lining foreign holdings up by date shows the size of this round of selling. At the high on June 19, 2024, foreigners held 410.70 million shares (56.40%). On January 2, 2026 they held 391.92 million; on October 23 they held 356.24 million in total and 338.45 million in Seoul. From the 2024 high to the Seoul stake, 72.25 million shares are gone. Only 5.57 million are left above the 2021 low of 332.88 million.
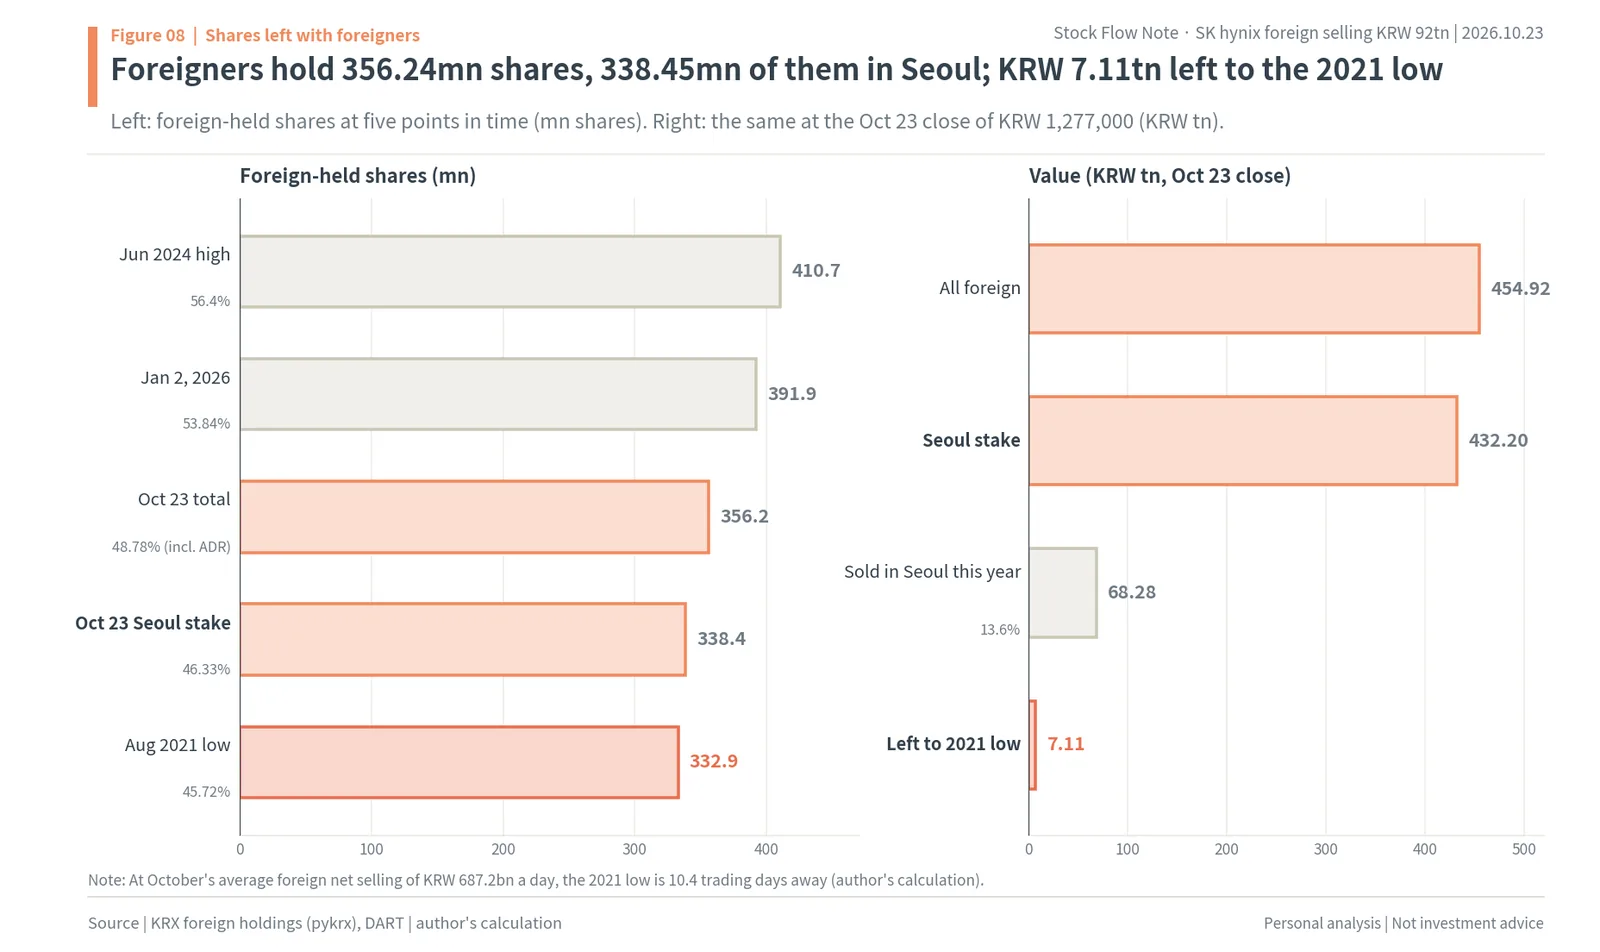
The left of the figure is the share count at these five points, and the right converts them into value at the October 23 close: all foreign holdings KRW 454.92tn, the Seoul stake KRW 432.20tn, the Seoul shares sold this year KRW 68.28tn at today’s price, and KRW 7.11tn left to the 2021 low. The point of this chapter is how short the last bar is next to the others.
The 2021 low is not a line that cannot be crossed. SK hynix foreign ownership was in the 11% range in 2008 and around 24% in early 2013, when SK hynix was not yet the bellwether chip stock it is now. Over the 11 years from 2015, the lowest value was 45.72% in 2021. Those years include the 2018 memory downturn (a low for the year of 47.40%), the 2020 COVID crash (47.10%) and the 2021 “memory winter” (45.72%). The fact that the floor of foreign ownership was 45% to 48% in every big selloff is why this report uses the 2021 low as the reference line.
Shareholder map: SK Square 20.01%, treasury shares 3.52%, other domestic holders 27.71%
Looking at the shareholders who are not foreigners shows how many shares can actually change hands in the market. The largest shareholder, SK Square, holds 146.17 million shares (20.01%) according to its August 5 holding report. Treasury shares come to 25.70 million (3.52%): 1,626,865 at the end of June plus the 24.07 million bought this time. Taking out the foreign 48.78%, Korean retail investors, institutions and the National Pension Service hold 202.38 million shares, or 27.71%. Of that, the NPS held 7.32% on October 15 by FnGuide’s count, so the remaining domestic retail and institutional stake is 20.39%. The NPS’s 7.32% is down from 7.50% at the end of June, which matches exactly the dilution from the new ADR shares issued in July (7.50% × 712.70 million ÷ 730.49 million).
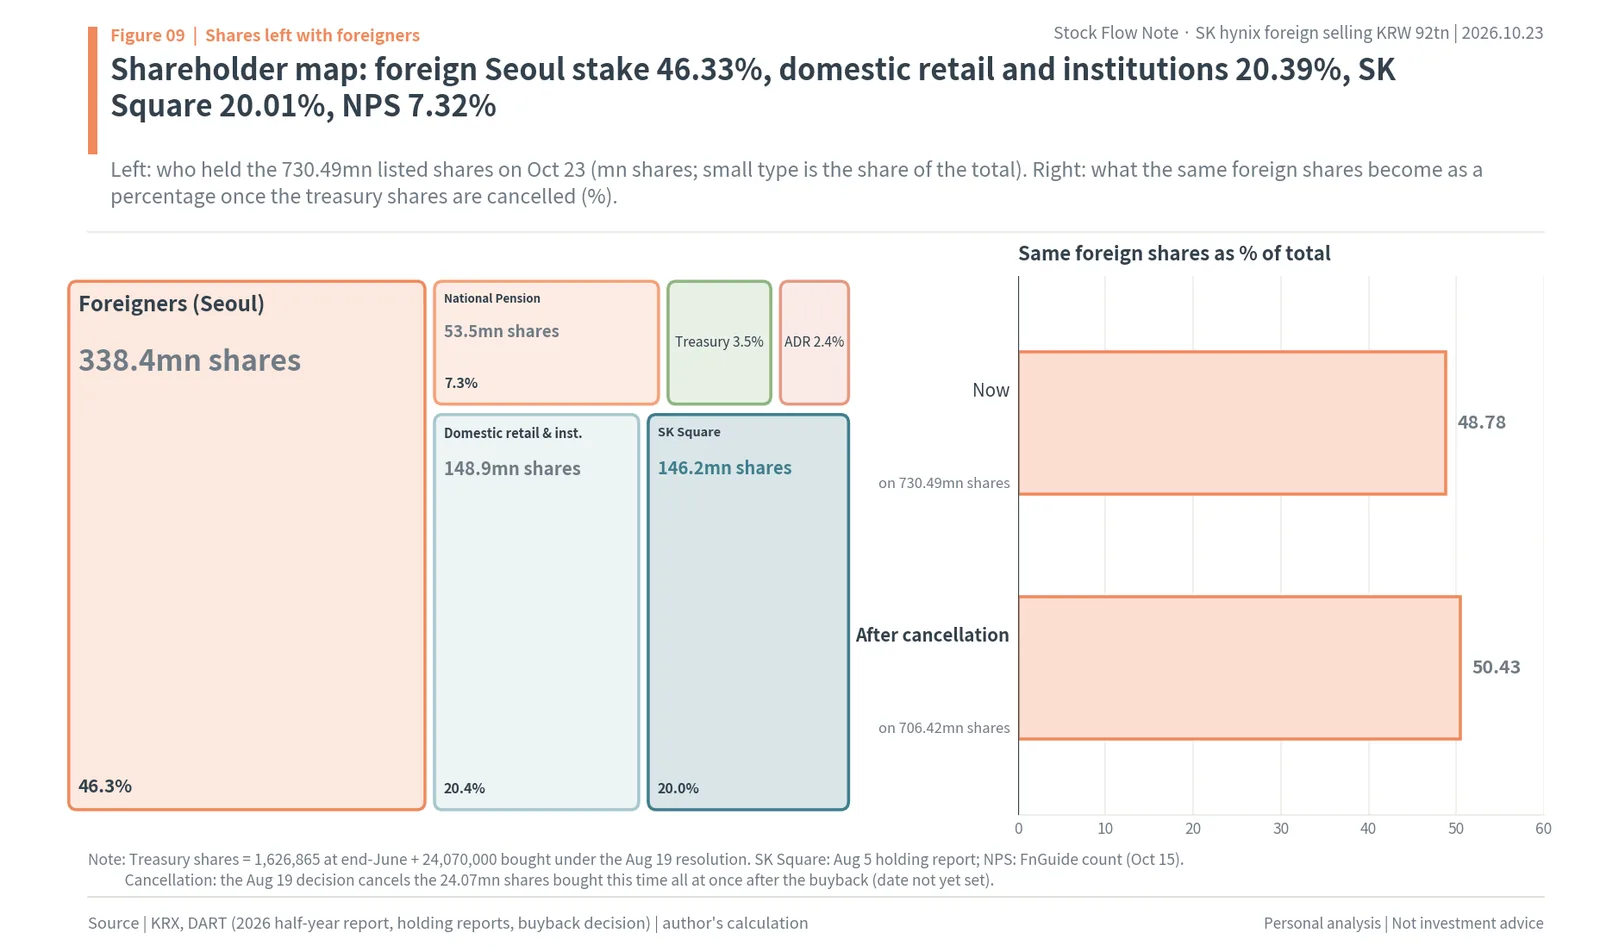
The left of the figure divides the 730.49 million shares listed on October 23 by holder: the foreign Seoul stake 46.33%, domestic retail and institutions 20.39%, SK Square 20.01%, the NPS 7.32%, treasury shares 3.52% and the ADR 2.44%. SK Square’s stake and the treasury shares are not supply. So the shares that trade in the market are the foreign Seoul stake plus the rest of the domestic holders, 74.0% in total.
The right shows the effect of cancelling the treasury shares. When it resolved the buyback on August 19 the company stated that the purpose was cancellation, and the same day it filed a share cancellation decision. That decision says the 24.07 million shares bought this time will be cancelled all at once after the buyback ends, and the cancellation date is still blank. Cancelling 24.07 million shares cuts listed shares to 706.42 million. Even if foreigners do not buy a single share, the foreign ratio rises from 48.78% to 50.43% (author’s calculation). The Seoul stake goes from 46.33% to 47.91%. So reading the ratio alone as “foreigners are back” would be wrong, and conversely, if the ratio is below 50% after the cancellation, foreigners have actually sold more.
Foreigners sold SK hynix, not chips: doubts about how long memory profits last and about the Korea discount
The conclusion of this chapter is that the foreign selling came from two layers of doubt. One is a doubt about the industry: how many years memory profits will last. The other is a doubt about Korean companies: how much of those profits will reach shareholders. And the pace of that selling already broke in the third week of October.
18 straight trading days, KRW 16.17tn, 60% of foreign KOSPI selling
Foreigners net sold SK hynix for 18 trading days in a row, from September 21 to October 20. By KRX data the total is KRW 16.17tn. Yonhap Infomax reported that SK hynix accounted for 60.07% of the KRW 26.8tn of foreign net selling on the KOSPI over the same period. One financial industry expert said that lately foreigners are not selling chips but “selling SK hynix.” As evidence he pointed out that on October 19 in New York, SK hynix’s ADR fell more than 2% even though Micron rose.
SKHY on the Nasdaq is the SK hynix ADR listed in July. One share is 0.1 common share, and it has always traded above its Seoul value. On October 22 SKHY closed at $131.69, 42.7% more than the Seoul close converted at the same day’s won-dollar rate (author’s calculation), against an average of 37.3% since listing (the site’s SKHY premium tracker follows this gap daily). The gap does not close because converting new shares into ADRs requires the company’s consent. Edaily reported that, by the Korea Securities Depository’s SEIBro data, the number of common shares that can be converted into ADRs is zero. The route of selling Seoul shares and moving into SKHY to capture the gap is closed to foreigners. Foreign selling in Seoul is selling that reduces SK hynix itself.
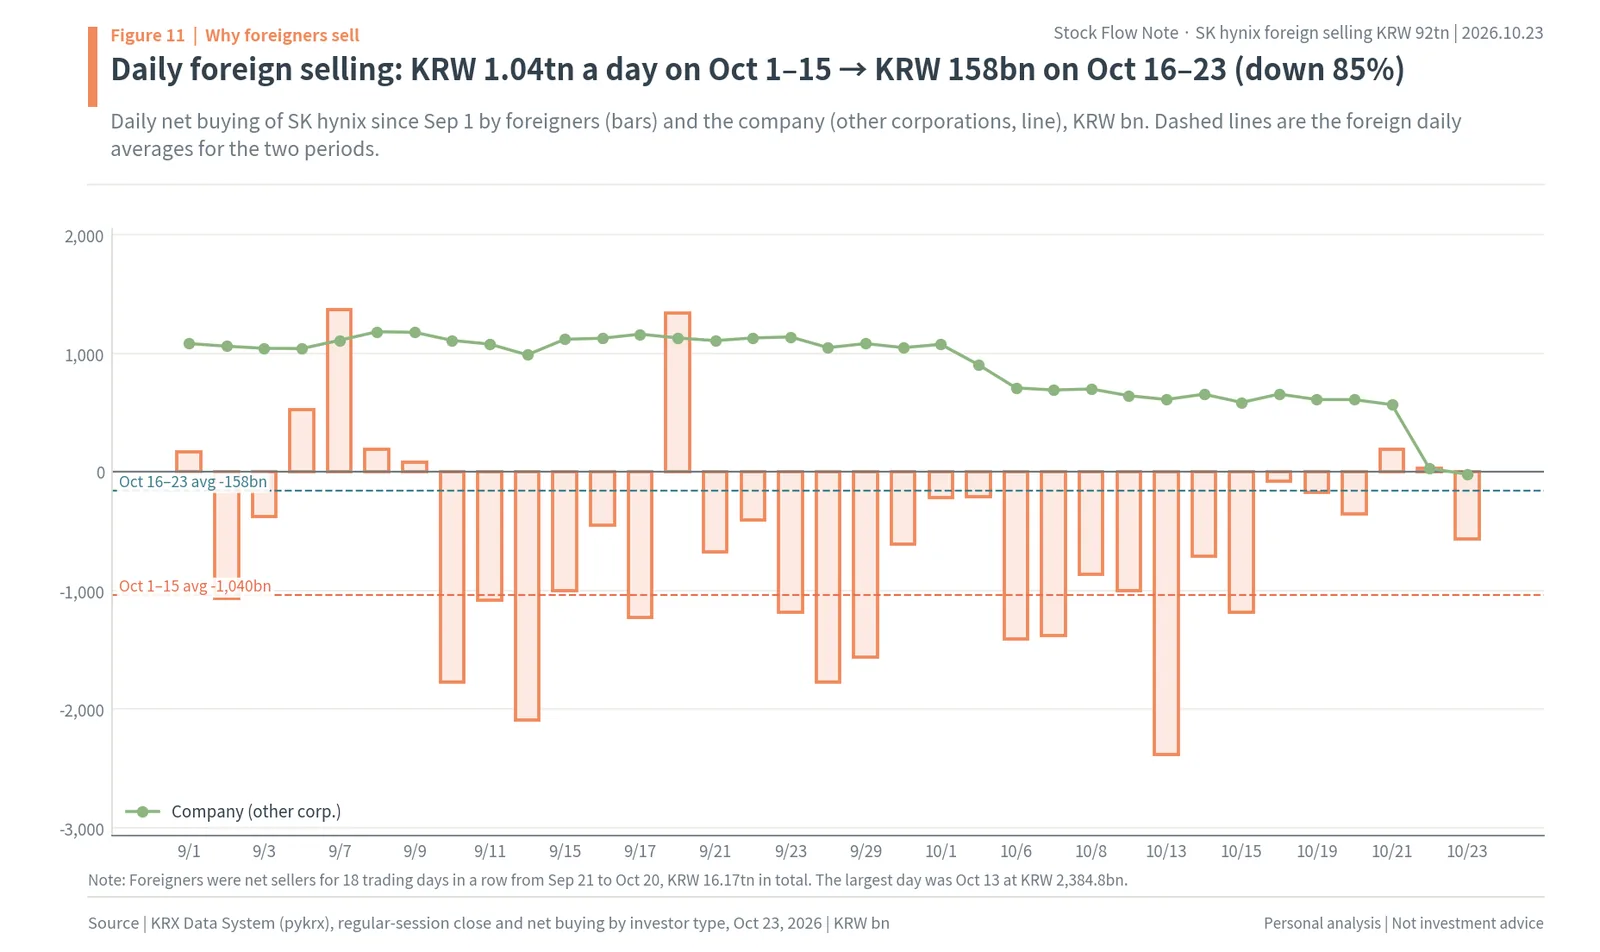
The figure shows daily foreign net buying (bars) and the company’s buying (line) since September 1. From mid-September the bars point down almost every day, and on the other side about KRW 1tn a day of company buying holds them up. On October 13 foreigners sold KRW 2,384.8bn in a single day. From October 16, however, the bars get shorter. Over the nine trading days from October 1 to 15 foreigners sold an average of KRW 1.04tn a day, and over the six trading days from October 16 to 23 the average was KRW 158bn. That is 85% less (author’s calculation). On October 21 and 22 foreigners were actually buyers.
The SKHY premium is also a sign that U.S. investors want SK hynix more than Seoul does. In an October 22 report, Goldman Sachs noted that the ADR float is now about 2.5% of all shares, and that raising it to 5% to 10% could make SK hynix eligible for the Nasdaq-100 index (Yonhap Infomax). The annual Nasdaq-100 reconstitution is announced on December 11. While foreigners in Seoul sell, index demand in the U.S. that wants to hold more SK hynix is waiting.
Active big holders cut, and index money stayed
DART’s 5% holding reports show the names of investors holding more than 5%. Capital Group, a U.S. active asset manager, first reported 5.09% of SK hynix in December 2024 and raised it to 7.23% by July 2025. It then cut to 5.05% in February 2026 and 3.53% on June 9. That means it sold 27.45 million shares, from 52.60 million in July 2025 to 25.15 million in June 2026. Because 3.53% is below 5%, that was its last report, and its holdings since then are not disclosed.
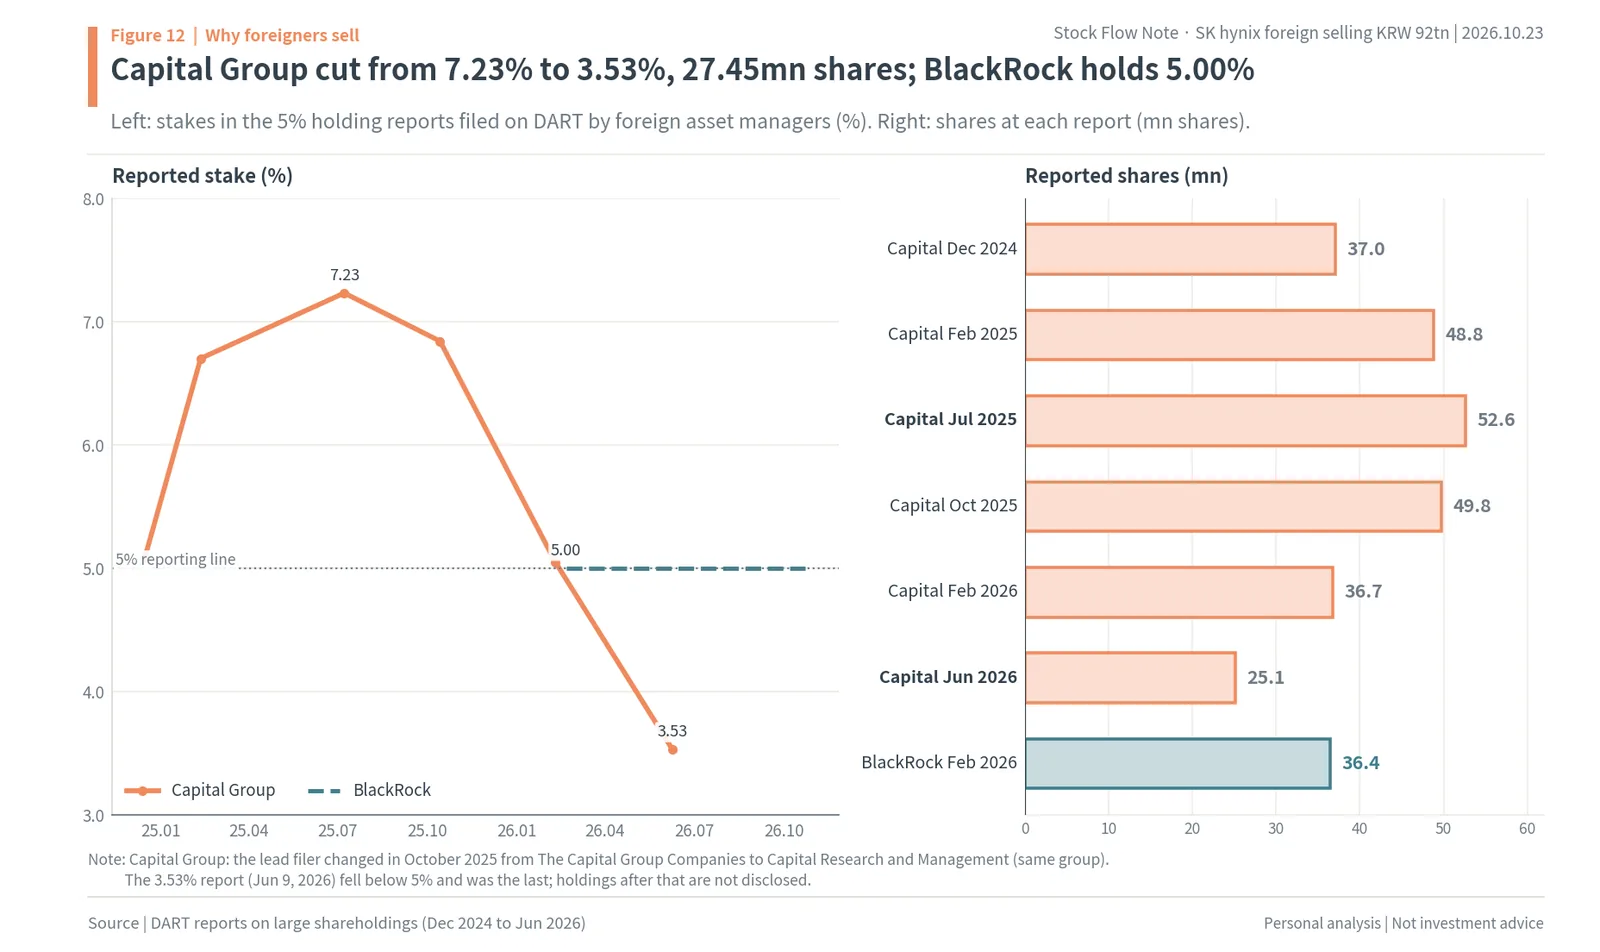
The left of the figure is the stake in each holding report, and the right is the share count at each report. Capital Group’s line peaks at 7.23% in July 2025 and comes down from there. By contrast, BlackRock Fund Advisors, which buys to track indexes, reported 5.00% in February 2026. On September 30 SK hynix made up 27.58% of the MSCI Korea index and 5.90% of the MSCI Emerging Markets index (MSCI factsheets). Index-tracking money holds as much as the index weight, and it has little reason to sell unless SK hynix leaves the index or money leaves the index funds. The protagonist of this round of selling is active money that buys and sells on judgment.

That index money such as BlackRock’s stays also means foreign ownership has a floor. In an October 19 report Goldman Sachs found that foreign ownership of Korean chip stocks was about 2.5 standard deviations below average (News1). The fact that the lowest SK hynix foreign ownership over the 11 years from 2015, 45.72%, came in August 2021 reflects the same structure.
First doubt: how many years memory profits last
U.S. chip stocks since the KOSPI peak on June 22 show which way the doubt runs. Through October 22 (U.S. session), Nvidia is up 1.7%, the Philadelphia Semiconductor Index (SOX) is down 26.7%, Micron is down 29.3% and SK hynix is down 58.1%. Micron and SK hynix, which make memory, fell much more than Nvidia, which makes AI chips.
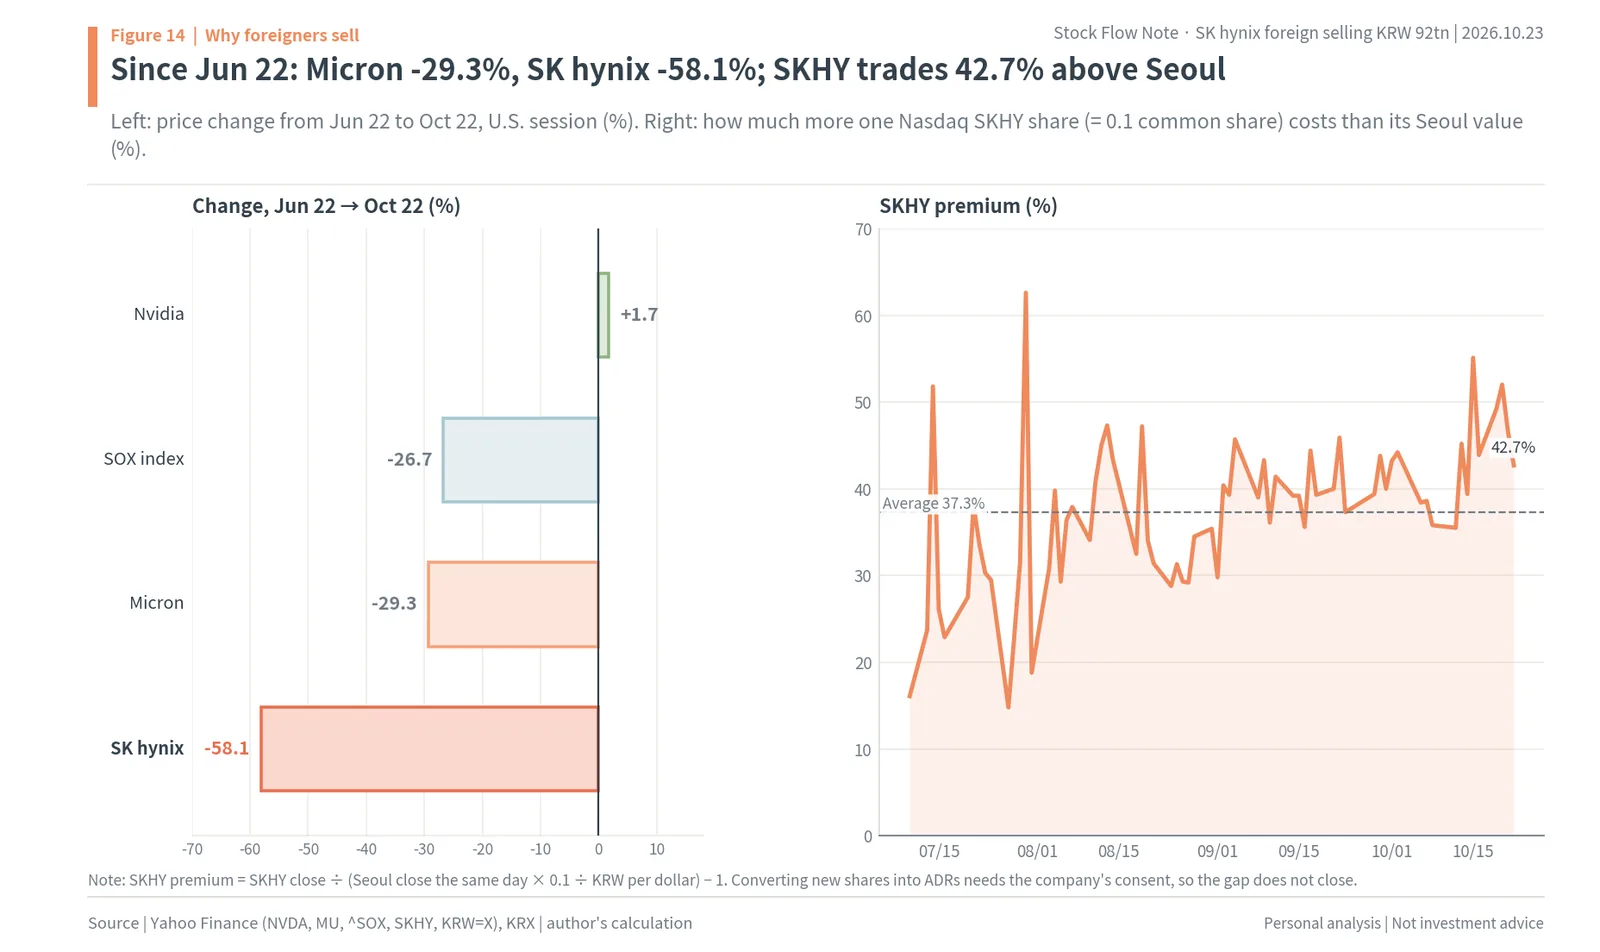
The left of the figure is these four price changes, and the right is the SKHY premium. The news that piled up in October all took aim at how long memory profits last. Foreign media reported OpenAI’s annualized revenue at the end of September at about $50bn (October 8, reflected in Korea on the 12th), and on the 13th came news about the DRAM technology of China’s ChangXin Memory (CXMT). On the 13th Elon Musk wrote that memory companies other than Micron were price gouging, and on the 15th he wrote that China would make a lot of memory in 2028. By Goldman Sachs prime brokerage data, hedge funds cut their tech exposure in the five trading days to the 15th at the fastest pace since records began in 2016, with chips cut the most by value (Yonhap News).
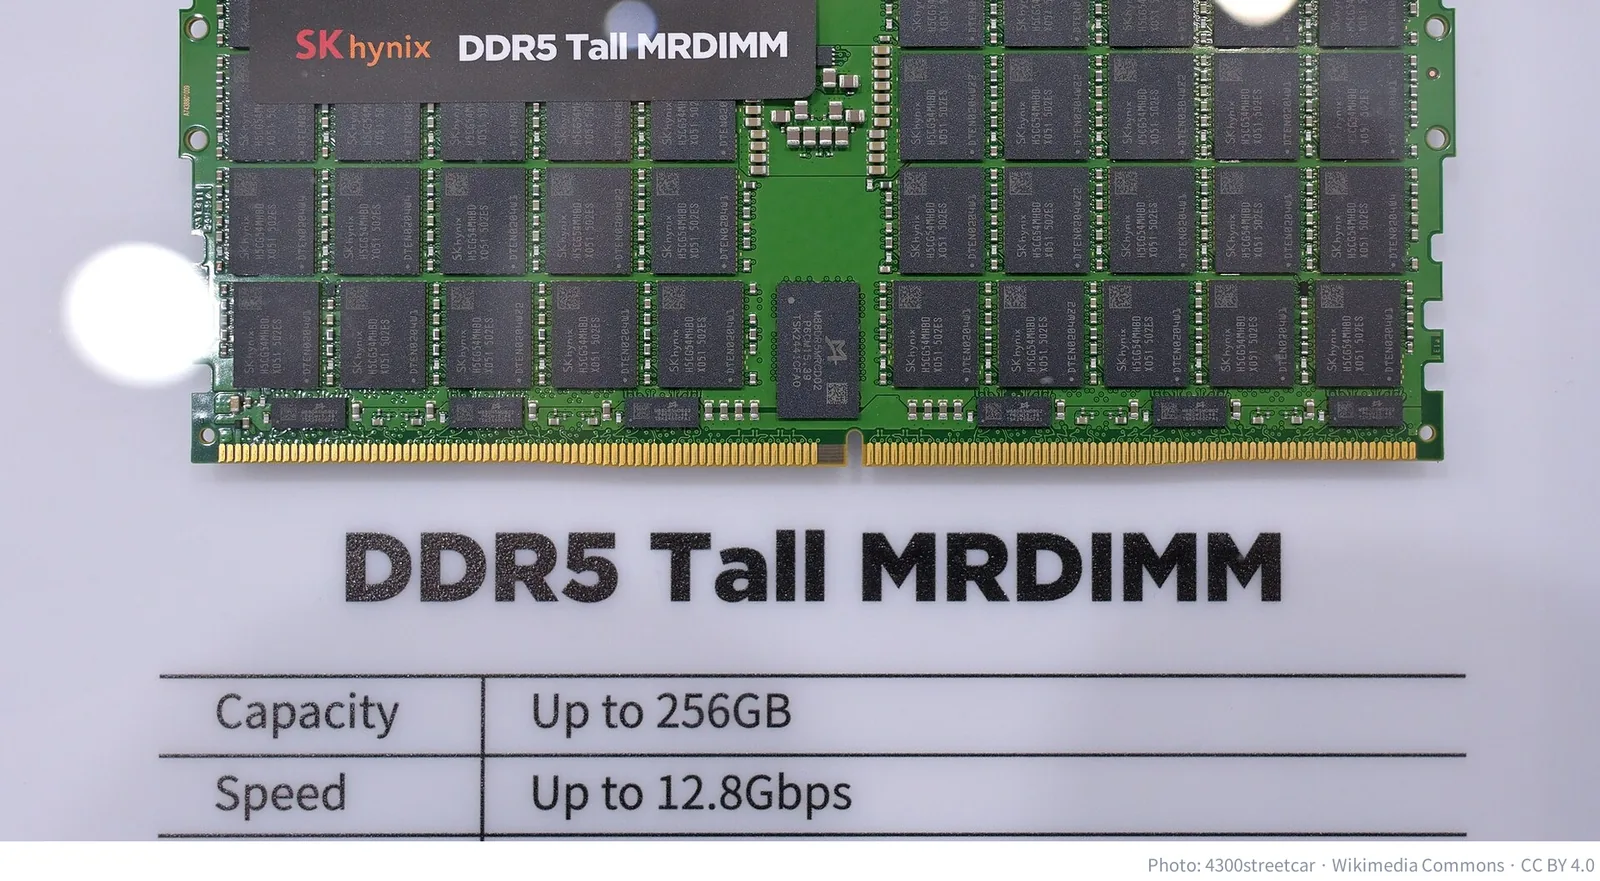
What sets memory prices is how far supply runs ahead of demand. Morgan Stanley’s 2021 “winter” report also started from a single sentence: memory supply has peaked and is overtaking demand. This time Chinese supply and price resistance from big customers came at the same time. According to Kim Joon-young of iM Securities, SK hynix’s 12-month forward P/E fell from 4.46 times on September 23 to 3.70 times, and the gap to Micron’s P/E widened from 1.40 times to 1.60 times (Korea Economic Daily, October 17). In the same industry, SK hynix was marked down more. JP Morgan’s October memory report judged that worries about a memory slowdown were excessively priced into Samsung Electronics and SK hynix (Chosun Biz). Its diagnosis is that the share price already assumes a decline after an earnings peak in the first half of 2027.
Second doubt: whether profits come back to shareholders
The extra markdown is a doubt about Korean companies. Heo Jae-hwan of Eugene Investment & Securities named governance and shareholder returns that fell short of expectations as the reason for foreign selling (Herald Economy, October 22). Weekly Donga summed up the reasons as dilution from a Solidigm listing, criticism that bonuses exceed shareholder returns, and worries about excessive capital spending. Solidigm is the U.S. NAND flash subsidiary SK hynix acquired, and from August there were reports of pre-IPO fundraising and a planned U.S. listing. On October 19, at the parliamentary audit, the governor of the Financial Supervisory Service said the plan would run against the rules on duplicate listings, where a subsidiary lists separately from its parent.
As the October 15 stock flow note showed, in 2025 SK hynix returned 3.9% of net income to shareholders as dividends and buybacks. The KRW 40tn buyback raises that share sharply this year, but from a foreign investor’s point of view the open question was whether the buyback would be a one-off or continue as a formula tied to profits.
On October 23, one of the two doubts shrank
Before the market opened on October 23, SK hynix disclosed that it had dropped Solidigm’s pre-IPO fundraising and its review of a listing. The night before in the U.S., Meta’s capital spending shock had sent the Nasdaq down 2.60% and the SOX down 6.72% (Yonhap Infomax). Even so, SK hynix fell more than 5% early in the session and then closed 4.42% higher at KRW 1,277,000. The industry doubt was unchanged, but one Korea-discount doubt shrank, and the share price reacted. The same day foreigners sold KRW 564.6bn, and institutions took those shares.
In short, the foreign selling is active money’s doubt about the life of memory profits and about the Korea discount. Active big holders have already cut a lot, index money has stayed, and the pace of selling has been 85% lower since October 16. The remaining doubt, shareholder returns, gets its answer on October 28. If returns come as a formula tied to profits rather than a single buyback, one more reason foreigners priced SK hynix below other memory makers goes away. Whether foreign selling then stops can be checked by whether the Seoul stake of 46.33% keeps falling.
Retail cash is KRW 51.01tn below June, and the SK hynix shares retail bought this year are down 27.8% on average
The conclusion of this chapter is that retail will find it hard to take all the foreign selling again. There are two reasons: the cash to buy with has shrunk, and the shares already bought are under water.
Deposits are below January 2, and debt is 21.4% below June
Investor deposits are the cash retail investors keep in brokerage accounts to buy stocks. By KOFIA statistics, deposits peaked for the year at KRW 139.69tn (about $105.4bn) on June 4 and stood at KRW 88.68tn on October 22, down KRW 51.01tn (-36.5%). That is less than the KRW 89.52tn of January 2. All the cash added this year has left.
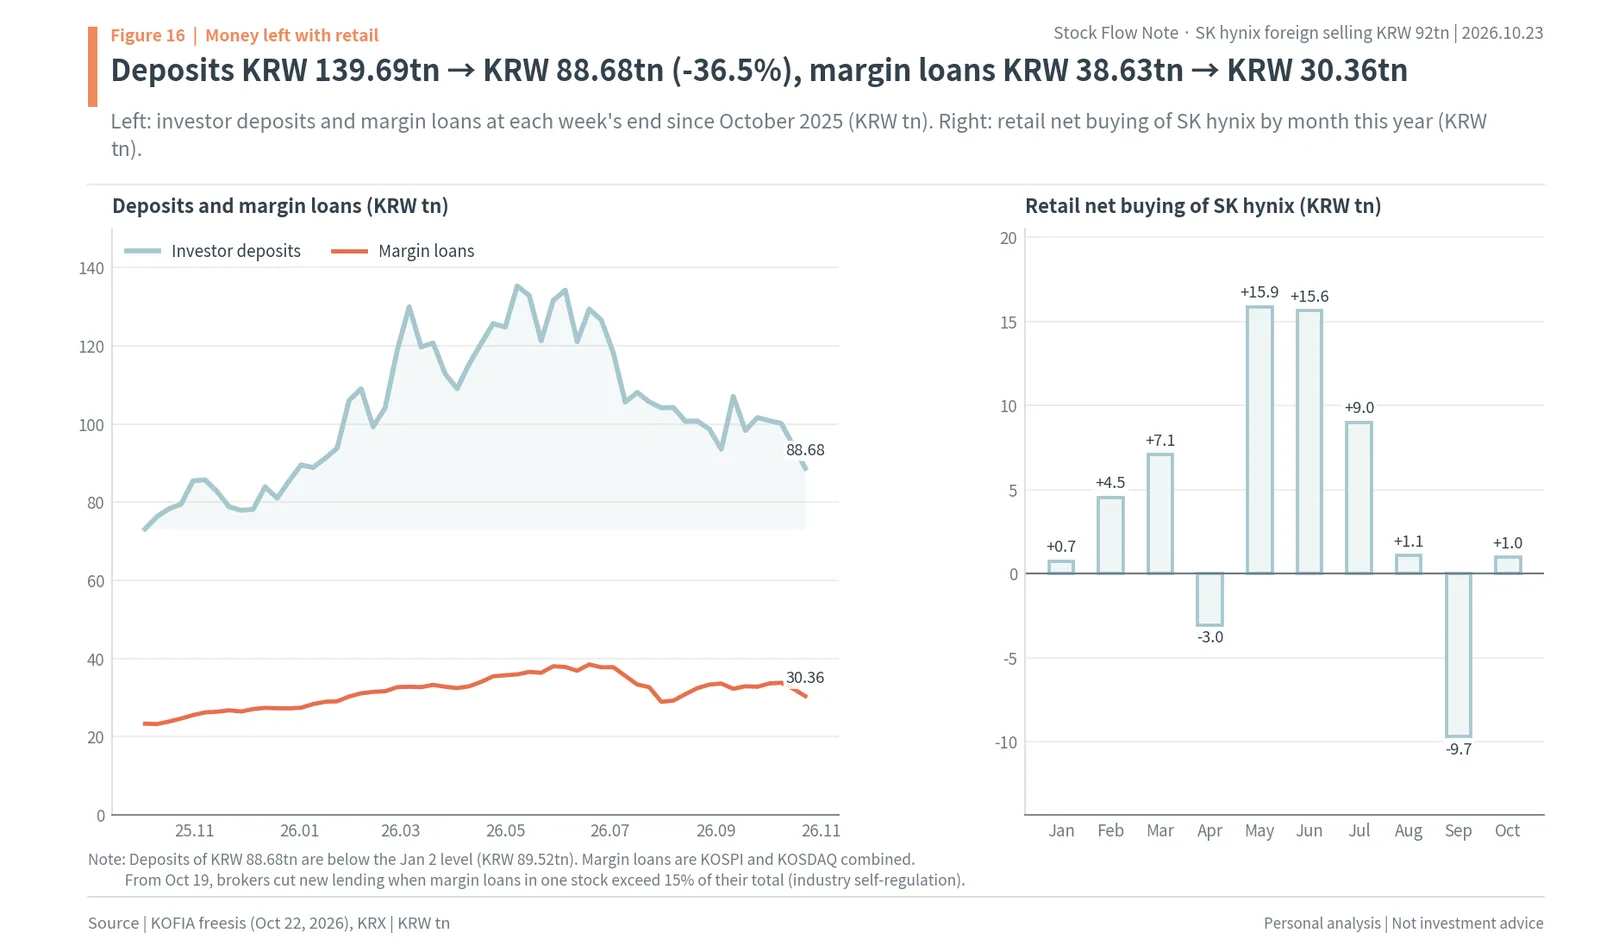
Margin loans are the balance of stocks bought with money borrowed from brokers. They peaked at KRW 38.63tn on June 24 and stood at KRW 30.36tn on October 22, down 21.4%. Margin loans equal 34.2% of deposits. Forced sales of unpaid trades came to KRW 491.6bn in October through the 22nd. The left of the figure is weekly deposits and margin loans since October 2025, and the right is retail’s monthly net buying of SK hynix this year. As the deposit line came down from its June peak, retail’s SK hynix bar shrank from KRW 9.01tn in July to KRW 1.07tn in August and turned to -KRW 9.69tn in September.
From October 19 it also became harder to buy more SK hynix with debt. That day KOFIA and the ten comprehensive financial investment firms (Korea’s largest brokers) started a self-regulation rule: when margin loans in one stock exceed 15% of a firm’s total margin lending, the firm cuts new loans. Of the KRW 33.4tn of margin debt at the end of September, KRW 9.2tn (27.5%) was in Samsung Electronics and SK hynix (NICE Investors Service). The rule leaves existing loans alone and applies to new borrowing first, but some brokers blocked new margin in the two stocks or raised their margin requirements. Retail money buying SK hynix will have to rely more on cash than on debt. On October 19, the day the rule started, new margin buying of SK hynix was 333,127 shares, 12.6% less than the previous trading day (Seoul Economic Daily). Shinhan Investment Corp. announced that from October 26 it would cut its per-stock margin limit for the two stocks from KRW 2bn to KRW 300mn. The first buying to narrow was the debt-funded buying that had been taking the falls.
Even at this year’s ratio, deposits would put KRW 37.4tn into SK hynix
From January 2 to October 23 retail net bought KRW 99.95tn of KOSPI stocks. Of that, KRW 42.19tn, or 42.2%, was SK hynix. That number shows how concentrated retail buying was in SK hynix. Even assuming all of today’s KRW 88.68tn of deposits went into stocks and 42.2% of it into SK hynix, that is KRW 37.4tn (author’s calculation), 8.7% of the foreign Seoul stake of KRW 432.20tn. All deposits together come to only 20.5% of the foreign Seoul stake.
This calculation is the extreme assumption that retail pours all its cash into SK hynix. In reality deposits never all go into stocks. Still, the number shows how big retail cash is next to the size of foreign selling. In act one retail could take KRW 53.26tn because deposits kept rising until June. Now the opposite is true.
Part of the remaining cash went to the U.S.
One number explains part of the drop in deposits. By the Korea Securities Depository’s SEIBro data, retail net purchases of U.S. stocks settled from October 1 to 21 came to $4,831 million. That is the most since January and 4.8 times the whole of September (Newsis). From October 1 to 14, 58.5% of net U.S. stock purchases went into SOXL, an ETF that tracks three times the U.S. chip index (Etoday). As Korean chip stocks fell, part of retail money kept its bet on chips but moved it to the U.S. market. The retail cash available to buy SK hynix may have shrunk even more than the drop in deposits suggests.
Retail’s 26.59mn shares bought this year cost KRW 1,769,092 on average
The second reason is the price of the shares retail already bought. The KRX publishes net buying by investor type in both value and number of shares. With these two numbers, the average cost of the SK hynix position retail built this year can be counted. On days when retail was a net buyer, that day’s net purchase value and share count are added; on days it was a net seller, shares are removed at the average cost up to that point (average-cost method, author’s calculation).
Counted this way, retail accumulated 26.59 million SK hynix shares through net buying from January 2 to October 23. The average cost is KRW 1,769,092 (about $1,335). At the October 23 close of KRW 1,277,000 that is -27.8%. The KRW 47.05tn paid has become KRW 33.96tn, an unrealized loss of KRW 13.09tn (about $9.9bn). The cost is higher than the KRW 42.19tn of net buying because the shares retail sold on up days went for more than the average cost and left realized gains.
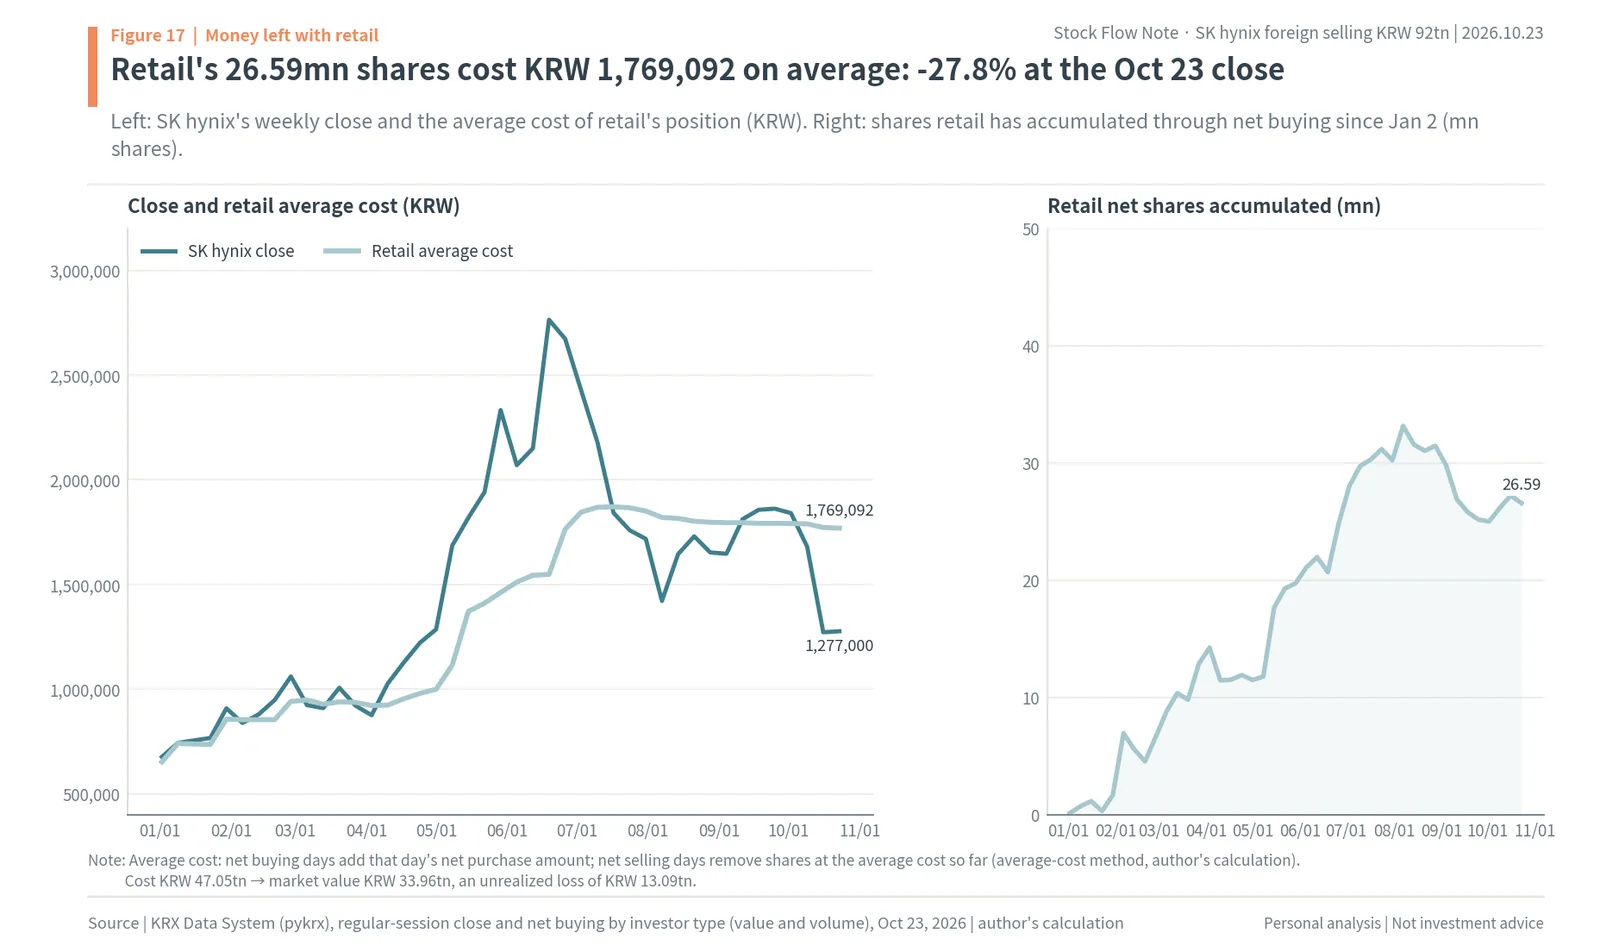
The left of the figure is SK hynix’s weekly close and the average cost of retail’s position. In May and June the close ran far above the average cost, and in mid-July it fell below. From mid-September to early October it climbed briefly above, then fell back below in October, and now the two lines are KRW 492,092 apart. The right is the number of shares retail built up through net buying. It peaked at 33.52 million on August 11 and fell during act two to 26.59 million.
Shares 27.8% below this average cost, counted from Korea Exchange data, turn into supply near breakeven as the price rises. KRW 1,769,092 is 38.5% above today’s price. The part bought on margin turns into forced-sale supply at the bottom. Retail not only has less cash to buy with; the shares it holds can also become supply both on the way up and on the way down.
Retail buys on down days and sells on up days: dip buying is both a floor and a source of supply
The reason retail buys SK hynix fits in one sentence: it has fallen a lot. SK hynix hit this year’s high of KRW 2,919,000 on June 22, and the October 23 close of KRW 1,277,000 is 56.3% below that. It is still 88.6% above KRW 677,000 on January 2. Retail buying reads this big drop as “it got cheap,” and the daily numbers show it.
The correlation between daily change and retail net buying is -0.71
Over this year’s 197 trading days, the correlation coefficient between SK hynix’s daily price change and that day’s retail net buying is -0.71 (author’s calculation). The more the price fell on a given day, the more retail bought. The same calculation for foreigners gives +0.54: foreigners sold less on up days and more on down days.
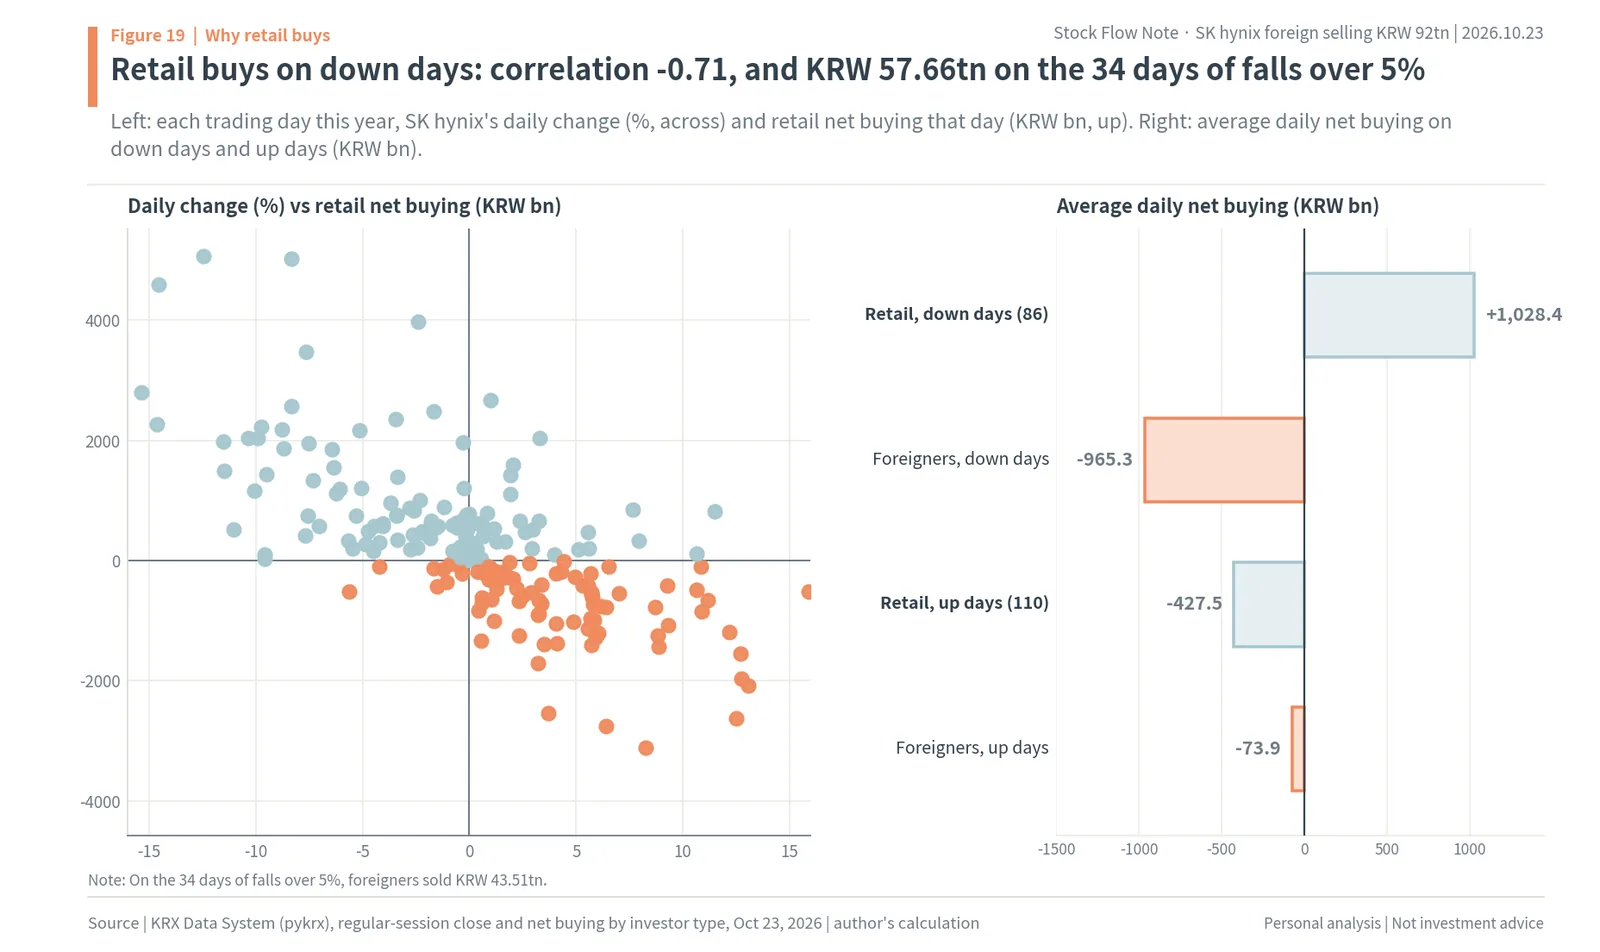
The left of the figure plots every trading day this year as one dot, with the daily change across and retail net buying up. The dots line up from top left to bottom right. The right shows daily averages on down days and up days. On the 86 down days retail bought an average of KRW 1,028.4bn a day and foreigners sold KRW 965.3bn. On the 110 up days retail sold an average of KRW 427.5bn a day and foreigners sold KRW 73.9bn.
Taking only the days with falls of more than 5% makes it clearer. There were 34 such days this year. On those 34 days retail bought KRW 57.66tn and foreigners sold KRW 43.51tn. Retail’s buying on those 34 days is larger than its net buying for the whole year, KRW 42.19tn. On the other days, in other words, retail was a seller.
Retail also bought leveraged ETFs
Retail did not buy only shares. On May 27 seven single-stock leveraged ETFs that track twice SK hynix’s daily move were listed. On October 22 the KODEX fund had net assets of KRW 1.0981tn and the TIGER fund KRW 694.2bn (FunETF). These ETFs lost 55% from October 1 to 20 and are 89% below their 52-week highs (Kyunghyang Shinmun, Financial News). Even so, on October 13, when SK hynix fell more than 10%, retail net bought KRW 125.9bn of 14 leveraged ETFs on Samsung Electronics and SK hynix (Kangwon Domin Ilbo). In the week from October 8 to 15, retail net buying of the KODEX SK hynix single-stock leveraged ETF was KRW 127.2bn (Business Watch). When retail buys a leveraged ETF, the liquidity provider buys shares or futures to create it. That buying was one strand of financial investment’s KRW 16.60tn of buying in act one.
What analysts told retail investors points the same way. Kim Dong-won of KB Securities put SK hynix’s 2027 forward P/E at 2.7 times and said “the peak of the worries has passed” (Digital Times, October 22). Lee Su-rim of DS Investment & Securities judged that the share price is pricing in an unconfirmed 2028 downcycle in advance (Korea Economic Daily, October 20). A low P/E is the number that makes retail read a fall as “it got cheap.” By NH Investment & Securities customer data, 74.18% of retail investors holding SK hynix were at a loss on October 19 (Seoul Economic Daily).
Dip buying is a floor on down days and supply on up days
This way of buying has two faces. On down days retail takes the foreign selling and cushions the fall. On October 15, when SK hynix fell 11.06%, foreigners sold KRW 1,184.7bn and retail bought KRW 513.2bn. On up days retail sells. On October 21, when SK hynix rose 5.81%, retail sold KRW 736.4bn. Shares below the average cost of KRW 1,769,092 from the previous chapter get closer to breakeven as the price rises, and near breakeven more holders sell.
So retail buying is not money that makes a trend but money that slows a fall. When the shares foreigners have left to sell are running out, this money makes the bottom. To go higher, though, a buyer other than retail is needed. In August 2021, too, retail took the shares at the bottom, but what lifted the price afterward was foreigners starting to buy again.
Institutions wait for rules and results, and on the first day after the buyback they took KRW 596.1bn
Where institutions stand fits in one line: “still waiting, and the first signal is buying.” This year institutions as a whole net bought KRW 8.64tn of SK hynix. But one type of institution made that number. Financial investment bought KRW 16.33tn, while investment trusts sold KRW 6.92tn, private funds KRW 0.87tn and insurance KRW 0.34tn. Pension funds barely moved, at KRW 0.60tn.
Financial investment’s buying is the shadow of retail money
Financial investment covers both securities firms’ trading with their own money and the trading of ETF liquidity providers (LPs). When retail investors buy ETFs that hold a lot of SK hynix, or leveraged ETFs, the LP buys shares to create new ETF units. That buying is counted under financial investment, not retail. Financial investment buying KRW 16.60tn in act one means retail ETF buying was large. Financial investment selling KRW 0.32tn in act two also moves in the same direction as retail selling. So financial investment’s KRW 16.33tn is better read as the shadow of retail money than as institutional judgment.
In act two institutions as a whole sold KRW 2.68tn. While the company bought KRW 800bn a day, institutions too were on the selling side with foreigners and retail. For institutions the company’s buying was a chance to cut their weight. That makes institutions turning to buyers the day after the buyback ended the opposite of what they did in act two.
Investment trusts are short of room
Investment trusts are the asset managers that run public mutual funds. This year they sold KRW 6.92tn of SK hynix. A fund can hold only up to 10% of its assets in one stock, except that a stock whose market cap weight exceeds 10% can be held up to that weight. KOFIA announced on October 1 that SK hynix’s average market cap weight in September was 22.79%, which becomes the fund limit for October. Some active funds had 55% of their assets in Samsung Electronics and SK hynix combined, and the industry said there was little room to add since the start of the year (Asia Today, September 3). If SK hynix falls more than the KOSPI, its market cap weight shrinks and next month’s limit shrinks with it. That structure makes it hard for investment trusts to become a big buyer.
Pension funds bought in Q3, and the NPS rule is not yet on the buy side
Pension funds went in different directions each quarter. According to Newspim’s analysis of exchange data, pension funds sold KRW 407.4bn of SK hynix in the first quarter and KRW 551.5bn in the second, then bought KRW 1.5539tn in the third. In the same period pension funds sold KRW 1.3531tn of SK Square (Daishin Securities count, Money Today). They held SK hynix directly and cut the holding company. From October 1 to 23, pension funds’ net buying of SK hynix was close to zero.
The NPS held 7.32% of SK hynix on October 15 by FnGuide’s count. What the NPS does is set by its asset allocation rule. At the May 28 fund management committee, its 2026 target weight for domestic stocks was raised from 14.9% to 20.8%. By its official disclosure, domestic stocks at the end of July were KRW 418.6tn, 24.9% of a KRW 1,684.2tn fund. The KOSPI has fallen since, and by the author’s estimate the weight on October 23 is about 21.8%, still 1.0 percentage point (pp) above target. Under the rule the NPS starts buying only when the weight falls below the target, and that line is a KOSPI of about 5,237, 5.6% below the October 23 KOSPI of 5,550.30 (author’s estimate).
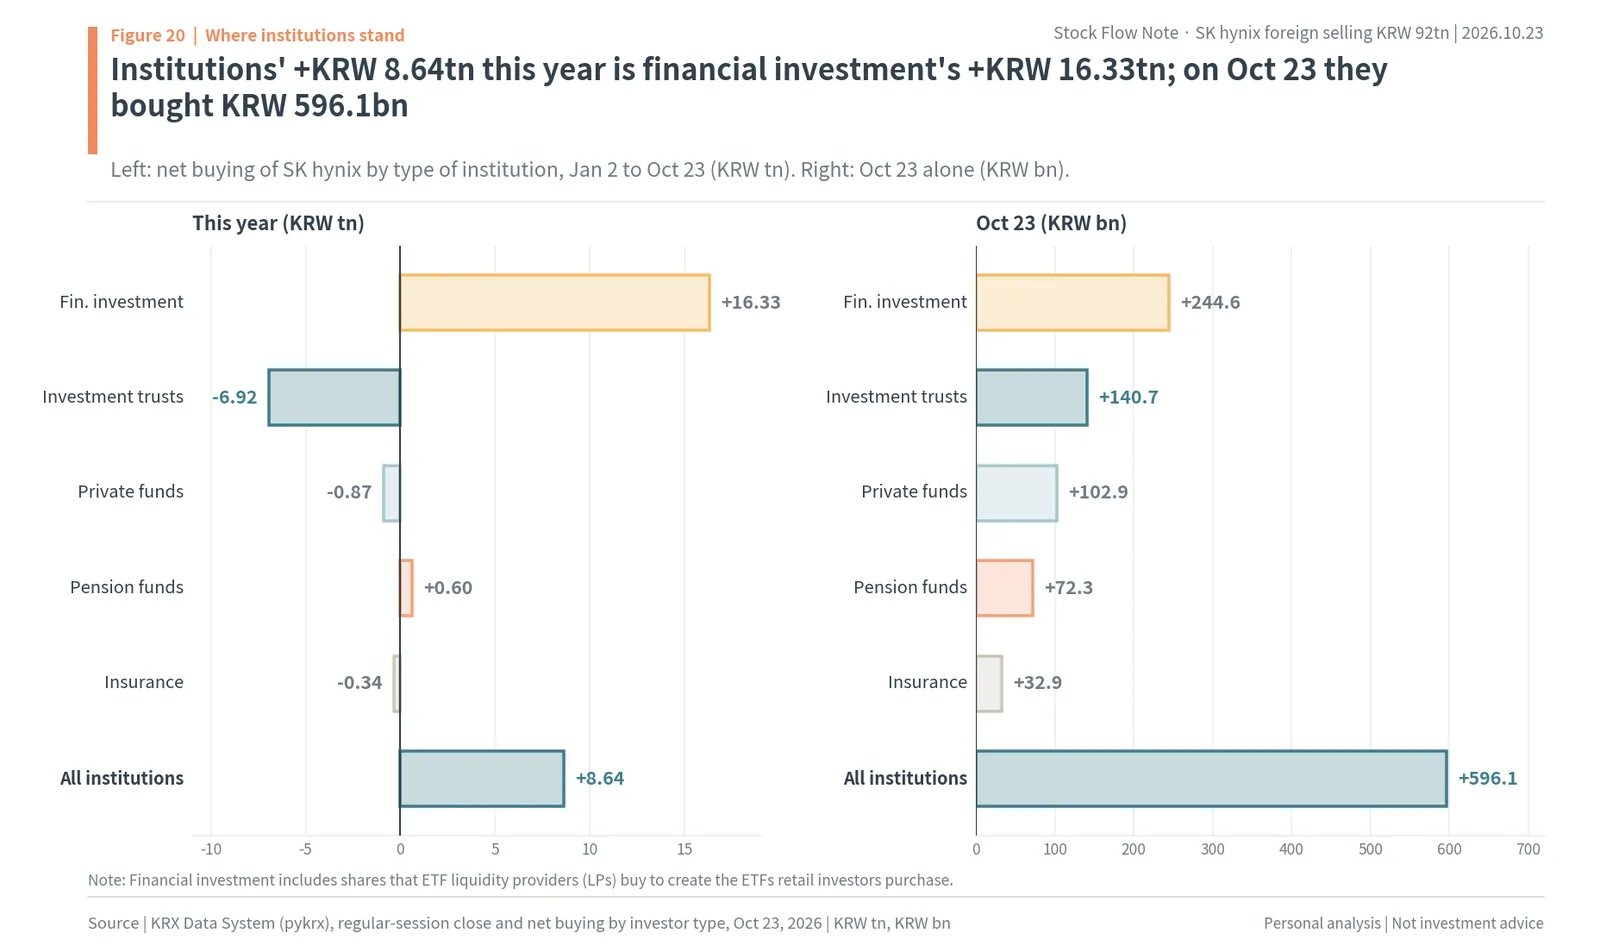
The left of the figure is net buying of SK hynix this year by type of institution, and the right is October 23 alone. On the left, the KRW 8.64tn bar for all institutions is made by the single KRW 16.33tn financial investment bar. On the right, financial investment KRW 244.6bn, investment trusts KRW 140.7bn, private funds KRW 102.9bn, pension funds KRW 72.3bn and insurance KRW 32.9bn all stand on the buying side, KRW 596.1bn together. On the day after the company stepped away, five types of institution bought at once.
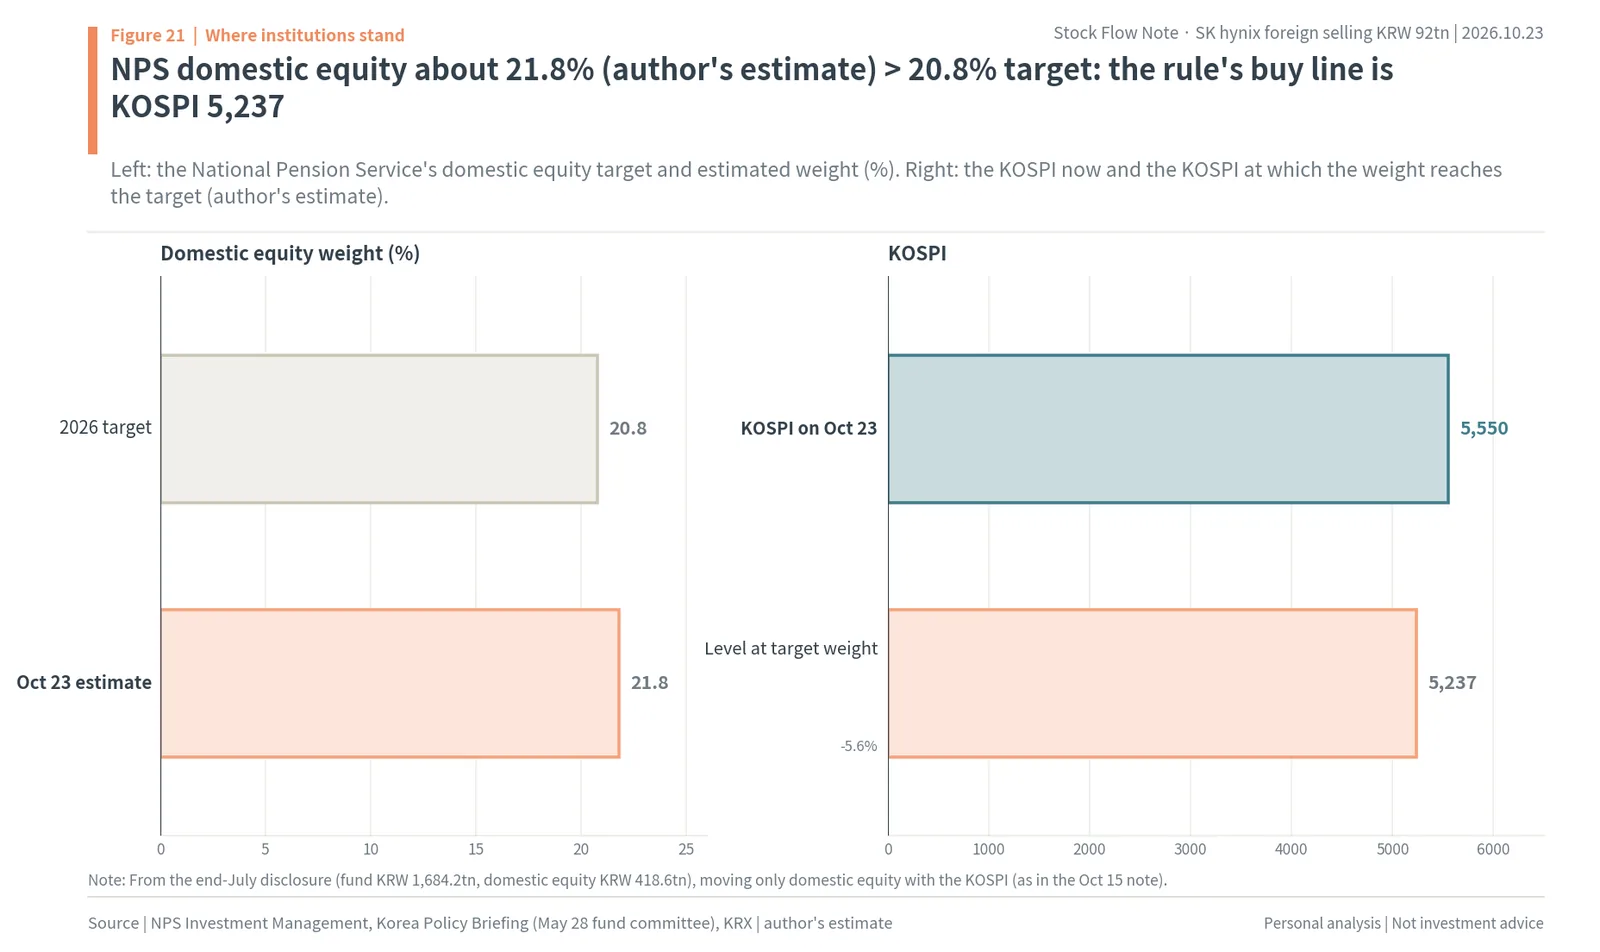
The left of this figure is the NPS’s domestic stock target of 20.8% and the estimated weight of 21.8% on October 23, and the right is the current KOSPI of 5,550.30 against the KOSPI of 5,237 at which the target weight is reached. The estimate is a rough one that assumes domestic stocks moved with the KOSPI after the end-July disclosure and other assets stayed the same. The press has reported the NPS’s upper limit as 26.8% or 28.8%, and the NPS does not disclose the range. The seventh fund management committee meeting on October 20 had no asset allocation or rebalancing item. Instead it amended its stewardship guidelines: it will vote for buyback proposals when they serve long-term shareholder value, with cancellation within one year of purchase as the principle.
Why institutions bought on October 23: the Solidigm listing review was dropped
On the morning of October 23, before the market opened, SK hynix disclosed that it had stopped pre-IPO fundraising and its listing review for Solidigm, its U.S. NAND subsidiary. The stated reason was “comprehensive consideration of capital market conditions and other factors.” The market read it as easing the worry about duplicate listings, where listing a subsidiary splits the parent’s shareholder value (Yang Hyun-kyung of iM Securities, Hankook Ilbo and Etoday). SK hynix rose 4.42% while the KOSPI recovered from an intraday fall of more than 4%, and institutions bought KRW 596.1bn that day. Kim Sun-woo of Meritz Securities said the company had made shareholder value its top priority and that stronger returns on the 28th were likely (Etoday, October 23).
In short, among institutions financial investment follows retail money, investment trusts are short of room, and under its rule the NPS is still above its buy line. So there are two triggers for institutions to put in big money: the KOSPI falling below the NPS buy line of 5,237, and the October 28 results and shareholder return changing the judgment of the other institutions. The buying on October 23 is a first signal ahead of the second trigger.
The next support is October 28, and the remaining return capacity of KRW 42.6tn is 4.1 times October’s foreign selling
This chapter’s conclusion is the author’s view. The shares foreigners can still sell in Seoul are down to about KRW 7.11tn above the 2021 low, and retail has less cash to buy with. So the next support is not retail but the company and institutions. Its size and form come out on October 28.
The company will disclose the size and form of additional returns on Q3 results day
SK hynix holds its third-quarter earnings conference call at 9 a.m. on October 28. The FnGuide consensus is revenue of KRW 98.2257tn and operating profit of KRW 76.964tn (about $58.1bn) for the third quarter (Newsis). The WiseReport consensus for operating profit is the same, KRW 76.96tn. Meritz Securities expects KRW 80.1tn, SK Securities KRW 79tn and Hana Securities KRW 77.9tn. Operating profit in the previous quarter, Q2, was KRW 60.5426tn.
The company’s return pledge is in its August 19 fair disclosure. It will return at least 50% of cumulative free cash flow (FCF) for 2025 to 2027 through buybacks and cancellations and cash dividends, keep buying back and cancelling shares during the policy period, and announce the size and form of additional returns with its third-quarter results. Last year, on third-quarter results day, it also declared a third-quarter dividend of KRW 375 per share.
After what it has already spent, KRW 42.6tn remains through 2026
In the October 15 stock flow note the author sized this pledge with the WiseReport FCF consensus. Fifty percent of 2025 to 2026 FCF is KRW 96.0tn, and after the buybacks and dividends already paid, KRW 42.6tn (about $32.2bn) remains through 2026. Extending to 2027, 50% of FCF is KRW 228.6tn and the remaining capacity is KRW 175.2tn (author’s calculation). Brokers talk about similar sizes. Kim Rok-ho of Hana Securities expects at least KRW 30tn of additional return funds based on FCF to be announced with Q3 results, mostly as buybacks and cancellations rather than dividends. Kim Un-ho of IBK Securities estimates 2026 shareholder returns at a minimum of around KRW 90tn.

The figure puts the sizes in this change of hands on one line: the company’s remaining return capacity through 2026 of KRW 42.6tn, the company’s August to October buyback of KRW 40tn, retail deposits at this year’s SK hynix ratio of KRW 37.4tn, October’s foreign net selling of KRW 10.31tn, and the KRW 7.11tn left in the foreign Seoul stake above the 2021 low. The remaining return capacity is 4.1 times October’s foreign net selling and 6.0 times the foreign shares left above the 2021 low. It is 4.6% of the KRW 932.84tn (about $704.1bn) market cap (author’s calculation).
Spending KRW 30tn on buybacks buys 23.49mn shares, 4.2 times foreigners’ remaining supply
Assuming the minimum KRW 30tn Hana Securities expects all goes into buybacks, the sizes look like this (author’s assumption). At the October 23 close of KRW 1,277,000, KRW 30tn (about $22.6bn) buys 23.49 million shares, 3.22% of listed shares. That is 4.2 times the 5.57 million shares the foreign Seoul stake has left above the 2021 low. Buying KRW 820.6bn a day, as in the last 20 trading days of act two, would take 36.6 trading days. Spending the full KRW 42.6tn left through 2026 on buybacks would buy 33.36 million shares, 4.57% of listed shares.
What this calculation says is simple. Measured against the 2021 low, the shares foreigners can still sell in Seoul are down to a few million, while the shares the company can buy again run to tens of millions. If the company restarts buying, shares disappear from the market faster than foreigners put them out. Conversely, if the company fills its returns with dividends only, the buyers of shares in the market are just institutions and retail. As the earlier chapter showed, retail cash is KRW 51.01tn below June, and investment trusts have little room.
The author’s view: if returns are buybacks and cancellations, the change of hands ends with the company and institutions
The author believes this change of hands has entered its last act. Foreigners have sold 13.6% of their January holdings in Seoul this year and come close to the 2021 low. Retail deposits are KRW 51.01tn below June and the shares retail bought this year are down 27.8% on average, so retail has little strength to take all the foreign selling again. The buyer on the first day after the buyback was institutions. So the next support is the company’s return on October 28 and the institutions after it.
The form matters as much as the size. In act two the company’s buyback took more than KRW 800bn a day of shares out of the market on average, and those shares disappear through cancellation. A dividend of the same amount does not buy any shares in the market. As the October 15 stock flow note showed, the median excess return in the two days after a buyback-for-cancellation resolution was +2.9pp. So the author believes that if the October 28 return centers on buybacks and cancellations, the change of hands ends with the company and institutions, and if it leans on dividends, the gap in support lasts longer. The shares left to sell are near the floor, and the buyers are changing. In the first case the author expects the foreign Seoul stake to stop near the 2021 low and institutions to keep holding SK hynix directly, as pension funds have done since July.
Institutions’ next move sits on the same chain. If the company buys again, institutions can adjust their weight against that buying as in act two, and under its stewardship guidelines the NPS stands on the side of voting for buyback proposals that follow the cancellation principle. The less SK hynix falls relative to the KOSPI, the wider next month’s fund limit for investment trusts becomes. The company’s return changes the conditions for institutional buying at the same time.
This view can be checked with the flows in the three days after the October 28 announcement. If the company starts a new buyback, net buying by other corporations will reappear in the hundreds of billions of won a day. If institutions change their judgment, there will be a run of days when investment trusts and pension funds buy alongside financial investment. If foreigners stop, the Seoul stake of 46.33% will stop falling.
Change-of-hands gauges and dates to check: October 28 returns, November 11 MSCI, November 19 end of the buyback period
This chapter gathers the numbers above into six signals and lists the dates when those signals can change. It adds no new claims.
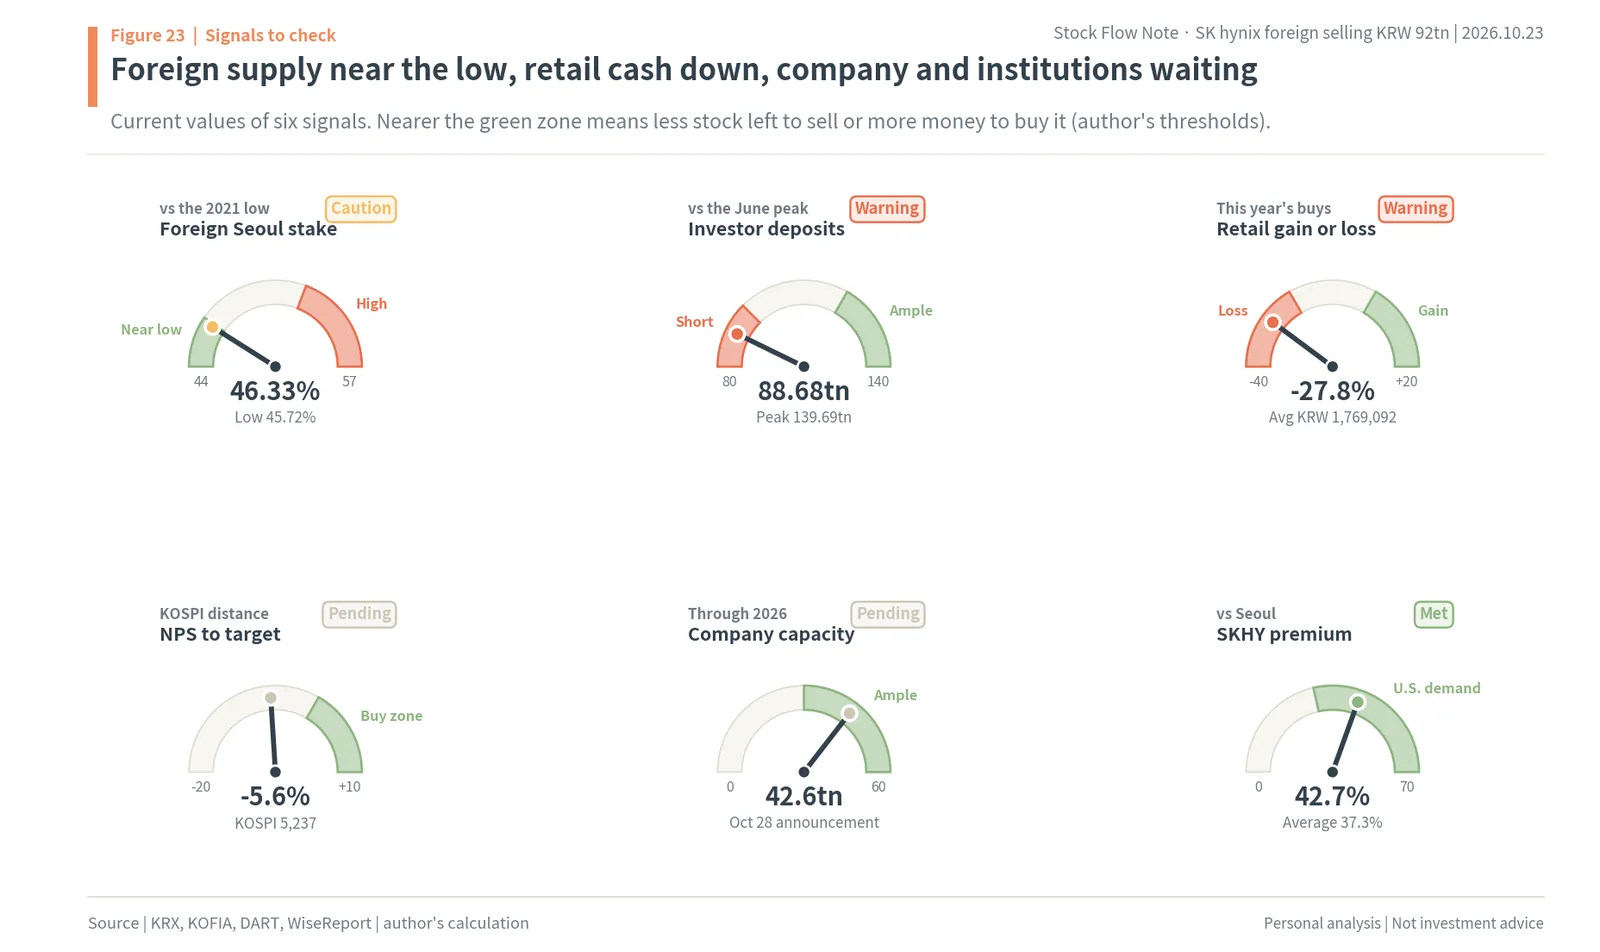
The first signal is the foreign Seoul stake. It is 46.33% now, against the 2021 low of 45.72%. If it stops near the low, foreigners have run out of shares to sell. The second is investor deposits at KRW 88.68tn. They need to return toward the June peak of KRW 139.69tn for retail to become a big support again. The third is the -27.8% gain or loss on the shares retail bought this year. The closer the price gets to the average cost of KRW 1,769,092, the more breakeven selling comes out. The fourth is the -5.6% distance to the KOSPI at which the NPS reaches its target weight. The fifth is the company’s remaining return capacity through 2026, KRW 42.6tn. The sixth is how much more SKHY costs on the Nasdaq than in Seoul, 42.7%, a sign that U.S. investors want the stock more than Seoul does.
There are five dates to check. The biggest is SK hynix’s third-quarter results and additional return announcement at 9 a.m. on October 28. At 10 a.m. on October 29 comes Samsung Electronics’ third-quarter conference call. On November 11 MSCI announces its November index review, effective December 1 (rebalancing at the November 30 close). November 19 is the last day of the buyback period resolved in August. The company said on October 21 that it had finished buying, and as of October 23 its report on the results of the treasury share acquisition had not yet appeared on DART. December 10 is the quarterly expiry of futures and options.
The numbers to watch on each date are also set. On October 28, the size and form of the additional return and whether there is a third-quarter dividend. Last year the company declared a third-quarter dividend of KRW 375 per share on third-quarter results day. From the day after the announcement, whether net buying by other corporations reappears, and whether investment trusts and pension funds buy alongside financial investment. On October 29, what Samsung Electronics says on its call about memory prices and customer demand carries straight over to SK hynix. The November 11 MSCI announcement does not change SK hynix’s index weight, but index money will trade heavily at the November 30 close, when the rebalancing happens. If the buyback results report comes out before November 19, the actual purchase prices and daily purchase amounts can be checked. Those prices become the benchmark to compare against when the company starts buying again.
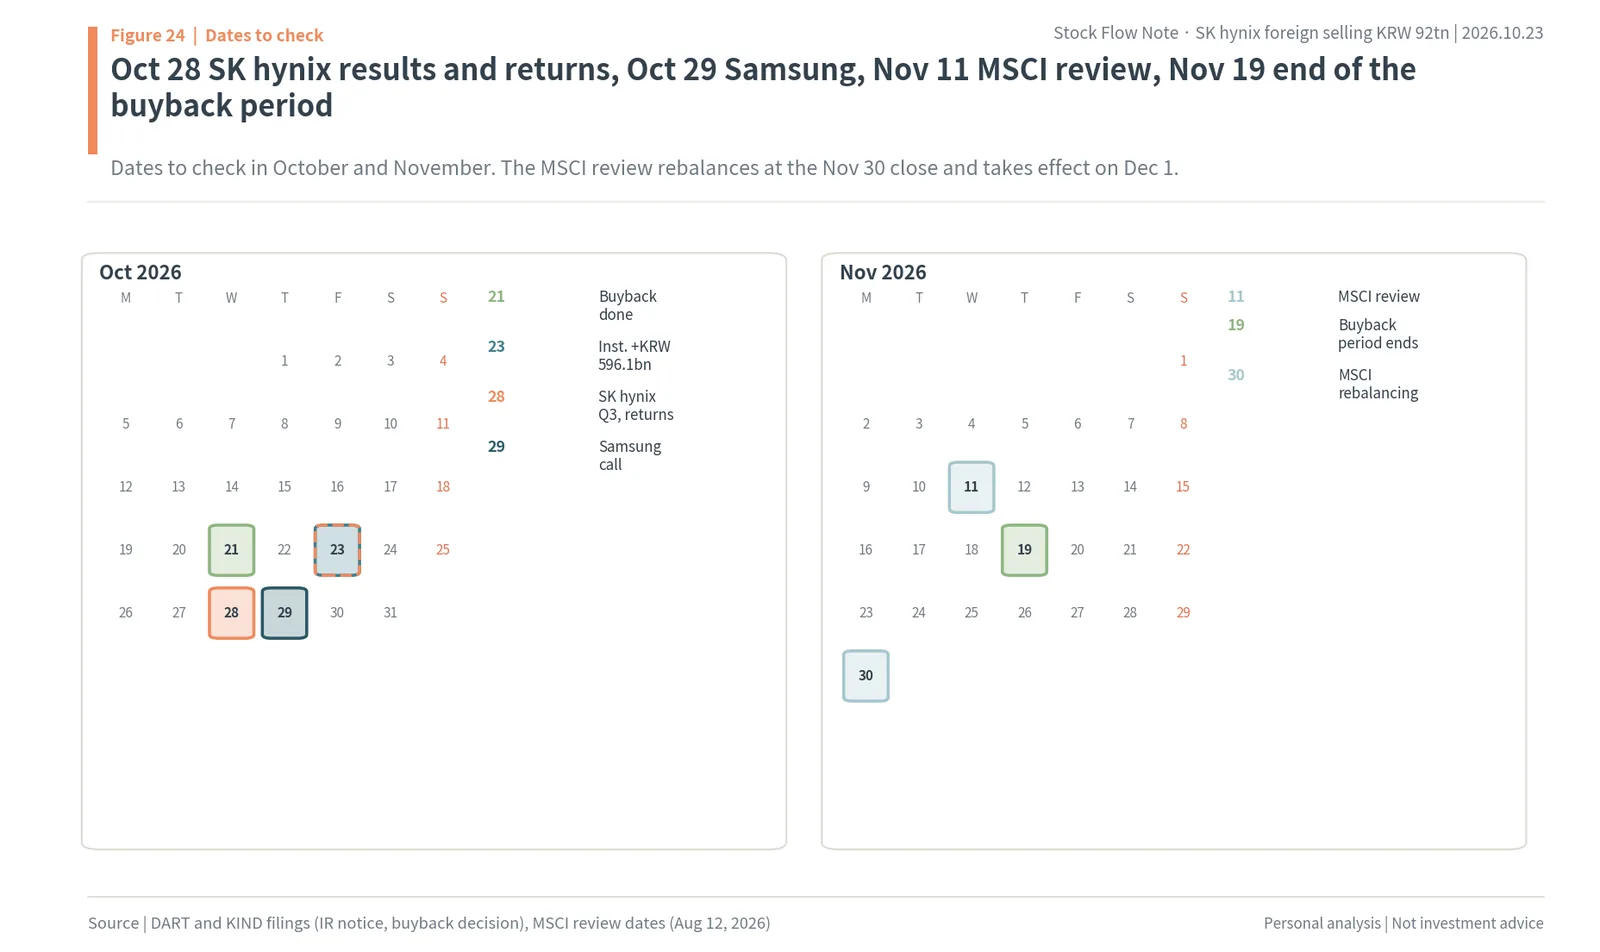
The figure is a calendar for October and November, marking SK hynix’s results on October 28, Samsung Electronics on the 29th, the MSCI announcement on November 11, the end of the buyback period on the 19th and the MSCI rebalancing on the 30th.
Common questions: five things that are easy to misread about SK hynix flows
This chapter regroups the numbers from the earlier chapters as questions. It adds no new claims.
The first question is why the Seoul stake is 46.33% when foreign ownership is 48.78%. The 17.79 million new shares issued for the July SKHY listing on the Nasdaq are held by the U.S. depositary and count as foreign holdings in KRX statistics. But these shares trade only as ADRs on the Nasdaq and never come to the Seoul market as supply. So when counting the shares foreigners can still sell in Seoul, they are left out.
The second question is why retail bought only KRW 0.97tn in October when it bought KRW 42.19tn this year. Retail buying was concentrated from January to July. From August 20 to October 21, while the company bought KRW 40tn of its own shares, retail actually sold KRW 11.26tn. In October retail bought more than KRW 1tn on days of big falls, but sold again on up days, so the total through the 23rd is KRW 0.97tn.
The third question is why other corporations means the company’s buyback. When a company buys its own shares on the market through a broker, the KRX investor statistics count it under other corporations. Net buying by other corporations during the buyback period, KRW 39.67tn, is 99.2% of the KRW 40tn resolved, and other-corporation buying disappeared from October 22, when the buyback was over. In the October 12 stock flow note, too, SK hynix’s daily buyback amounts and other-corporation net buying were almost identical.
The fourth question is whether financial investment’s KRW 16.33tn of buying this year means institutions bought. Financial investment includes shares that liquidity providers buy to create the ETFs retail purchases. From May 27 to June 19, when retail net bought KRW 4.6tn of SK hynix leveraged ETFs, financial investment also bought KRW 3.08tn of SK hynix. Investment trusts, which buy and sell on judgment, sold KRW 6.92tn this year.
The fifth question is whether selling ends when foreign ownership reaches the 2021 low. The low is the record of the past 11 years, a record that includes two memory downturns and the COVID crash, and each time foreign ownership stopped between 45% and 48%. That is because index-tracking money stays at the index weight. This time, since the ratio will rise to 50.43% on its own once the treasury shares are cancelled, share counts are a more accurate guide than the ratio.
Basis of calculation: how the closing price, Seoul stake, average cost, remaining supply and return capacity were counted
This chapter states, chapter by chapter, where the numbers in this report come from.
Share prices are regular-session closes from the KRX Data System. From September 14, 2026, pykrx’s price table (get_market_ohlcv) returns values mixed with the Nextrade after-market session, and it did not reproduce SK hynix’s -11.06% on October 15. So the close used here is KRX market cap divided by listed shares. The October 23 close of KRW 1,277,000 was calculated this way and matches press reports.
Net buying by investor type is the value and share count for the KRX’s investor categories (financial investment, insurance, investment trusts, private funds, banks, other financial institutions, pension funds, other corporations, individuals, foreigners and other foreigners). Institutions are the sum of the seven from financial investment to pension funds. Some press figures combine the KRX and Nextrade or use Koscom data and may differ from this report. Act one is January 2 to August 19, act two is August 20 to October 21 when the company bought its shares, and act three runs from October 22.
Foreign holdings are the KRX count of foreign-held shares. The Seoul stake subtracts the 17.79 million new ADR shares from July 16. The 2021 low in shares is the August 17, 2021 ratio of 45.72% times that day’s 728.00 million listed shares, 332.88 million, and the remaining 5.57 million is the gap to today’s Seoul stake. Values use the October 23 close. The post-cancellation ratio divides by 706.42 million, listed shares minus the 24.07 million bought this time. Treasury shares in the shareholder map are the 1,626,865 at the end of June plus the 24.07 million from this buyback, assuming the company bought all the shares it resolved to buy. The NPS’s 7.32% is the FnGuide figure as reported in the press.
Retail’s average cost was counted from KRX retail net buying in value and shares from January 2. On net buying days that day’s value and shares are added; on net selling days shares and cost are removed at the average cost up to that point. It is not any individual investor’s actual cost but an approximation treating all retail investors as one account. Financial investment’s average cost was counted the same way.
Dip buying is the Pearson correlation between SK hynix’s daily price change and that day’s retail net buying over this year’s 197 trading days. Deposits and margin loans are KOFIA freesis values for October 22. The KRW 37.4tn deposit share for SK hynix is the extreme assumption of KRW 88.68tn of deposits times SK hynix’s 42.2% share of retail KOSPI net buying this year.
The NPS weight estimate uses the same method as the October 15 stock flow note. From the end-July disclosure (a KRW 1,684.2tn fund with KRW 418.6tn in domestic stocks), only domestic stocks are assumed to move with the KOSPI while other assets stay the same. The remaining return capacity of KRW 42.6tn and KRW 175.2tn is the value calculated in the October 15 stock flow note from the WiseReport FCF consensus: 50% of 2025 to 2026 FCF minus the buybacks and dividends already paid.
The SKHY premium is the SKHY close on a given day divided by (the Seoul close × 0.1 ÷ KRW per dollar from Yahoo KRW=X) minus 1. U.S. chip stock changes compare Yahoo Finance closes on June 22 and October 22. The August 2021 numbers were counted from the same KRX data, and that week’s foreign selling of KRW 2.02tn and retail buying of KRW 2.14tn match the Seoul Economic Daily report at the time.
SK hynix foreign selling in 2026: quick answers
Q. How much SK hynix stock have foreigners sold in 2026, and who bought it?
From January 2 to October 23, 2026, foreign investors net sold KRW 92.37tn of SK hynix. Retail investors bought KRW 42.19tn (45.7%), the company through its own buyback, counted as other corporations, KRW 41.26tn (44.7%), and institutions KRW 8.64tn (9.4%). Retail bought mostly from January to August 19, and the company from August 20 to October 21.
Q. Why is the foreign Seoul stake 46.33% when foreign ownership is 48.78%?
The 17.79 million new shares issued for the July 2026 Nasdaq listing of SKHY ADRs are held by the U.S. depositary and count as foreign holdings in KRX data, but they trade only on the Nasdaq. Excluding them, foreigners hold 338.45 million shares in Seoul, 46.33% of listed shares, just 5.57 million shares (KRW 7.11tn) above the August 2021 low of 45.72%.
Q. Who bought SK hynix after the company’s buyback ended?
The company finished its KRW 40tn buyback on October 21. On October 23 foreigners sold KRW 564.6bn and institutions bought KRW 596.1bn: financial investment KRW 244.6bn, investment trusts KRW 140.7bn, private funds KRW 102.9bn, pension funds KRW 72.3bn and insurance KRW 32.9bn, while retail sold KRW 13.4bn. SK hynix rose 4.42% to KRW 1,277,000 after it dropped the Solidigm listing review.
Q. Can retail investors keep absorbing foreign selling?
Investor deposits fell from KRW 139.69tn on June 4 to KRW 88.68tn on October 22, below the January 2 level. By the author’s average-cost calculation, the 26.59 million SK hynix shares retail accumulated this year cost KRW 1,769,092 on average, so the position is down 27.8% at the October 23 close. Even putting 42.2% of all deposits into SK hynix would be KRW 37.4tn, 8.7% of the foreign Seoul stake.
Q. Will the National Pension Service buy SK hynix?
The NPS held 7.32% of SK hynix on October 15. By the author’s estimate its domestic equity weight is about 21.8% against a 20.8% target, so its rule points to buying only below a KOSPI of about 5,237, 5.6% under the October 23 level of 5,550.30. Pension funds as a group bought KRW 1.5539tn of SK hynix in the third quarter.
Q. What happens on October 28?
SK hynix reports third-quarter results at 9 a.m. and has said it will announce the size and form of additional shareholder returns. Its pledge is to return at least 50% of 2025-2027 free cash flow; by the author’s calculation KRW 42.6tn remains through 2026, 4.1 times October’s foreign net selling of KRW 10.31tn. At KRW 1,277,000, KRW 30tn of buybacks would buy 23.49 million shares, 4.2 times the shares foreigners have left above the 2021 low.
Sources
- Korea Exchange (KRX) Data System: SK hynix and KOSPI trading by investor type (value and shares), foreign holdings and market cap (pykrx, regular-session close on Oct 23, 2026, including August 2021)
- Korea Financial Investment Association (KOFIA) freesis: investor deposits, margin loan balances and forced sales (Oct 22, 2026)
- DART, SK hynix treasury share acquisition decision, share cancellation decision and shareholder return fair disclosure (link), Aug 19, 2026; clarification on the Solidigm report (link), Oct 23, 2026; notice of IR event (link), Oct 14, 2026; 2026 half-year report, 5% holding reports (SK Square, Capital Group, BlackRock), results of the new share issue for the ADRs, Jul 15, 2026
- MSCI, Korea and Emerging Markets index factsheets (Sep 30, 2026), Index Review Dates (Aug 12, 2026)
- WiseReport and FnGuide consensus; Newsis, Will SK hynix Q3 operating profit top KRW 80 trillion (link), Oct 18, 2026; Newsis, Meritz Securities Q3 outlook (link), Oct 12, 2026; Newspim, SK Securities report briefing (link), Oct 12, 2026; Wide Daily, Hana Securities on SK hynix (link), Oct 13, 2026; Supple, IBK Securities on SK hynix (link), Oct 7, 2026
- Money Today, Morgan Stanley: “Sell SK hynix, target price halved” (link), Aug 12, 2021; Seoul Economic Daily, Retail took all of the KRW 7 trillion foreigners dumped (link), Aug 16, 2021
- Yonhap Infomax, Foreigners dumping SK hynix: KRW 16 trillion sold over a month (link), Oct 22, 2026; Herald Economy, Foreigners bought Samsung and sold SK hynix (link), Oct 22, 2026; Weekly Donga, Solidigm listing controversy and SK hynix foreign ownership below 50% (link), Oct 22, 2026; Korea Economic Daily, Why SK hynix alone falls more (link), Oct 17, 2026
- Yonhap News, Hedge funds cut tech at the fastest pace in a decade (link), Oct 2026; News1, Goldman Sachs on the KOSPI’s 20% plunge in eight days (link), Oct 19, 2026; Edaily, SK hynix ADR premium over common shares (link), Oct 14, 2026; Yonhap Infomax, KOSPI shrugs off the Meta shock (link), Oct 23, 2026
- Hankook Ilbo, SK hynix drops the Solidigm listing (link), Oct 23, 2026; Etoday, SK hynix rebounds 4.42% as Solidigm U.S. listing is dropped (link), Oct 23, 2026; Ziksir, SK hynix completes KRW 40 trillion buyback (link), Oct 21, 2026
- Financial News, NPS stock holdings lose KRW 182 trillion in three and a half months (link), Oct 18, 2026; Newspim, NPS domestic equity target weight 20.8% (link), May 28, 2026; Jungan News, Seventh NPS fund management committee (link), Oct 20, 2026; Newspim, Pension funds buy KRW 1.6 trillion of SK hynix (link), Oct 2, 2026; Money Today, What the NPS chose (link), Oct 5, 2026
- Asia Today, Active funds with 55% in Samsung and SK hynix (link), Sep 3, 2026; KOFIA, notice of SK hynix’s September market cap weight (link), Oct 1, 2026
- CBS NoCut News, Per-stock margin loan limits (link), Sep 23, 2026; Seoul Economic Daily, Margin balances in Samsung and SK hynix fall as debt-funded buying is curbed (link), Oct 22, 2026; Newsway, Forced sales surge even as margin debt falls (link), Oct 20, 2026
- FunETF, KODEX and TIGER SK hynix single-stock leveraged ETFs (accessed Oct 23, 2026); Kyunghyang Shinmun, SK hynix single-stock leveraged ETF falls below KRW 5,000 (link), Oct 20, 2026; Financial News, SK hynix leveraged ETF returns (link), Oct 23, 2026; Kangwon Domin Ilbo, Retail net buys KRW 125.9 billion of leveraged ETFs (link), Oct 13, 2026; Business Watch, ETF Watch (link), Oct 17, 2026
- Financial News (Newsis), Korean retail net buying of U.S. stocks hits a nine-month high (link), Oct 23, 2026; Seoul Economic Daily, 74% of SK hynix retail investors at a loss (link), Oct 23, 2026; Digital Times, KB Securities sees a W-shaped rebound by year-end (link), Oct 22, 2026; Korea Economic Daily, “Now is the chance” forecast (link), Oct 20, 2026
- Yahoo Finance, closing prices for Nvidia, Micron, the Philadelphia Semiconductor Index and SKHY, and the won-dollar rate (Oct 22 and Oct 23, 2026)
- Photos: Ajay Suresh (CC BY 2.0), 4300streetcar (CC BY 4.0), Narubaru7 (CC BY 4.0), Americasroof (CC BY-SA 3.0), via Wikimedia Commons
Disclaimer
This post records the author’s personal analysis and views based on publicly available information and does not recommend any particular product or company. It does not recommend buying or selling any financial investment product and is not an investment advisory service.
Figures are as published at the time of writing. The foreign Seoul stake and the shares left above the 2021 low, retail’s average cost, the SK hynix share of investor deposits, the estimated National Pension Service weight, the remaining return capacity, the SKHY premium and the dollar conversions were calculated by the author from public data and market prices and are not confirmed facts. Accuracy and completeness are not guaranteed.
“Author’s calculation,” “author’s view” and “author’s estimate” mark the author’s own calculations and assumptions, not confirmed facts. This post does not recommend trading at any particular time or promise any return.
Author’s interests: not disclosed
Responsibility for decisions and their outcomes lies with the reader.
As of: October 23, 2026
Was this note useful?
Thanks. Your answer helps decide what to cover next.
Korea market snapshot · Oct 23, 2026
New to Korean stocks? Start here for the basics.
Most read
1France Protests 2026: Why Students Are Blocking Schools and Which Stocks Benefit (Munich Re, SCOR)
Get the Saturday note on Korean stocks
One email every Saturday with the week’s new research on Korean listed companies and links to the updated data pages. Built from DART filings and KRX data. Free; unsubscribe in one click. See past issues