Free Cash Flow (FCF) Explained: Formula, FCF Yield and Samsung Electronics’ KRW 243tn of Cash (Korean Stocks)
Free cash flow (FCF) is the cash a company actually keeps after paying for plants and equipment: operating cash flow minus capex. Net income is a book figure; FCF is the ceiling on dividends and buybacks. Among 112 large Korean companies, 18 of the 96 profitable in 2025 had negative FCF, and only about two-thirds of five-year profit (median 66.4%) was left as cash. Samsung Electronics’ FCF grows from KRW 37.8tn in 2025 to an estimated KRW 243.0tn in 2026. Data as of the October 8, 2026 close.
- FCF = operating cash flow − capex. Net income + depreciation − increase in working capital = operating cash flow; subtract capex to get FCF.
- Hypothetical: two companies with the same KRW 100bn net income and 15x PER can have FCF of KRW 100bn or KRW 10bn, FCF yields of 6.7% vs 0.7%.
- Of 96 large Korean companies profitable in 2025, 18 had negative FCF; the five-year median FCF ÷ net income was 66.4%.
- Samsung Electronics’ FCF rises from KRW 37.8tn (2025) to an estimated KRW 243.0tn (2026), an FCF yield of 15.86% vs a 10-year treasury yield of 4.395%.
- Samsung Electronics and SK hynix tie shareholder returns to 50% of FCF; LG Energy Solution’s five-year FCF was KRW -28.4tn while it built plants.
Key takeaways
- Add depreciation to net income and subtract the increase in working capital to get operating cash flow; subtract capex from that to get free cash flow (FCF). That leftover cash is the ceiling on dividends and buybacks.
- Of the 96 large Korean companies (out of 112 studied) that were profitable in 2025, 18 had negative FCF, and the median five-year FCF ÷ net income was 66.4%.
- Samsung Electronics (005930.KS) FCF grows from KRW 37.8tn (about $27bn) in 2025 to an estimated KRW 243.0tn (about $174bn) in 2026, and Samsung Electronics and SK hynix (000660.KS) both tie shareholder returns to 50% of FCF.
Written: October 10, 2026 (prices and market caps are KRX closes on October 8; Korean markets were closed on October 9 for Hangul Day)
Concepts covered: operating cash flow, capital expenditure (capex), free cash flow (FCF), cash conversion, FCF yield, FCF-based shareholder returns
Dollar figures are converted at about KRW 1,400 per dollar for readability.
1. What is free cash flow (FCF)? The ceiling on dividends and buybacks
This report explains free cash flow (FCF) with numbers from Korea’s largest listed companies. It asks one question. When a company reports a profit, how much of that profit can actually come back to shareholders as cash? The answer is that free cash flow (FCF), not net income, is the ceiling on dividends and buybacks. Net income is a book figure set by accounting rules; FCF is the cash actually left in the company’s vault after it takes in cash from the business and pays for plants and equipment.
The gap opens in three ways. First, depreciation spreads the cost of equipment already bought over several years, so no cash leaves that year and cash ends up larger than net income. Second, when goods sold on credit (receivables) and inventory piling up in the warehouse grow, profit is booked but cash has not come in, so cash ends up smaller than net income. Third, capex on new plants and equipment is not expensed all at once, but the cash goes out all at once that year. Pass through the first two and you get operating cash flow; pass through the third as well and you get FCF.
At large Korean companies the gap is not small. From the top 150 by market cap on October 8, the author removed banks, brokers, insurers, holding companies and companies whose cash flows are distorted by consolidated financial subsidiaries, leaving 112 companies. Of the 96 that were profitable in 2025, 18 had negative FCF and 66 had FCF smaller than net income (author’s calculation). Over the five years 2021–2025, the median of FCF as a percentage of net income (cash conversion) was 66.4%. Only about two-thirds of the profit earned was left as cash.
So this report lays out the order in which to put FCF next to profit. The first part draws the bridge from net income to FCF with a hypothetical example and Samsung Electronics. The middle looks at totals, sectors and stocks across the 112 companies. The last part moves through FCF yield, shareholder return policies and the negative FCF of US companies investing in AI, and ends with six steps for applying all this to your own stock. The numbers come from WISEfn’s consolidated financial summary (2021–2025 actuals and 2026–2027 consensus, retrieved October 10, 2026) and KRX closing prices and market caps on October 8; all ratios are the author’s calculations.
2. FCF in Korean stocks: consolidated data, WISEfn, DART and 50% FCF payout rules
All company figures in this report are consolidated, the same basis Korean listed companies use in their headline results, so a parent’s numbers include its subsidiaries. The 112 companies are drawn from the largest stocks by market cap on the Korea Exchange (KRX), which runs two main boards: KOSPI for large established companies and KOSDAQ for smaller and growth companies.
Actuals and forecasts come from WISEfn, the data provider whose financial summary appears on each company’s page in Naver Finance, a major Korean stock portal. The 2026 and 2027 columns there are brokers’ consensus estimates, and the same screen lists operating cash flow, capex, FCF, net income and the cash payout ratio, so readers can repeat every step in this report. Company filings themselves are published on DART, Korea’s electronic disclosure system.
What makes FCF especially relevant in Korea now is that the two biggest companies write it into their payout rules. Samsung Electronics promised to return 50% of its 2024–2026 FCF to shareholders, and SK hynix uses 50% of its cumulative 2025–2027 FCF as its return pool (widened in August 2026 to “50% or more”). When these two companies’ FCF grows, the cash paid to their shareholders grows with it by rule, not by discretion.
3. How the numbers were counted: 112 Korean large caps, WISEfn consolidated data
Which companies, which figures, and how
To read the numbers correctly, you first need to know what was counted. The starting point is the 150 largest companies by KRX market cap on October 8 (excluding preferred shares, SPACs and REITs). Banks, securities firms, insurers, card companies and conglomerate holding companies were removed, because a financial company’s customer deposits and loans run through operating cash flow, so its FCF does not describe the business. Next came companies whose operating cash is heavily distorted by consolidated finance subsidiaries (Hyundai Motor, Kakao), companies that are mainly investment or holding vehicles (SK Square, SK, HD Hyundai, LS, GS, Hanjin KAL, EcoPro, OCI Holdings, Hanmi Science), the financial service Kakao Pay and the infrastructure fund Macquarie Korea Infrastructure. One more company whose WISEfn summary could not be downloaded (Samsung Epis Holdings) also dropped out, leaving 112.
All cash flow figures are consolidated figures from the WISEfn financial summary shown on Naver Finance: operating cash flow, capex, FCF, net income attributable to owners and the cash dividend payout ratio, with 2021–2025 actuals and 2026–2027 consensus. FCF is taken as shown on that screen, that is, operating cash flow minus capex. Depreciation was derived from the same company’s valuation screen as EBITDA minus operating profit. Figures came in KRW 100 million units and were converted to KRW trillions and rounded to one decimal, so totals and the sum of their parts can differ by about KRW 0.1tn.
Two kinds of net income are used. Ratios compared with the shareholders’ share, such as FCF ÷ net income, use net income attributable to owners. Samsung Electronics’ bridge from net income to FCF uses consolidated net income (including minority interests), which covers the same scope as operating cash flow. Samsung’s 2025 net income attributable to owners was KRW 44.3tn and its consolidated net income KRW 45.2tn. Total dividends are not shown separately on the screen, so they were estimated as net income attributable to owners times the cash payout ratio. Buybacks are not included in that estimate.
The 2026 and 2027 numbers are consensus, an average of broker estimates. Consensus changes with every earnings release and differs by source: WISEfn consensus puts Samsung Electronics’ 2026 FCF at KRW 243.0tn, while IB Tomato estimates KRW 251.5tn. The FCF a company uses in its own policy can also differ from WISEfn’s: Samsung subtracts long-term supply agreement prepayments and employee stock compensation outlays. For comparability this report uses the same WISEfn definition for every company and says so where a company’s own definition is used.
4. FCF formula: operating cash flow minus capex (with a hypothetical example)
Two dictionaries count the same money from different ends
The Ministry of Economy and Finance’s economic glossary defines free cash flow as operating cash flow minus capital expenditure, and notes that this money is used to expand production, develop new products, acquire companies, pay dividends and repay debt. The Hankyung economic dictionary describes it as the cash left from the money a business earns after taxes, operating costs and capex, and writes the formula as net income + depreciation − increase in fixed assets − increase in net working capital. The two dictionaries count the same money from different starting points. One starts from operating cash on the cash flow statement; the other starts from net income on the income statement and converts it into cash.
This report uses the ministry’s version: operating cash flow − capex. WISEfn’s financial summary reports FCF the same way, and the US FCF exchange-traded fund Pacer US Cash Cows 100 also defines FCF in its prospectus as operating cash flow minus capital expenditure. That means Korean listed companies can be put on the same yardstick as US data. As the Hankyung dictionary adds, when FCF is negative, the shortfall has to be covered by borrowing from outside or issuing new shares.
FCF also comes in two versions, depending on whose share it is. Cash that creditors and shareholders can take together is FCFF; cash left for shareholders after interest and principal on debt is FCFE (CFA Institute). FCFF is used to value the whole company and FCFE to value the shareholders’ part. When newspapers and companies simply say FCF, they mostly mean operating cash − capex, and this report uses it in that sense.
Hypothetical example: same net income and PER, a tenfold gap in FCF
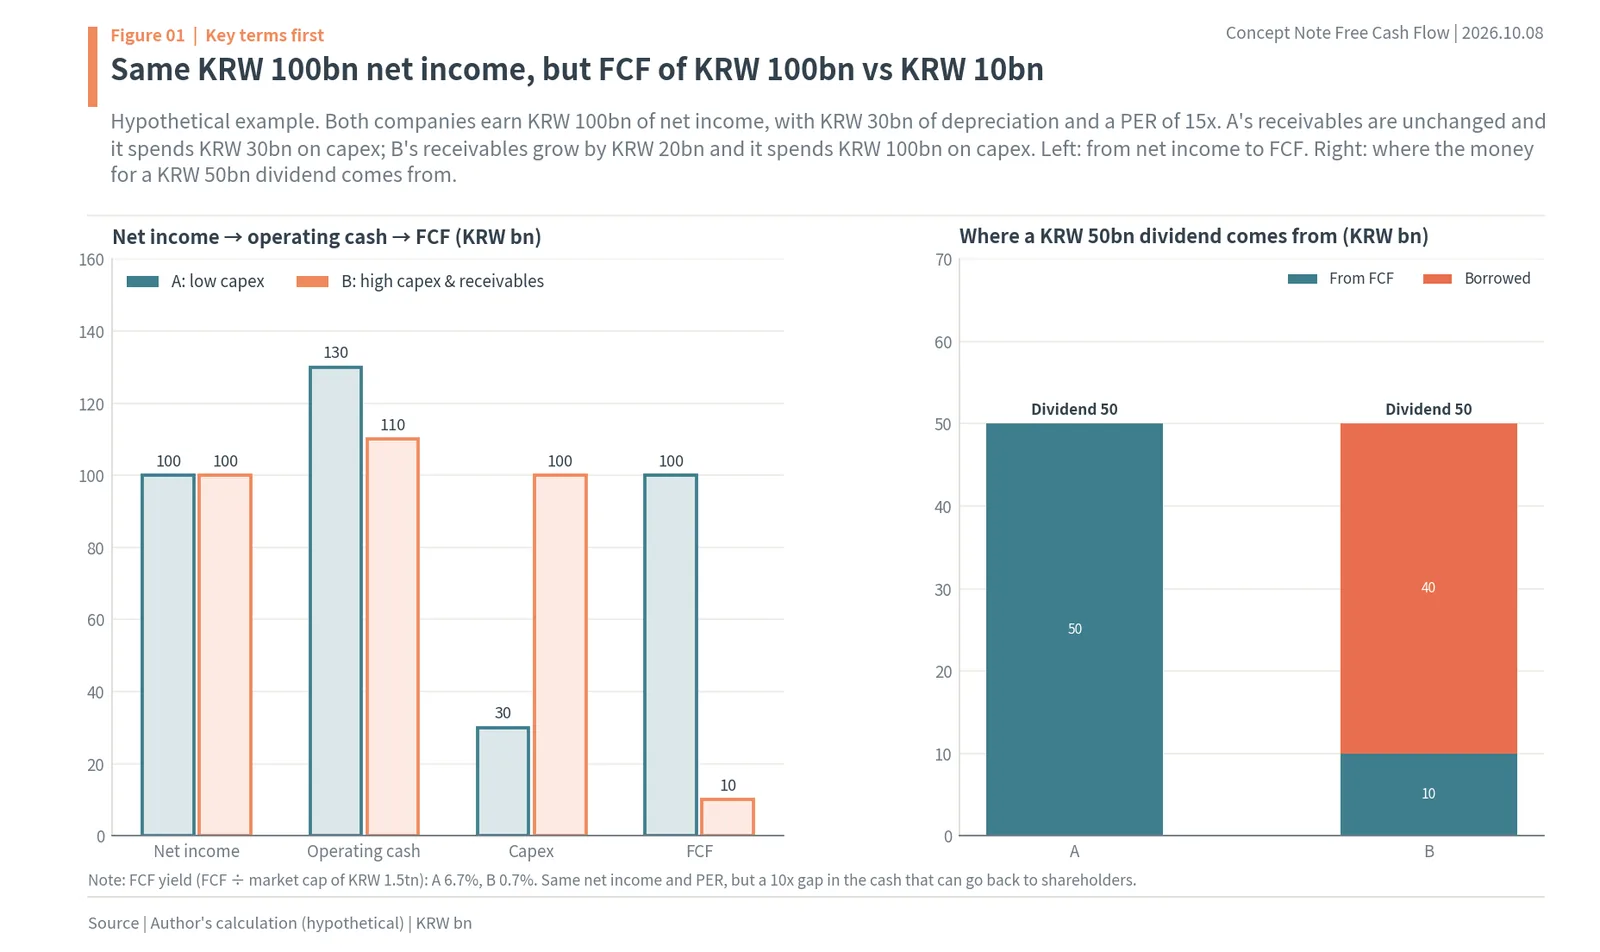
Figure 1 shows two hypothetical companies. Both earn net income of KRW 100bn, have KRW 30bn of depreciation and trade at 15 times net income, a market cap of KRW 1.5tn. On the income statement and PER alone, they are twins. A’s receivables are unchanged and it spends only KRW 30bn replacing old equipment. B, growing, has KRW 20bn more in receivables and spends KRW 100bn on a new plant.
A’s operating cash is net income of KRW 100bn plus KRW 30bn of depreciation, KRW 130bn; subtract KRW 30bn of capex and FCF is KRW 100bn. B’s operating cash is the same KRW 130bn minus the KRW 20bn increase in receivables, KRW 110bn; subtract KRW 100bn of capex and FCF is KRW 10bn. Net income is the same, but the cash left in A’s vault is 10 times B’s. FCF divided by market cap, the FCF yield, is 6.7% for A and 0.7% for B (author’s calculation).
The difference shows up directly in the money that goes back to shareholders. Suppose both pay the same KRW 50bn dividend. A only needs half of its KRW 100bn FCF, but B uses up all KRW 10bn of FCF and is still KRW 40bn short, so it has to borrow. If B pays dividends like this every year, debt piles up and eventually it must cut the dividend or stop investing. That is why the ceiling on dividends and buybacks is FCF, not net income.
Conversely, even if B pays no dividend and keeps all its FCF, only KRW 10bn is left. What B’s shareholders can expect is not a dividend today but the new plant running and operating cash rising a few years from now. B’s share price therefore leans more on future growth than A’s, and if the plant does not run as planned, that expectation breaks first. At the same PER of 15x, A is priced on cash today and B on cash in the future. The valuation section below turns this difference into a number: the growth the share price has priced in.
5. From net income to FCF: Samsung Electronics 2025
Add depreciation, subtract working capital, subtract capex
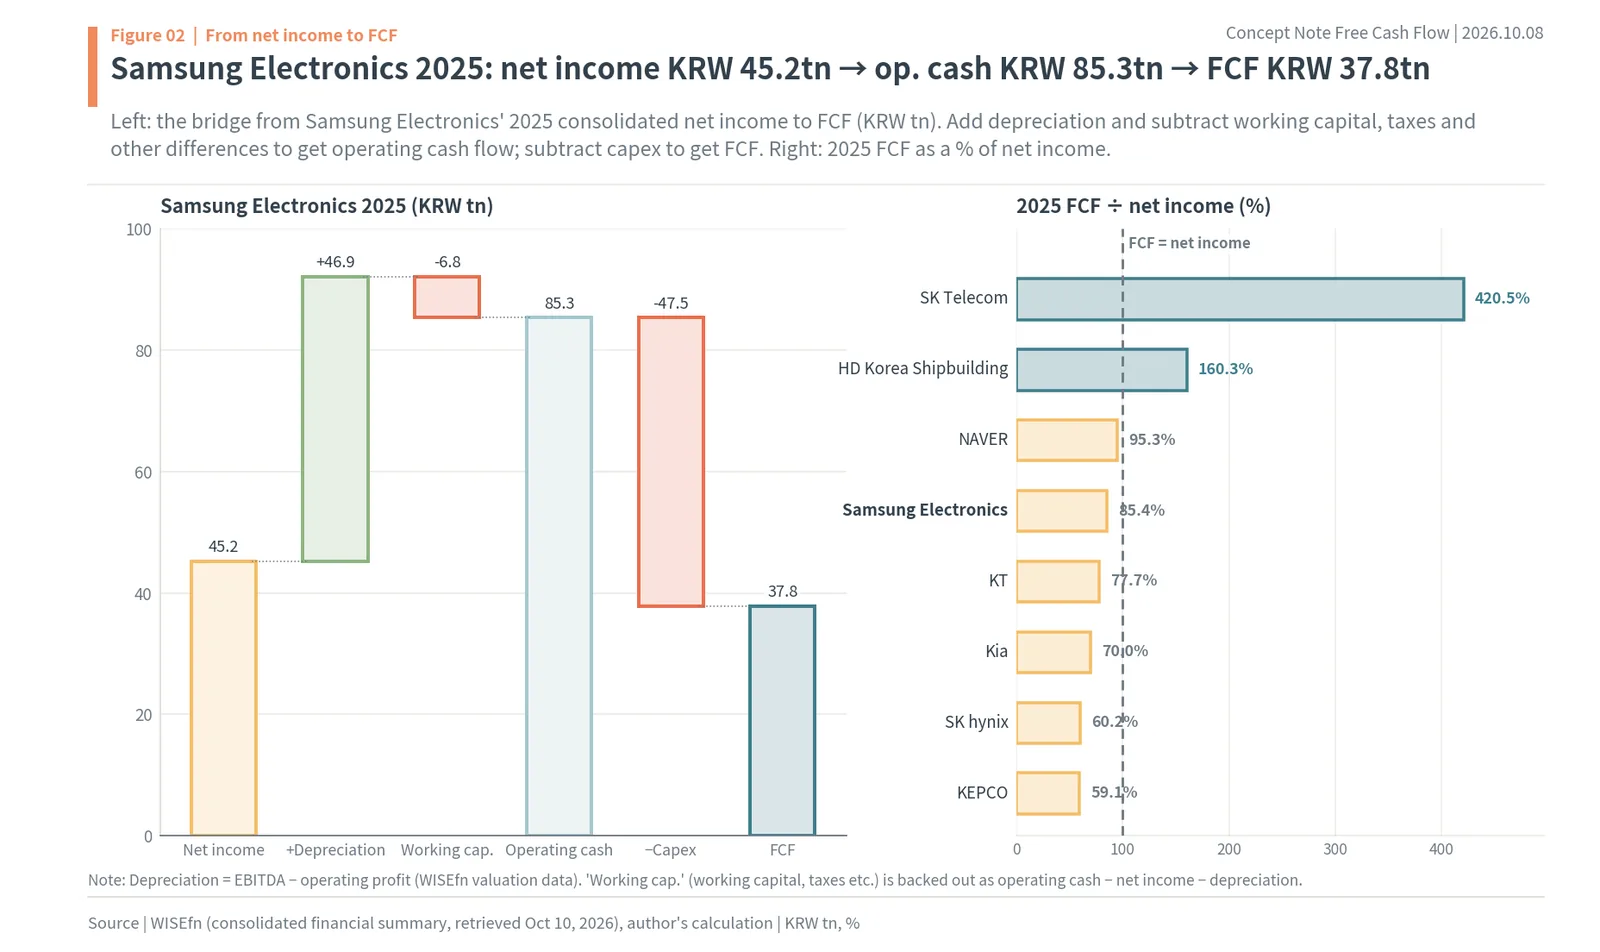
The left side of Figure 2 draws the same bridge for a real company. Samsung Electronics’ 2025 consolidated net income was KRW 45.2tn. Add KRW 46.9tn of depreciation, calculated as EBITDA minus operating profit from WISEfn’s valuation data. Its chip plants and equipment are so large that depreciation exceeds net income. Then KRW 6.8tn of working capital, tax and other differences comes off; this figure is backed out as operating cash minus net income minus depreciation. That gives operating cash flow of KRW 85.3tn.
Then KRW 47.5tn of capex goes out, the money for new memory and foundry lines and replacement equipment. The FCF left is KRW 37.8tn, 85.4% of net income of KRW 45.2tn (on WISEfn’s controlling-interest net income of KRW 44.3tn). Samsung Electronics spent slightly more on capex (KRW 47.5tn) than it added back as depreciation (KRW 46.9tn). This is the basic shape of an equipment-heavy company. Because it spends on new equipment every year roughly what depreciation takes off the books, FCF struggles to exceed net income.
The right side of Figure 2 compares that year’s FCF as a percentage of net income with other large companies. At SK Telecom it was 420.5% and at HD Korea Shipbuilding (HD KSOE) 160.3%, so FCF was larger than net income. A telecom’s heavy depreciation makes net income look small, yet that depreciation comes in as cash, and when capex that year is smaller, FCF exceeds net income. At the other end, SK hynix was at 60.2% and KEPCO at 59.1%, leaving only about 60% of net income as cash. Even with the same net income, the cash left over differs this much by sector and by year.
Samsung Electronics’ five-year bridge: same shape, different size
Stretching Samsung Electronics’ bridge over 2021–2025 shows what set FCF each year. In 2021, consolidated net income of KRW 39.9tn, depreciation of KRW 34.2tn and working capital and other items of KRW -9.0tn made operating cash of KRW 65.1tn; subtracting capex of KRW 47.1tn left FCF of KRW 18.0tn. In 2022 net income was larger at KRW 55.7tn, but working capital and other items took out KRW 32.6tn, so operating cash was only KRW 62.2tn and, after KRW 49.4tn of capex, FCF was KRW 12.8tn. The year with the largest profit had a smaller FCF: inventory and receivables piled up and profit did not turn into cash.
In 2023 net income fell to KRW 15.5tn while capex was the largest of the five years at KRW 57.6tn. Operating cash of KRW 44.1tn could not cover it, and FCF was KRW -13.5tn; capex was not cut in a memory downturn. In 2024 net income of KRW 34.5tn, depreciation of KRW 42.6tn and a smaller working capital drag of KRW -4.1tn gave operating cash of KRW 73.0tn and, after KRW 51.4tn of capex, FCF of KRW 21.6tn. 2025 is the KRW 37.8tn seen above.
Side by side, depreciation rose steadily from KRW 34.2tn to KRW 46.9tn and capex stayed between KRW 47tn and KRW 58tn. What swung FCF was net income and working capital. For a capital-heavy company like a chipmaker, FCF depends as much on how much inventory and receivables build up in profitable years as on the size of capex.
6. Working capital: why cash lags profit
When receivables and inventory grow, cash arrives late
After depreciation, the next biggest gap between net income and operating cash is working capital. Working capital is money tied up in running the business, and it comes in three main forms: receivables (money owed for goods sold but not yet collected), inventory made to sell and kept in the warehouse, and payables (raw materials bought but not yet paid for). The first two tie up the company’s money; the last uses other people’s money for a while.
When sales grow, receivables and inventory usually grow with them. The income statement books profit on what was sold, but cash does not come in until the bills are collected, and cash goes out first for the inventory piled up. So the faster a company grows, the more easily its operating cash looks smaller than its profit. Conversely, when sales fall or receivables are collected all at once, operating cash can be large even when profit is small. In the hypothetical example, B’s operating cash fell by its KRW 20bn increase in receivables in exactly this way.
The gap is a time lag, not money that disappears. Receivables are collected eventually and inventory is sold. But if the lag widens every year, the company always lives on less cash than its profit and fills the hole with borrowed money. So when you look at FCF, check how much working capital rises each year and whether that increase matches the pace of sales growth. In Samsung Electronics’ 2025 bridge, working capital, tax and other differences were KRW -6.8tn, small next to net income of KRW 45.2tn.
7. How to read a cash flow statement: operating, investing, financing
Earn in operating, spend in investing, fill the gap in financing
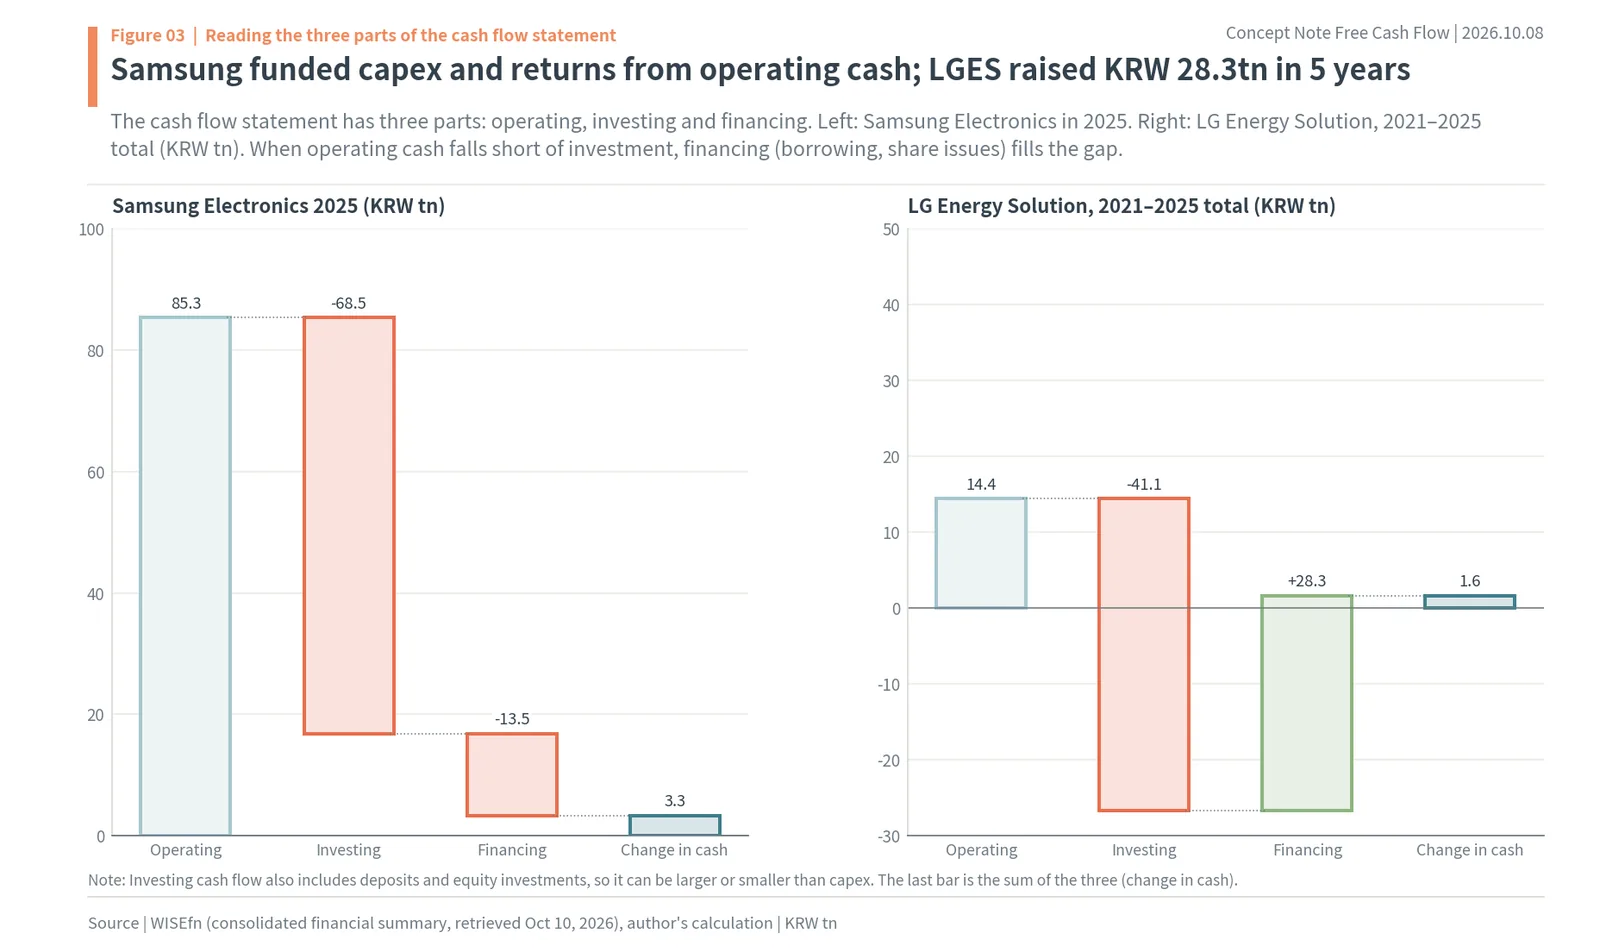
FCF comes from the cash flow statement, which is split into three parts: operating, investing and financing. Operating cash flow is cash in and out from the business; investing cash flow is cash spent on plants and equipment or put into and taken out of deposits and equity stakes; financing cash flow is cash from borrowing, repaying, paying dividends, buying back shares and issuing new shares. Add the three and you get how much the cash in the company’s vault rose or fell that year.
The left side of Figure 3 is Samsung Electronics in 2025. KRW 85.3tn came in from operations, KRW 68.5tn went out in investing and KRW 13.5tn went out in financing, which includes dividends and buybacks. The three add up to KRW 3.3tn: the company paid for both investment and shareholder returns out of operating cash and still added a little cash. Investing cash flow of KRW 68.5tn is larger than capex of KRW 47.5tn because money put into deposits and equity stakes is included. FCF subtracts only the capex part.
The right side is LG Energy Solution (373220.KS), 2021–2025 combined. KRW 14.4tn came in from operations, but KRW 41.1tn went out in investing. The company covered the gap by raising KRW 28.3tn through financing, and the three parts add to a KRW 1.6tn change in cash. Its five-year FCF of KRW -28.4tn, shown in the five-year section below, almost matches the KRW 28.3tn raised through financing. The Hankyung dictionary’s point that negative FCF must be covered by borrowing or selling shares fits the numbers exactly.
These three parts sum up a company’s condition in one line. Operating plus, investing minus, financing minus: a company that invests out of what it earns and pays back shareholders and creditors. Operating plus, investing minus, financing plus: a company that invests more than it earns and brings in money from outside. Samsung Electronics in 2025 has the first shape; LG Energy Solution over five years has the second.
8. FCF of 112 large Korean companies, 2021–2027E
In 2022 and 2023, capex exceeded operating cash
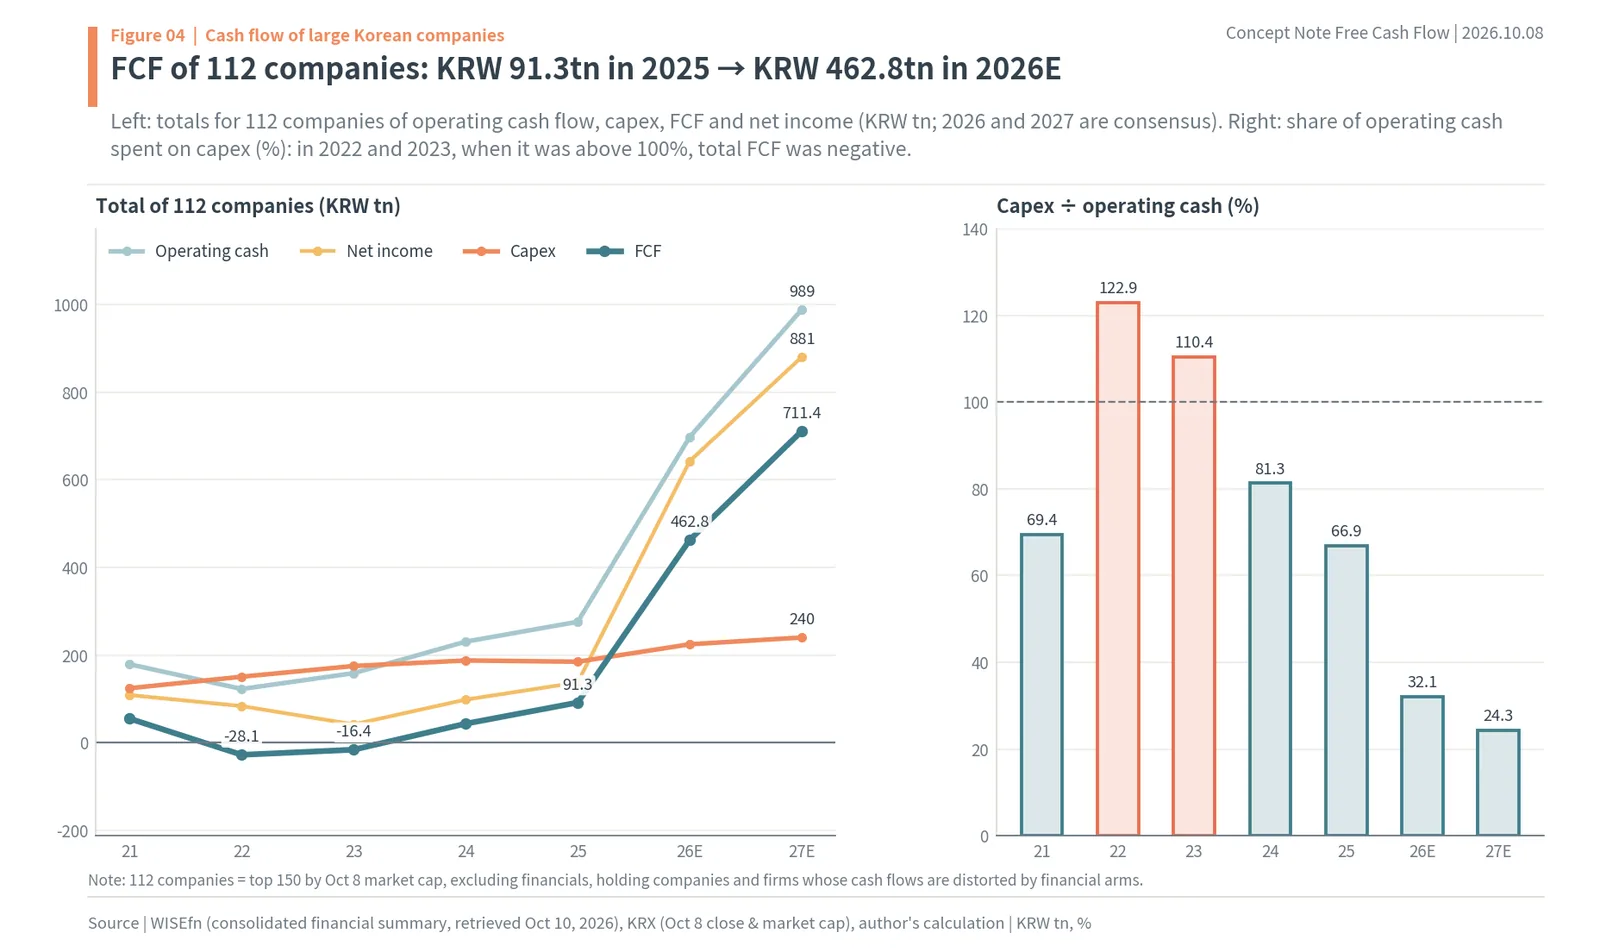
The left side of Figure 4 adds up operating cash flow, net income, capex and FCF for the 112 companies each year. In 2021 they earned KRW 178.7tn of operating cash, spent KRW 124.0tn on capex and kept KRW 54.6tn of FCF. In 2022 operating cash fell to KRW 122.3tn while capex rose to KRW 150.3tn, so total FCF was KRW -28.1tn; in 2023 operating cash of KRW 158.4tn against capex of KRW 174.8tn gave KRW -16.4tn. For two years, large Korean companies as a whole spent more on plants than the cash they earned.
The bars on the right show the share of operating cash spent on capex. It went from 69.4% in 2021 to 122.9% in 2022 and 110.4% in 2023, exceeding operating cash, then fell to 81.3% in 2024 and 66.9% in 2025. Consensus puts it at 32.1% in 2026 and 24.3% in 2027. Capex keeps rising, from KRW 184.5tn in 2025 to KRW 224.4tn in 2026 and KRW 239.9tn in 2027, but operating cash rises much faster, from KRW 275.8tn to KRW 698.0tn and KRW 989.0tn. As a result, total FCF of the 112 companies is estimated to rise from KRW 91.3tn in 2025 to KRW 462.8tn in 2026 and KRW 711.4tn in 2027.
CEO Score’s count of 237 listed companies among Korea’s 500 largest non-financial companies points the same way. Cumulative FCF for the first three quarters of 2025 was KRW 69.65tn, up 42.0% from a year earlier: operating cash flow of KRW 164.48tn minus capital expenditure of KRW 94.83tn (Seoul Shinmun, December 10, 2025). First and second in FCF were Samsung Electronics at KRW 19.04tn and SK hynix at KRW 14.04tn. The sample and period differ from this report, but the trend of operating cash outpacing capex and FCF swelling is the same.
88.4% of the growing cash belongs to two memory makers
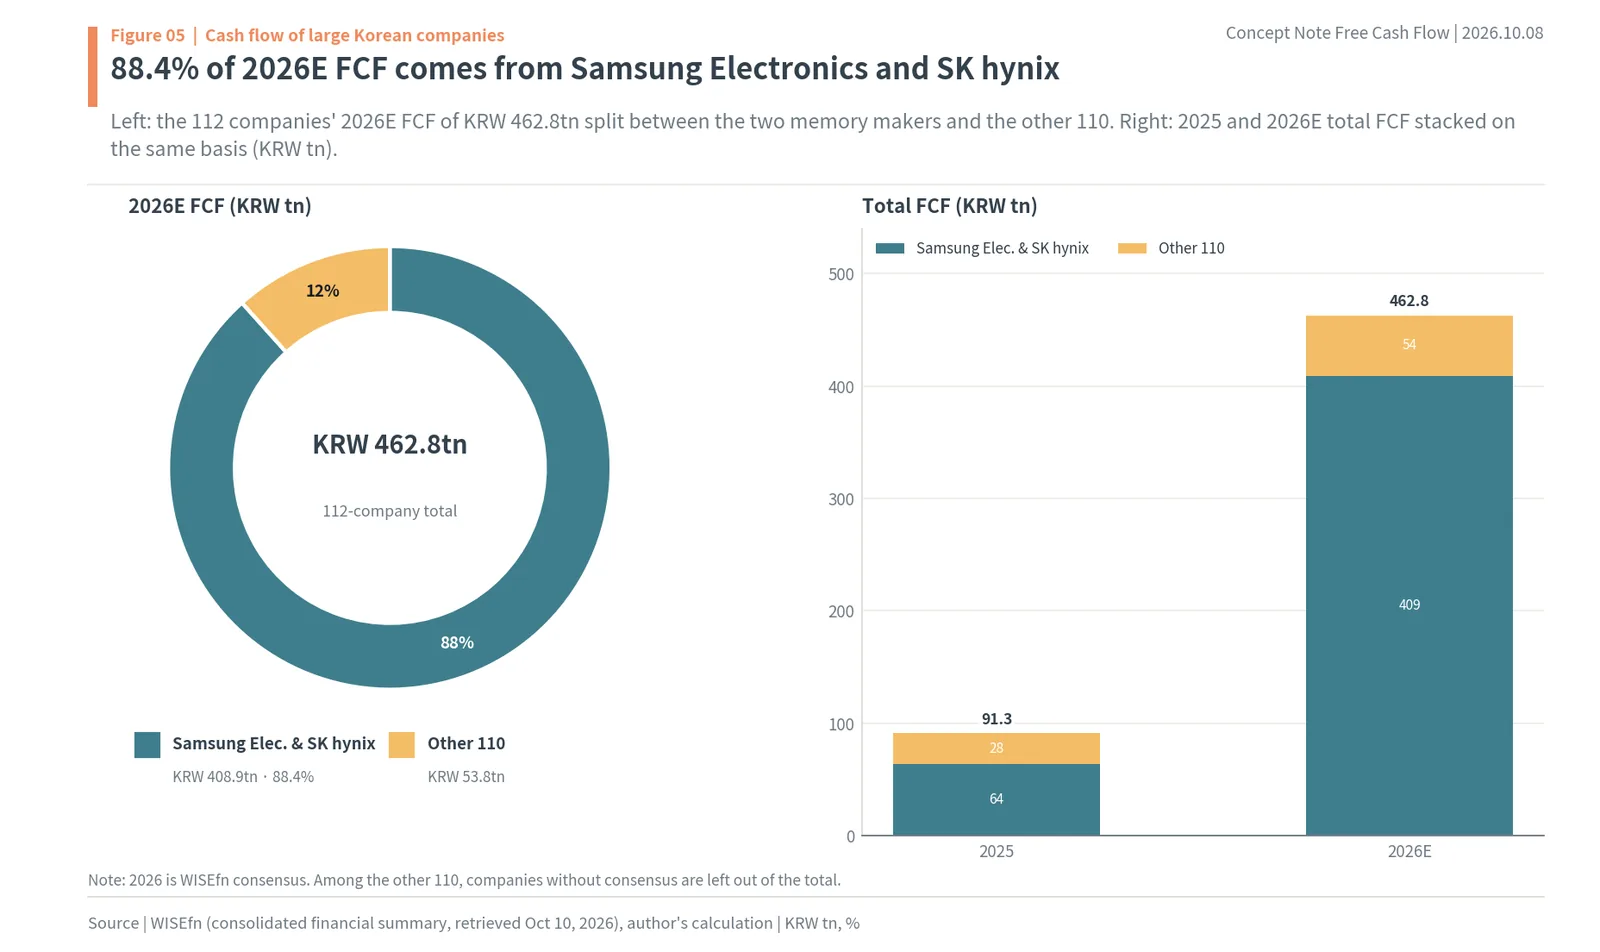
The increase is not spread evenly. The donut on the left of Figure 5 splits the 2026 estimated FCF of KRW 462.8tn. Samsung Electronics and SK hynix account for KRW 408.9tn, 88.4%, and the other 110 companies for KRW 53.8tn. The bars on the right show that in 2025 too, the two companies had KRW 63.6tn and the rest KRW 27.7tn. As memory prices rise, the two companies’ operating cash multiplies while their capex does not rise as much, so most of the large-cap total FCF comes from them.
So if you describe Korean companies’ cash with a single market-wide number, you are really describing these two companies. Total FCF of the 112 divided by their total market cap of KRW 4,299.9tn jumps from 2.12% in 2025 to 10.76% in 2026, but the median company stays at 1.49% in 2025 and 3.06% in 2026. That is why, for your own stock, you should look at that company’s cash flow rather than the total.
The number of companies with negative FCF each year traces the same path. In 2021, 31 of 111 were negative; that rose to 43 in 2022 and 42 in 2023, then fell to 31 in 2024 and 30 in 2025. Companies whose operating cash itself was negative went from 23 in 2022 to 12 in 2024 and 15 in 2025. The median share of operating cash spent on capex fell from 53.9% in 2024 to 40.0% in 2025. Of the 105 companies with 2026 consensus, 15 are expected to have negative FCF, and 8 in 2027. Estimates point to a lighter capex burden across large caps, not just at the two memory makers.
9. Profitable companies with negative free cash flow
18 of 96 profitable companies used up cash in 2025
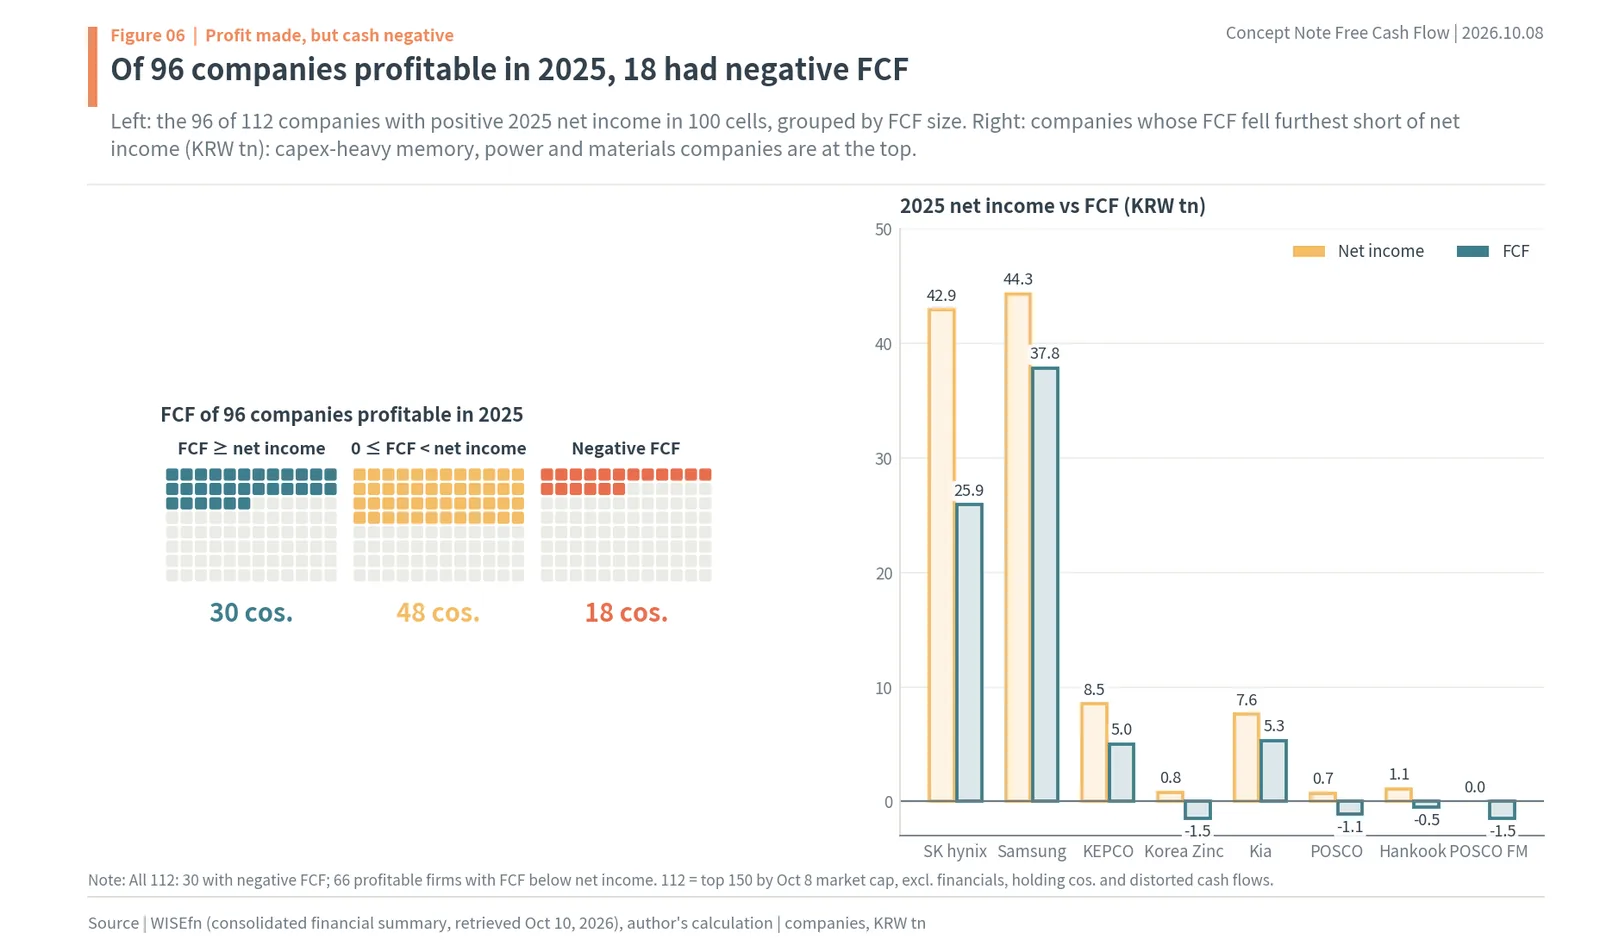
The left side of Figure 6 sorts the 96 companies with positive 2025 net income by FCF size. 30 had FCF greater than or equal to net income, 48 had positive FCF smaller than net income and 18 had negative FCF. Widen the view to all 112 and 30 had negative FCF. Roughly one in four large companies spent more on equipment that year than the cash it earned.
The right side shows the companies whose FCF fell furthest short of net income. First is SK hynix: net income KRW 42.9tn, FCF KRW 25.9tn, a gap of KRW 17.1tn. Samsung Electronics had KRW 44.3tn of net income and KRW 37.8tn of FCF, KEPCO KRW 8.5tn and KRW 5.0tn, and Kia (000270.KS) KRW 7.6tn and KRW 5.3tn. Korea Zinc (net income KRW 0.8tn, FCF KRW -1.5tn), POSCO Holdings (KRW 0.7tn, KRW -1.1tn) and POSCO Future M (KRW 0.0tn, KRW -1.5tn) were profitable but had negative FCF. What they share is that a large part of that year’s operating cash went into capex. However large the profit, buying that much new equipment leaves little cash in the vault.
FCF below net income does not mean the company spent money badly. Capex is spending cash today to sell more later, so when the plant runs, operating cash rises and FCF comes back. What matters is the order. While plants are being built, there is little cash to return to shareholders no matter how large net income is; cash builds up only after the plants are finished. That is why you should look at several years of cash flow alongside one year’s net income.
SK hynix’s 2025 cash flow statement shows this order. KRW 53.4tn came in from operations, KRW 48.1tn went out in investing and KRW 1.4tn went out in financing. Nearly 90% of the cash that came in went out through the investing line, so even in a year with net income of KRW 42.9tn, the cash in its vault rose by only KRW 3.9tn. In 2026, when that investment starts to pay off, consensus has operating cash rising to KRW 217.5tn while capex stays at KRW 46.4tn, making it the year FCF catches up with net income. The lag of capex going out first and cash coming back later is recorded across two years inside one company.
Capex is concentrated in a handful of companies
Of the 112 companies’ 2025 capex of KRW 184.5tn, 75.0% was spent by the top 10: Samsung Electronics KRW 47.5tn (55.7% of operating cash), SK hynix KRW 27.5tn (51.6%), KEPCO KRW 15.8tn (75.8%), LG Chem KRW 13.7tn (165.9%), LG Energy Solution KRW 10.8tn (244.4%), POSCO Holdings KRW 5.7tn (123.9%), SK Innovation KRW 5.4tn (235.1%), Korean Air KRW 4.3tn (105.2%), S-Oil KRW 3.9tn (99.1%) and Kia KRW 3.8tn (41.6%). The five whose capex exceeded operating cash (LG Chem, LG Energy Solution, POSCO Holdings, SK Innovation and Korean Air) had negative FCF that year.
Consensus expects the chemical and battery makers to cut capex in 2026: LG Chem from KRW 13.7tn to KRW 8.1tn, LG Energy Solution from KRW 10.8tn to KRW 6.4tn and SK Innovation from KRW 5.4tn to KRW 4.5tn. Samsung Electronics goes the other way, from KRW 47.5tn to KRW 75.4tn, and SK hynix from KRW 27.5tn to KRW 46.4tn. The two memory makers raise capex sharply yet grow FCF because operating cash grows faster; the chemical and battery makers narrow their negative FCF by cutting capex.
10. Cash conversion ratio: five-year FCF ÷ net income
Median cash conversion: 66.4%
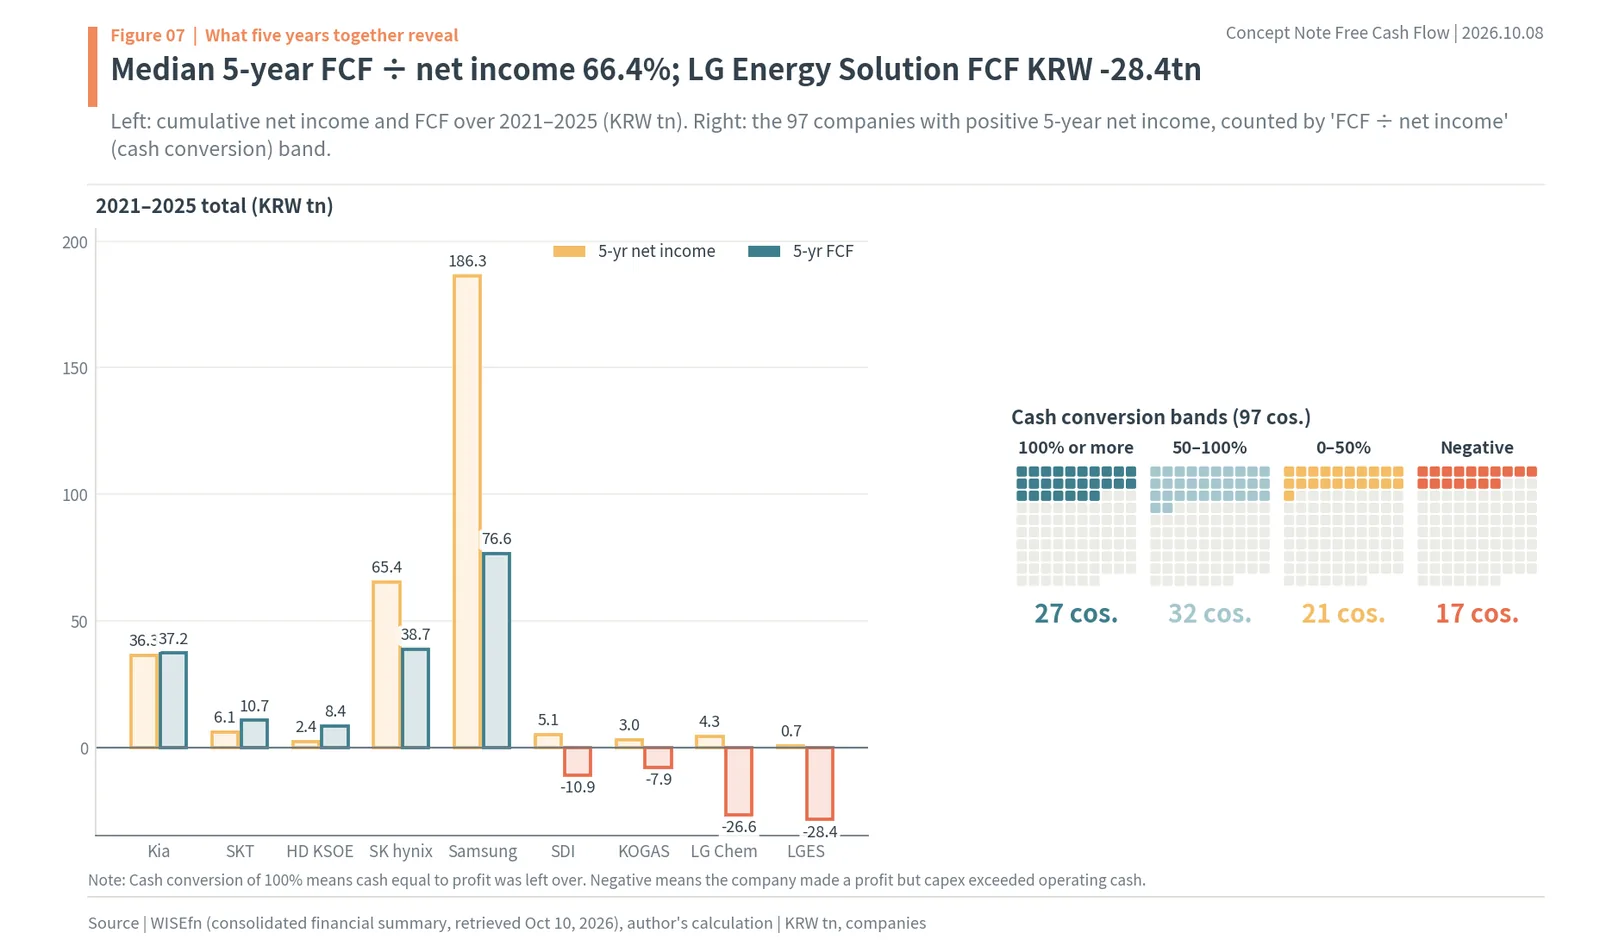
One year’s FCF swings with the timing of capex, so the author added up five years and calculated FCF ÷ net income, known as cash conversion. A cash conversion of 1x, with net income and FCF equal, means cash equal to the profit earned over five years was left; a negative figure means the company made a profit but capex exceeded operating cash. Among the 97 companies with positive five-year net income, the median was 66.4% (author’s calculation). As the waffle chart on the right of Figure 7 shows, 27 had FCF at or above net income, 32 had 50% or more of net income, 21 had 0–50% and 17 were negative.
The bars on the left show five-year net income and five-year FCF for representative stocks. Kia had KRW 36.3tn of net income and KRW 37.2tn of FCF, a cash conversion of 102.6%. SK Telecom (KRW 6.1tn net income, KRW 10.7tn FCF) and HD Korea Shipbuilding (KRW 2.4tn and KRW 8.4tn) had more FCF than profit. SK hynix had KRW 65.4tn of net income and KRW 38.7tn of FCF (59.2%), and Samsung Electronics KRW 186.3tn and KRW 76.6tn (41.1%). The two memory makers earned large profits but put roughly half of them back into plants.
At the other end are the batteries. LG Energy Solution’s five-year net income was a positive KRW 0.7tn, but its five-year FCF was KRW -28.4tn. LG Chem had KRW 4.3tn of net income and KRW -26.6tn of FCF, and Samsung SDI KRW 5.1tn and KRW -10.9tn. Korea Gas (KOGAS) also had KRW 3.0tn of net income and KRW -7.9tn of FCF. These companies booked profits over five years, but in cash they spent more on equipment than their operating cash and covered the difference with money from outside. Earnings quality shows in this gap.
11. Why battery makers have negative FCF (LG Energy Solution, LG Chem, Samsung SDI)
Three battery makers invested more than their operating cash for five straight years
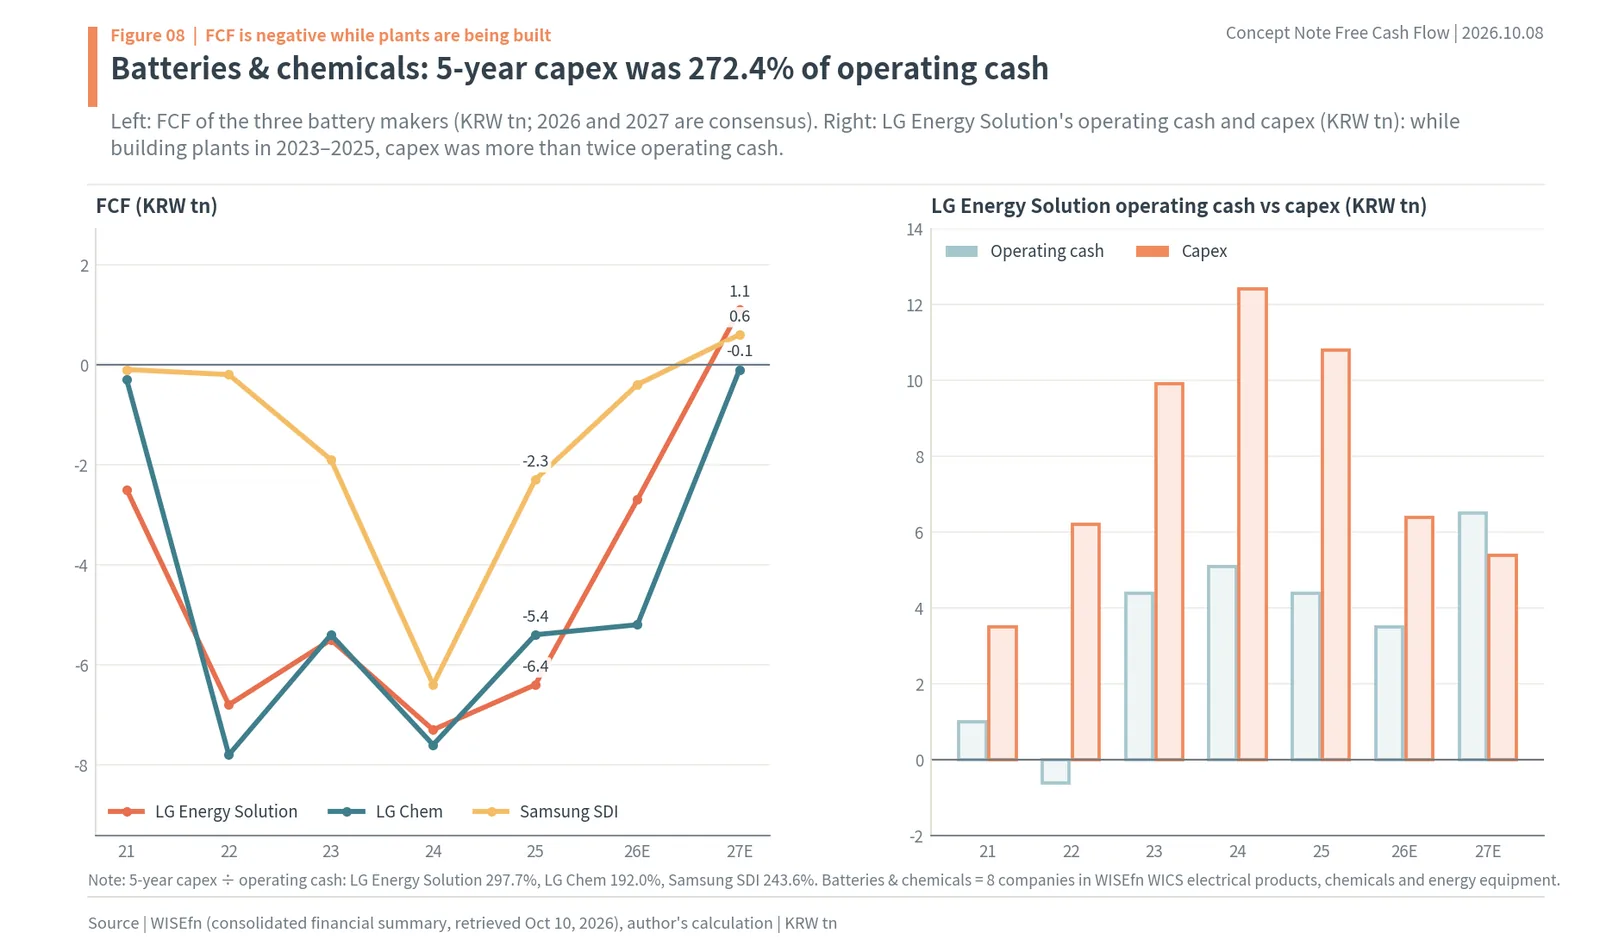
The left side of Figure 8 shows each year’s FCF for the three battery makers. LG Energy Solution was negative in all five years: KRW -2.5tn in 2021, KRW -6.8tn in 2022, KRW -5.5tn in 2023, KRW -7.3tn in 2024 and KRW -6.4tn in 2025. LG Chem went from KRW -7.8tn in 2022 to KRW -5.4tn in 2025, and Samsung SDI from KRW -6.4tn in 2024 to KRW -2.3tn in 2025. In 2026 consensus all three are still negative, and only in 2027 do LG Energy Solution (KRW 1.1tn) and Samsung SDI (KRW 0.6tn) turn positive.
The right side puts LG Energy Solution’s operating cash and capex side by side. Operating cash was KRW 4.4tn in 2023, KRW 5.1tn in 2024 and KRW 4.4tn in 2025, while capex was KRW 9.9tn, KRW 12.4tn and KRW 10.8tn. Throughout 2023–2025, capex was more than twice operating cash. IB Tomato counted the same company’s FCF at KRW -2.54tn in 2021, KRW -6.88tn in 2022 and KRW -5.58tn in 2023, with 2023 capex of KRW 10.03tn (December 6, 2024). Over five years, LG Energy Solution’s capex was 297.7% of operating cash, LG Chem’s 192.0% and Samsung SDI’s 243.6%, and for the eight batteries and chemicals companies combined 272.4% (author’s calculation).
This is the typical shape of a company building plants to sell more later. When a new battery plant is built, cash keeps going out until the plant is fully running, and that money comes from borrowing and share issues. In the meantime no cash comes back to shareholders. The point in 2027 consensus where capex (KRW 5.4tn) falls below operating cash (KRW 6.5tn) is where this company’s FCF turns positive.
LG Chem and Samsung SDI follow the same order. LG Chem had KRW 8.2tn of operating cash and KRW 13.7tn of capex in 2025; in 2027 consensus the two flip, with KRW 7.8tn of operating cash and KRW 6.8tn of capex. Samsung SDI’s operating cash was KRW -0.1tn in 2024, so no cash came in, yet capex was KRW 6.3tn; in 2027 consensus, operating cash of KRW 2.9tn exceeds capex of KRW 2.8tn. For all three, FCF turns positive in the year capex falls, and until then the cash comes from outside.
12. Capex and FCF by sector
Capex share from 30.4% in internet & games to 405.9% in utilities
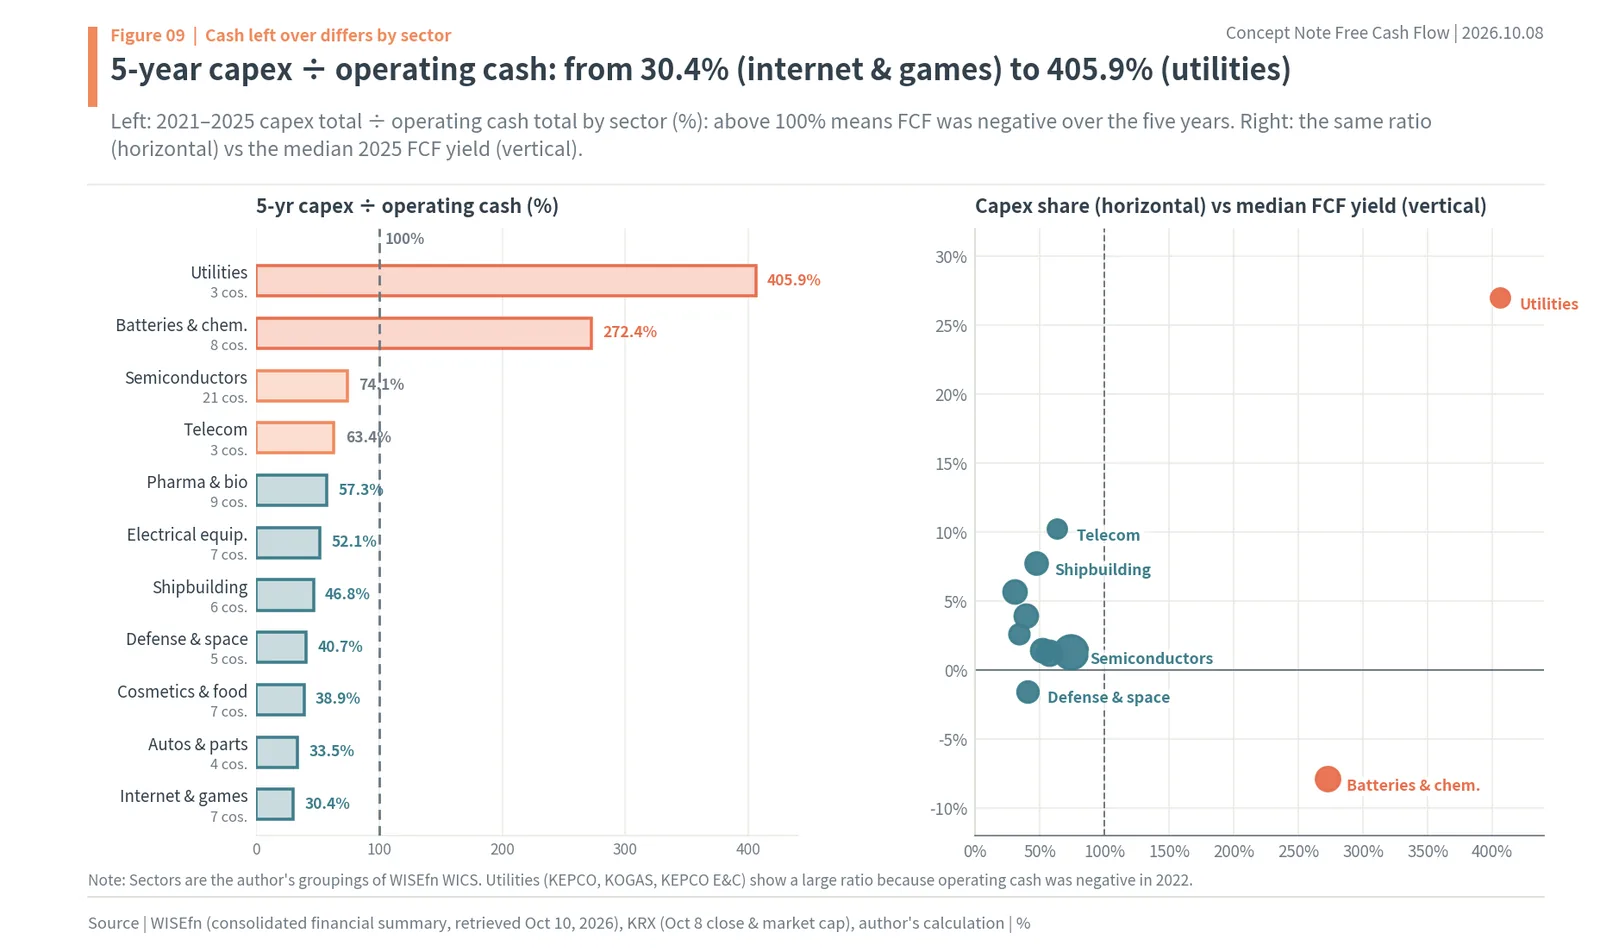
The left side of Figure 9 groups the 112 companies by sector and divides total 2021–2025 capex by total operating cash. If capex exceeds operating cash, the sector had negative FCF over the five years. Utilities (KEPCO, KOGAS, KEPCO E&C) at 405.9% and eight batteries and chemicals companies at 272.4% spent more on capex than their operating cash. Semiconductors (21 companies) were at 74.1%, telecom (3) 63.4%, pharma and bio (9) 57.3%, electrical equipment (7) 52.1%, shipbuilding (6) 46.8%, defense and space (5) 40.7%, cosmetics and food (7) 38.9%, autos and parts (4) 33.5% and internet and games (7) 30.4%.
Sectors with a low ratio make money from people, software and equipment already in place rather than new plants: internet and games, cosmetics and food, and autos. Sectors with a high ratio must lay down equipment before they can grow sales. The scatter on the right plots the same ratio (horizontal) against the sector’s median 2025 FCF yield (vertical). Most sectors cluster on the left, where capex is below operating cash, between 0% and 10% on the vertical axis, while batteries and chemicals sit down at the lower right (-7.87%). Utilities have a five-year ratio of 405.9%, but a median 2025 FCF yield of 27.01%, placing them at the upper right. Here one year and five years point in opposite directions.
13. Why one year of FCF can mislead (KOGAS, KEPCO)
KOGAS: 2025 FCF KRW 4.6tn, five-year total KRW -7.9tn
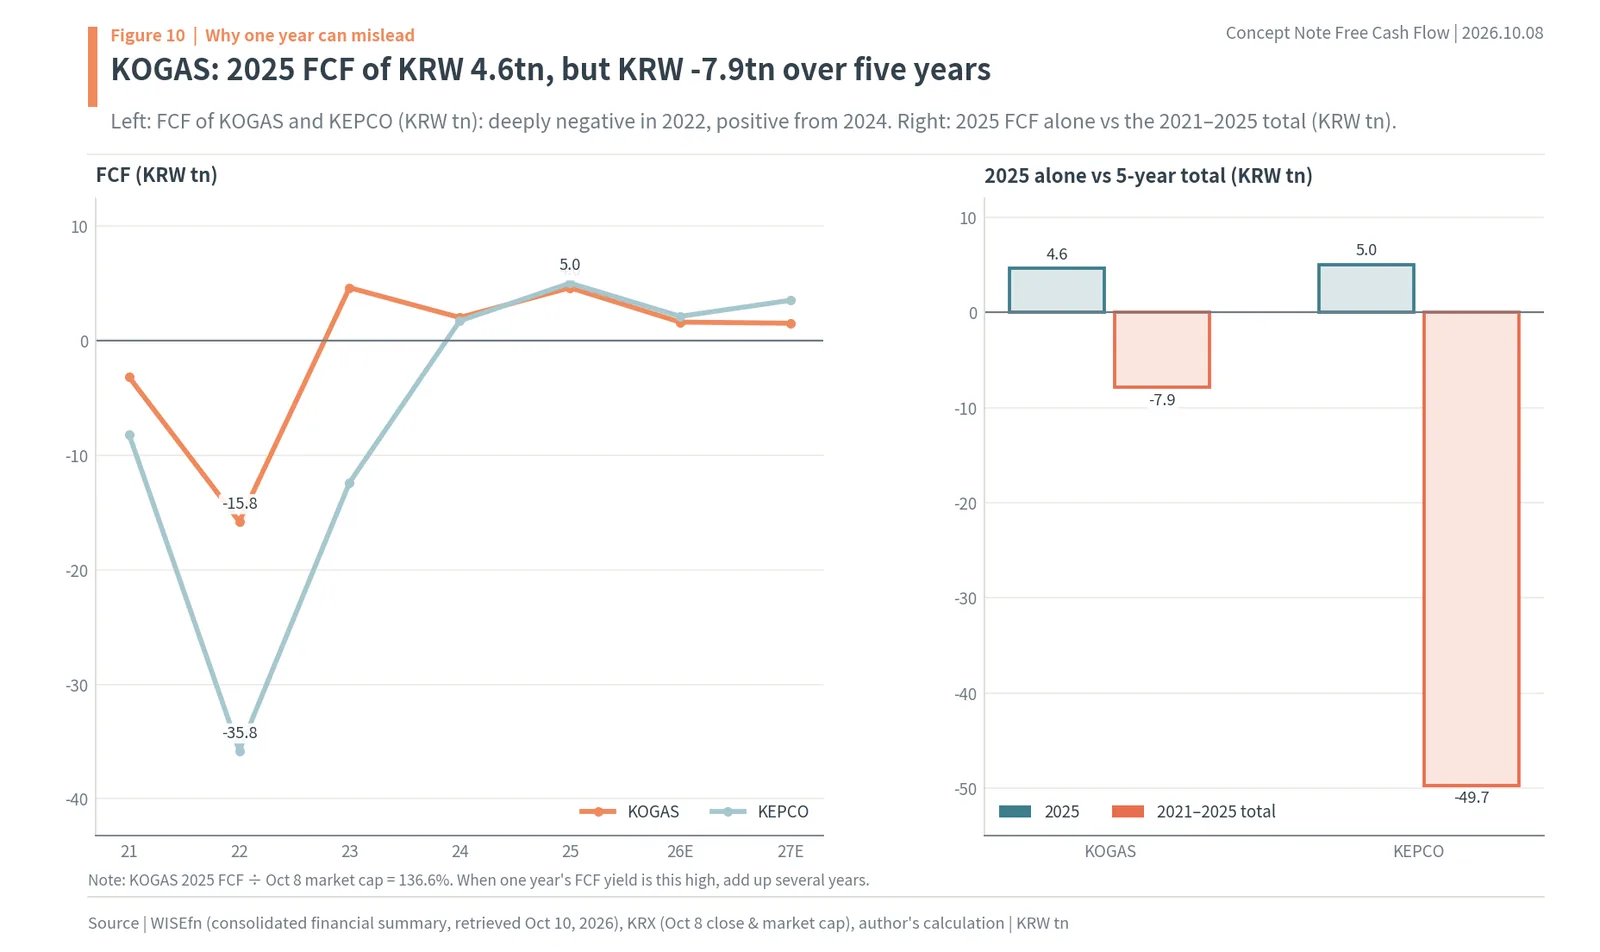
Figure 10 shows that case. KOGAS’s FCF was KRW -3.2tn in 2021 and KRW -15.8tn in 2022, then turned positive at KRW 4.6tn in 2023, KRW 2.0tn in 2024 and KRW 4.6tn in 2025. KEPCO also swung from KRW -35.8tn in 2022 to KRW 1.7tn in 2024 and KRW 5.0tn in 2025. As the bars on the right show, on 2025 alone the two companies left KRW 4.6tn and KRW 5.0tn of cash, but over 2021–2025 combined KOGAS is at KRW -7.9tn and KEPCO at KRW -49.7tn.
Divide KOGAS’s 2025 FCF by its October 8 market cap of KRW 3.3tn and you get 136.6%. One year’s FCF is larger than the value of the whole company. Read that as the cash interest rate shareholders will receive and you will be badly wrong, because it comes from recovering cash that drained out in earlier years. So when one year’s FCF yield is unusually high, add up several years and first check whether that cash can repeat.
Read KEPCO the same way. Its 2025 net income was KRW 8.5tn and FCF KRW 5.0tn, and dividing by its October 8 market cap of KRW 18.7tn gives an FCF yield of 27.0%. But 2026 consensus FCF falls to KRW 2.1tn, while capex rises from KRW 15.8tn in 2025 to KRW 17.4tn in 2026. With operating cash not growing much beyond around KRW 20tn while capex rises, a one-year spike in FCF yield is hard to sustain. The five-year total of KRW -49.7tn describes this company’s cash position more accurately.
14. FCF yield: formula, median and top Korean stocks vs treasury yield
Median rises from 1.49% to 3.06%; the Korea 10-year treasury yields 4.395%
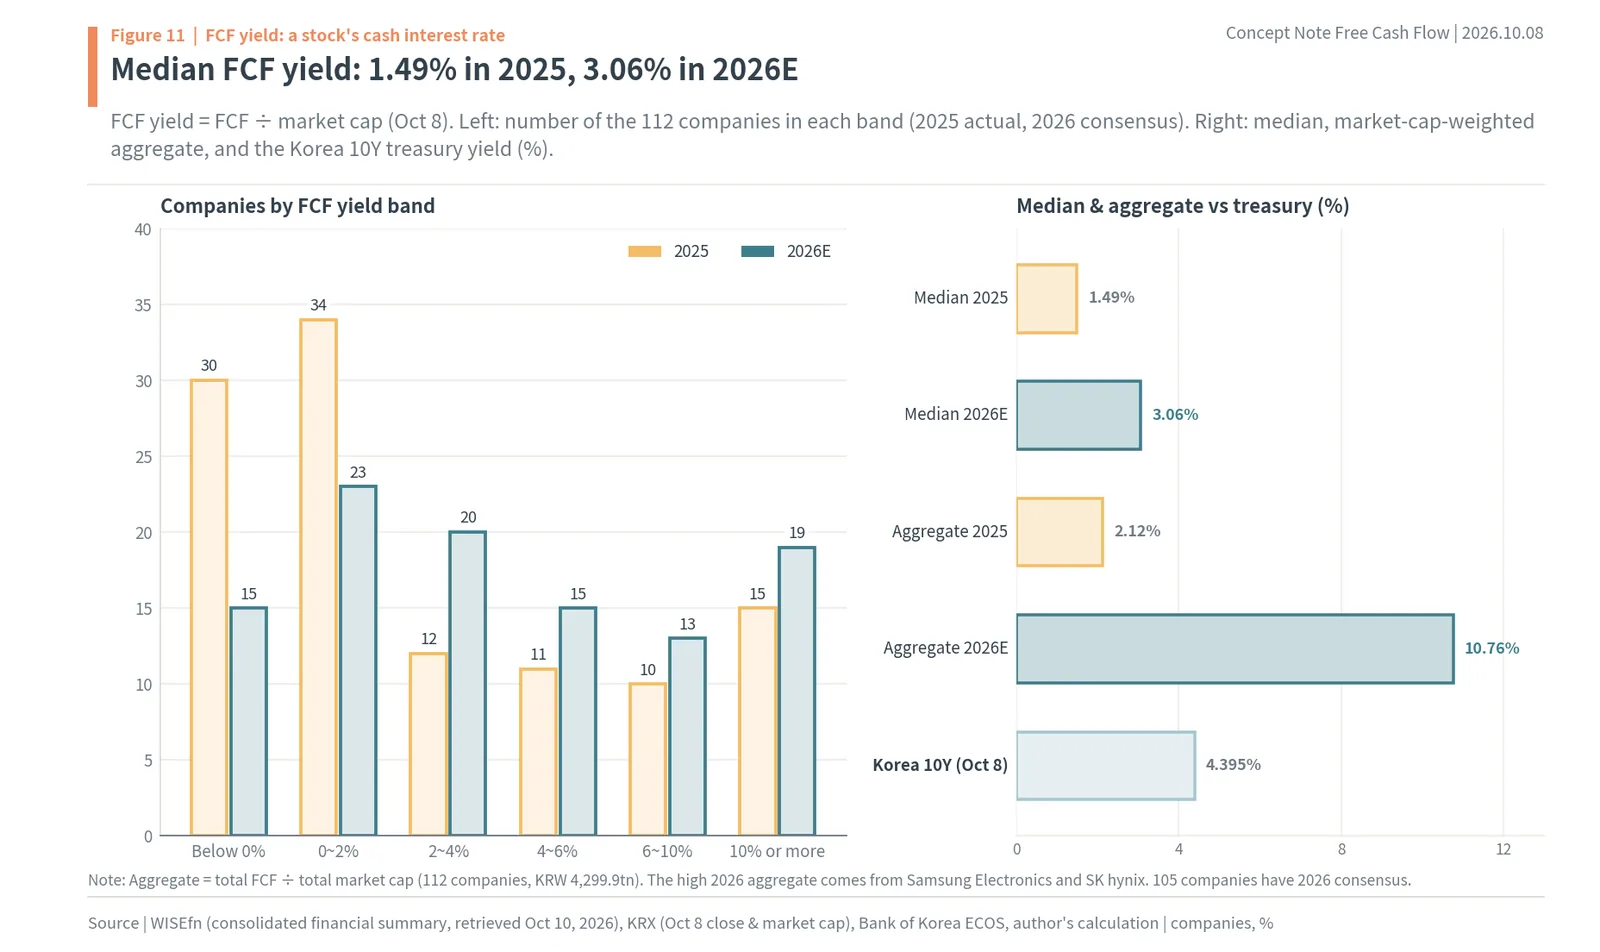
FCF divided by market cap is called the FCF yield. It tells you how many won of cash a share bought for KRW 10,000 leaves in the company’s vault that year, so it can be read as a stock’s cash interest rate. It is the same idea as the earnings yield (net income ÷ market cap, the inverse of PER), with the numerator switched from book profit to leftover cash. In the US, Pacer US Cash Cows 100 uses this yardstick, holding the 100 companies in the Russell 1000, excluding financials, with the highest FCF yield (FCF ÷ enterprise value).
The left side of Figure 11 counts the 112 companies by FCF yield band (on October 8 market caps). On 2025 actuals, 30 were below 0% and 34 at 0–2%, more than half together, and 15 were at 10% or more. On 2026 consensus, those below 0% fall to 15, while 2–4% rises to 20 and 10% or more to 19, shifting the distribution to the right. The median rises from 1.49% to 3.06%.
The bars on the right put that median next to the 10-year Korean treasury yield, which was 4.395% on October 8 (Bank of Korea ECOS). The median large company’s 2026 FCF yield of 3.06% is still below treasuries. The market-cap-weighted aggregate is 10.76% in 2026, more than twice the treasury yield, but that comes from Samsung Electronics and SK hynix. The typical large-cap shareholder, at today’s prices, receives a cash interest rate below treasuries and makes up the difference with future growth.
Top 2026E FCF yields: utilities, telecom, shipbuilding, memory and autos
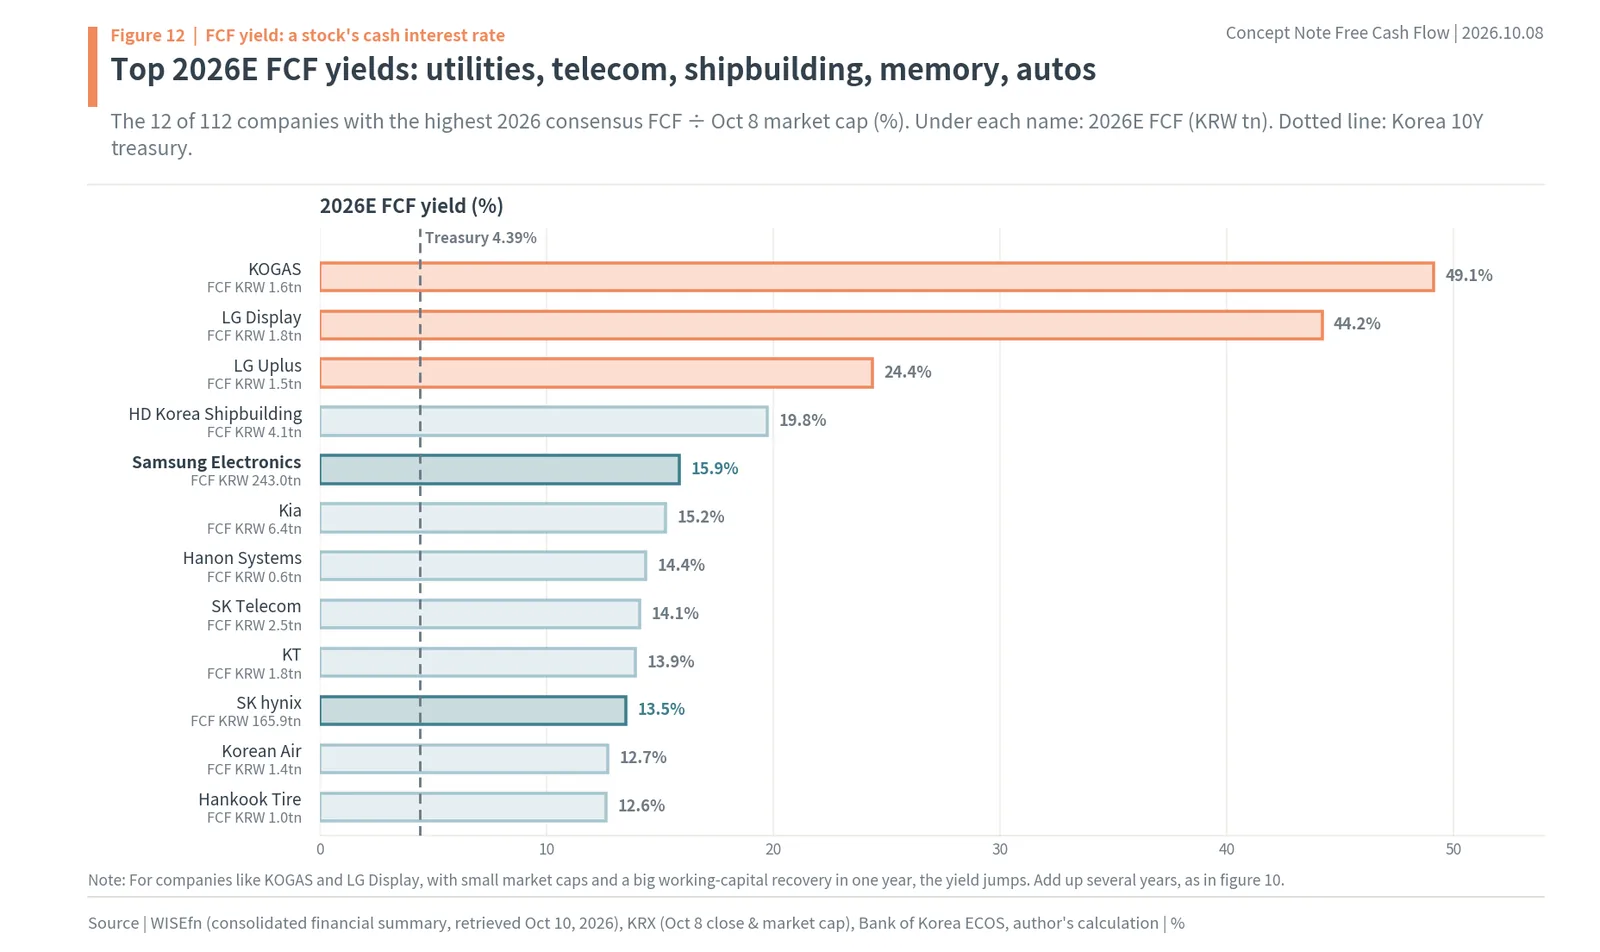
Figure 12 shows the 12 companies with the highest 2026 consensus FCF yields. KOGAS at 49.1%, LG Display at 44.2%, LG Uplus at 24.4% and HD Korea Shipbuilding at 19.8% lead, followed by Samsung Electronics at 15.9%, Kia at 15.2%, Hanon Systems at 14.4%, SK Telecom at 14.1%, KT at 13.9%, SK hynix at 13.5%, Korean Air at 12.7% and Hankook Tire at 12.6%. All are more than three times the 10-year treasury yield of 4.395%.
The list splits into two groups. The first two are companies with a large one-year cash recovery relative to a small market cap, so, as the one-year section above showed, several years must be added up. Telecoms and autos are companies whose capex stays a fraction of operating cash every year, so FCF is steady; the two memory makers are companies having a year in which operating cash multiplies. Even at the same 15%, a steady 15% and a one-year 15% mean different things to shareholders.
15. How to read FCF by sector: chips, batteries, shipbuilding, autos, telecom
The same FCF means different things in different sectors
Breaking the sector groups down into numbers shows what to ask first for each sector when looking at FCF. All figures below are totals for the companies in that sector among the 112, and five years means 2021–2025 (author’s calculation).
The 21 semiconductor companies had KRW 88.7tn of net income and KRW 64.8tn of FCF in 2025, and over five years KRW 258.7tn of net income and KRW 119.0tn of FCF. Over five years they put 74.1% of operating cash back into equipment. In chips, operating cash multiplies in years when memory prices rise, and capex cannot be cut much in years when they fall. So when looking at chip FCF, check first which way “capex as a % of operating cash” is moving rather than this year’s number. In 2026 consensus, Samsung Electronics is at 23.5%, and SK hynix has KRW 217.5tn of operating cash against KRW 46.4tn of capex, both far below the five-year average.
The eight batteries and chemicals companies had KRW -5.4tn of net income and KRW -19.5tn of FCF in 2025, and over five years KRW 7.0tn of net income and KRW -88.3tn of FCF. Five-year capex was 272.4% of operating cash. FCF in this sector turns when plants are finished and utilization rises. So the question to ask is “when does capex drop below operating cash”, and consensus puts that around 2027.
The six shipbuilders had KRW 5.8tn of net income and KRW 9.0tn of FCF in 2025, and over five years KRW 1.2tn of net income and KRW 9.3tn of FCF. Five-year capex was only 46.8% of operating cash. The median 2025 FCF yield was 7.78%, high among sectors. Shipbuilding is a sector where FCF showed up strongly before profit did.
The four autos and parts companies had KRW 12.1tn of net income and KRW 7.7tn of FCF in 2025, and over five years KRW 56.3tn of net income and KRW 51.5tn of FCF. Five-year capex was a low 33.5% of operating cash, so most of the profit stayed as cash. Kia represents this shape.
The three telecoms had KRW 2.7tn of net income and KRW 4.4tn of FCF in 2025, and over five years KRW 14.8tn of net income and KRW 23.8tn of FCF, so FCF exceeded net income. The median 2025 FCF yield was 10.24%. Depreciation weighs on net income, but cash keeps being left over.
The three utilities had KRW 8.8tn of net income and KRW 9.6tn of FCF in 2025, good on one year alone, but over five years KRW -19.4tn of net income and KRW -57.5tn of FCF. Five-year capex was 405.9% of operating cash. This sector is the classic case where you must look at multi-year totals, not one year.
The seven internet and games companies had KRW 4.5tn of net income and KRW 4.5tn of FCF in 2025, and over five years KRW 33.8tn of net income and KRW 17.5tn of FCF. Capex was the lowest at 30.4% of operating cash, yet five-year FCF was only a little over half of net income. A small capex share with FCF at only about half of net income means operating cash itself was smaller than five-year net income. So in this sector, look first at step 1, whether profit comes in as cash, rather than at capex.
Read the other sectors the same way. Seven cosmetics and food companies had KRW 6.6tn of five-year net income and KRW 6.5tn of FCF, so profit turned almost entirely into cash; five defense and space companies had KRW 9.3tn and KRW 8.1tn, nine pharma and bio companies KRW 9.5tn and KRW 5.0tn, and seven electrical equipment companies KRW 4.1tn and KRW 2.1tn. The sector numbers show the same pattern: the lower the capex share, the closer profit and FCF.
16. Steady FCF: SK Telecom, LG Uplus and Korean Air
SK Telecom’s five-year FCF is 175.5% of net income
Telecoms represent the steady side of the high-FCF-yield list. SK Telecom had KRW 6.1tn of net income and KRW 10.7tn of FCF over 2021–2025, a cash conversion of 175.5%, and LG Uplus was at 192.7%. Korean Air had KRW 5.5tn of net income and KRW 11.6tn of FCF, 212.6% (author’s calculation). All three are in depreciation-heavy industries, so net income looks small, while capex each year stays within operating cash, leaving FCF larger than net income.
SK Telecom’s 2025 cash flow statement showed operating KRW 3.9tn, investing KRW -1.7tn and financing KRW -2.7tn. It paid for investment out of operating cash and spent a little more than what was left on dividends and debt repayment, so the three parts summed to KRW -0.5tn. Its 2025 dividend was 20.6% of FCF of KRW 1.7tn. Telecom stocks are called dividend stocks partly because their payout ratios are high, but also because their cash shape, with FCF well above net income, supports that dividend.
Companies like these look expensive on PER and cheap on FCF, because depreciation pushes net income down. 2026 consensus FCF yields are 14.1% for SK Telecom, 13.9% for KT and 24.4% for LG Uplus, all well above the 10-year treasury yield of 4.395%. The more depreciation-heavy the industry, the more you need FCF yield next to PER to see how much cash shareholders will get.
Korean Air has the same shape. Aircraft are expensive, long-lived assets, so depreciation is large and capex bunches up in years when planes are delivered. Yet over 2021–2025, FCF of KRW 11.6tn was more than twice net income of KRW 5.5tn, and its 2026 consensus FCF yield is 12.7%. Even mixing years with and without aircraft deliveries, the five-year total shows that cash equal to depreciation is left over.
17. How to value a company with FCF (growth priced in)
Company value = FCF ÷ (required return − growth)
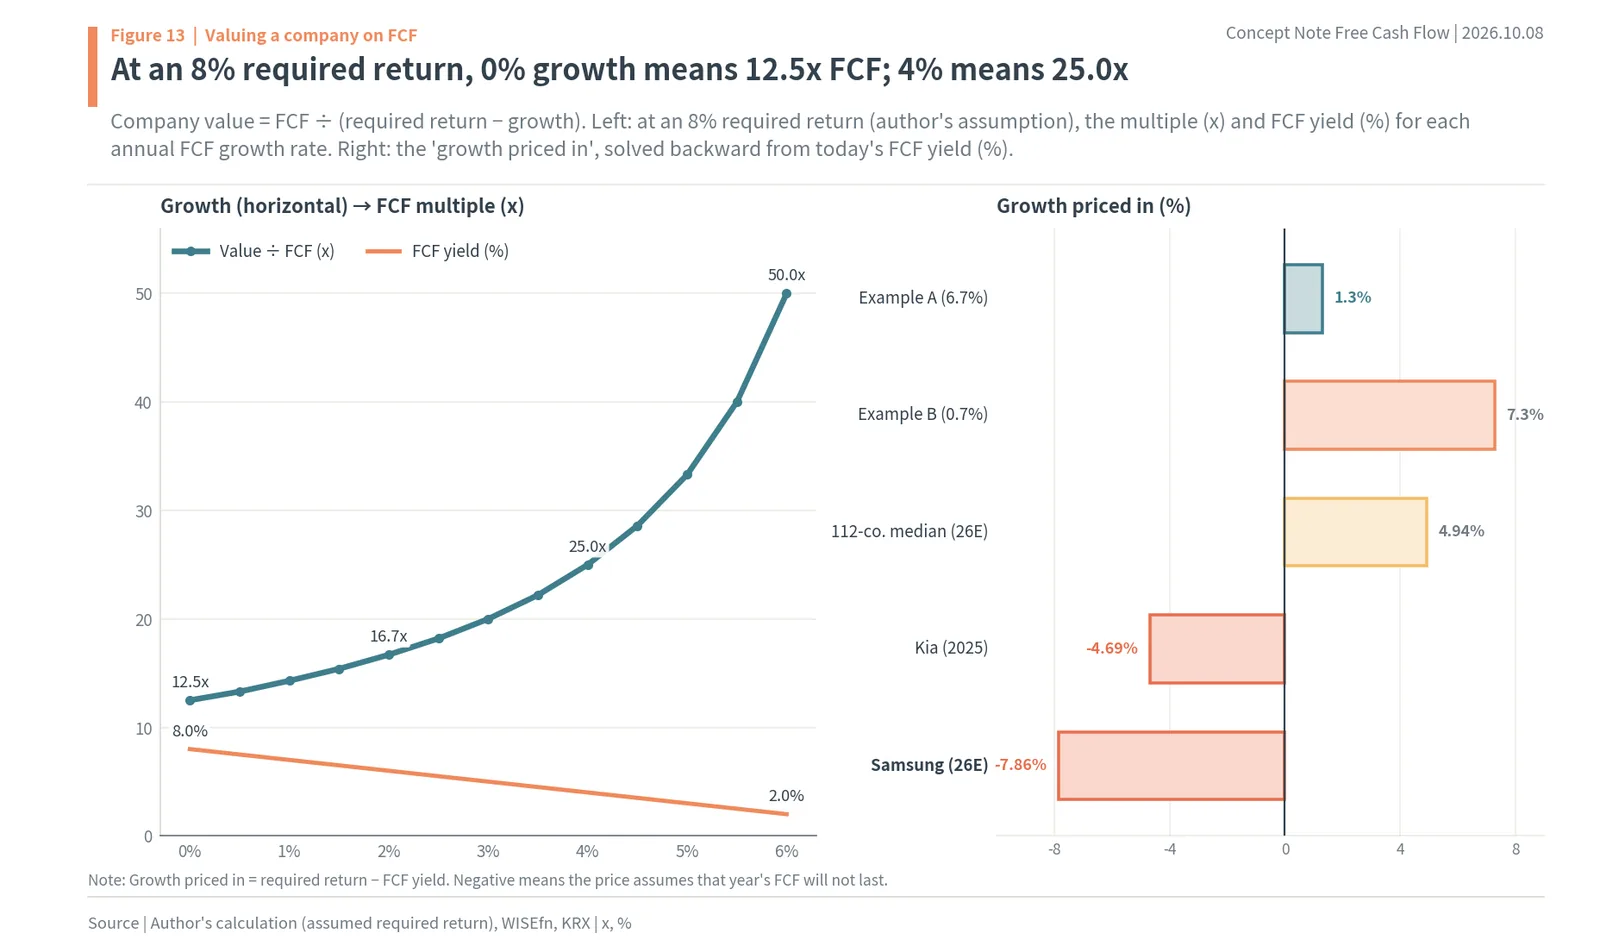
Turn FCF yield upside down and you get how many times FCF a company is worth. If the cash shareholders can receive each year is FCF and that cash grows at a constant rate, company value is FCF divided by the required return minus the growth rate. The required return is the one-year return shareholders expect from the stock; this report sets it at 8% (author’s assumption).
As the left side of Figure 13 shows, at 0% growth the company is worth 12.5 times FCF and the FCF yield is 8.0%. At 2% growth it is 16.7x, at 4% 25.0x and at 6% 50.0x; the multiple climbs steeply as growth approaches the required return. In the hypothetical example, a company with FCF of KRW 100bn is worth KRW 1.25tn at 0% growth, KRW 1.67tn at 2% and KRW 2.5tn at 4% (author’s calculation).
Solve the formula backward and you get the growth the current share price has priced in: the required return minus the FCF yield. Hypothetical A, with an FCF yield of 6.7%, prices in only 1.3% growth; hypothetical B, at 0.7%, prices in 7.3%. At the same PER of 15x, B’s share price stands on the expectation that its small FCF today grows 7.3% every year. The median of the 112 companies, with a 2026 FCF yield of 3.06%, prices in 4.94% growth.
The bottom two bars on the right go the other way. Samsung Electronics’ 2026 estimated FCF yield is 15.86%, so its priced-in growth is -7.86%, and Kia’s 2025 FCF yield of 12.69% gives -4.69%. That means today’s price assumes that year’s FCF shrinks every year. Memory makers’ FCF has swelled in years of rising memory prices and shrunk in years of falling prices, so the market does not treat 2026 FCF as a number that lasts forever. So when you look at a company with a high FCF yield, first ask how many years that FCF can last; if the answer is longer than what the price has priced in, read it as cash the price has not fully reflected.
18. FCF vs EBITDA, operating profit and cash increase
EBITDA, operating profit and the increase in net cash are not FCF
The number most often confused with FCF is EBITDA. You often hear that EBITDA, operating profit plus depreciation, is close to cash. But EBITDA does not subtract capex, and it does not subtract taxes or changes in working capital either. Samsung Electronics’ 2025 EBITDA was KRW 90.5tn, but its FCF was KRW 37.8tn. Most of the gap is capex of KRW 47.5tn. The heavier a company’s equipment, the further apart EBITDA and FCF are.
So EBITDA measures how much cash-generating power a business has, while FCF is what is left after also subtracting what was spent again to keep the business going next year. If EV/EBITDA compares the whole company’s value with the business’s cash-earning power, FCF yield measures the share of cash shareholders can receive at today’s price. Look at one company on both yardsticks and the weight of its capex shows up as the gap between the two numbers.
The second confusion is between operating profit and operating cash. Operating profit is on the income statement; operating cash is on the cash flow statement. Operating profit has depreciation taken out as an expense and includes sales made on credit as revenue. Operating cash adds depreciation back, counts receivables only as they are actually collected and subtracts cash paid for interest and corporate tax. Working capital, covered earlier, is what separates the two.
The third is treating FCF as the same thing as the increase in cash in the vault. FCF is cash before anything is returned to shareholders and creditors. Samsung Electronics’ 2025 FCF was KRW 37.8tn, but the cash in its vault rose by only KRW 3.3tn, because cash went out in the meantime for dividends, buybacks and deposits and equity investments. When FCF is large, a company can return it to shareholders, repay debt, keep it in the vault or buy other companies. FCF is the size of those choices; the increase in cash is the result after the choices are made.
The last is one year’s numbers versus estimates. The 2026 and 2027 columns on WISEfn’s screen are broker consensus and change when results come out. Capex can move a lot within a single quarter if a company changes its plans. So this report looks at actuals as the 2021–2025 five-year total and at the future through 2026 consensus, and says which is which whenever the two are combined in a calculation.
19. Samsung Electronics and SK hynix free cash flow forecast
Operating cash grows far faster than capex
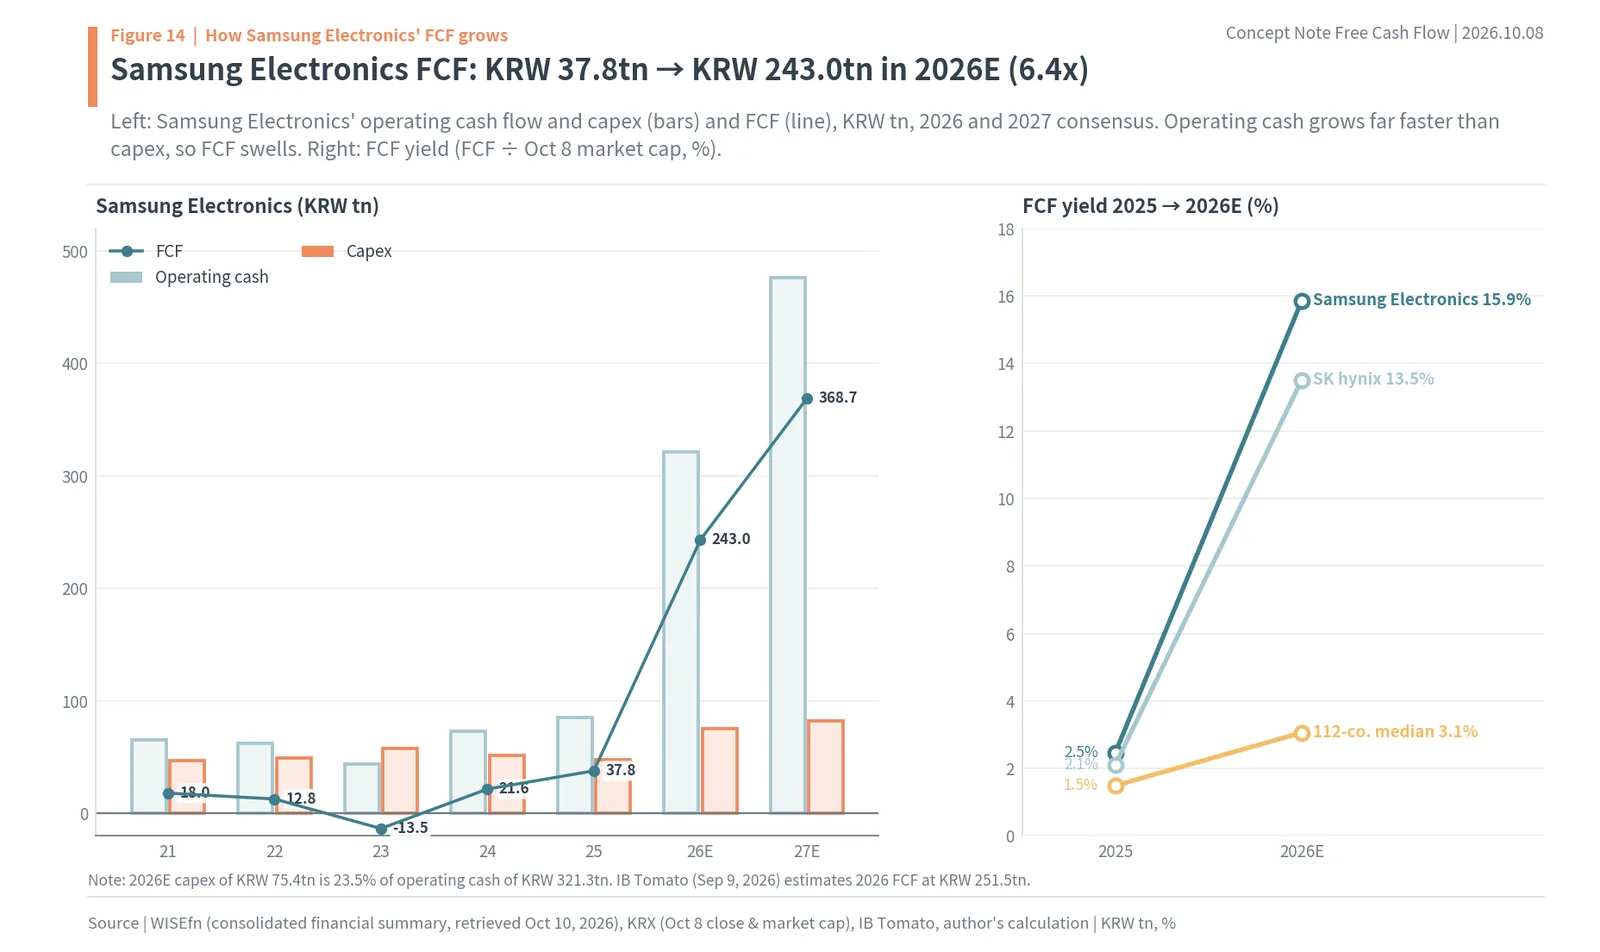
The left side of Figure 14 shows Samsung Electronics’ operating cash and capex (bars) and FCF (line). FCF was KRW 18.0tn in 2021, KRW 12.8tn in 2022, KRW -13.5tn in 2023, KRW 21.6tn in 2024 and KRW 37.8tn (about $27bn) in 2025, and consensus has KRW 243.0tn (about $174bn) in 2026 and KRW 368.7tn in 2027. From 2025 to 2026 it grows 6.4 times. The negative in 2023 came from a memory downturn that cut operating cash while capex continued.
What sets 2026 apart is the ratio between the bars. Estimated 2026 operating cash is KRW 321.3tn and capex KRW 75.4tn, so capex is only 23.5% of operating cash. Capex also rises sharply from KRW 47.5tn in 2025, but operating cash nearly quadruples, and FCF swells by the difference. IB Tomato estimated Samsung Electronics’ FCF that year at KRW 251.45tn and its investment in property, plant and equipment at KRW 91.89tn (September 9, 2026). Estimates differ slightly by source, but the shape of operating cash far outrunning capex is the same.
The slope on the right is FCF yield. Divided by Samsung Electronics’ October 8 market cap of KRW 1,531.7tn (about $1.09tn), its FCF yield rises from 2.47% in 2025 to 15.86% in 2026, and SK hynix’s from 2.11% to 13.51%. The 112-company median rises from 1.49% to 3.06%. Although both stocks have already risen sharply, the cash interest rate calculated from 2026 estimated FCF is more than three times the treasury yield.
The valuation formula above explains the gap. Compare Samsung Electronics’ 2026 estimated FCF yield of 15.86% with a required return of 8%, and today’s price assumes FCF shrinking 7.86% a year. Given that 2027 consensus FCF of KRW 368.7tn is even larger than 2026, the market is effectively weighting a year of falling memory prices more heavily than the path consensus draws. Consensus puts the 2026 dividend per share (DPS) at KRW 8,833. If FCF comes in as consensus expects, the 50% return policy sends this dividend and buybacks back to shareholders.
SK hynix’s three-year FCF totals KRW 453.0tn
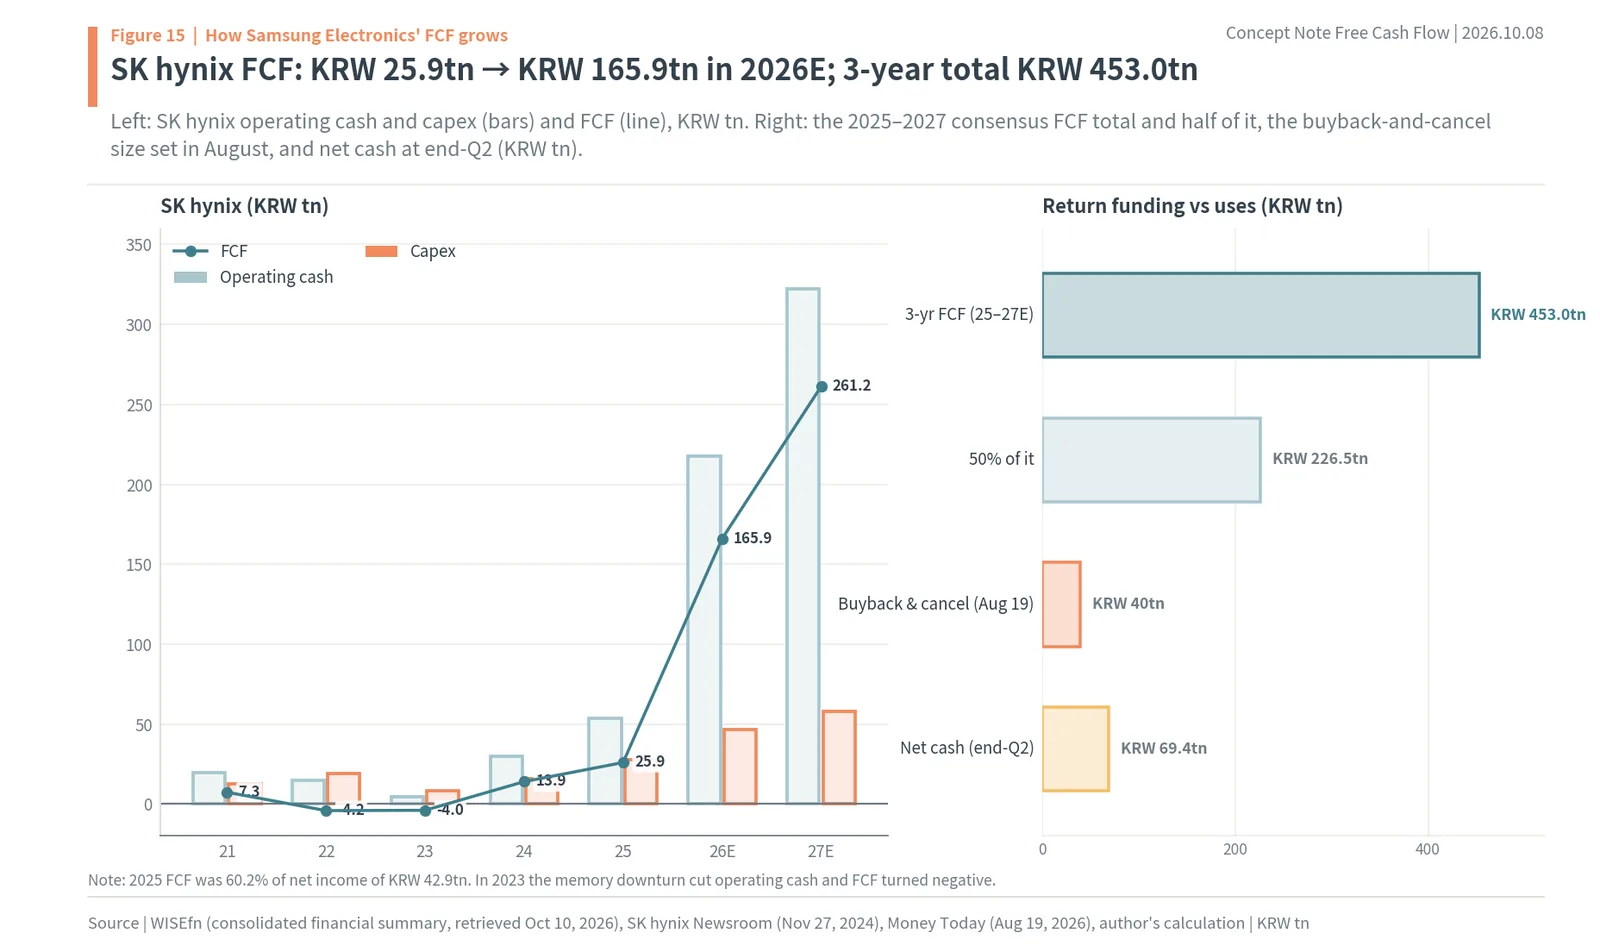
Figure 15 is SK hynix. FCF was negative for two years, KRW -4.2tn in 2022 and KRW -4.0tn in 2023, then turned to KRW 13.9tn in 2024 and KRW 25.9tn in 2025, and consensus has KRW 165.9tn (about $119bn) in 2026 and KRW 261.2tn in 2027. Estimated 2026 operating cash is KRW 217.5tn and capex KRW 46.4tn. 2025 FCF was 60.2% of net income of KRW 42.9tn, but in 2026 operating cash is more than four times capex.
SK hynix’s earlier years show how the memory cycle swings FCF. In 2022 consolidated net income fell to KRW 2.2tn while capex rose to KRW 19.0tn, above operating cash of KRW 14.8tn, so FCF was KRW -4.2tn. In 2023 net income was a KRW 9.1tn loss, but depreciation of KRW 13.7tn kept operating cash positive at KRW 4.3tn, and the company cut capex to KRW 8.3tn, holding FCF to KRW -4.0tn. In 2024 net income of KRW 19.8tn and operating cash of KRW 29.8tn against capex of KRW 15.9tn produced FCF of KRW 13.9tn. Even in a loss year depreciation supports operating cash, and cutting capex narrows negative FCF: that is the cash shape of a capital-heavy industry.
The bars on the right show the 2025–2027 consensus FCF total of KRW 453.0tn and half of it, KRW 226.5tn, the KRW 40tn buyback-and-cancel approved by the board on August 19, and net cash of KRW 69.4tn at the end of the second quarter (Money Today, August 19, 2026). Net cash doubled in three months from KRW 35tn at the end of the first quarter. The pace at which FCF piles up shows directly in the company’s vault.
SK hynix’s policy spells out how FCF is divided, in order. In its November 2024 announcement, the company said it would first use 5% of FCF each year to strengthen its balance sheet by building net cash and adequate cash, use 50% of cumulative FCF as the shareholder return pool, and manage capex in the mid-30% range of sales (SK hynix Newsroom). Tying capex to sales means that even in years when sales rise sharply, capex does not rise as fast as operating cash, so FCF is left over. Mirae Asset Securities estimated SK hynix’s FCF this year at about KRW 180tn (Money Today, August 19, 2026), above the WISEfn consensus of KRW 165.9tn. Either number is more than six times the 2025 figure of KRW 25.9tn.
In CEO Score’s count, the top 10 by FCF for the first three quarters of 2025 were Samsung Electronics (KRW 19.04tn), SK hynix (KRW 14.04tn), Kia (KRW 4.27tn), KOGAS (KRW 3.96tn), HD Hyundai Heavy Industries (KRW 3.46tn), KEPCO (KRW 2.87tn), Hyundai Mobis (KRW 2.37tn), HMM (KRW 1.96tn), LG Chem (KRW 1.84tn) and Samsung E&A (KRW 1.53tn) (Seoul Shinmun, December 10, 2025). Alongside the two memory makers, autos, shipbuilding and utilities made the list. The sectors with a low capex share in the sector chart and the utilities with a large one-year recovery in the one-year section overlap with this list.
20. FCF-based shareholder returns and dividend ÷ FCF
Half of Samsung Electronics’ three-year FCF of KRW 302.4tn is KRW 151.2tn
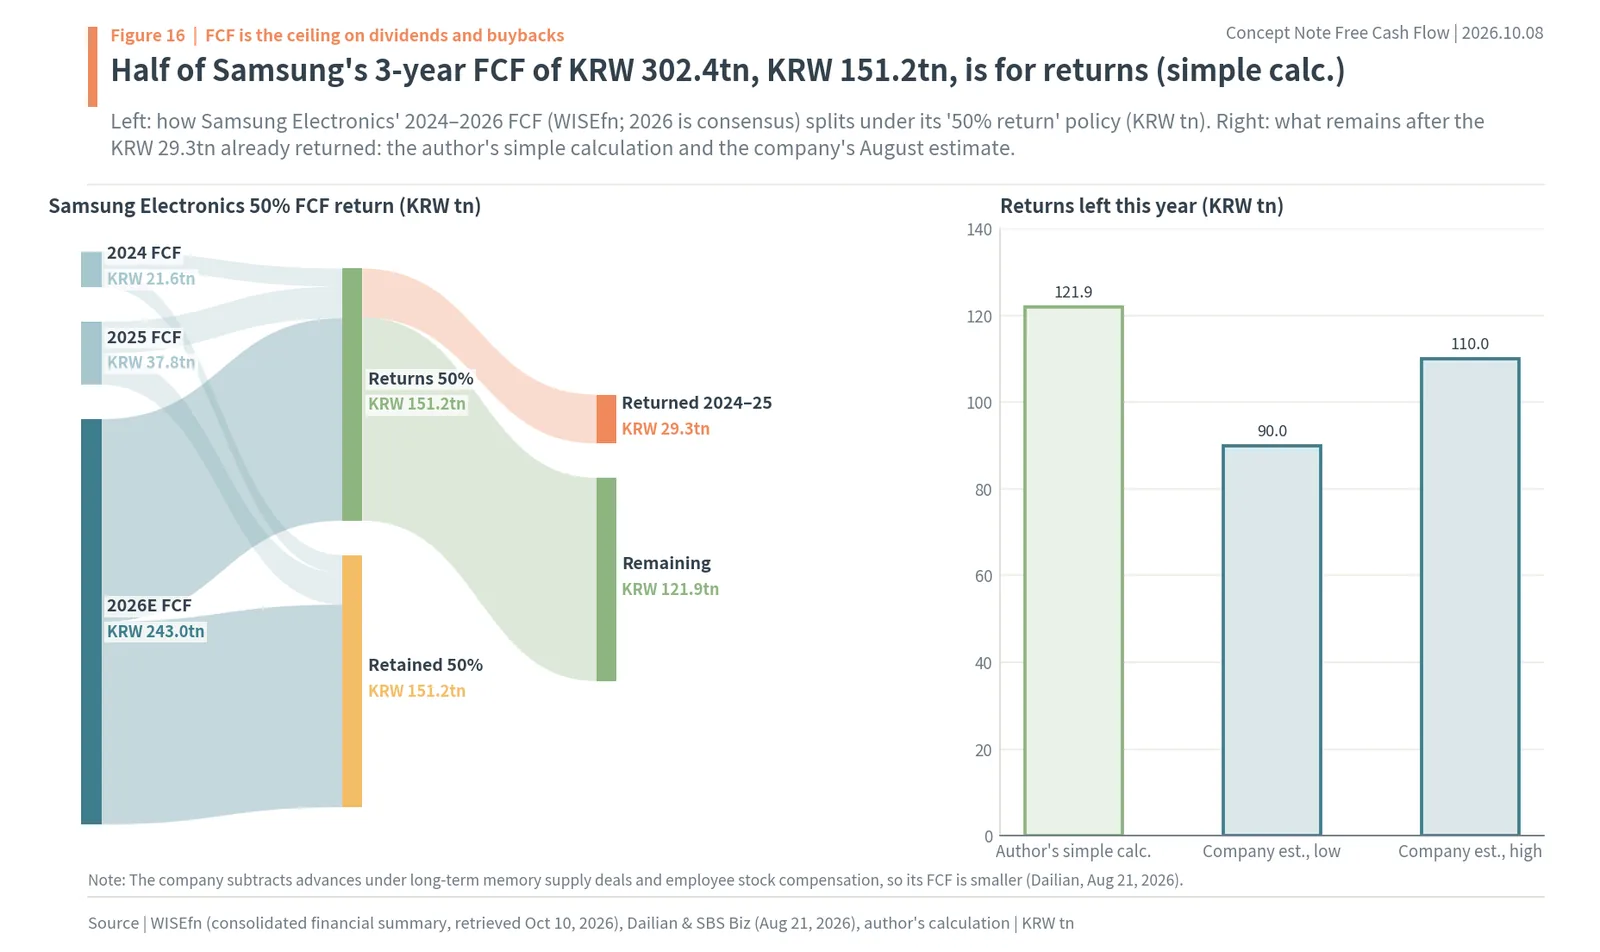
At large Korean companies, the idea that FCF is the ceiling on dividends and buybacks is written into policy. In January 2024 Samsung Electronics announced that it would return 50% of its FCF to shareholders over the three years 2024–2026 and pay a regular dividend of KRW 9.8tn a year. In 2024–2025 it had already returned KRW 29.3tn (KRW 20.9tn in cash dividends and KRW 8.4tn in buybacks and cancellations) (Dailian, August 21, 2026). When calculating FCF, the company subtracts advance payments received under long-term memory supply agreements (LTAs) and spending on employee stock compensation.
The left side of Figure 16 is a simple calculation of this policy using WISEfn numbers. 2024 FCF of KRW 21.6tn, 2025 FCF of KRW 37.8tn and estimated 2026 FCF of KRW 243.0tn add up to KRW 302.4tn, and half of that, KRW 151.2tn, is the return share. Subtract the KRW 29.3tn already returned and KRW 121.9tn remains (author’s calculation). After its August 21 board meeting, the company expected remaining returns this year of about KRW 90–110tn, said it would pay about KRW 30tn in cash dividends in the third quarter including the regular quarterly dividend, and would decide the rest at its January 2027 board meeting (SBS Biz). It put cumulative three-year returns at KRW 120–140tn. The author’s simple calculation is larger than the company’s estimate because the company subtracts advance payments and other items when calculating FCF.
What this policy means for shareholders is that the size of returns is set by the size of FCF, not by the company’s discretion. In 2024–2025, when FCF was KRW 21.6tn and KRW 37.8tn, returns were KRW 29.3tn; if 2026 FCF comes in at the consensus KRW 243.0tn, remaining returns reach KRW 90–110tn even on the company’s own estimate. It is the rise in FCF, more than the rise in net income, that moves the cash coming back to shareholders.
On November 27, 2024, SK hynix announced that it would use 50% of cumulative 2025–2027 FCF as its return pool, raise its fixed dividend from KRW 1,200 to KRW 1,500 per share and first use 5% of FCF to strengthen its balance sheet (SK hynix Newsroom). On August 19, 2026, it decided to buy back about KRW 40tn of shares and cancel all of them, and widened its return standard from “within 50%” of cumulative FCF to “50% or more”. Both companies made FCF, not net income, the basis for returns. The author’s view is that the heavier a company’s capex, the better an FCF-based standard fits. Promising returns based on profit would mean borrowing to pay dividends in years when plants must be built.
Not every company uses FCF. Kia has a total shareholder return ratio of 35% based on net income, and KT&G set a total shareholder return target of returning more than it earns plus cash returns of KRW 3.7tn plus alpha over 2024–2027. On April 30, 2026, POSCO Holdings switched the basis of its 2026–2028 policy from free cash flow to adjusted controlling-interest net income and set the return ratio at 35–40% (POSCO Newsroom). Whatever the basis, the cash that can actually go out is set by FCF and accumulated cash, so putting FCF next to a profit-based company’s promise shows how comfortable that promise is.
26 of 90 dividend payers in 2025 paid more than their FCF
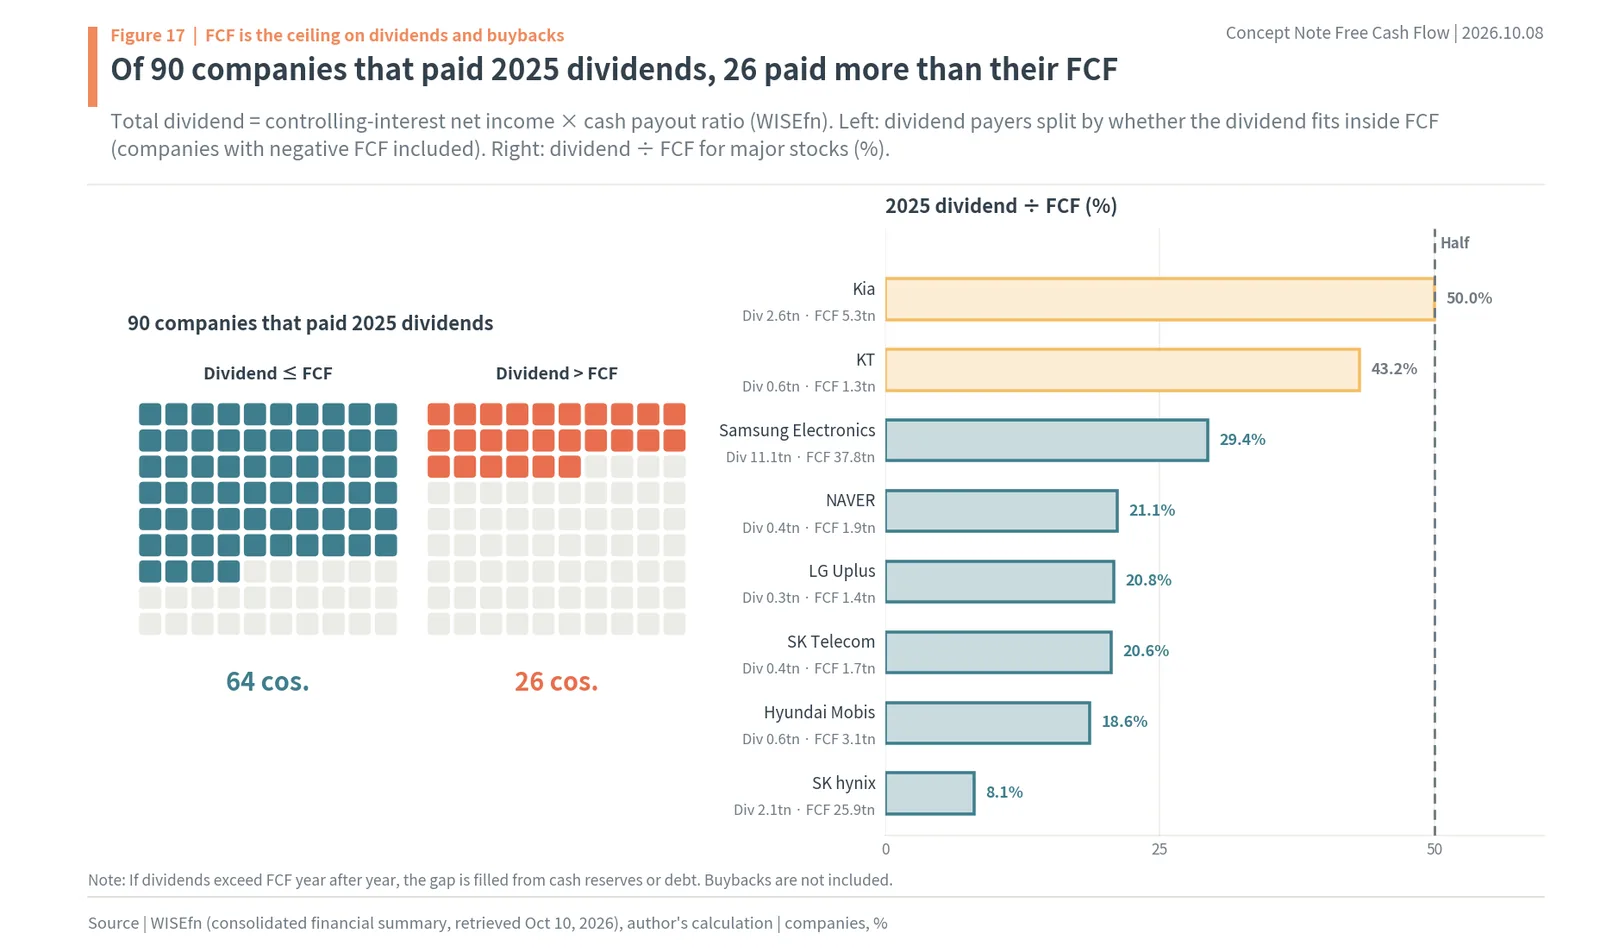
Even without a written policy, comparing FCF with dividends shows how solid a dividend is. The author estimated total 2025 dividends by multiplying WISEfn’s controlling-interest net income by the cash payout ratio and compared them with FCF. Of the 90 companies that paid dividends in 2025, 26 paid more than their FCF, including companies that paid dividends despite negative FCF. As the right side of Figure 17 shows, Kia paid KRW 2.6tn of dividends against KRW 5.3tn of FCF, 50.0%; KT was at 43.2%, Samsung Electronics 29.4%, NAVER 21.1%, LG Uplus 20.8%, SK Telecom 20.6%, Hyundai Mobis 18.6% and SK hynix 8.1%.
If dividends exceed FCF year after year, the difference is covered from accumulated cash or debt. Conversely, the lower this ratio, the more room to raise dividends or buy back shares. SK hynix moving from 8.1% to a KRW 40tn cancellation was possible because its dividend was small relative to its FCF.
Over five years, the gap between dividends and FCF is clearer
A single year’s dividends ÷ FCF swings with the timing of capex, so five years were added up. The 97 companies that paid dividends in 2021–2025 paid KRW 118.5tn in total, against five-year FCF of KRW 175.4tn. In aggregate FCF covered dividends, but company by company, 30 of the 97 paid more in dividends over five years than they generated in FCF, nearly one in three.
By company, Samsung Electronics paid KRW 50.3tn against five-year FCF of KRW 76.6tn, Kia KRW 10.0tn against KRW 37.2tn, SK hynix KRW 6.3tn against KRW 38.7tn, SK Telecom KRW 3.3tn against KRW 10.7tn and KT KRW 2.5tn against KRW 7.5tn: all within FCF. KT&G paid KRW 3.0tn against FCF of KRW 2.6tn, POSCO Holdings KRW 4.5tn against KRW 1.8tn, and LG Chem KRW 2.2tn against FCF of KRW -26.6tn. Dividends above FCF come out of cash on hand or borrowing, so a company that keeps doing this must eventually cut capex or add debt to protect the dividend. That is why five-year dividends ÷ FCF says more about how sustainable a dividend is than the payout ratio.
21. AI capex and negative FCF at Oracle and Amazon
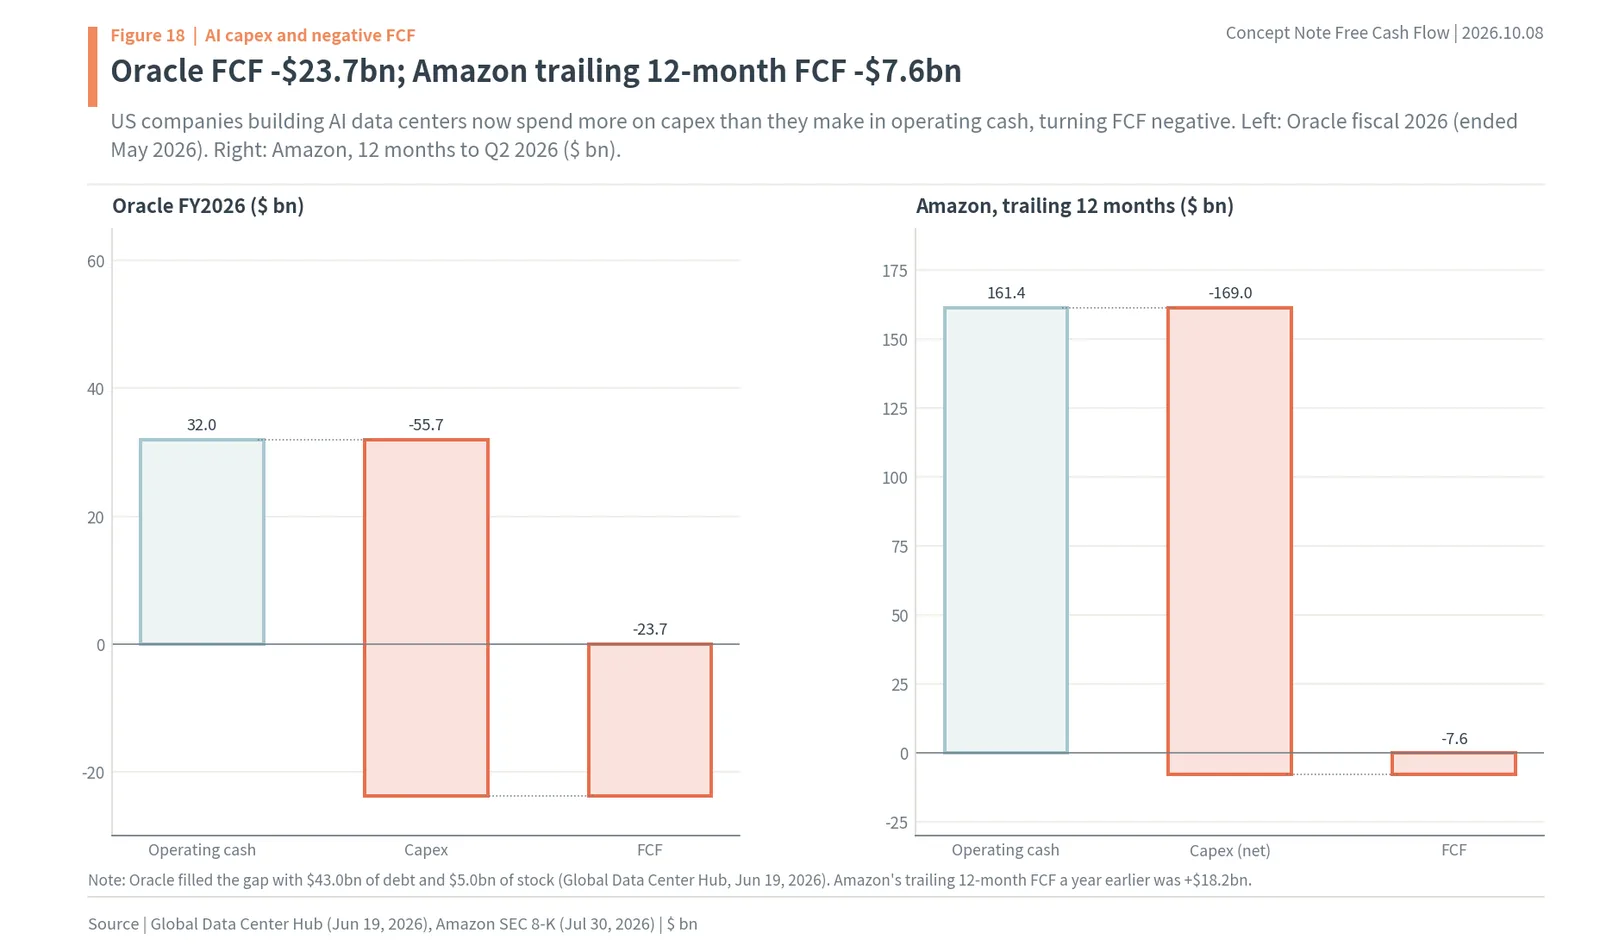
Negative FCF when capex exceeds operating cash happens at big US companies too. In fiscal 2026 (ended May 2026), Oracle earned $32.0bn of operating cash and spent $55.7bn on capex, for FCF of -$23.7bn. It covered the shortfall with $43.0bn of debt and $5.0bn of stock (Global Data Center Hub, June 19, 2026). For the 12 months to the second quarter of 2026, Amazon had $161.4bn of operating cash and $169.0bn of net purchases of property and equipment, for FCF of -$7.6bn, versus +$18.2bn for the same period a year earlier (Amazon SEC 8-K, July 30, 2026). The company said the increased investment was mainly for AI.
The two waterfalls in Figure 18 have the same shape as Korea’s battery makers. Operating cash grew, but data centers were built even faster, so the cash in the vault shrank. When that investment pays off and operating cash rises, FCF turns positive; until then, the companies build with borrowed money. In the years when Korean companies selling memory see their FCF swell, US companies buying memory to build data centers see theirs shrink. The same AI investment is recorded at once as operating cash on the selling side and capex on the buying side.
In the US, some products use FCF directly as an investment yardstick. Pacer US Cash Cows 100 takes the Russell 1000, removes financials and companies whose projected FCF or earnings over the next two fiscal years are negative, and holds the 100 companies with the highest FCF yield, FCF divided by enterprise value (EV) (SEC summary prospectus, August 31, 2024). Under this method, a company like Oracle, whose FCF turned negative because of capex, is not included. A high FCF yield itself means plenty of cash left over relative to the share price, so picking stocks on this yardstick steers money toward companies that leave a lot of cash.
22. Six steps to analyze FCF for your stock (Samsung Electronics, Kia)
Walking through it with Samsung Electronics
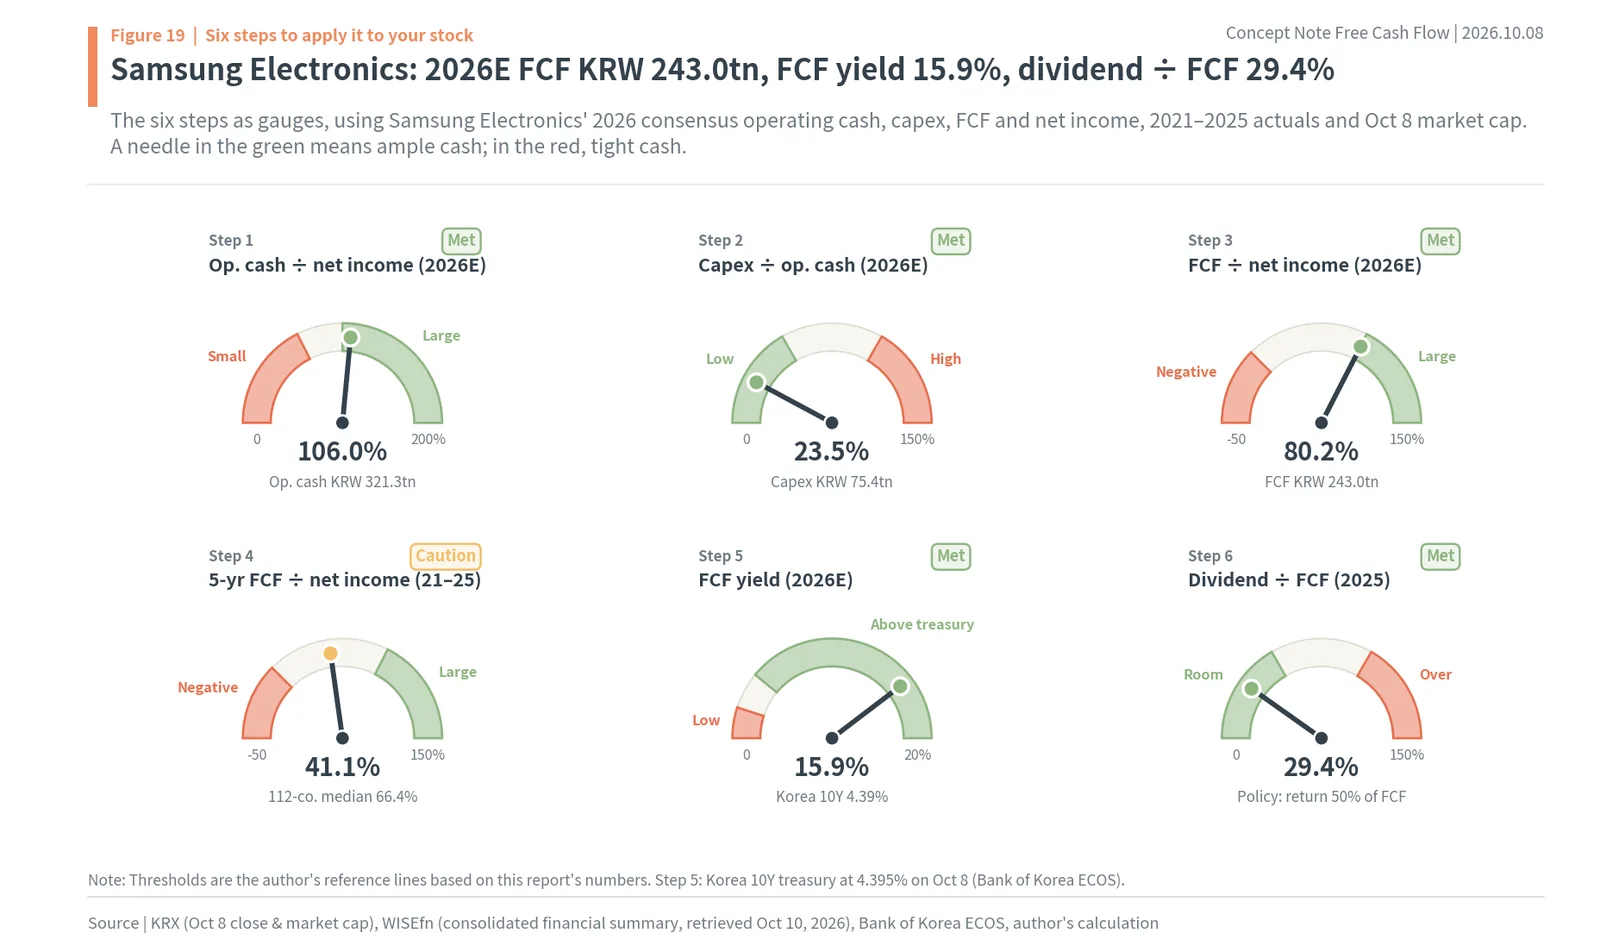
To look at your own stock’s FCF, open the company information (WISEfn) page on Naver Finance and find the operating cash flow, CAPEX, FCF, net income and cash payout ratio lines in the financial summary. Then work through the six steps below with those numbers. Figure 19 is a set of gauges filled in for Samsung Electronics; the thresholds are the author’s reference lines based on the numbers in this report.
Step 1 is operating cash ÷ net income, which shows whether profit comes in as cash. Samsung Electronics’ 2026 consensus operating cash is KRW 321.3tn and net income KRW 303.0tn, so 106.0%. Operating cash above net income means depreciation is larger than the increase in receivables and inventory, so more cash comes in than profit. If this figure drops below 70%, check first whether receivables or inventory are piling up.
Step 2 is capex ÷ operating cash, which shows how much of the cash that comes in goes back into plants. For Samsung Electronics in 2026 it is KRW 75.4tn ÷ KRW 321.3tn, or 23.5%. The five-year median for the 112 companies is 50.6%, and if capex exceeds operating cash, FCF that year is negative.
Step 3 is FCF and FCF ÷ net income. Samsung Electronics’ estimated 2026 FCF is KRW 243.0tn, 80.2% of net income. That is the share of net income that can be returned to shareholders as cash.
Step 4 is five-year FCF ÷ net income. One year’s number swings with the timing of capex, so add up five years. Samsung Electronics had KRW 186.3tn of net income and KRW 76.6tn of FCF over 2021–2025, or 41.1%, below the 112-company median of 66.4%. The past five years were a period when it put much of its profit back into plants; if the 2026 estimate is right, the ratio rises sharply.
Step 5 compares FCF yield with the treasury yield. Samsung Electronics’ estimated 2026 FCF yield of 15.86% is more than three times the 10-year treasury yield of 4.395% on October 8. If this figure is below the treasury yield, the share price is valuing future growth rather than today’s cash.
Step 6 is dividend ÷ FCF and the return policy. Samsung Electronics’ total 2025 dividend (estimated as controlling-interest net income × cash payout ratio) was 29.4% of FCF, and the company has committed to returning 50% of its 2024–2026 FCF. If dividends are below half of FCF and there is an FCF-based policy, returns grow along with FCF in the years FCF grows.
The six steps look at a company more broadly as they go. Steps 1–3 follow the bridge in a single year, from profit to cash and from cash to FCF. Step 4 stretches that bridge to five years to remove the swings caused by capex timing. Step 5 compares that cash with the share price, and step 6 checks how much of that cash actually comes back to shareholders. If something gets caught at an earlier step, trust the later numbers that much less. For example, if operating cash falls below 70% of net income at step 1, the FCF yield at step 5 may be a number from a year when receivables or inventory grew.
One more time with Kia
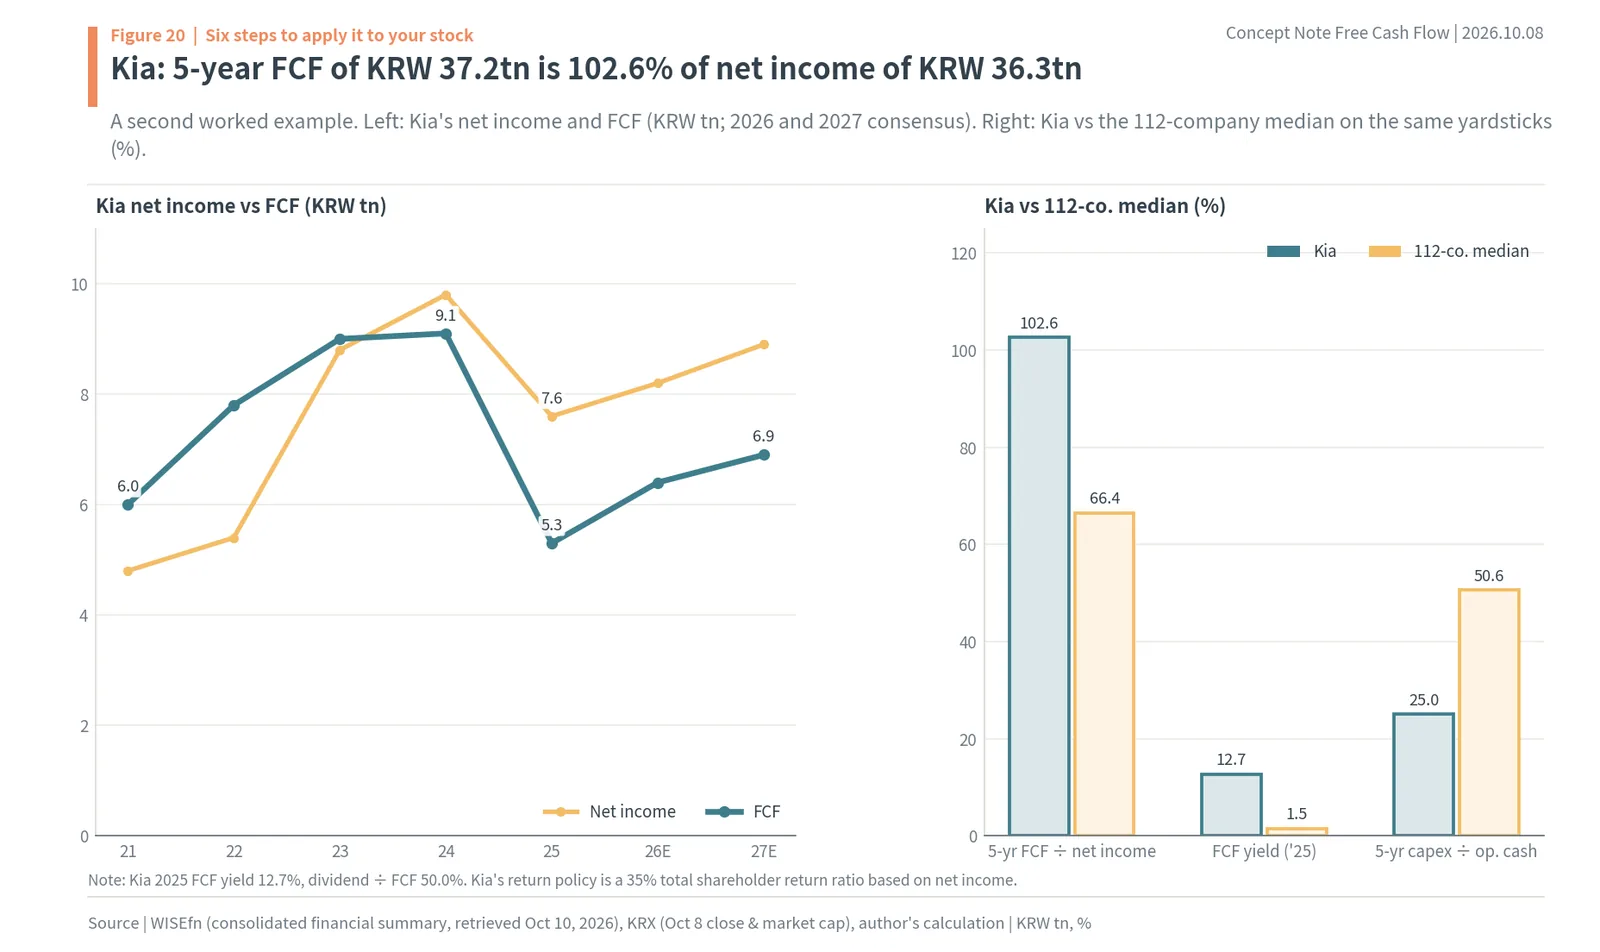
The second example is Kia. As the left side of Figure 20 shows, Kia’s FCF was KRW 6.0tn in 2021, KRW 7.8tn in 2022, KRW 9.0tn in 2023, KRW 9.1tn in 2024 and KRW 5.3tn in 2025, with consensus at KRW 6.4tn in 2026 and KRW 6.9tn in 2027. Over five years, FCF of KRW 37.2tn was 102.6% of net income of KRW 36.3tn. It is a company that kept slightly more cash than the profit it earned.
The bars on the right put Kia on the same yardsticks as the 112-company median. Five-year cash conversion is 102.6% vs 66.4%, 2025 FCF yield 12.69% vs 1.49% and five-year capex ÷ operating cash 25.0% vs 50.6%. The share going out as capex is half the large-cap median, so a lot of cash is left. The 2025 dividend was 50.0% of FCF, and Kia’s return policy is a 35% total shareholder return ratio based on net income. It is a profit-based policy, but because FCF is left at about the level of net income, the company can fund that promise with cash.
23. Free cash flow: key takeaways
Net income is a book figure set by accounting rules; FCF is the cash left from operating cash after buying equipment. Depreciation adds cash, while increases in receivables and inventory and capex take it away. So the same KRW 100bn of net income can mean FCF of KRW 100bn or KRW 10bn. This leftover cash sets the ceiling on dividends and buybacks for shareholders.
Among 112 large Korean companies, 18 of the 96 profitable in 2025 had negative FCF, and the median five-year cash conversion was 66.4%. Battery makers spent more on capex than their operating cash for five straight years while building plants, and for utilities one year and five years pointed in opposite directions. In 2026, the two memory makers’ operating cash far outruns capex, swelling the 112 companies’ total FCF to KRW 462.8tn, 88.4% of it from Samsung Electronics and SK hynix. Both companies tie returns to 50% of FCF, so as FCF grows, so does the cash returned to shareholders.
Looking at FCF means following where the money a company earns goes. Cash from operations goes first to equipment, what is left becomes FCF, and FCF is split among dividends, buybacks, debt repayment and the vault. In this order, companies whose capex exceeds operating cash bring in money from outside, and companies whose capex stays a fraction of operating cash build up cash to return to shareholders. How much of that cash today’s price has priced in is read from the gap between FCF yield and the required return, that is, the growth the price has priced in.
To sum up the order once more with this report’s numbers: on the 112-company median, the 2026 FCF yield is 3.06%, below the 10-year treasury yield of 4.395%, and the price prices in 4.94% growth. Samsung Electronics’ FCF yield of 15.86% is more than three times the treasury yield, but its price assumes that FCF shrinks every year. Battery makers have negative FCF, so they are priced not on cash today but on cash in the years their plants run. One yardstick, FCF, explains three different shapes of share price. So the order this report recommends is simple. After net income, look at operating cash and capex; after one year’s FCF, look at the five-year total; after FCF yield, look at the growth it prices in and the company’s return policy. Line up these three pairs in turn and the distance between book profit and the cash shareholders will receive becomes a number.
마오채둥 정리. Add depreciation to net income and subtract increases in receivables and inventory to get operating cash; subtract capex from that to get FCF. The median five-year cash conversion of 112 large Korean companies was 66.4%, so only about two-thirds of profit was left as cash, and battery makers building plants made profits but burned cash. Samsung Electronics’ FCF grows from KRW 37.8tn in 2025 to an estimated KRW 243.0tn in 2026, and its returns are tied to 50% of FCF, so putting FCF, the five-year total and FCF yield next to profit is the order for reading the money that actually comes back to shareholders. Profit is on paper; FCF is the cash left after capex.
Free Cash Flow (FCF) FAQ
Q. How do you calculate free cash flow (FCF)?
FCF = operating cash flow − capex. Starting from net income, add depreciation, subtract the increase in working capital to get operating cash flow, then subtract capex. Samsung Electronics’ 2025 net income was KRW 45.2tn; adding KRW 46.9tn of depreciation and subtracting KRW 6.8tn of working capital and other items gives operating cash of KRW 85.3tn, and subtracting KRW 47.5tn of capex leaves FCF of KRW 37.8tn.
Q. What is the difference between net income and FCF?
Net income is a book figure set by accounting rules; FCF is the cash actually left after paying for equipment. Two hypothetical companies with the same KRW 100bn net income and 15x PER can have FCF of KRW 100bn or KRW 10bn depending on receivables and capex. Among 96 profitable large Korean companies in 2025, 18 had negative FCF.
Q. What is FCF yield and what is a good FCF yield?
FCF yield is FCF divided by market cap, a stock’s cash interest rate. The median of 112 large Korean companies was 1.49% in 2025 and 3.06% on 2026 estimates, below the 10-year Korea treasury yield of 4.395% on October 8, 2026. A very high one-year yield, like KOGAS’s 136.6% in 2025, should be checked against several years of FCF.
Q. Why can a profitable company have negative FCF?
Because capex is larger than operating cash, usually while new plants are being built. LG Energy Solution had positive five-year net income of KRW 0.7tn but five-year FCF of KRW -28.4tn, and it raised KRW 28.3tn through financing over 2021–2025 to cover the gap.
Q. How do Samsung Electronics and SK hynix use FCF for shareholder returns?
Samsung Electronics returns 50% of its 2024–2026 FCF; on WISEfn numbers, half of KRW 302.4tn is KRW 151.2tn, and it expects about KRW 90–110tn of returns left this year. SK hynix uses 50% or more of cumulative 2025–2027 FCF, whose consensus total is KRW 453.0tn, and approved a KRW 40tn buyback and cancellation in August 2026.
Sources
- WISEfn (Naver company data), financial summary (operating cash flow, CAPEX, FCF, net income, cash payout ratio, 2021–2027E) and valuation data (EBITDA), retrieved Oct 9–10, 2026
- Korea Exchange (KRX), closing prices and market caps of all listed stocks, Oct 8, 2026
- Bank of Korea ECOS, 10-year Korea treasury yield, Oct 8, 2026
- Ministry of Economy and Finance economic glossary, free cash flow (link), Nov 3, 2020
- Hankyung economic dictionary, free cash flow (link)
- Dailian, Samsung Electronics shareholder returns (link), Aug 21, 2026
- SBS Biz, Samsung Electronics board decision on shareholder returns (link), Aug 21, 2026
- IB Tomato, Samsung Electronics capex and FCF estimates, Sep 9, 2026
- SK hynix Newsroom, 2025–2027 shareholder return policy (link), Nov 27, 2024
- Money Today, SK hynix KRW 40tn buyback and cancellation (link), Aug 19, 2026
- POSCO Newsroom, POSCO Holdings 2026–2028 mid-term shareholder return policy, Apr 30, 2026
- KT&G IR, corporate value-up plan (link), Nov 14, 2024
- Seoul Shinmun (CEO Score), FCF of Korea’s 500 largest companies (link), Dec 10, 2025
- IB Tomato, LG Energy Solution FCF (link), Dec 6, 2024
- Global Data Center Hub, Oracle FY2026 cash flow, Jun 19, 2026
- Amazon, SEC Form 8-K Exhibit 99.1 (link), Jul 30, 2026
- Pacer ETFs, US Cash Cows 100 ETF summary prospectus (SEC), Aug 31, 2024
- CFA Institute, Free Cash Flow Valuation