Korea Non-Regular Workers Hit Record 8.67 Million: Why the Rise Is All Workers Over 60 (2026)
On October 21, 2026, Statistics Korea, the national statistics agency (now officially named the National Data Agency), released its August 2026 supplementary survey of the labor force by employment type. At the briefing, Kim Rak-hyun, head of the agency’s employment statistics division, said that 8,671,000 non-regular workers was “the largest since the supplementary survey by employment type began in 2003.” He then gave the reason: the main factor was a rise in part-time workers, whose short hours mean low pay. And he added one more sentence: a large increase in non-regular workers aged 60 and over also played a part.
At the same briefing he explained that regular employment grew by only 10,000 because of the war in the Middle East and other shocks. So the person who produced the numbers named three causes himself: people who work short hours, people who are older, and an economy in which regular jobs barely grew.
So what does “record high” actually mean? It could mean that jobs got worse and regular jobs turned into non-regular ones. Or it could mean that the workforce got older, so the age groups where non-regular work has always been common got bigger. The two readings call for different remedies. This report splits the numbers by age, industry, type of employment and pay to find the answer, and then asks whether the bill now before Korea’s National Assembly to raise the statutory retirement age to 65 fits that answer.
As of: October 21, 2026 (the release date; stock prices are KRX closes on the same day). Won amounts are converted at about KRW 1,330 per dollar (KRW 1,327.5 at 10:50 a.m. on October 21, 2026, per the Korea Economic Daily). Numbers the author calculated are marked as such.
Topics covered: the released figures and the 2015-2026 trend; what non-regular work, part-time work, retirement age, re-employment and seniority pay mean, with a hypothetical example; the rise split by age and the effect of an aging population; the care and part-time jobs that absorbed it; the pay gap and social insurance; why regular hiring shrank; the case for and against a statutory retirement age of 65 and the author’s view; affected sectors, stocks and dates to watch; and the basis of calculation.
Non-regular workers rose to 8,671,000, and 91.2% of the new wage workers were non-regular
Every number in this release is accurate, and the record is real. Non-regular employment was the largest since 2003 both in headcount and as a share, and the monthly pay gap with regular workers was also the widest on record. But when you split out who made that record, the picture changes. This chapter first lays out the released numbers as they are.
In August 2026 Korea had 22,526,000 wage workers, 113,000 more than a year earlier. Regular workers numbered 13,855,000, up only 10,000, while non-regular workers numbered 8,671,000, up 103,000. That is where the figure comes from: 91.2% of the 113,000 new wage workers were non-regular. The non-regular share of wage workers rose 0.3 percentage point (pp) to 38.5%, from 38.2% a year earlier, passing the previous high of 38.4% set in 2021. A year earlier, regular jobs had grown by 160,000 and non-regular by 110,000, so regular job growth slowed sharply in one year.

The left side of the figure splits the 113,000 new wage workers into 10,000 regular and 103,000 non-regular. The middle shows the change by type. Fixed-term workers rose 187,000 to 6,035,000, passing 6 million for the first time, and within that group contract workers rose 160,000 to 5,497,000. Part-time workers rose 152,000 to 4,382,000, while “atypical” workers (dispatched, outsourced service and day labor) fell 48,000 to 1,786,000. Because the types overlap, the three do not add up to the total increase. Someone on a one-year contract who works four hours a day, for example, is both fixed-term and part-time.
How this works in Korea: regular versus non-regular employment
In Korea a “regular” worker is a direct, full-time employee with no fixed end date, who is normally protected until the statutory retirement age of 60 and whose pay usually rises with years of service. A “non-regular” worker is anyone outside that model. Statistics Korea counts them in a survey of households every August, and the definition differs from the “temporary employment” measure the OECD uses for cross-country comparison. The difference matters for investors because the regular-job model, with its seniority pay and a retirement age set by law, is what makes a new permanent hire expensive for Korean companies. The rest of this report keeps coming back to that cost.
From 6,308,000 in 2015 to 8,671,000 in 2026, with one change in method along the way
Over the long run, non-regular workers rose from 6.308 million, or 32.4% of wage workers, in 2015 to 8.671 million, or 38.5%, in 2026. But one year in that series should not be read at face value: 2019. From the 2019 survey, the statistics office added a parallel survey that found contract workers who had not been captured before, and estimated the extra at 350,000 to 500,000. The government’s statistics portal, e-Narajipyo, also says 2019 cannot be compared with the year before. Much of the jump from 6,614,000 in 2018 to 7,481,000 in 2019 is a change in how workers are counted, not a change in jobs.
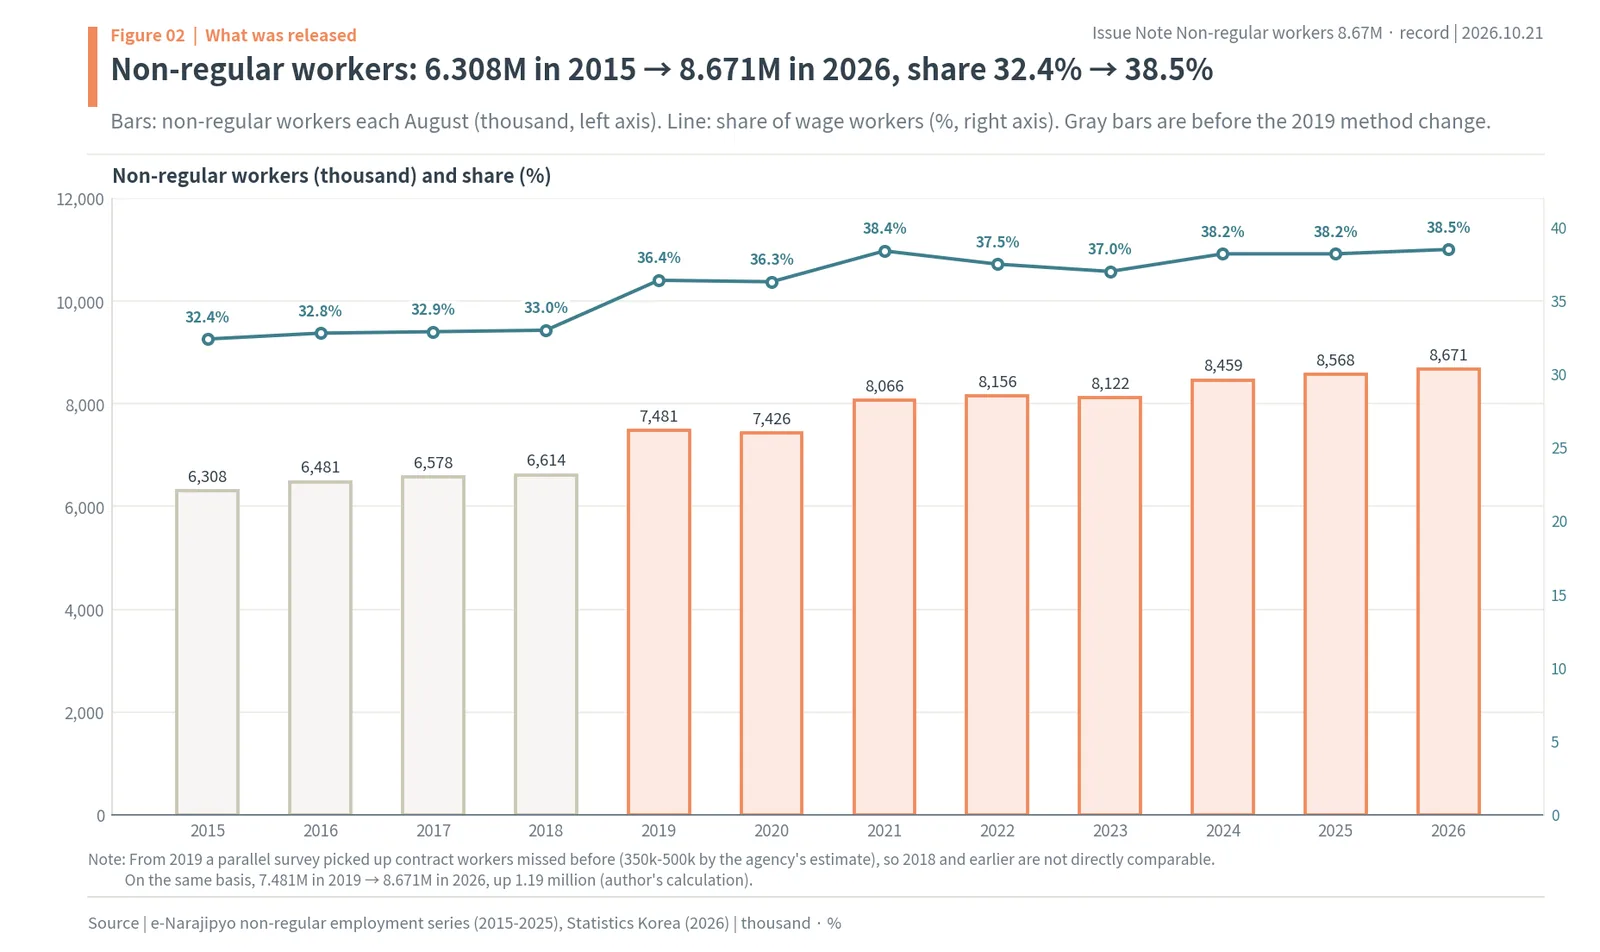
So this report uses 2019 as its starting point for comparison. On the same basis, non-regular workers rose by 1.19 million, from 7.481 million in 2019 to 8.671 million in 2026. Over the same period the share rose 2.1pp, from 36.4% to 38.5%. In the chart, bars are the number of non-regular workers, the line is the share, and the gray bars are the years before the 2019 method change.
Part-time work is now more than half of non-regular work
By type, the most striking change is part-time work. A part-time worker here means someone whose scheduled hours are at least one hour shorter than those of a person doing the same job at the same workplace. Part-time workers rose from 2,236,000 in 2015 to 4.382 million in 2026, and their share of non-regular workers went from 49.4% last year to 50.5%, past half. Fixed-term workers are still the largest block, at 69.6% of non-regular workers, but part-time work is growing faster.
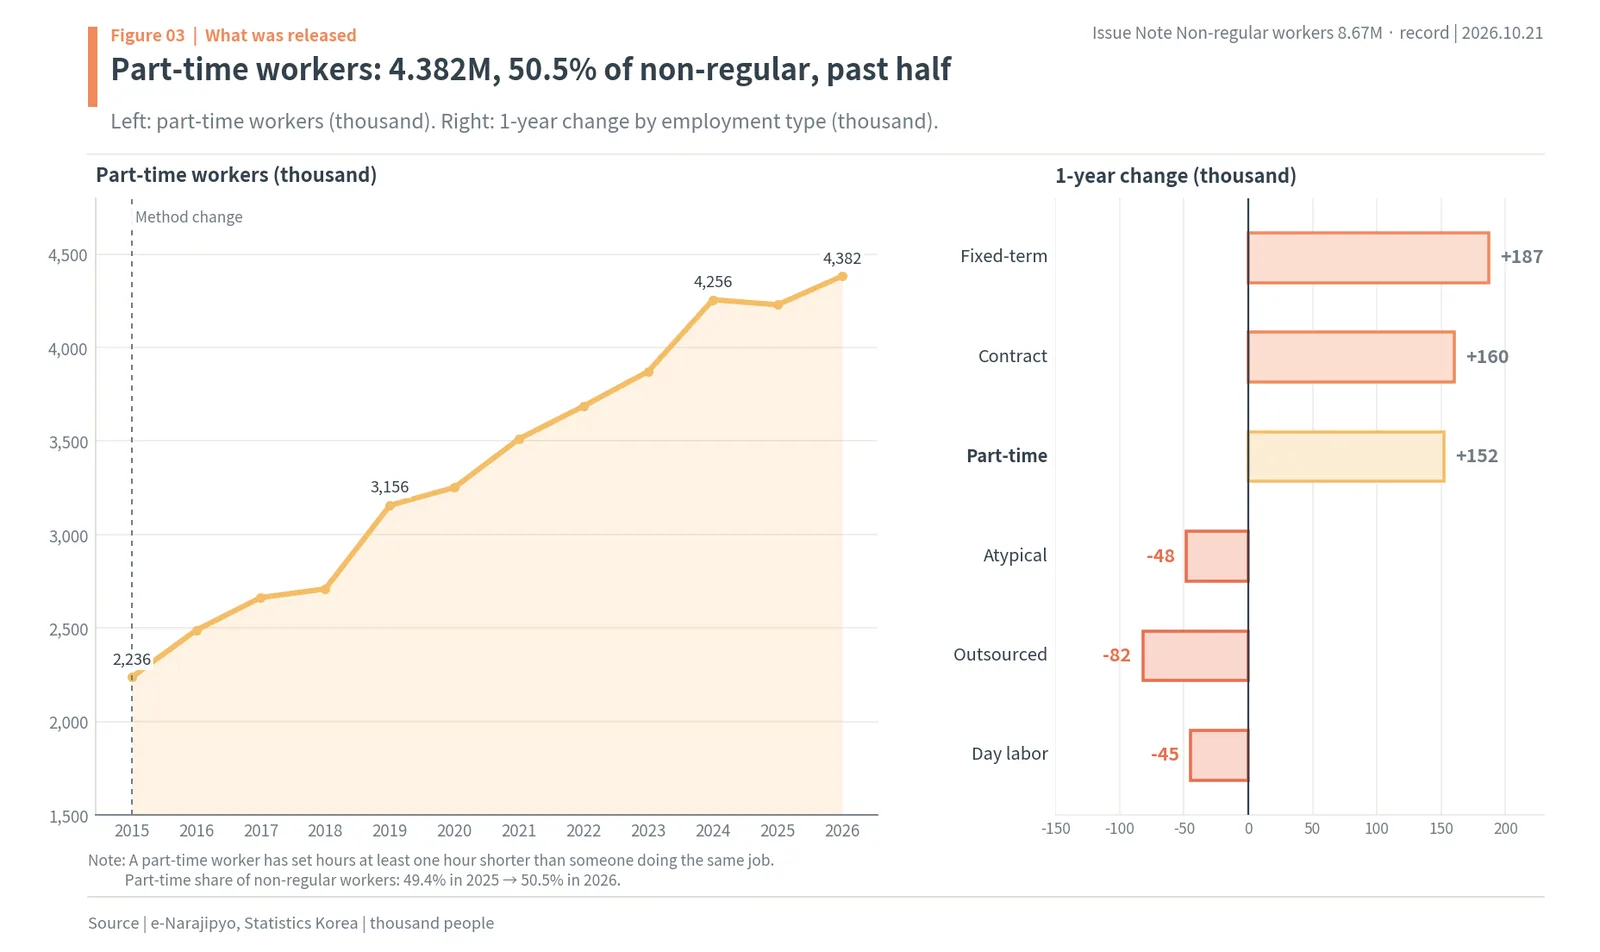
The left of the figure is the number of part-time workers from 2015 to 2026. It jumped from 3,156,000 in 2019 to 4,256,000 in 2024, paused at 4,229,000 in 2025, and rose again to 4,382,000 this year. The right is the one-year change by type. Fixed-term, contract and part-time work rose, and only atypical work fell. Within atypical work, outsourced service workers fell 82,000 and day laborers 45,000.
This chapter has two conclusions. The record is real, and at its center are part-time and fixed-term work. The next question is who filled those part-time and fixed-term jobs. Before that, the next two chapters set out the long trend and the terms this report uses.
Since 2019, workers aged 60 and over have made up most of every year’s increase
This is not a one-year story. In every year since the same basis began in 2019, workers aged 60 and over have accounted for a large part of any rise in non-regular employment. And in the years when the 60-plus increase was small, total non-regular employment fell. This year’s record sits on that trend.
2020 was the year COVID-19 hit. Non-regular employment fell to 7,426,000 from 2019, yet non-regular workers aged 60 and over rose from 1,938,000 to 2,132,000. In 2021 non-regular employment jumped to 8,066,000, a then-record share of 38.4%, and that year the 60-plus group rose by 270,000. In 2022 the total rose to 8,156,000, with the 60-plus group up 151,000. In 2023 the total fell to 8,122,000, the first fall in three years, and that year the 60-plus increase was the smallest, at 66,000. In 2025, at 8,568,000, the 60-plus group rose 233,000 and passed 3 million for the first time, and in 2026 it rose another 135,000.
Put those yearly numbers side by side and a pattern appears. When the 60-plus increase is large, total non-regular employment rises sharply; when it is small, the total falls. While non-regular employment under 60 drifts up and down a little each year, the direction of the total has been set by the 60-plus group (author’s calculation). As long as many people keep crossing 60, the non-regular count is likely to set new records again. Judging the health of the labor market from that record alone would point in the wrong direction.
Regular jobs also rose by 777,000 after 2019
It is easy to assume that only non-regular jobs grew while regular jobs shrank, but regular jobs grew too. Regular employment fell from 13,078,000 in 2019 to 12,927,000 in 2021, then rose to 13,568,000 in 2022 and 13,832,000 in 2023, and stands at 13,855,000 in 2026. That is 777,000 more than in 2019 (author’s calculation). The problem is the recent pace. In the three years after 2023, regular employment was essentially flat, and this year it grew by 10,000.
The monthly pay gap grew from KRW 616,000 in 2004 to KRW 1.94 million
The long-run pay gap belongs on the same timeline. In 2004, the first year this survey measured the difference in average monthly pay between regular and non-regular workers, it was KRW 616,000. The 2026 figure of KRW 1.94 million is 3.1 times that (author’s calculation). Since prices and wages both rose, some widening in won terms is natural. But even as a ratio, non-regular pay is now 52.1% of regular pay, below 52.9% in 2020, and as part-time workers have passed half of non-regular workers, the pull on the average has grown stronger every year.
To sum up this chapter: this year’s record sits on an aging trend that has run steadily since 2019, and there is no reason for that trend to turn soon. So rather than the non-regular headcount itself, it is better to look at age and hours within it, together with the width of the door into regular jobs.
Key terms: non-regular work comes in three kinds, and a later retirement age costs more than re-employment
This report’s view rests on five terms: non-regular work, part-time work, a later retirement age, re-employment and seniority pay. Agreeing on what they mean first makes the numbers that follow much easier to read.
Non-regular work is not one form of employment but three grouped together. The first is fixed-term workers: people with a set contract period, or whose contracts keep being renewed but who cannot reasonably expect to keep working. Contract workers belong here. The second is part-time workers, whose scheduled hours are shorter than those of others doing the same job. The third is atypical workers: dispatched, outsourced service, special-type (self-employed-like contractors), home-based and day workers. One person can belong to two of these at once.
Part-time work needs one more split. “Ultra-short-hours” workers who work under 15 hours a week are not entitled to Korea’s paid weekly rest day allowance or to severance pay. That gives employers a reason to cut jobs into pieces of under 15 hours. People working 1 to 14 hours a week numbered 922,000 in 2016 and passed 2 million for the first time in July 2026, at 2,029,000, or 7.0% of all employed people.
A later retirement age and re-employment are both ways to keep older workers on longer, but the contracts look different. Raising the retirement age delays the leaving age itself by law, so the worker stays longer in the same company, in the same grade and on the same pay scale. Re-employment means the worker formally retires at the retirement age and is then hired again on a new contract, in which the job, hours and pay can all be set again.
Seniority pay is a pay system in which pay rises with years of service. According to a report by the Korea Enterprises Federation (KEF), Korea’s largest employers’ group, pay at 30 or more years of service is 2.95 times pay at under one year in Korea, higher than Japan at 2.27 times, Germany at 1.80, France at 1.63 and the UK at 1.52. The bigger that multiple, the more a company has to pay when the retirement age goes up by a year.
Hypothetical example: one more year before retirement costs a company about three new hires
Here is what that means in numbers. Imagine a company where a new hire earns KRW 40 million a year (about $30,100), and pay follows the Korean average, so a 30-year employee earns 2.95 times a new hire. That employee earns KRW 118 million a year (about $88,900). If the law adds one year before that employee has to retire, the company pays KRW 118 million more for that year. That money would pay about three new hires for a year (author’s assumptions and calculation).
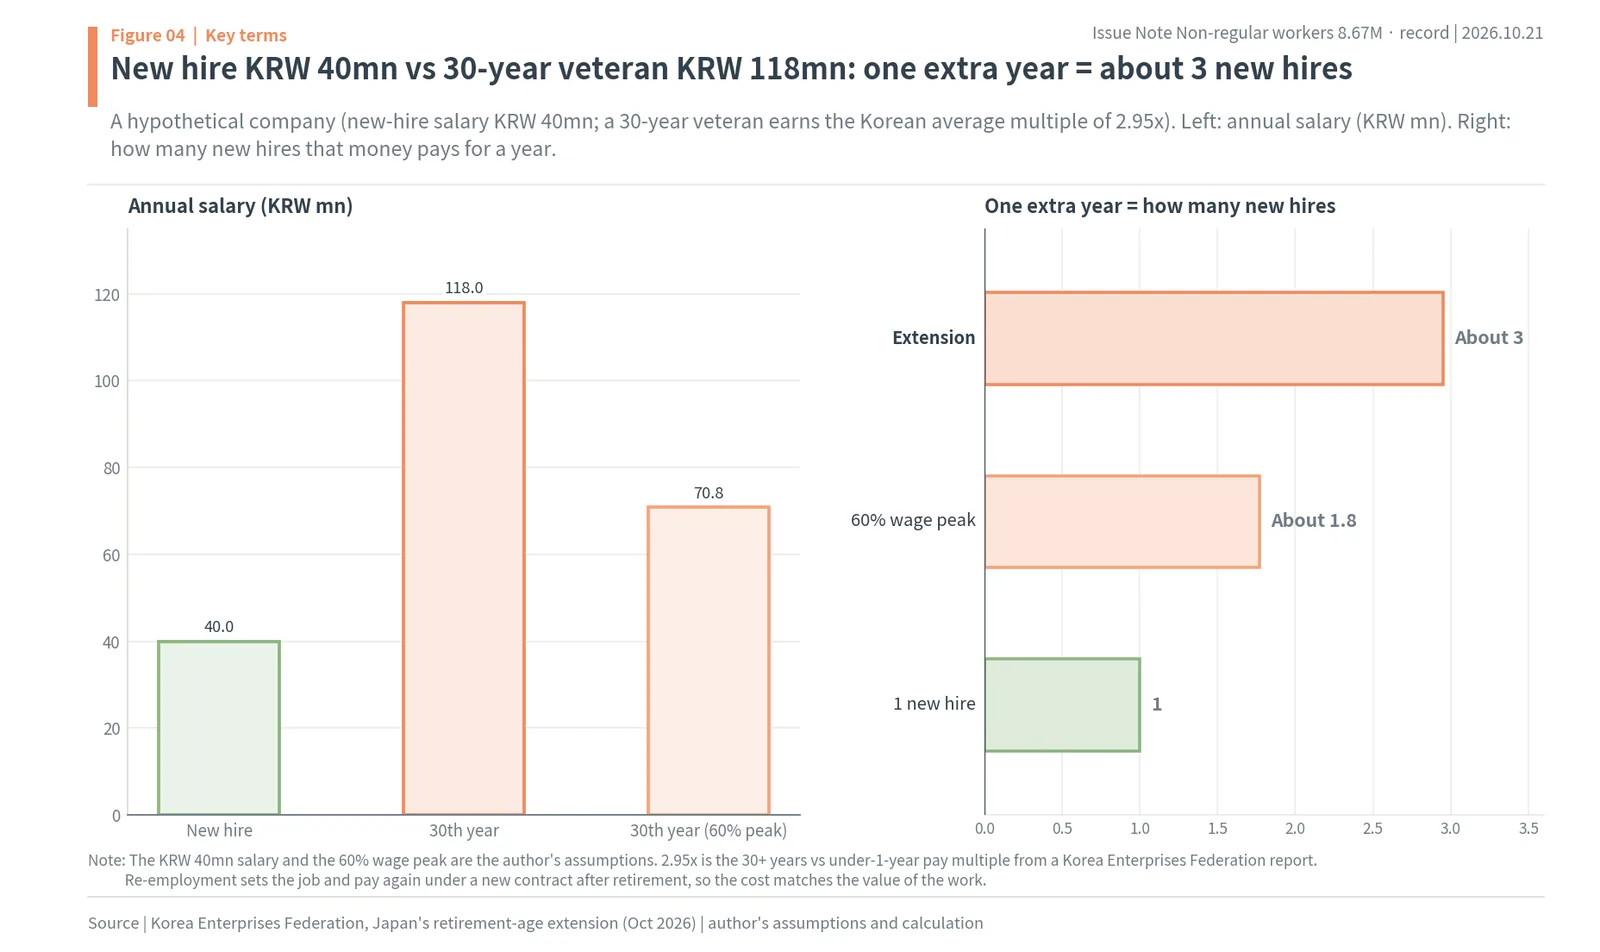
Even if a wage-peak system pays only 60% of the original salary during the extension, the cost is KRW 70.8 million, about 1.8 new hires. If instead the company retires the same employee at the retirement age and re-employs them with the job and pay set again, it can pay what that work is worth. The left of the figure shows annual pay for a new hire, a 30-year employee and a 30-year employee under a 60% wage peak; the right shows how many new hires that money covers. These are the author’s assumptions, and every company’s pay curve is different. The example makes one point: the same extra year costs a company very different amounts under a later retirement age and under re-employment, and the gap grows the steeper seniority pay is.
With these five terms in hand, the next chapter asks what appears when non-regular growth is split by age.
All of the rise in non-regular work was among people 60 and over, and the under-60 count has been flat for seven years
The first conclusion of this report is in this chapter. In 2026 the rise in non-regular workers aged 60 and over, 135,000, was larger than the total rise of 103,000. Non-regular workers under 60 actually fell by 32,000. The long view says the same. Since 2019, the 60-plus group rose by 1.242 million, more than the 1.19 million total rise, while non-regular employment under 60 barely moved, from 5,543,000 to 5,491,000. The record is less the result of jobs turning non-regular than of the workforce growing older.
Start with the change by age. Non-regular workers aged 60 and over rose 135,000 to 3,180,000, a record both in number and as a share, at 36.7% of non-regular workers. People in their 30s rose 39,000 and those in their 50s 11,000. In contrast, those aged 29 and under fell 64,000 to 1,482,000, and those in their 40s fell 20,000 to 1,184,000. All groups under 60 together fell 32,000 (author’s calculation). Taken on their own, non-regular workers aged 70 and over rose 85,000 to 1.29 million, more than the 1,184,000 non-regular workers in their 40s.
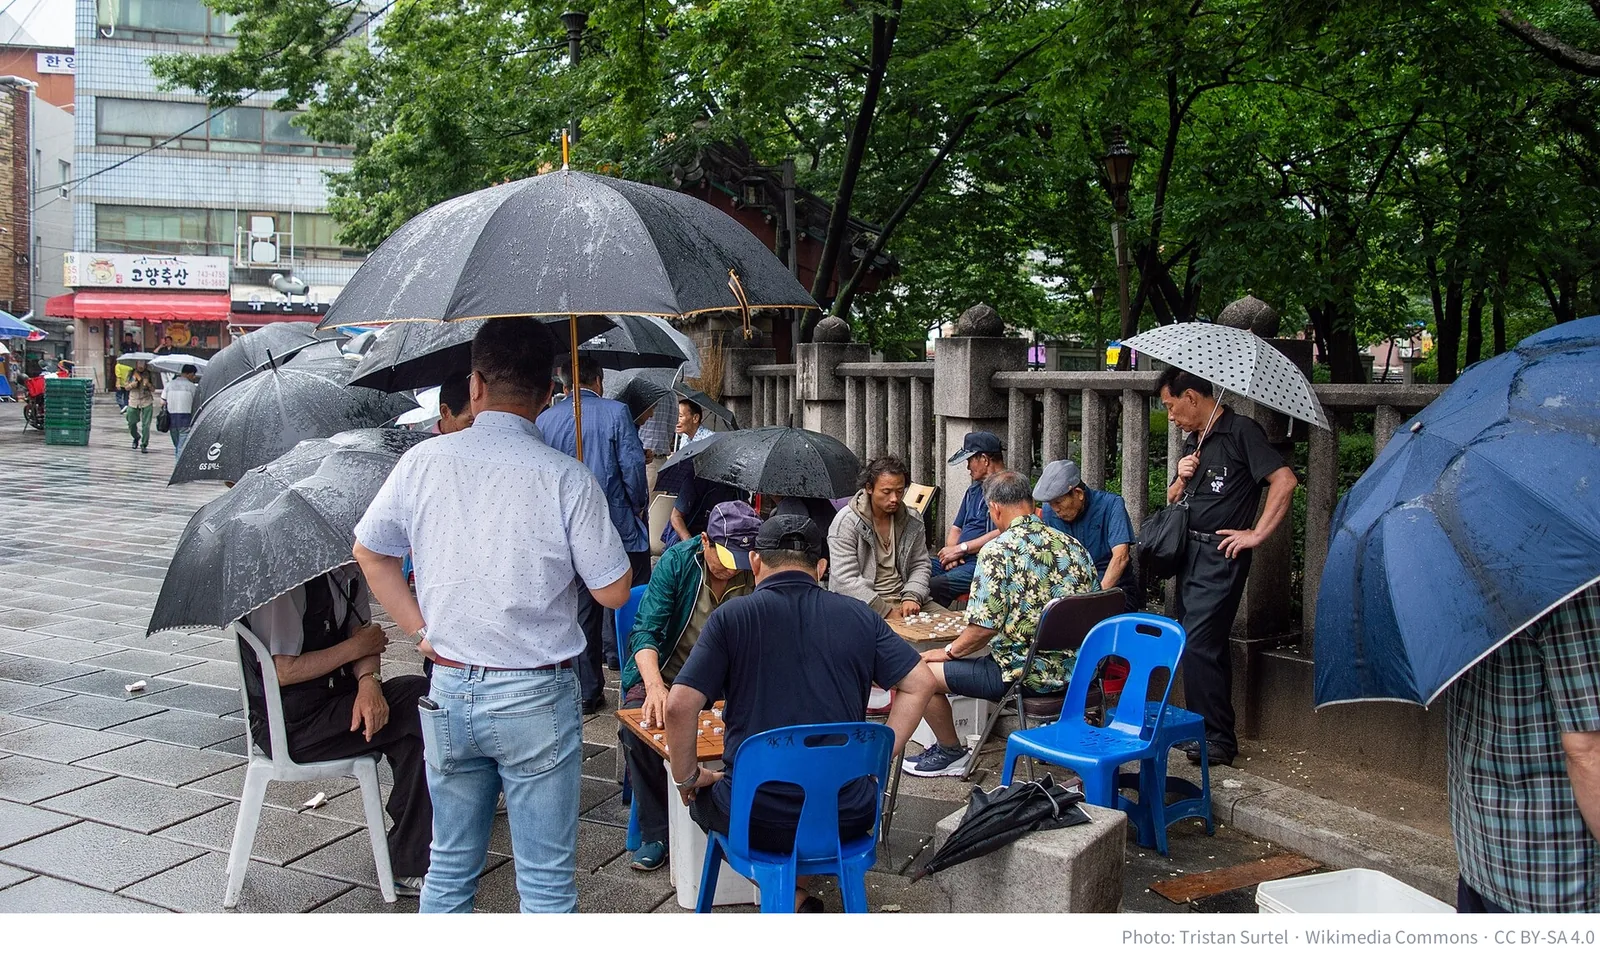
That there are now more non-regular workers aged 70 and over than in their 40s shows how quickly the age structure of Korea’s labor market is changing. Statistics Korea explained that young people and people in their 40s are age groups whose population is shrinking, so fewer of them are employed. This report reads it the same way. For young people there is a part that population decline does not explain, which the chapter on youth takes up later.
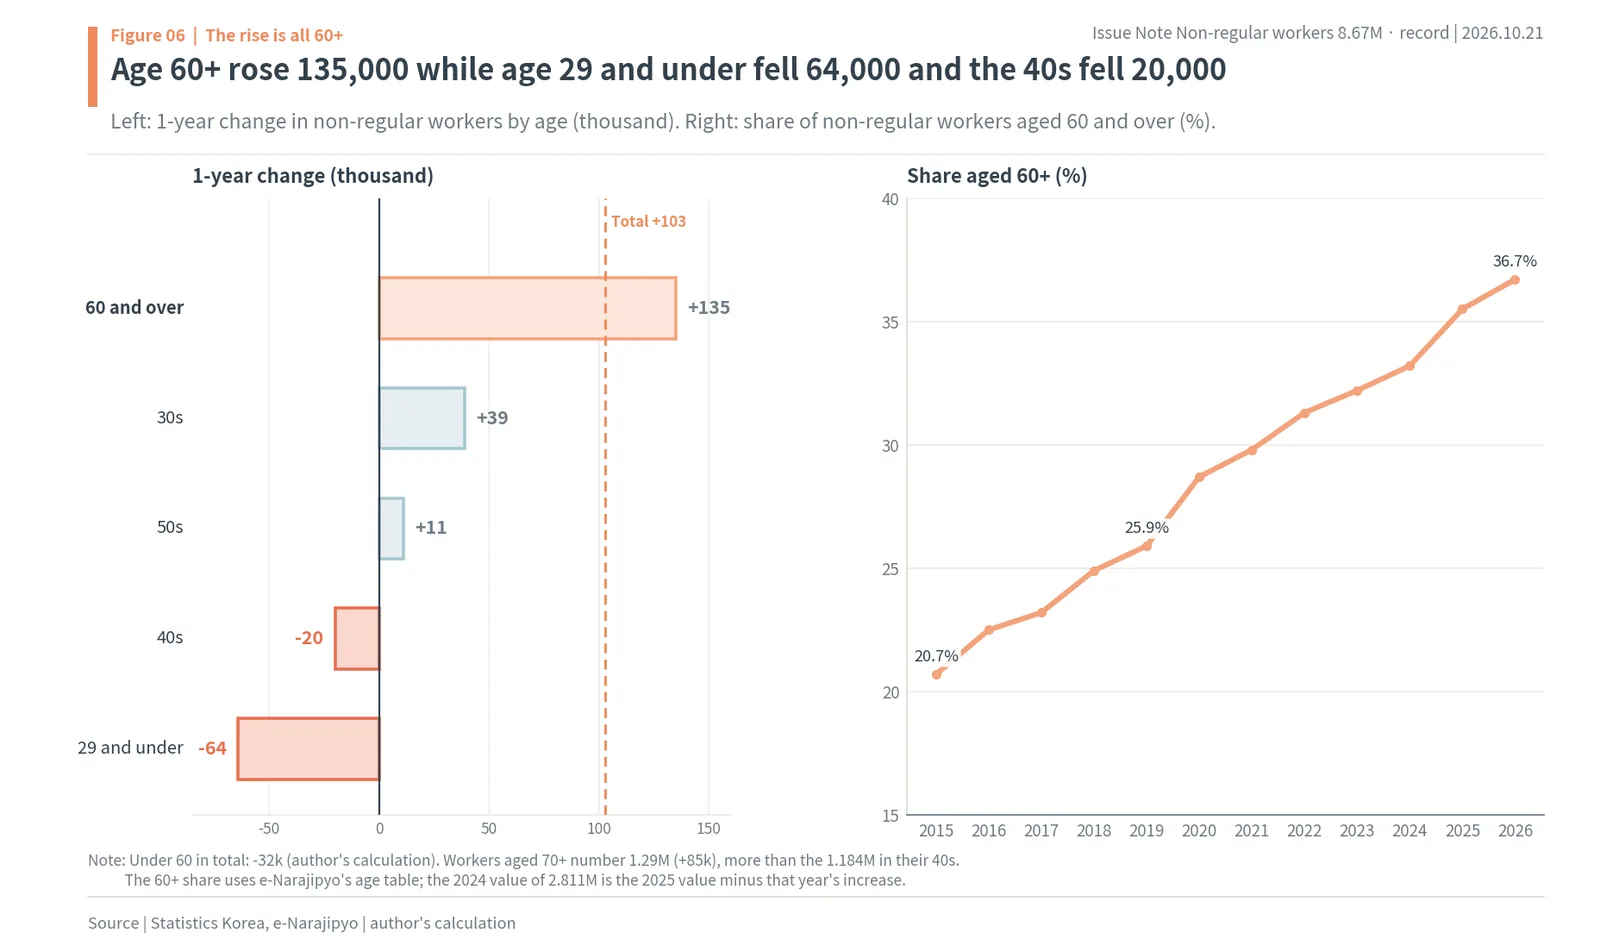
The left of the figure is the one-year change by age group. The single bar for 60 and over is longer than the total rise of 103,000, and the bars for 29 and under and for the 40s point left. The right is the share of non-regular workers aged 60 and over, which rose from 20.7% in 2015 to 36.7% in 2026 (author’s calculation). More than one in three non-regular workers is now 60 or older.
After 2019, non-regular employment under 60 stayed flat at 5.543 million to 5.491 million
One year could be chance, so split the numbers from 2019, when the same basis started. In 2019 there were 7,481,000 non-regular workers, of whom 1,938,000 were 60 and over and 5,543,000 under 60. In 2026, of 8,671,000, 3,180,000 are 60 and over and 5,491,000 under 60. Over seven years the 60-plus group grew by 1,242,000, more than the 1.19 million total increase, and the under-60 group fell by 52,000 (author’s calculation).
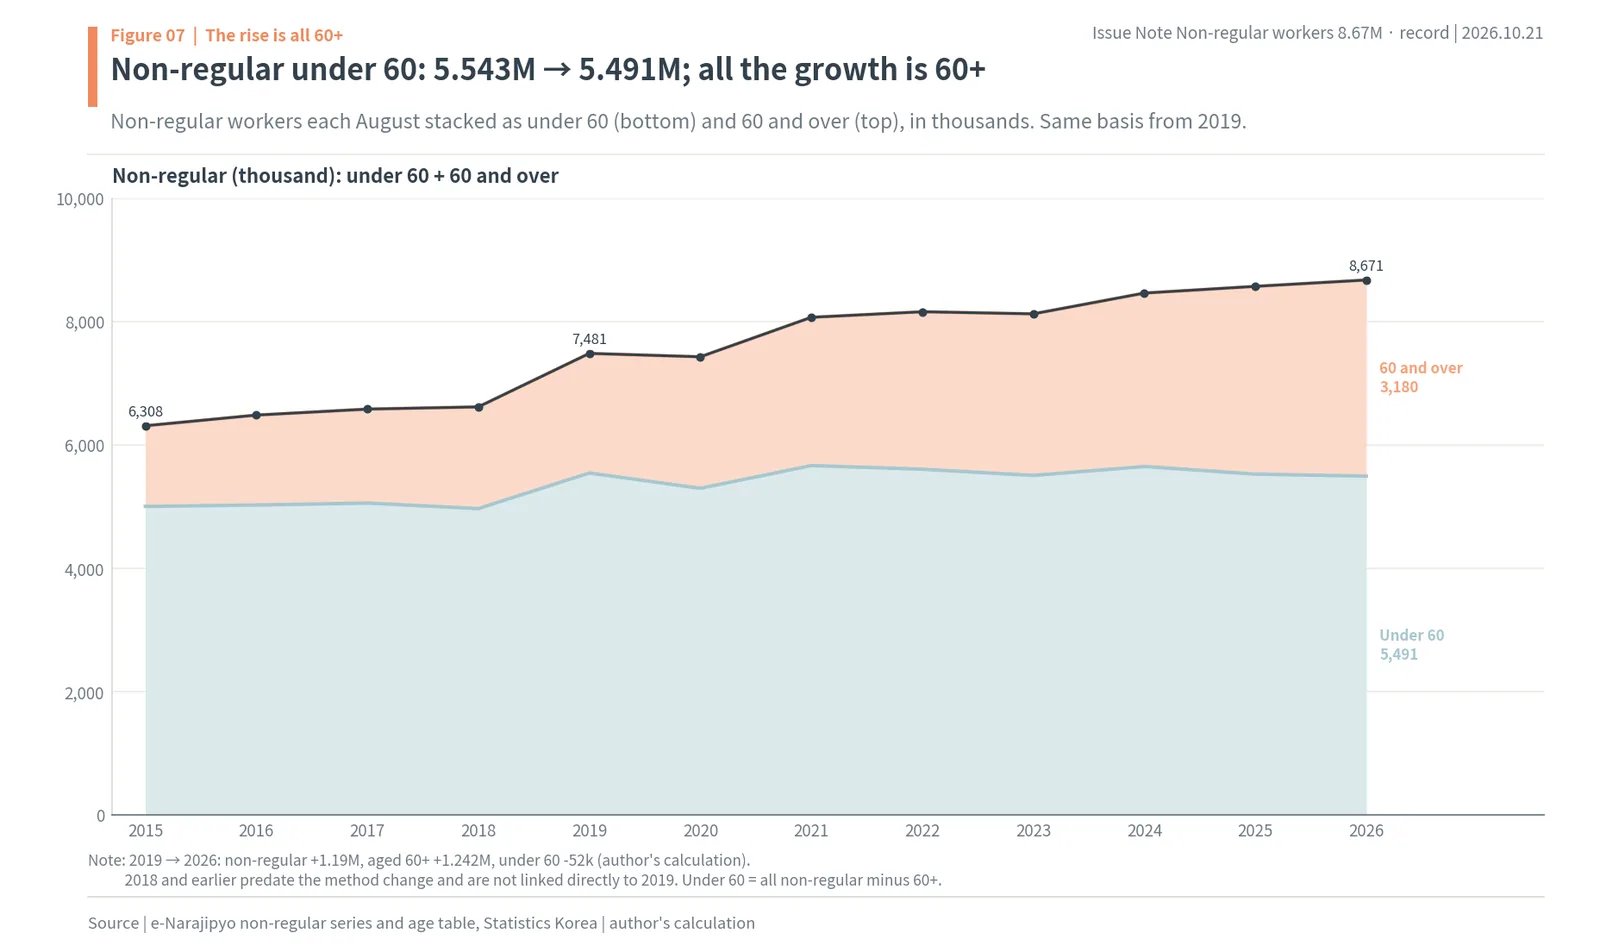
The chart stacks non-regular workers since 2015 into under 60 and 60 and over. After 2019 the lower band for under 60 moved between 5,294,000 and 5,663,000 and held around 5.5 million, while only the upper band, 60 and over, got thicker every year. In some years, such as 2021, the under-60 band grew, but it came back down. Total non-regular employment grew because the upper band grew.
About 76% of the rise among people 60 and over comes from a larger older population
The rise in non-regular workers aged 60 and over can itself be split in two: the part that comes from the 60-plus population getting bigger, and the part that comes from a higher rate of non-regular work within that age group. According to the September jobs report, the population aged 60 and over was 15,246,000, up 495,000, or 3.36%, in a year. Applying that growth rate to the 3,044,000 non-regular workers aged 60 and over in 2025 gives about 102,000. That much growth would have happened from population growth alone. The remaining 33,000 or so of the actual 135,000 rise is the part from a higher rate (author’s calculation).
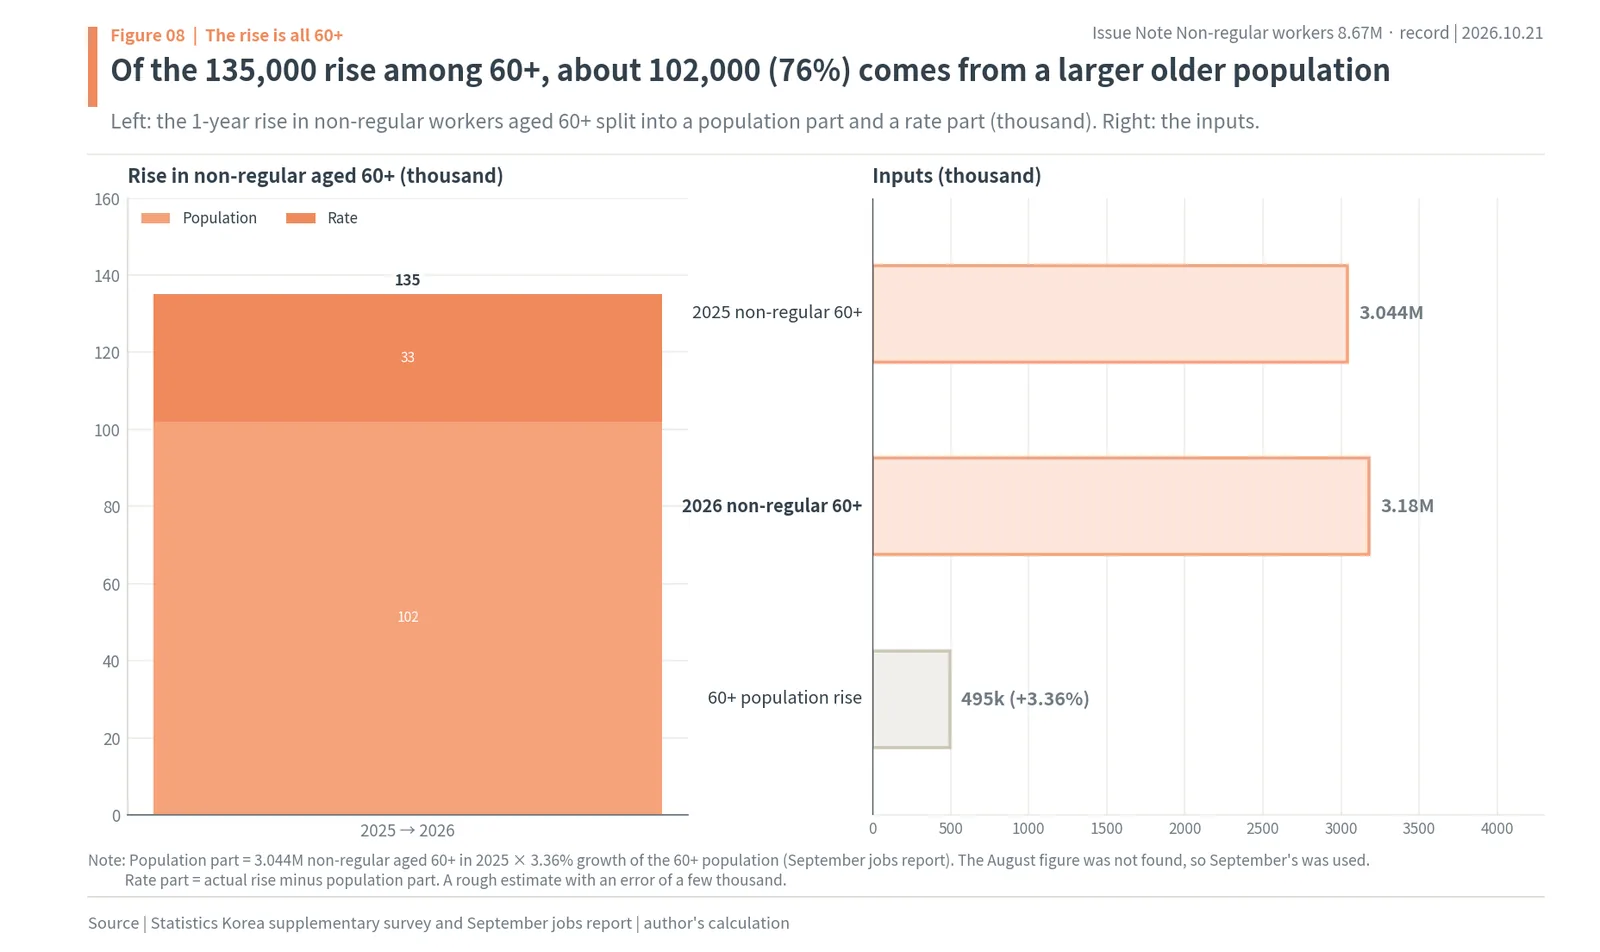
The chart stacks the 135,000 rise among people 60 and over as a population part of 102,000 and a rate part of 33,000. About 76% of the rise is explained by aging. This is a rough estimate that borrows September’s population growth for the August survey, so it may be off by a few thousand. The direction is still clear. The main current in non-regular growth is that there are more older people, and they keep looking for work after retirement.
Where, then, are these people working, and in what form? The next chapters split the numbers by education, occupation, industry and hours.
Non-regular work grew among college graduates and in service jobs, and seven in ten said they chose it
Splitting by other categories than age points the same way. Non-regular work grew more in service jobs than in manual labor, and more among college graduates than among those with less education. And 68.0% of non-regular workers said they chose that form of work themselves. That number would be hard to get if the only people added were those pushed out by worse jobs. At the same time, 73.9% of those who did not choose it said they needed income right away, which shows the two faces of non-regular work side by side.
By sex, male non-regular workers rose 57,000 to 3,708,000, and female non-regular workers rose 46,000 to 4,963,000. The female share fell 0.2pp to 57.2%. One might expect more care jobs to add mostly women, but this year the increase among men was slightly larger.
By education, non-regular workers with a college degree or more rose 132,000 to 3,439,000, now 39.7% of non-regular workers. High school graduates fell 12,000 and those with middle school or less fell 17,000. The 132,000 rise among college graduates is bigger than the total rise of 103,000. The author reads this as a generation with many college graduates crossing 60, which raises the education level of those doing non-regular work after retirement. In other words, the rise among college graduates is part of the same age story.
By occupation, elementary (manual) workers are the largest group, at 2,745,000, or 31.7% of non-regular workers. But the biggest one-year increase was among service workers, up 101,000 to 1.6 million; care and food service fall here. Professionals and related workers rose 29,000 to 1,478,000, while plant and machine operators and assemblers fell 44,000. Non-regular work in front of factory machines shrank, and non-regular work serving people grew.
Seven in ten chose it, most often because they were satisfied with the conditions
In this survey, 68.0% of non-regular workers said they had chosen their current form of work voluntarily, 0.2pp more than a year earlier. The most common reason was satisfaction with working conditions, at 59.9%, followed by job stability at 21.7%, changing jobs at 11.4%, and earning in line with effort or controlling their hours at 7.0%. Retired older people who chose a job of a few hours a day are part of this number.
The 32.0% who became non-regular involuntarily are in a different position. Of them, 73.9% said they needed income right away, meaning they had no time to look for the job they wanted. Average weekly hours for non-regular workers were 29.5, up 1.3 hours. That average hours rose even as more people worked short part-time hours can be read as a sign that some want to work longer.
To sum up, non-regular growth is not a single story. Older people who chose to work short hours after retirement grew in number, and so did people who took non-regular work because they needed money now. The first group drove the headcount, and the second did not shrink. Policy should aim at the second group, and at the young people waiting outside the door to regular jobs.
The new jobs were in care and part-time work, and non-regular jobs that are not part-time actually fell
The jobs that people 60 and over filled were mostly in health and social work, and mostly short-hours jobs. The 112,000 rise in non-regular jobs in health and social work is bigger than the 103,000 total rise, and the 152,000 rise in part-time work is also bigger than the total. Non-regular jobs that are not part-time fell by 50,000, from 4,339,000 to 4,289,000 (author’s calculation). Non-regular growth looks less like full-time jobs turning non-regular and more like new short-hours care jobs being created.
By industry, health and social work accounts for 1,867,000 non-regular workers, 21.5% of the total, up 112,000 in a year. Care workers for the elderly, home care and jobs in social welfare facilities belong here. Without this one industry, non-regular employment in all other industries fell by 9,000 (author’s calculation). Non-regular jobs in hotels and restaurants rose 43,000 to 856,000, and business facility management and support had 851,000. Information and communications fell 24,000 and public administration 22,000.

The left of the figure is the one-year change by industry; the single bar for health and social work is longer than the total rise. The right divides the 8,671,000 non-regular workers by industry, by area. Health and social work, hotels and restaurants, and facility management together hold 41.2% of non-regular workers (author’s calculation).
Hotels and restaurants are the long-standing center of part-time work. The kitchens and dining rooms of market alley restaurants, chain restaurants and lodging places add staff only at the hours when customers crowd in, so part-time and short contracts are common. In the September jobs report, employment in hotels and restaurants fell 97,000 in a year, yet non-regular employment in the same industry rose. Fewer people are working there, and a larger share of those who are work short hours.

Part-time work rose 152,000, and non-regular jobs that are not part-time fell 50,000
Splitting this year’s rise by hours makes the conclusion sharper. Part-time workers rose 152,000 to 4,382,000, 50.5% of non-regular workers. Subtracting part-time work from total non-regular employment gives 4,339,000 in 2025 and 4,289,000 in 2026, a fall of 50,000 (author’s calculation). Non-regular workers on full hours fell, and only those on short hours rose.

The left of the figure splits non-regular workers into part-time and not part-time from 2015 to 2026. The right is the number of people working 1 to 14 hours a week, which rose from 922,000 in 2016 to 2,029,000 in July 2026. The Korea Development Institute (KDI), a government think tank, found that hiring at under 15 hours a week can cut hourly labor costs by up to 40%, and named more government jobs for older people and the cost gap at the 15-hour line as causes of the rise in ultra-short-hours work.
Statistics Korea gave a similar explanation: part-time workers earn less because they work short hours rather than full time, and the rise in workers aged 60 and over and in health and welfare workers showed up in non-regular growth. In short, the added non-regular workers are older people working short hours in care and services. That picture links directly to the pay gap in a later chapter.
Older people want more work, and government senior jobs and care demand filled the gap
Two forces overlap in the jobs that older non-regular workers took. One is that more older people want to work. The other is the senior jobs the government creates with public money, plus the care demand of an aging society. Both create short, fixed-term jobs, so the more older people are employed, the higher the non-regular count goes.
In the August jobs report, employment among people aged 60 and over rose 191,000 in a year. But the employment rate for that group fell 0.3pp to 47.6%. More older people are working, but the older population grew even faster. In September, the number of people aged 60 and over who were “just resting” (neither working nor looking for work) rose 82,000. Older people who work and older people who rest are both increasing. Of the 191,000 rise in August employment among people 60 and over, the 135,000 rise in non-regular workers of that age is about 71% (author’s calculation; the employment figure includes the self-employed, so this is a simple comparison).
Government senior jobs are at a record 1,152,000
Senior jobs funded by the government reached a record 1,152,000 in 2026, up 54,000 from 1,098,000 in 2025, with a plan to raise them to 1,180,000 in 2027. The largest category, public-interest activities, has 709,000 places: 30 hours a month for 11 months at KRW 290,000 a month. The senior-skills category has 197,000 places at 60 hours a month for KRW 761,000 a month, and the employment and start-up category has 246,000. They are fixed in length and short in hours.
According to a Bank of Korea report from January 2026, participants in senior job programs rose about 3.7 times, from 270,000 in 2015 to 990,000 in the first three quarters of 2025. All publicly funded jobs together reached 2.08 million in 2025, 7.2% of employment and nearly double the 1.13 million of ten years earlier. The Bank of Korea estimated these public jobs lowered the unemployment rate by up to 0.2pp. Jobs created by the government make up a sizable part of the employment numbers.
Statistics Korea did not say where senior job participants were counted in this survey. Bin Hyun-joon, head of the agency’s social statistics bureau, said at the September jobs briefing that senior jobs and similar programs are often classified not only under public administration but also under health and welfare, and attributed the 207,000 rise in September health and welfare employment to more care services, more senior jobs and a larger population needing medical services. Given programs of 10 to 11 months and 30 to 60 hours a month, the author infers that many of these participants were counted as non-regular workers who are both fixed-term and part-time. Non-regular employment in public administration actually fell 22,000 in this survey, so the added jobs were more likely recorded under health and social work.
Care demand is real work created by aging
Care jobs outside government programs also rose. In the second half of 2025, care workers for the elderly and caregivers numbered 497,000, up 48,000 in a year. An aging society increases both the people who need care and the people who give it, and many caregivers are 60 or over themselves. Long-term care is mostly provided by private operators, but prices are fixed by government fee schedules, so even as jobs increase, pay stays near the minimum wage. Jang Ji-yeon, a senior research fellow at the Korea Labor Institute, has likewise noted that the government effectively sets the price of care jobs and that their pay is at minimum-wage level.
It is also hard for older workers to keep doing what they did before, which links to non-regular growth. According to Korea Labor Institute research, the share of people who move to a different industry or occupation from the one they had at 59, or leave work, rises from 30.1% at 61 to 52.8% at 64. Many people who reach the retirement age move not to their old job but to a new one, usually shorter and fixed-term. Even at large companies, an official at the Ministry of Employment and Labor said the rise in fixed-term and short-hours work partly reflects companies re-employing workers past the retirement age on fixed-term or short-hours contracts.
To sum up, the rise in older non-regular workers is less a number of failure than a picture of how an aging society shares out work. The issue is the quality of those jobs. Whether through re-employment or senior jobs, making sure that short-hours workers still build up social insurance and work history is a more immediate task for older people than the retirement-age number.
Much of the KRW 1.94 million pay gap is part-timers’ short hours, while the social insurance gap remains
The monthly pay gap between regular and non-regular workers reached KRW 1.94 million (about $1,460), the widest since the statistic began. But much of that gap is the result of part-timers working short hours. Excluding part-time workers, non-regular monthly pay is KRW 3.098 million, 76.5% of regular pay. By contrast, the gaps in National Pension, health insurance and employment insurance coverage and in severance pay are too large to be explained by hours.
Average monthly pay for June to August was KRW 4.052 million (about $3,050) for regular workers, passing KRW 4 million for the first time and up 4.0% from KRW 3.896 million a year earlier. Non-regular workers earned KRW 2.112 million (about $1,590), up 1.1% from KRW 2.088 million. The gap widened by KRW 132,000, from KRW 1.808 million a year earlier to KRW 1.94 million, and non-regular pay fell to 52.1% of regular pay from 53.6% a year earlier. The gap has grown nine years in a row since 2018 and is 1.58 times the KRW 1.229 million of 2015 (author’s calculation).

The left of the figure shows average monthly pay for regular and non-regular workers from 2015 to 2026, and the right shows the gap each year as bars. Both lines rise, but the regular line rises more steeply, and the bars got longer every year except 2017.
Excluding part-time workers, non-regular pay is 76.5% of regular pay
Splitting non-regular pay by type shows where the gap comes from. Part-time workers earn an average of KRW 1.146 million a month (about $860). Fixed-term workers earn KRW 2.199 million and atypical workers KRW 2.48 million. Non-regular workers excluding part-time earn KRW 3.098 million (about $2,330), KRW 954,000 less than regular workers, or 76.5% of regular pay. Half of non-regular workers are part-time and earn KRW 1.146 million a month, so the KRW 2.112 million average is pulled down by part-time pay.
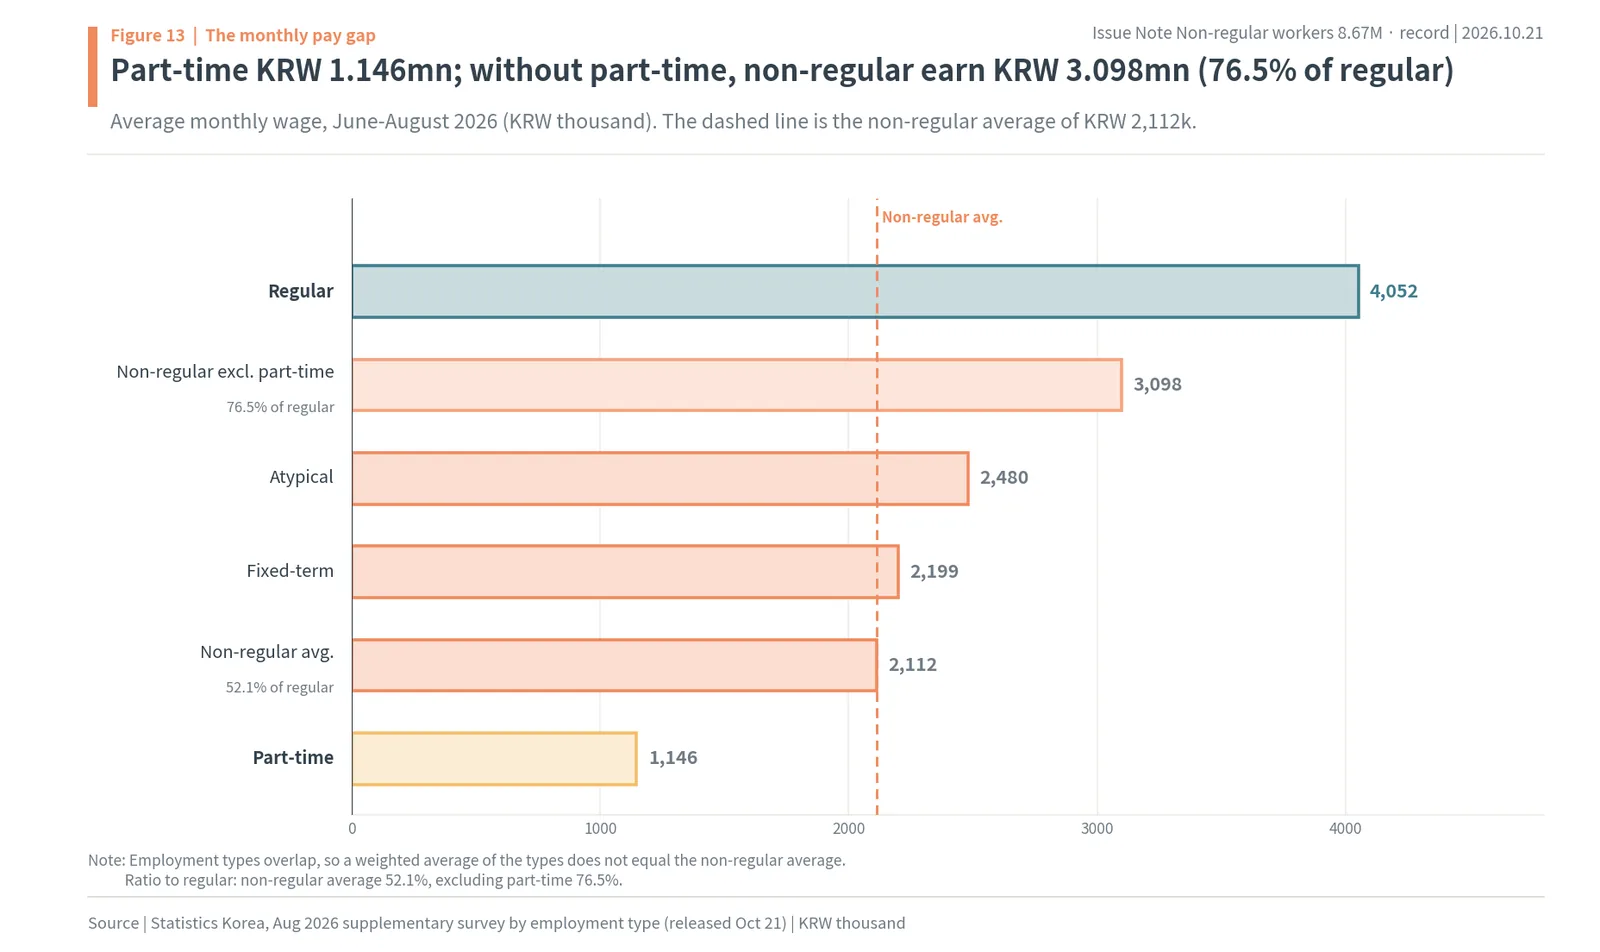
The figure puts average monthly pay for regular workers and each type of non-regular worker on one line. The part-time bar is unusually short, and non-regular workers excluding part-time reach three quarters of regular pay. Statistics Korea also noted that the pay figures do not adjust for days or hours worked, so more part-time workers lower the average. That does not mean there is no gap. Even among full-time workers there is a KRW 954,000 gap, and it widened again from KRW 859,000 in 2025 (author’s calculation).
National Pension coverage is 88.6% for regular workers and 36.5% for non-regular workers
The gaps that hours cannot explain are larger in social insurance and working conditions. National Pension coverage is 88.6% for regular workers and 36.5% for non-regular workers. Health insurance is 95.7% against 53.0%, and employment insurance 93.0% against 54.0%. The share receiving severance pay is 96.2% for regular workers and 45.7% for non-regular workers. Non-regular workers’ pension and health insurance coverage and severance eligibility all fell slightly this year.
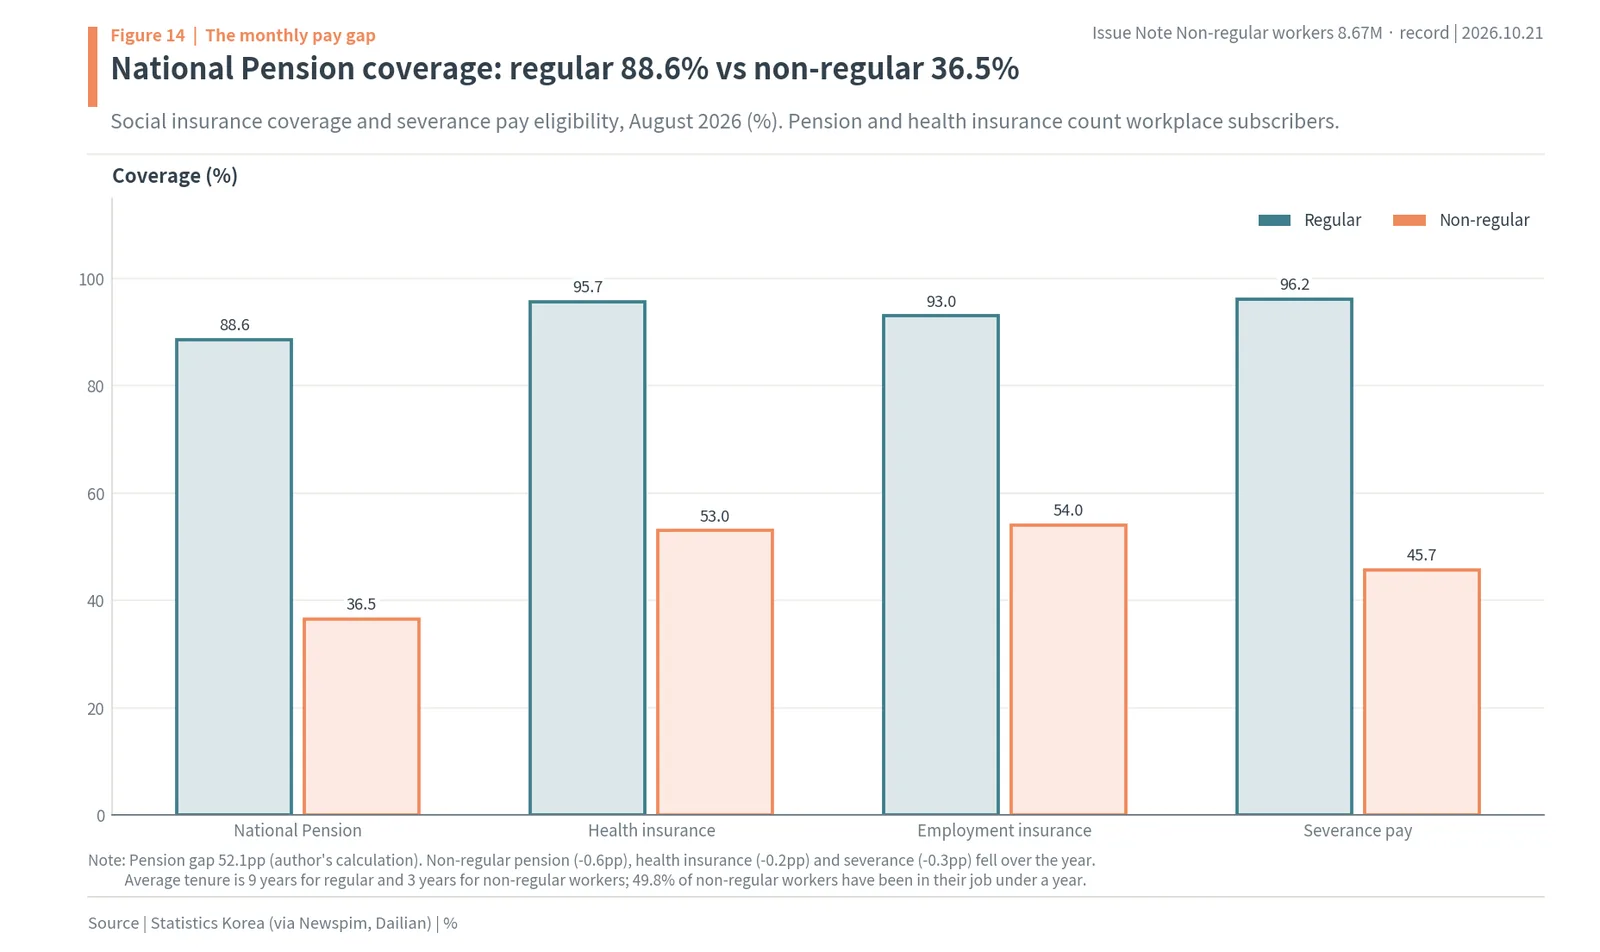
The figure sets regular and non-regular rates side by side for the four items. The National Pension gap, 52.1pp, is the largest (author’s calculation). Today’s pay gap becomes tomorrow’s pension gap. Average tenure is also 9 years for regular workers and 3 years for non-regular workers, and 49.8% of non-regular workers have been in their current job for less than a year.
To sum up, the KRW 1.94 million figure mixes in a large effect from the growing number of older people working short hours. The gap that remains after removing that effect, and the social insurance gap, show what being a non-regular worker actually means. So why did regular jobs barely grow?
The door to regular jobs has narrowed, squeezed by steep seniority pay and a retirement age companies cannot change
The number that really got worse in this release is not non-regular growth but regular growth. Regular jobs grew by 160,000 last year and by 10,000 this year. Over the same period youth employment fell for 47 months in a row, and new-graduate hiring at the four largest commercial banks fell 38.8% in three years. Seniority pay makes a regular job more expensive the longer the person stays, and since companies cannot set the leaving age, they hire fewer new regular workers and more fixed-term ones. This chapter connects those links with numbers.
The employment-type disclosure run by the Ministry of Employment and Labor shows the door narrowing inside companies too. As of March 2026, among direct employees at 4,205 companies with 300 or more workers, 1,412,000, or 28.3%, were on fixed-term contracts, the highest since the disclosure began. In 2021 it was 22.8%. Adding indirect employment brings it to 39.7%. Large companies are also shifting new hiring toward fixed-term contracts.
The road from fixed-term to regular work is narrow as well. At the end of 2024, 8.6% of fixed-term workers converted to regular jobs, and 5.8% at companies with 300 or more workers. In 2025, 86.3% of contract workers who lost employment insurance after completing two years of service left because their contracts expired. Korea’s Fixed-Term Workers Act requires employers to convert workers to open-ended contracts after two years, and contracts often end just before that point.
Youth employment fell for 47 months in a row, and bank new-graduate hiring fell 38.8%
When the door to regular jobs narrows, the first to be shut out are young people trying to get in for the first time. In the September jobs report, employment among people aged 15 to 29 fell 147,000, the 47th straight monthly fall, and the youth employment rate fell 1.1pp to 44.0%. The number of unemployed young people rose 14,700 to 193,700, and the broad youth unemployment rate was 15.6%. Young people who had been resting started looking for work but did not find it and were counted as unemployed. In the non-regular survey, too, those aged 29 and under fell 64,000, faster than the youth population fell.

The left of the figure is new-graduate hiring at the four largest commercial banks: 1,880 in 2023, 1,380 in 2024, 1,280 in 2025 and about 1,150 in 2026. The right shows the September youth numbers. Banks are a highly profitable industry, yet they hired fewer graduates. That reads less as a lack of money than as reluctance to take on the costs a new regular employee will generate over the next 30 years.
The four largest commercial banks’ hiring is one example. Across the economy, regular jobs grew by 160,000 in 2025 and by just 10,000 in 2026, while non-regular jobs grew by 110,000 and then 103,000. At companies with 300 or more workers, the fixed-term share rose from 22.8% in 2021 to 28.3% in 2026.
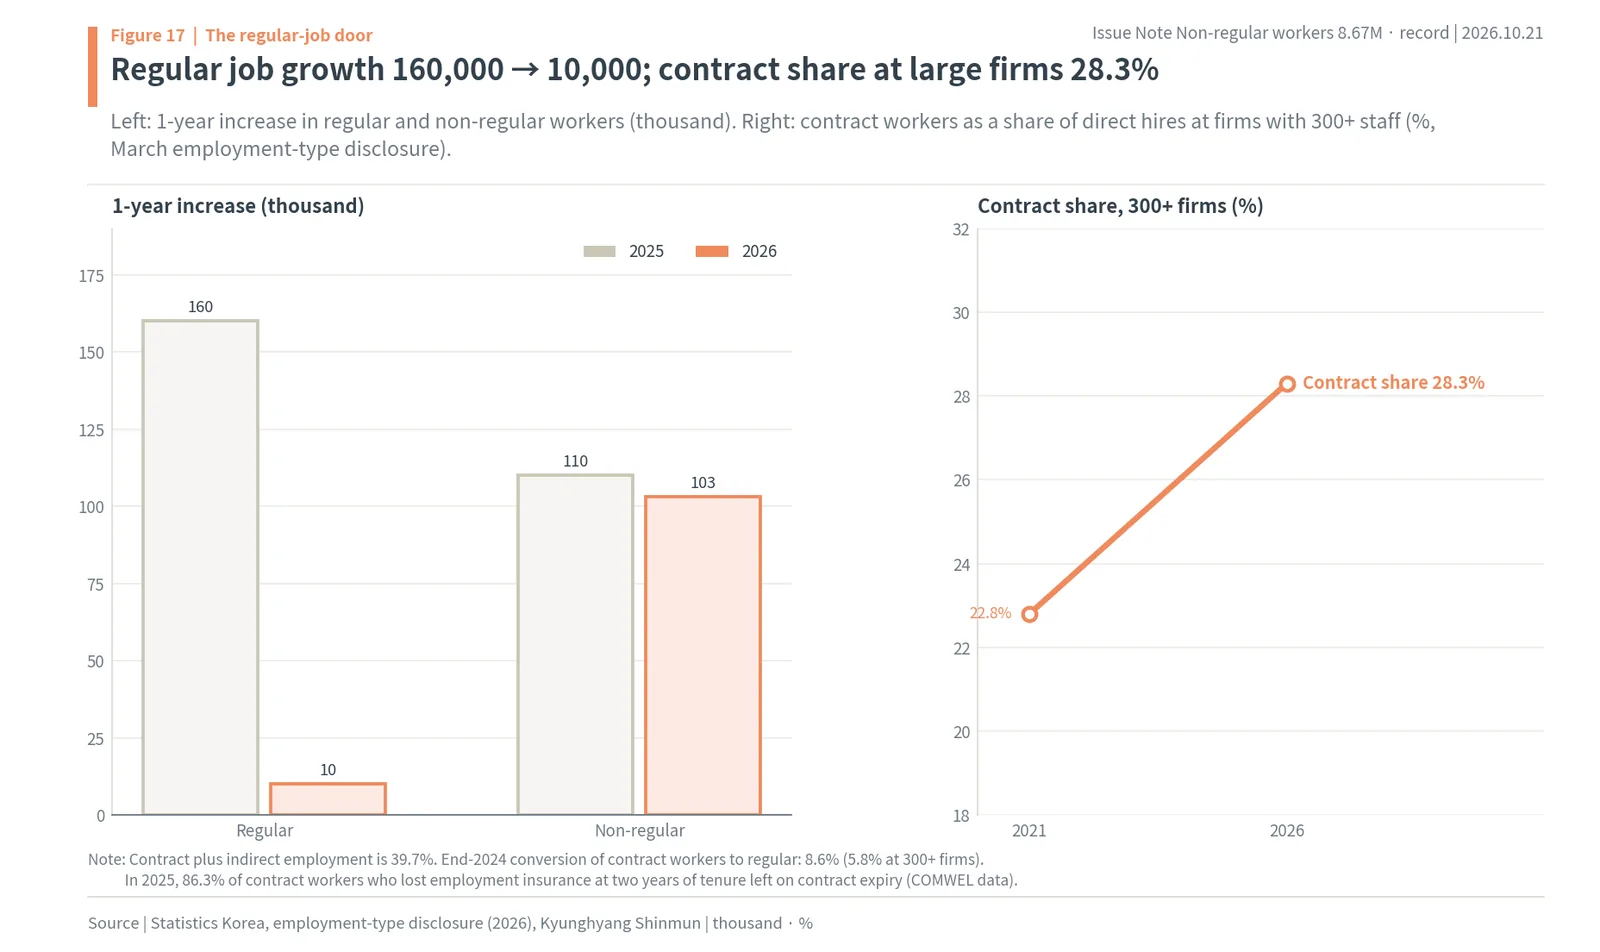
The left of the figure puts the one-year increase in regular and non-regular jobs for 2025 and 2026 side by side. Regular job growth falling from 160,000 to 10,000 is the biggest change in this release. The right shows the fixed-term share at companies with 300 or more workers rising from 22.8% in 2021 to 28.3% in 2026.
When 30-year pay is 2.95 times first-year pay, the retirement age is a cost
Why do companies hire fewer regular workers? Korea’s seniority pay is steeper than in other countries. Pay at 30 or more years of service relative to under one year is 2.95 times in Korea, 2.27 in Japan, 1.80 in Germany, 1.63 in France and 1.52 in the UK. Pay rises quickly the longer someone stays, and the leaving age is set by law. So the decision to hire one regular employee includes a promise to pay the highest salary during that person’s last years.
The Bank of Korea measured this link in actual data. Its April 2025 report on continued employment of older workers in a super-aged society estimated that after the mandatory retirement age of 60 took effect in 2016, each additional older worker meant 0.4 to 1.5 fewer young workers. Over the same period the youth wage employment rate fell 6.9%, or about 110,000 people, and the youth regular employment rate fell 3.3%, or about 40,000. A 2020 KDI analysis found a smaller effect: for each expected beneficiary of the later retirement age, older employment rose by about 0.6 and youth employment fell by about 0.2. Both studies point the same way. Raising the retirement age by law reduces youth employment.
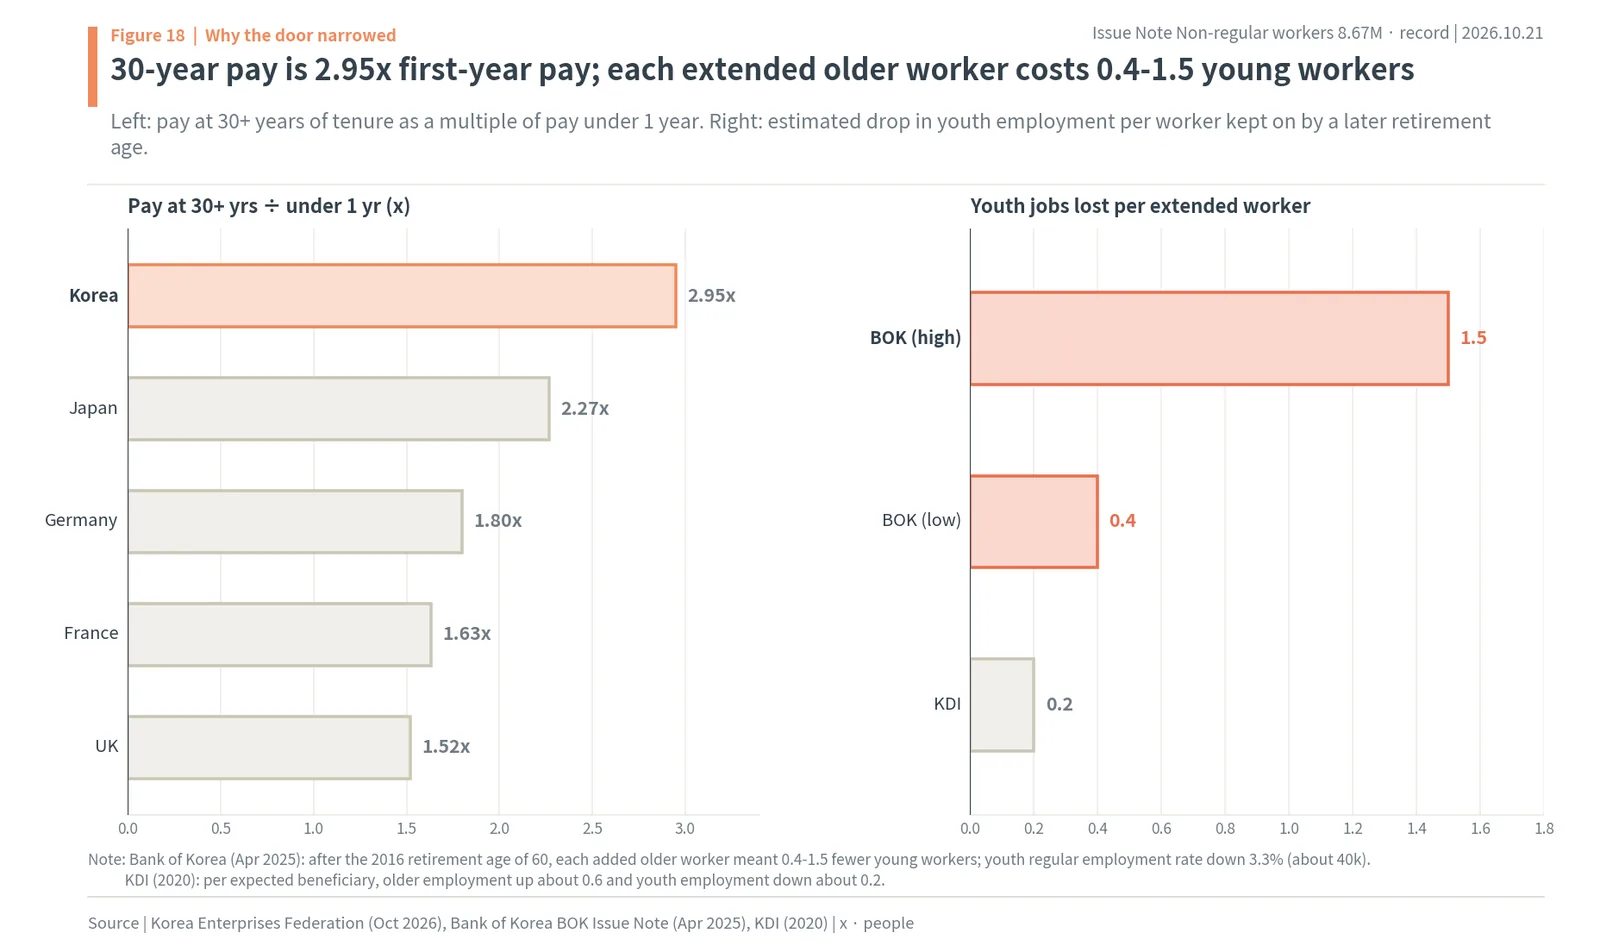
The left of the figure is the pay multiple at 30-plus years of service by country, and the right is the estimated fall in youth employment per worker kept on by the later retirement age (Bank of Korea 0.4 to 1.5, KDI 0.2). The steeper the seniority pay, the costlier a later retirement age, and that cost falls on those trying to get in. That is why a 2024 KDI report wrote that simply raising the retirement age extends the employment protection of regular workers under a seniority-based pay system.
This chapter has one conclusion. What narrows the door to regular jobs is a pay structure that gets more expensive the longer people stay, and a retirement age that companies cannot set. So would the statutory retirement age of 65 now before the National Assembly widen that door or narrow it further?
Young people moved from “resting” to “unable to find work,” and the jobs they found got shorter
Youth employment is the most worrying strand in this release. The economy is growing, yet jobs for young people are shrinking, and the jobs they get are getting shorter. There is a good sign, in that young people who had been resting have started looking for work again, but they were counted as unemployed because they did not find it. The narrow door to regular jobs shows most clearly in the youth numbers.
Korea’s 2026 economic numbers are not bad. Real GDP grew 3.8% in the first quarter and 3.7% in the second, and customs-cleared exports rose 52.9% in January to August. Yet in September, employment among people aged 15 to 29 fell 147,000, the 47th straight monthly fall, and the youth employment rate fell 1.1pp to 44.0%. In the first-quarter 2026 statistics on wage jobs, jobs held by people in their 20s and younger fell 76,000, or 2.6%. Growth driven by semiconductors and exports did not turn into jobs for young people.
Young people who had been resting started looking but did not find work
In September, young people “just resting” numbered 364,100, down 44,400 in a year. Fewer young people neither working nor looking for work is a welcome change. But in the same month the number of unemployed young people rose 14,700 to 193,700. Young people who had been resting went looking for jobs, did not get them and moved into unemployment. The broad youth unemployment rate, which also counts those who cannot work as much as they want, was 15.6%, more than double the overall 7.3%.
The government sees the same trend. An official at the Ministry of Finance and Economy said there are some early signs of improvement, with “resting” young people moving into school or training and then into job search and unemployment. The problem is the next step: the door from unemployment into a job. That door is regular hiring, and as the previous chapter showed, regular job growth was only 10,000.
The jobs young people get are getting shorter
Even when young people find work, the work is short. According to an analysis by the Korea Employment Information Service, in August 2026 16.0% of employed young people worked 1 to 17 hours a week, double the 7.9% of August 2016. Among young people working in hotels and restaurants, the share in ultra-short-hours jobs rose from 19.3% in 2016 to 41.4% in 2026. The doors open to young people are mostly short part-time ones.
Technological change adds to the fall in youth jobs. The Bank of Korea found that 285,000 youth jobs disappeared over the past four years, 94% of them in industries highly exposed to artificial intelligence. Machines have started to take over entry-level jobs such as office work and data processing. The 24,000 fall in non-regular jobs in information and communications in this survey fits the same trend.
To sum up, young people are regaining the will to work, but the door they need is narrow, and the doors that are open lead to short jobs. That is why this report judges the retirement-age debate not only from the side of older workers but by the width of the door into regular jobs for young people. The previous chapter concluded that seniority pay and the retirement age set that width.
Japan kept the retirement age at 60 and extended employment to 65 over 25 years
Japan is the most common comparison in the retirement-age debate. Japan aged before Korea, and like Korea it had strong seniority pay. The path Japan chose was not to raise the statutory retirement age but to keep it at 60 while requiring companies to keep employing people to 65, letting each company choose how. And it took 25 years to walk that path.
Japan made 60 the mandatory retirement age in 1998. It then changed the law in 2004 to require companies to keep older workers by choosing one of three options, re-employment, a later retirement age or abolishing the retirement age, effective from 2006. The required age rose in steps from 62 in 2006 to 65 in 2013, and from 2013 every worker who wants it must be re-employed. The transition measures ended and the rule applied in full only in 2025. The KEF summed up the process as taking 25 years.
Companies overwhelmingly chose re-employment. As of June 2024, 99.9% of Japanese companies with 21 or more employees had secured employment to 65; 67.4% did so through re-employment, 28.7% through a later retirement age and 3.9% by abolishing the retirement age. At companies with 301 or more employees, re-employment was 79.4%. In a 2010 survey, re-employment pay was 68.4% of pay just before retirement, and the Japanese government runs a continued-employment benefit for older workers that adds 10% of pay up to age 65 when pay falls below 75% of pre-60 pay. Pay is cut to match the job, and the state fills part of the cut.
In Japan, young people were hurt first too
Japan’s path was not smooth from the start. In the 1990s, protection for older workers combined with a recession to sharply cut youth hiring. The employment rate of Japanese university graduates fell from 81.3% in 1991 to about 55% in 2003, and the non-regular share of workers aged 15 to 24 rose from 20.5% in 1990 to 47.7% in 2005: the so-called employment ice age generation. That experience is part of why Japan put re-employment, rather than a later retirement age itself, at the center.
Korea is still at the entrance to that road. According to the Bank of Korea report, 8.25% of Korean businesses have adopted a re-employment system. The same report estimated that keeping people working to 65 could raise growth by 0.9 to 1.4pp over the next ten years, and that without it the labor supply would shrink by 1.41 million over ten years. Both sides agree that older people need to work longer. The dispute is over the method: a statutory retirement age, or re-employment.
The Japanese case gives this report’s view two supports. First, raising the statutory retirement age is not the only way to increase older employment, and in practice re-employment was used most. Second, in a country with strong seniority pay, rushing to protect older workers sends the cost to young people first. Korea’s 30-year pay multiple of 2.95 is steeper than Japan’s 2.27.
The author’s view: mandatory re-employment after 60 and seniority-pay reform should come before a blanket rise in the retirement age
This chapter sets out the arguments on both sides in their own words and gives the author’s view, which is this. The fact that the rise in non-regular work came entirely from people 60 and over means jobs for older people are already growing. What is blocked is the door into regular jobs for the young. So rather than raising the statutory retirement age across the board to 65 and extending the employment protection of regular jobs, Korea should make re-employment after 60 mandatory and reform seniority pay first. That protects both older people’s work and young people’s door.
The Democratic Party plan reaches 65 in 2037, the employers’ plan in 2042
The bill before the National Assembly to raise the statutory retirement age centers on a plan by the ruling Democratic Party’s special committee on extending the retirement age. Its compromise plan uses 2027 as a preparation year, makes re-employment to 61 mandatory in 2028, and raises the statutory retirement age to 61 in 2029. After that the age rises one year every two years, reaching 65 in 2037. The mandatory re-employment age moves a step ahead: 62 in 2029, 63 in 2031, 64 in 2033 and 65 in 2035. Minister of Employment and Labor Kim Young-hoon told a parliamentary audit on October 13 that he believes the retirement-age extension should be passed this year and that the government would present its own bill soon.
The employers’ plan moves at a different speed. Lee Sang-cheol, head of employment and social policy at the KEF, said the business community’s position is still to raise the age by one year every three years from 2030 and reach 65 in 2042, with re-employment after retirement filling the years in between. The KEF cites Japan, which kept the retirement age at 60, required continued employment to 62 from 2006 and to 65 from 2013, and let companies choose among re-employment, a later retirement age and abolishing it. Since 2013, every worker who wants it must be re-employed.

The chart draws the statutory retirement age under the two plans as steps. The Democratic Party plan (teal) starts at 61 in 2029 and reaches 65 in 2037, with mandatory re-employment (dashed) one step ahead. The employers’ plan (coral) starts at 61 in 2030, rises every three years and reaches 65 in 2042. The difference between the two is five years in reaching 65, and whether the years in between are filled by a retirement age or by re-employment.
The case for: the income gap before the pension, and fear of “cheap older labor”
Those who want to raise the statutory retirement age quickly have numbers too. The Korean Confederation of Trade Unions (KCTU) criticized the plan to finish in 2037 for leaving hundreds of thousands of workers without income for years. Someone born in 1966 would face a three-year gap even if the retirement age became 61 in 2029, because the National Pension starts paying at 64. The Federation of Korean Trade Unions (FKTU) worries that re-employment could lead to cheap older labor marked by repeated pay cuts and job insecurity. In this release, most non-regular workers aged 60 and over were short-hours part-timers, and non-regular workers’ pension coverage was 36.5%, which shows this worry is not baseless.
The case against fits this release’s numbers better
The author takes the re-employment side because the numbers in this release fit it better. First, jobs for older people are already growing. Non-regular workers aged 60 and over rose 135,000 in a year, and about 76% of that came from population growth. What older people need is not a legal extension of the same job but better conditions and social insurance in the jobs that are already growing. Second, what is blocked is new regular hiring. Regular job growth fell from 160,000 to 10,000, and youth employment fell for 47 months in a row. Third, both the Bank of Korea and KDI estimate that youth employment fell after the retirement age was raised by law. With seniority pay as steep as 2.95 times, a blanket extension raises that cost further.
The OECD’s 2024 Economic Survey of Korea also noted that abolishing the statutory retirement age without reforming the seniority-based wage system would only widen the gap between workers’ pay and their productivity. Whether the retirement age is abolished or raised, the same problem remains if the pay system does not change. The solution the Bank of Korea report offered was also re-employment after retirement. Re-employment keeps older people working while letting their pay be reset to the value of the work.
Korea’s high reliance on temporary contracts shows in international data too. On the OECD definition, temporary workers made up 27.5% of wage workers in Korea in 2025, above the Netherlands at 25.8%, Japan at 14.2%, Canada at 11.8%, Germany at 11.5% and the UK at 5.1%.
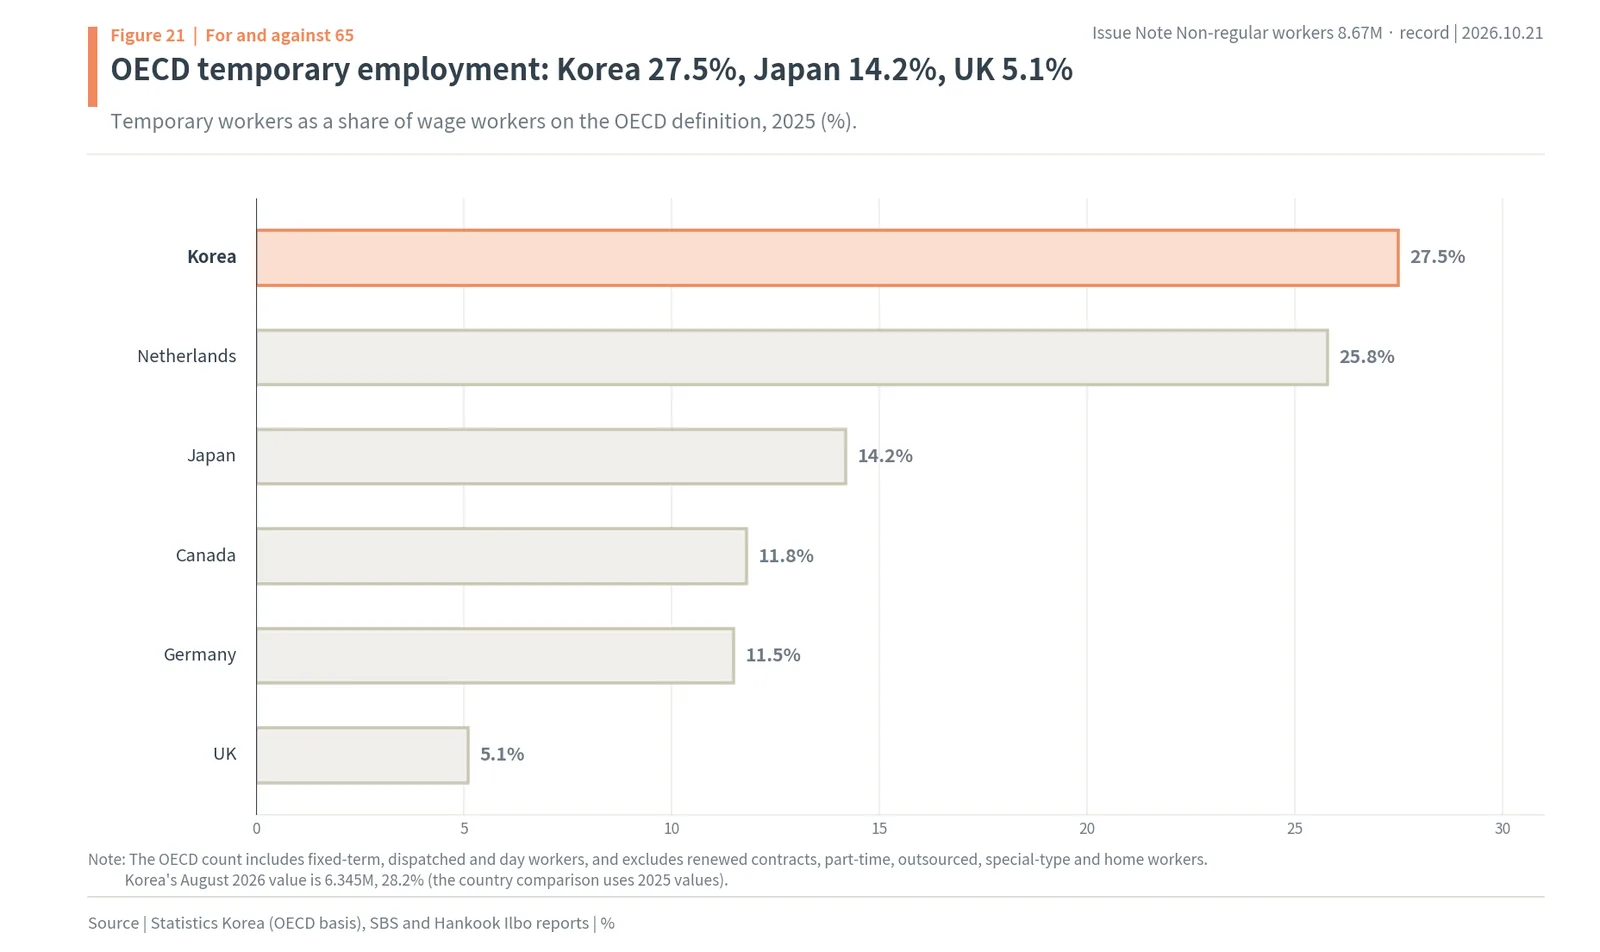
Korea’s high temporary share should be read together with a system in which, once a regular worker is hired, the cost is set by age and tenure. The more the cost of a regular worker is set by the job, the less reason companies have to hire on fixed terms from the start.
To sum up, rather than raising the statutory retirement age across the board to 65, the author believes the first steps should be mandatory re-employment after 60 and a shift from seniority pay toward pay based on the job and performance. So that re-employment does not become cheap older labor, it must come with rules that keep re-employed workers in the National Pension and employment insurance. The labor ministry’s roadmap for equal pay for work of equal value, due in December, could be the starting point for that pay reform.
The same day, parliament’s fight was over four-year contracts, and the fix for the two-year cliff is the cost structure, not the term
On the day the non-regular figures came out, the biggest labor fight in the National Assembly was not the retirement age but the labor exemptions in a bill on super-regional special zones, which would let companies in those zones use fixed-term workers for up to four years instead of two. The author reads this debate through the same lens. Changing the cost structure that sets a regular worker’s price by tenure and age will widen the door to regular jobs more than lengthening or shortening the term.
The bill, introduced on October 20 by Democratic Party lawmaker Park Sang-hyuk, would let companies in the zones extend fixed-term contracts to up to four years with the worker’s written consent. If the contract ends without conversion to an open-ended contract, the employer would pay a “fairness allowance,” and research, management and professional workers in the top 3% of earned income would be exempt from working-hours rules. The next day lawmaker Choi Ki-sang introduced a bill with the same name but without the labor exemptions, and the two will be reviewed together. Democratic Party leader Kim Min-seok named the bill the top legislative priority of the regular session.
Reactions were split. Six major business groups called the labor exemptions an essential element for competing in global industry. The FKTU said attempts to loosen working-hours rules and expand non-regular work in the name of regional growth and advanced industries can never be justified. Kwon Hyuk, a professor at Korea University’s graduate school of labor studies, noted that it is hard to confirm whether an individual written agreement reflects the worker’s true wishes.
The two-year cliff: 86.3% of contract workers left at the two-year mark when their contracts expired
Behind the four-year debate is the two-year cliff. The Fixed-Term Workers Act requires conversion to an open-ended contract after two years. Yet in 2025, 86.3% of contract workers who lost employment insurance after two years of service left because their contracts expired. At the end of 2024, 8.6% of fixed-term workers converted to regular jobs, and 5.8% at companies with 300 or more workers. Replacing people just before two years is common.
Stretching two years to four could lengthen how long one person stays in one workplace. But if companies end contracts at the two-year mark because of what open-ended contracts cost afterward, namely pay that rises with tenure and a leaving age they cannot change, the cliff simply moves to four years. If instead regular pay is set by the value of the work rather than by tenure, companies have less reason to avoid open-ended contracts. That is why the author looks at the cost structure before the term.
Hourly pay tells the same story. According to the Ministry of Employment and Labor’s survey of working conditions by employment type, in 2025 hourly pay was KRW 28,599 for regular workers and KRW 18,635 for non-regular workers. With regular pay at 100, non-regular pay was 65.2, the widest gap in 11 years. That the gap is so large even after removing differences in hours means the shape of the contract still sets the price of the same hour of work.
Seven months into the “Yellow Envelope Act,” subcontractor bargaining has only just begun
For indirect employment such as dispatched and outsourced work, the revised Trade Union Act that took effect on March 10, 2026, the so-called “Yellow Envelope Act,” applies. It requires a prime contractor that effectively sets the working conditions of subcontractor workers to bargain with them. Since it took effect, the Korean Public Service and Transport Workers’ Union has asked 70 prime contractors to bargain, but only 18 came to the table and none has reached an agreement. On October 22-23, 6,500 subcontractor workers at Busan Metro, Incheon Airport and elsewhere plan a joint strike. The link between this law and the 82,000 fall in outsourced service workers in this survey cannot yet be separated in the numbers, but it can be read as the start of a shift of indirect employment costs to prime contractors.
To sum up, deciding how many years a fixed-term contract may last does not change the width of the door to regular jobs. What sets that width is the cost structure of one regular worker, and that is where the retirement-age debate and the fixed-term debate meet.
Common questions: five things that are easy to misread in these numbers
This chapter answers five common questions about this release with the numbers in this report. There are no new claims; it regroups the earlier numbers as questions.
The first question is whether record non-regular employment means jobs got worse. This report’s answer is mostly no. The 135,000 rise among people 60 and over is larger than the total rise of 103,000, and the under-60 group fell by 32,000. Since 2019, non-regular employment under 60 has barely moved, from 5,543,000 to 5,491,000. If any numbers got worse, they are regular job growth of 10,000 and the fall in youth employment.
The second question is why non-regular employment jumped in 2019. That year a parallel survey was added and picked up 350,000 to 500,000 contract workers who had not been counted before (the statistics office’s estimate). So linking years before 2018 directly with 2019 and after makes non-regular work look as if it grew faster than it did. That is why this report’s long comparisons start in 2019.
The third question is why Korea’s number in OECD comparisons differs from the 38.5% non-regular share. On the OECD definition, temporary workers include only people with a set employment period, such as fixed-term, dispatched and day workers, and exclude those on repeatedly renewed contracts, part-time, outsourced, special-type and home workers. So Korea had 6,345,000 temporary workers in August 2026, 28.2% of wage workers. The comparable 2025 value is 27.5%, above the Netherlands at 25.8% and nearly double Japan’s 14.2%.
The fourth question is whether the KRW 1.94 million gap is the difference for doing the same job. It is not. It is the difference in average monthly pay for June to August and does not adjust for hours. Half of non-regular workers are part-time, and part-timers earn KRW 1.146 million a month on average, which pulls the average down a lot. Excluding part-time workers, the gap is KRW 954,000, and on an hourly basis non-regular pay is 65.2% of regular pay (2025 survey of working conditions by employment type). A gap remains even for the same hours worked.
The fifth question is whether re-employment is just a way to cut pay. A re-employment contract can pay less than before retirement, which is why unions worry about cheap older labor. This report’s view does not dismiss that worry. Its point is that if older people are to work longer without passing the cost on as fewer jobs for the young, pay needs to match the value of the work. In return, re-employment contracts must keep people in the National Pension and employment insurance and lift today’s 36.5% pension coverage for non-regular workers.
For stock investors the places to watch are convenience stores and food service, which use many part-timers, and the key dates fall at year-end
The non-regular figures do not move share prices by themselves. But the changes this release shows, more part-time and older workers, a rising minimum wage and a retirement-age bill heading for a decision this year, reach the costs of labor-intensive industries. The author sees the most direct link in convenience stores and contract food service. This chapter lays out those companies’ numbers and the dates to check. This is not a recommendation to buy or sell any stock; it shows where this issue lands.
The 2027 minimum wage is KRW 10,700 an hour (about $8.06), up KRW 380, or 3.7%, from KRW 10,320 in 2026, effective January 1, 2027. The more part-timers an industry uses, the more directly those KRW 380 become cost. Convenience stores are structured a little differently: the wages of part-timers in the stores are paid by franchisees, not head office. So a higher minimum wage reaches franchisees’ income and store counts before it reaches head-office profits. In 2025 the number of convenience stores in Korea fell by 1,586 to 53,266, the first decline in 36 years.

Head-office staff alone show differences. At GS Retail, 2,121 of 7,218 employees, or 29.4%, worked short hours as of June 2026. At Hyundai Green Food it was 1,083 of 6,753, or 16.0%, and at BGF Retail 385 of 3,170, or 12.1% (author’s calculation). Dividing total payroll by 2025 sales gives 13.0% for Hyundai Green Food, 8.6% for CJ Freshway, 3.1% for GS Retail and 2.0% for BGF Retail (author’s calculation; a rough figure that divides parent-only payroll by consolidated sales). Contract food service companies have a high ratio of labor costs to sales, which makes them more sensitive to the minimum wage and to changes in how older workers are paid.

The left of the figure is the share of sales going to payroll, the middle is the share of short-hours staff, and the right is market capitalization on October 21. Market caps are KRW 2,314.3bn (about $1.74bn) for BGF Retail, KRW 1,805.9bn (about $1.36bn) for GS Retail, KRW 639.7bn for Hyundai Green Food and KRW 261.2bn for CJ Freshway. By 2025 operating profit, BGF Retail made KRW 253.9bn, GS Retail KRW 292.1bn, Hyundai Green Food KRW 106.8bn and CJ Freshway KRW 101.7bn. Kiwoom Securities expects CJ Freshway’s third-quarter operating profit to be KRW 23.7bn, down 29.5% from a year earlier.
On the care side, it is hard to find a listed company that is purely a care operator. Education company Daekyo’s senior brand Newif had 2025 sales of KRW 26.6bn, up 125.4% in a year, but it is still a small part of the company.
The two convenience store stocks rose a little over half as much as the KOSPI in a year
On October 21, KRX closes were KRW 133,900 (about $101) for BGF Retail and KRW 21,600 (about $16.3) for GS Retail, and the KOSPI, the Korea Exchange’s main stock index, closed at 5,735.66. Over the past year BGF Retail rose 27.6% and GS Retail 28.4%, while the KOSPI rose 50.0%. In a market led by semiconductors, domestic retail stocks lagged. On Korea Exchange prices, the two companies also fell less than the KOSPI’s 18.2% drop over the past month.


The chart shows prices indexed to 100 a year ago. The KOSPI line rose as high as 231.8 during the semiconductor rally, then came down quickly to 150.0. The two convenience store stocks moved between about 100 and 168.8 and now sit at 127.6 and 128.4 (author’s calculation).
Eight signals the author watches
The author follows where this issue goes through eight numbers: ① regular job growth of 10,000, ② a change in youth employment of -147,000, ③ a 135,000 rise in non-regular workers aged 60 and over, ④ a part-time share of 50.5%, ⑤ non-regular pay at 52.1% of regular pay, ⑥ non-regular pension coverage of 36.5%, ⑦ a 2027 minimum wage rise of 3.7%, and ⑧ a retirement-age bill still at the party-plan stage.
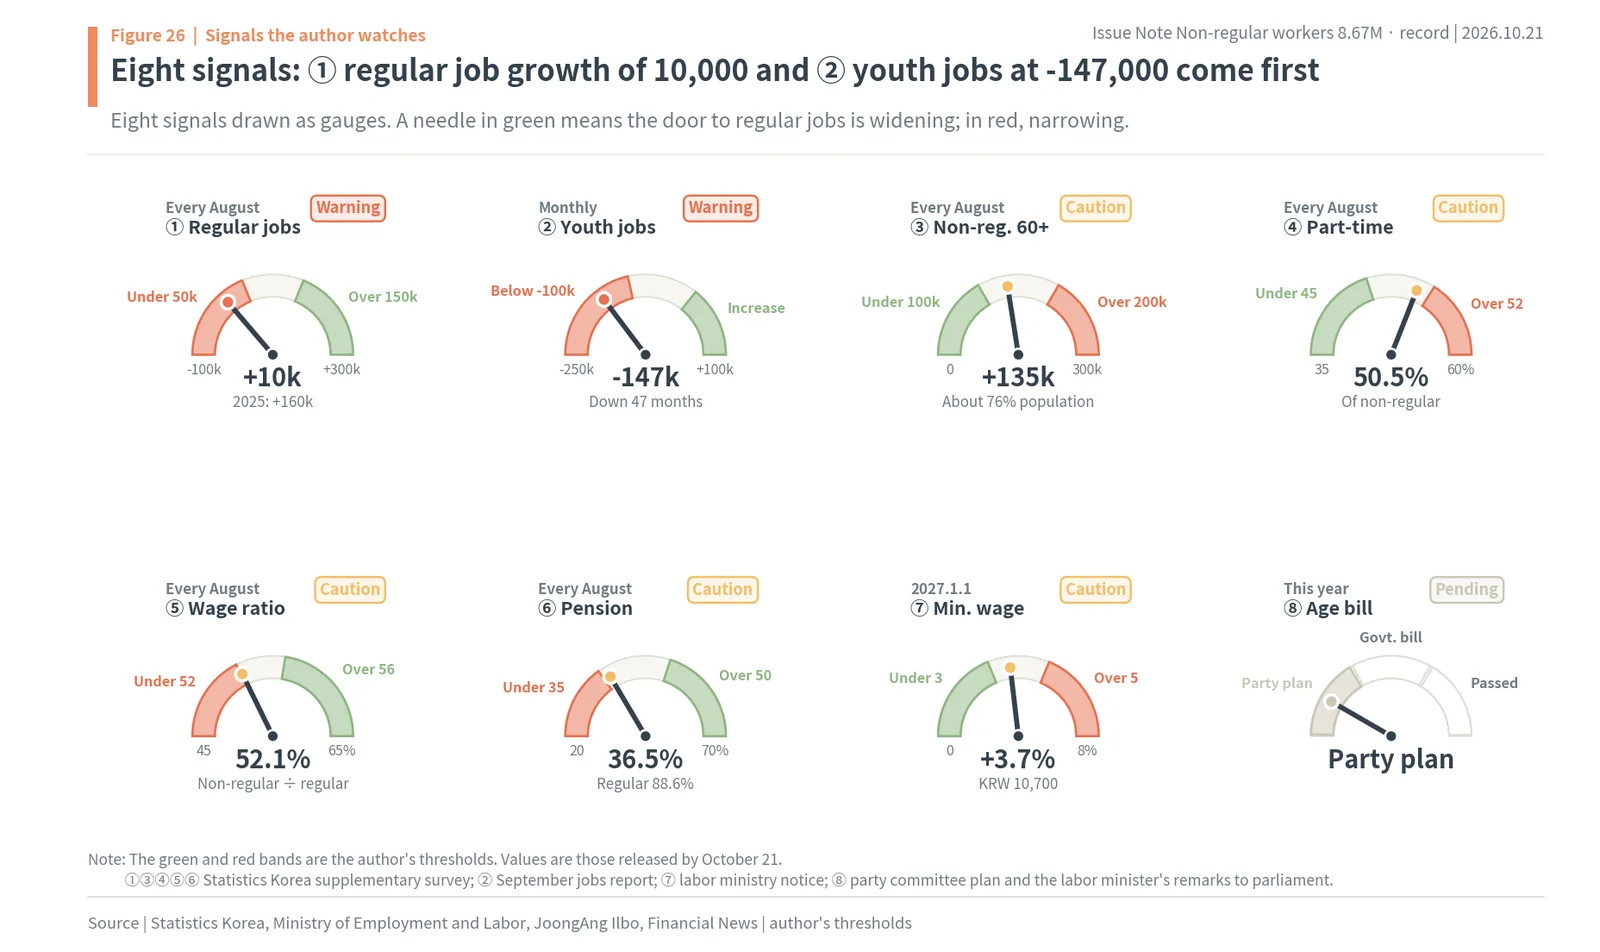
On the gauges, green means the door to regular jobs is widening and red means it is narrowing. Right now ① and ② sit near red. Whether regular job growth and youth employment turn around is the first signal to watch.
Dates to watch
On October 22-23, 6,500 subcontractor workers at Busan Metro, Incheon Airport and elsewhere plan a joint strike, and on October 24 the public service and transport union holds a mass rally. On October 27 parliament holds its final audit of the labor ministry and the Economic, Social and Labor Council. In late October, the long-term care committee sets 2027 long-term care fees. In early November, BGF Retail and GS Retail are due to report third-quarter results (estimated from last year’s November 6), and the October jobs report comes out in mid-November (estimated). In December the labor ministry’s equal-pay roadmap is due, and the labor minister has said the retirement-age bill should pass this year. On January 1, 2027, the minimum wage of KRW 10,700 takes effect.

Convenience store costs reach franchisees first
What moves before convenience store head-office numbers is franchisees’ income. According to one franchisee YouTuber’s calculation reported by Newsis, a store selling about KRW 1.76 million a day that uses part-timers 14 hours a day at the 2027 minimum wage pays KRW 4.47 million a month in labor costs, leaving the owner about KRW 2.38 million (about $1,790), or about KRW 7,620 an hour for the owner’s own time. That is why owners work more hours themselves and cut part-timers’ hours. Self-employed people with employees fell from 1,587,000 in July 2017 to 1,499,000 in July 2026, while those without employees rose from 4,144,000 to 4,308,000. Business closures by the self-employed in the first half of 2026 numbered 624,000, up 14.7% from a year earlier.
For head office, this comes back as store counts. That store numbers fell for the first time in 2025 means the sales threshold a franchisee needs to survive has gone up. So the author reads the meaning of a KRW 10,700 minimum wage for convenience stores first in store openings and closures and in sales per store, rather than in head-office earnings. That is the reason to look at both companies’ store counts and same-store sales growth together in the third-quarter results in early November.
Basis of calculation: the 2019 break, the under-60 figures and the population effect
This chapter states where the numbers in this report come from, chapter by chapter. As a rule, each item uses a single source.
All 2026 figures are from Statistics Korea’s August 2026 supplementary survey by employment type, released on October 21. The original release file was not opened; the report uses the version republished on the government’s policy briefing site and the identical values carried by Edaily, Hankook Ilbo, the Korea Economic Daily, Money Today, CBS NoCut News, SBS, Newspim and other outlets. Where outlets phrased things differently, the version with consistent numbers was chosen. For example, outlets differed on how many years in a row the pay gap had widened; since the 2017 gap of KRW 1.278 million was smaller than the 2016 gap of KRW 1.301 million, this report says nine straight years from 2018.
The 2015-2025 series is the current value in e-Narajipyo’s non-regular employment indicator. The 2015 and 2016 values differ slightly from those first published (2015: 6,271,000 → 6,308,000), and this report uses the current values throughout. Because 2019 is the year the parallel survey began capturing more contract workers, changes are not compared directly with 2018 and earlier, and long comparisons start in 2019. For the 2024 value of non-regular workers aged 60 and over, the e-Narajipyo age table did not add up to the total, so this report uses 2,811,000: the 2025 value of 3,044,000 minus that year’s increase of 233,000.
Non-regular employment under 60 is total non-regular employment minus the 60-plus group: 7,481,000 – 1,938,000 = 5,543,000 in 2019, and 8,671,000 – 3,180,000 = 5,491,000 in 2026. For the one-year change, 103,000 – 135,000 = -32,000. Adding up the published changes by age group gives 101,000, 2,000 different from the published total, because of rounding.
The population effect is the September jobs report’s 3.36% growth in the population aged 60 and over (15,246,000, up 495,000 in a year) multiplied by the 3,044,000 non-regular workers aged 60 and over in 2025, about 102,000. The August population figure could not be found in news reports, so September’s was borrowed. The remaining 33,000 is treated as the rate effect, and the population share is 102,000 ÷ 135,000 = about 76%.
Non-regular employment that is not part-time is non-regular employment minus part-time: 8,568,000 – 4,229,000 = 4,339,000 in 2025, and 8,671,000 – 4,382,000 = 4,289,000 in 2026, a fall of 50,000. The change in non-regular employment excluding health and social work is 103,000 – 112,000 = -9,000. The three industries (health and social work 1,867,000, hotels and restaurants 856,000, facility management 851,000) hold 41.2% of non-regular workers.
Pay is the June-August monthly average and does not adjust for hours. The 2025 gap excluding part-time workers, KRW 859,000, is regular pay of KRW 3.896 million minus non-regular pay excluding part-time of KRW 3.037 million (News1 report, 2025). In the hypothetical example, the new-hire salary of KRW 40 million and the 60% wage peak are the author’s assumptions; only the 2.95 multiple is from the KEF report.
Company figures are from Naver Finance and WISEreport company overviews (employee data from annual reports, parent-only). Payroll ÷ sales is a rough figure dividing parent-only payroll by consolidated sales. Share prices and market caps are October 21 closes from the KRX Data System, and one-year returns compare with closes on October 21, 2025. Earnings dates and the date of the October jobs report had not been announced, so they are estimated from last year’s schedule.
The OECD comparison uses a different definition from the non-regular share. OECD temporary workers include people with a set employment period, such as fixed-term, dispatched and day workers, and exclude repeatedly renewed contracts, part-time, outsourced, special-type and home workers. So Korea’s 38.5% non-regular share and 28.2% OECD temporary share count the same people in different ways. The country comparison uses 2025 values, when all countries are available (Korea 27.5%), and does not compare Korea’s August 2026 value (28.2%) directly with other countries’ 2025 values.
The hourly pay ratio of 65.2 comes not from this supplementary survey but from the Ministry of Employment and Labor’s 2025 survey of working conditions by employment type. It surveys businesses rather than households, so its scope and method differ. The two surveys are not combined into one ratio; it is used only to show that a gap remains after hours are removed.
The yearly increases among people 60 and over (270,000 in 2021, 151,000 in 2022, 66,000 in 2023, 233,000 in 2025) are the values reported in the release coverage of each year. Calculated from differences in e-Narajipyo’s current values, they may differ by a few thousand because of revisions. The 1,152,000 senior jobs is the number of program places, and the Bank of Korea’s 270,000 in 2015 and 990,000 in 2025 are monthly average participants, so the two are not spliced together. That senior job participants are counted as fixed-term and part-time non-regular workers in the supplementary survey was not confirmed by Statistics Korea; it is the author’s inference from the length and hours of the programs.
Maochaedung’s take. What grew is age; what closed is the door to regular jobs. Non-regular employment of 8,671,000 is a record, but the 135,000 rise among people 60 and over is larger than the 103,000 total rise, and since 2019 non-regular employment under 60 has stayed flat, from 5,543,000 to 5,491,000. The new jobs were in health and social work and part-time work, and about 76% of the rise among people 60 and over comes from a larger older population. What actually shrank was regular job growth (160,000 → 10,000) and youth employment (down 47 months in a row), and the door is narrowed by seniority pay in which a 30-year employee earns 2.95 times a first-year one, and by a retirement age companies cannot set. Rather than raising the statutory retirement age across the board to 65, the author believes making re-employment after 60 mandatory and reforming seniority pay first is how Korea can protect both older people’s work and young people’s door into regular jobs.
Korea’s record non-regular employment: quick answers
Q. How many non-regular workers does Korea have in 2026?
Statistics Korea counted 8,671,000 non-regular workers in August 2026, up 103,000 from a year earlier and 38.5% of the 22,526,000 wage workers. Both the number and the share are the highest since the survey began in 2003.
Q. Does record non-regular employment mean Korean jobs got worse?
Mostly no. Non-regular workers aged 60 and over rose 135,000, more than the 103,000 total rise, and those under 60 fell 32,000. Since 2019 the under-60 count has barely moved, from 5,543,000 to 5,491,000. About 76% of the 60-plus rise comes from a larger older population. The numbers that did get worse are regular job growth, which fell from 160,000 to 10,000, and youth employment, down 47 months in a row.
Q. How big is the pay gap between regular and non-regular workers in Korea?
Average monthly pay for June to August 2026 was KRW 4.052 million for regular workers and KRW 2.112 million for non-regular workers, a gap of KRW 1.94 million (about $1,460). Excluding part-time workers, non-regular pay is KRW 3.098 million, 76.5% of regular pay. National Pension coverage is 88.6% for regular workers and 36.5% for non-regular workers.
Q. Is Korea raising the retirement age to 65?
A bill is under discussion. The Democratic Party special committee’s plan raises the statutory retirement age to 61 in 2029 and to 65 in 2037, with mandatory re-employment one step ahead. The Korea Enterprises Federation wants one year every three years from 2030, reaching 65 in 2042. The labor minister said on October 13 that it should pass this year.
Q. Why does the author prefer re-employment to a higher retirement age?
In Korea pay at 30 or more years of service is 2.95 times pay at under one year, against 2.27 in Japan. The Bank of Korea estimated that after the retirement age of 60 took effect in 2016, each added older worker meant 0.4 to 1.5 fewer young workers. Re-employment keeps older people working while resetting pay to the job, as 67.4% of Japanese companies chose.
Q. Which Korean stocks are affected?
Labor-heavy convenience store and food service companies. Payroll is 13.0% of sales at Hyundai Green Food, 8.6% at CJ Freshway, 3.1% at GS Retail and 2.0% at BGF Retail. The 2027 minimum wage rises 3.7% to KRW 10,700 an hour. Over the past year BGF Retail rose 27.6% and GS Retail 28.4%, against 50.0% for the KOSPI.
Sources
- Statistics Korea (National Data Agency), August 2026 Economically Active Population Survey: supplementary results by employment type (policy briefing republication, https://news.nate.com/view/20261021n16960), Oct 21, 2026
- Edaily (link), Hankook Ilbo (link), Korea Economic Daily (link), Maeil Business (link), iNews24 (link), Hankyoreh (link), Oct 21, 2026
- Money Today (link), CBS NoCut News (link), SBS (link), Newspim (link), Aju Business Daily (link), Dailian (link), Oct 21, 2026
- e-Narajipyo, Non-regular employment trends (link), accessed Oct 21, 2026; News1, 2025 supplementary survey (link), Oct 22, 2025; Yonhap News, 2016-2020 pay (link), Aug 16, 2022; Newsis, 2019 parallel survey (link), Oct 29, 2019
- Yonhap News, September jobs report (link), Oct 16, 2026; Edaily, young people “unable to find work” rather than “resting” (link), Oct 21, 2026; Segye Ilbo, 2 million working under 15 hours a week (link), Aug 19, 2026
- Maeil Business, new-graduate hiring at the four largest banks (link), Oct 21, 2026; employment-type disclosure (link), Sep 30, 2026; Kyunghyang Shinmun, the two-year cliff for contract workers (link), Oct 9, 2026
- Herald Business, KEF report on Japan’s retirement-age extension (link), Oct 11, 2026; Etoday, Bank of Korea BOK Issue Note (link), Apr 8, 2025; News1, KDI 2020 study (link), Oct 15, 2026; Segye Ilbo, KDI 2024 and OECD (link), Oct 7, 2026
- JoongAng Ilbo, Democratic Party special committee compromise plan and KEF position (link), Sep 28, 2026; Financial News, Minister Kim Young-hoon (link), Oct 13, 2026; Hankook Ilbo, statements by the two union federations (link), Jun 11, 2026
- Ministry of Employment and Labor, 2027 minimum wage notice (link), Aug 5, 2026; Bridge Economy, convenience store count (link), Oct 13, 2026; Newsis, convenience store franchisees (link), Oct 19, 2026; Newspim, CJ Freshway Q3 (link), Oct 21, 2026; Money Today, Daekyo Newif (link), Mar 5, 2026
- Naver Finance and WISEreport (financials and employees), KRX Data System (closing prices, market caps, KOSPI), Oct 21, 2026; Korea Economic Daily, USD/KRW at 10:50 a.m. (link), Oct 21, 2026
- Maeil Labor News, subcontractor joint strike and rally (link), Oct 20, 2026; Dailian, labor ministry final audit (link), Oct 13, 2026; CBS NoCut News, long-term care committee (link), Oct 13, 2026
- Photos: dokaspar (CC BY-SA 3.0), Tristan Surtel (CC BY-SA 4.0), Bgag (CC0), Minseong Kim (CC BY-SA 4.0), Cjb8293 (CC BY-SA 4.0), LERK (CC BY-SA 4.0), Narubaru7 (CC BY 4.0), via Wikimedia Commons
Was this note useful?
Thanks. Your answer helps decide what to cover next.
Korea market snapshot · Oct 23, 2026
New to Korean stocks? Start here for the basics.
Most read
1France Protests 2026: Why Students Are Blocking Schools and Which Stocks Benefit (Munich Re, SCOR)
Get the Saturday note on Korean stocks
One email every Saturday with the week’s new research on Korean listed companies and links to the updated data pages. Built from DART filings and KRX data. Free; unsubscribe in one click. See past issues