KOSPI Foreign Selling Hits KRW 85 Trillion: As the Korea Stock Market Falls 7.57% to 5,554, the Buybacks That Absorbed 55.5% Are Ending
Foreigners have sold KRW 85.16tn (about $63.4bn) of KOSPI stocks since the June 22 peak, and the company buybacks that took 55.5% of it are ending. On October 15, 2026 the KOSPI fell 7.57% to 5,554.22 and tripped its 10th circuit breaker of the year. This report traces who absorbed the selling with Korea’s daily investor-type data, measures retail cash and margin debt, compares four past episodes when chip stocks peaked and foreigners sold, checks how much Samsung Electronics and SK hynix return to shareholders, and sets out the next buybacks and KOSPI ranges by horizon. Numbers as of October 15, 2026.
- On October 15, 2026 the KOSPI fell 7.57% to 5,554.22, its seventh straight fall and 39.1% below the June 22 high of 9,114.55; foreigners sold KRW 3.77tn that day.
- Since June 22 foreigners sold KRW 85.16tn (about $63.4bn); company buybacks (“other corporations,” KRW 52.08tn) took 55.5%, retail 26.5% and financial investment 15.1%. Samsung’s buying ended October 6 and SK hynix’s ends around October 21 (author’s calculation).
- Investor deposits are down 30.3% from their peak but margin loans only 12.8%; at four past bottoms after chip peaks, margin loans were down 17.1% to 33.1%, so about KRW 5.12tn more must be unwound (author’s calculation).
- In 2025 SK hynix returned 3.9% and Samsung 40.9% of net income as dividends and buybacks, against a 73.4% median at overseas equipment makers; stocks in the top third by payout fell 14.5% vs 29.2% for the bottom third.
- Next supports: SK hynix’s additional return on October 28 (KRW 42.6tn of room through 2026, author’s calculation) and Samsung’s KRW 60tn to 80tn in January 2027. Ranges from 12 past crash episodes: 5,488 to 6,115 in one month, 4,943 to 8,542 in twelve (author’s calculation).
Key takeaways
- Since the June 22 peak, foreigners have sold KRW 85.16tn (about $63.4bn) of KOSPI stocks. Of what was bought, companies buying back their own shares (counted as “other corporations,” KRW 52.08tn) took 55.5%, retail investors 26.5% and financial investment 15.1%. The biggest support, company buying, ended at Samsung Electronics on October 6 and ends at SK hynix around October 21 (author’s calculation).
- Investor deposits, the cash in retail brokerage accounts, are 30.3% below their peak, but margin loans are only 12.8% lower, so margin debt as a share of deposits has risen from 29.1% to 34.6%. In the four past episodes when chip stocks peaked and foreigners sold heavily (2004, 2017-2019, 2021-2022 and 2024-2025), the bottom came after margin loans had fallen 17.1% to 33.1% from their peak and new money from foreigners, pension funds and financial investment came in.
- The author sees the next one to two months, while about KRW 5.12tn (about $3.8bn) more of margin debt is unwound, as the stretch in which the bottom is built, and the supports that decide what follows as SK hynix’s additional shareholder return on October 28 and Samsung Electronics’ KRW 60tn to 80tn in January 2027. In 2025 the two companies returned 3.9% (SK hynix) and 40.9% (Samsung) of net income as dividends and buybacks, less than overseas chip-equipment makers (median 73.4%), so what brings foreigners back is not a one-off buyback but a payout formula tied to earnings.
As of: October 15, 2026
Topics covered: the October 15 circuit breaker and investor flows; the order in which AI expectations broke; sellers and buyers across Korea’s 12 investor types; foreign ownership; investor deposits, margin loans, forced sales and where the debt stands; the depth, length, flows and recovery of four past episodes after chip-stock peaks; who bought after the bottom; shareholder returns at Korean and overseas chip companies; what buybacks can and cannot do; the next buybacks, the National Pension Service, the market stabilization fund and idle cash; the paths after one-day falls of 7% and KOSPI ranges by horizon; bottom signals; dates to watch; and how the numbers were calculated
Reference data: KOSPI closes, net buying by investor type (12 groups), market caps and foreign holdings come from the KRX Data System (pykrx, October 15, 2026 close, downloaded again at 6:27 p.m.); investor deposits, margin loans, unpaid settlements and forced sales from the Korea Financial Investment Association’s (KOFIA) freesis database (through October 14); the KOSPI before 2003, US indexes and stocks, the won-dollar rate and the financials of Korean and overseas chip companies from Yahoo Finance; Samsung Electronics and SK hynix consensus from WiseReport; company filings from DART (Korea’s electronic disclosure system, run by the Financial Supervisory Service) and KIND (the Korea Exchange’s disclosure site); articles are listed under Sources.
This is the author’s personal analysis and view. The author’s calculations and estimates are not confirmed facts.
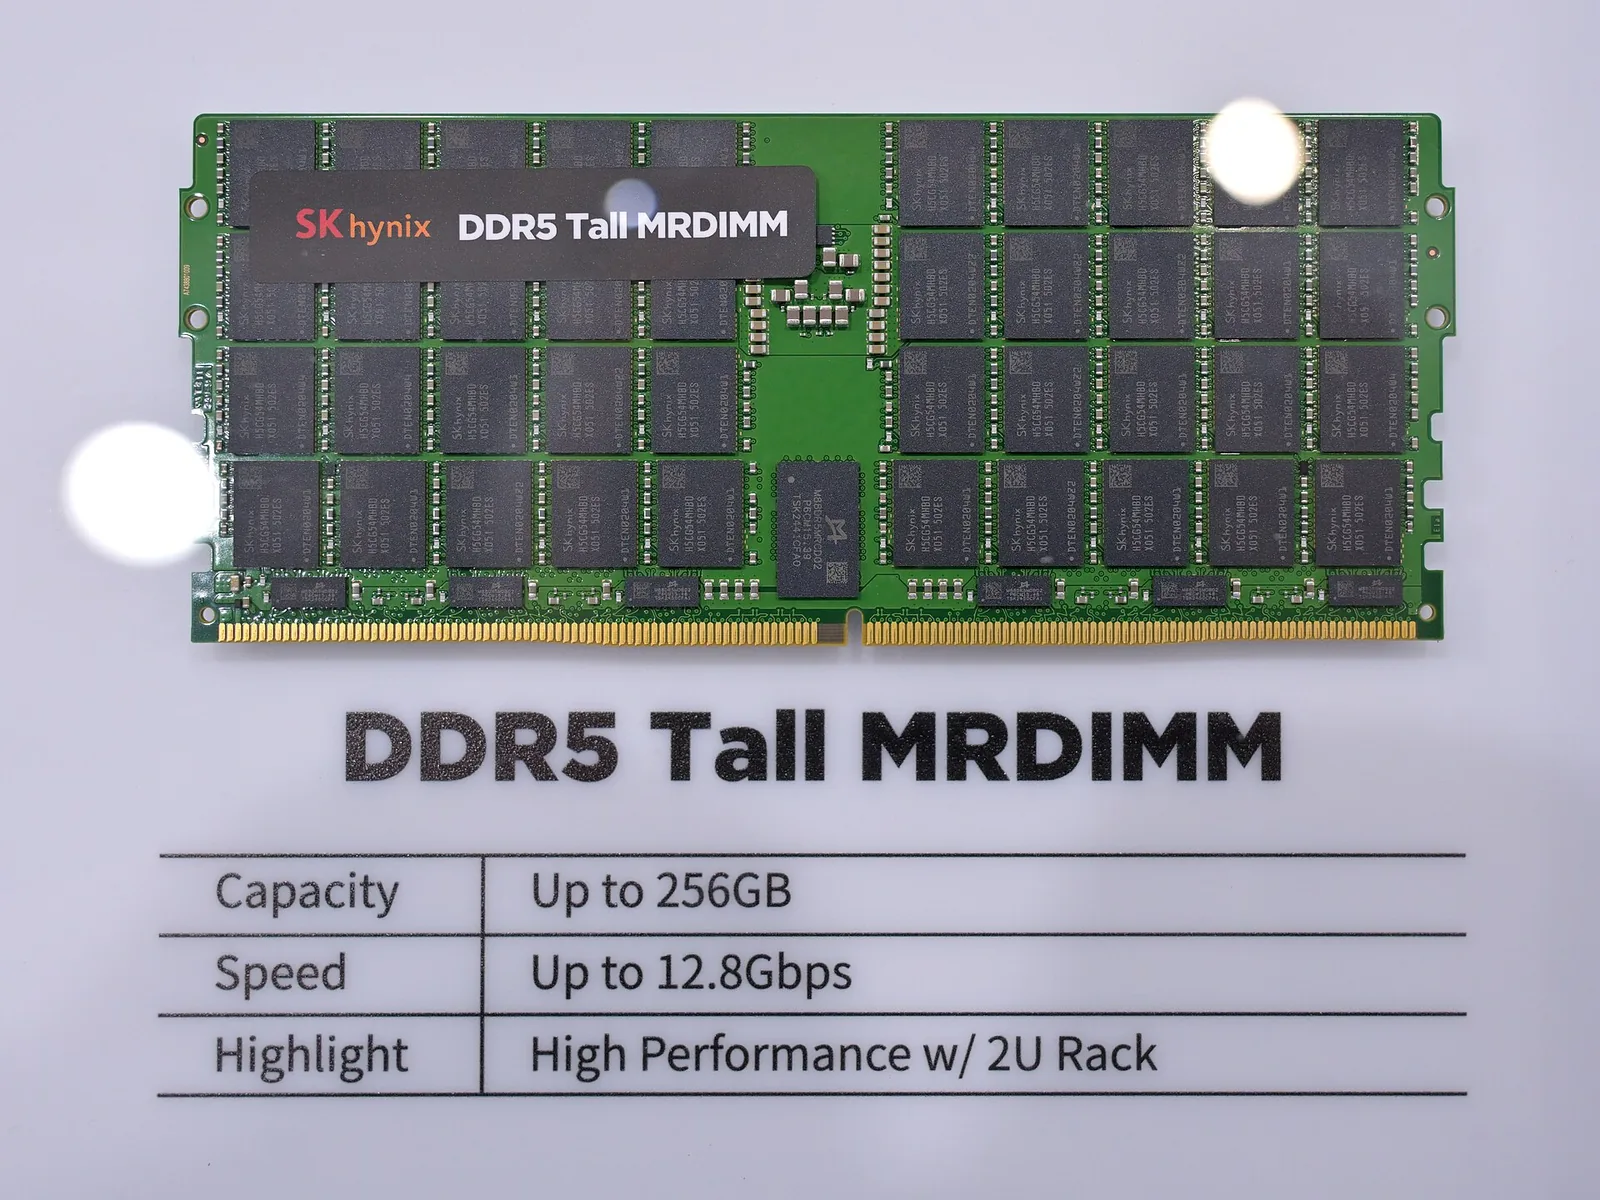
The photo shows an SK hynix DDR5 server memory module (Tall MRDIMM) on display at Computex 2025 in May 2025. Expectations of how many more of these modules, and how much more HBM, would go into each AI server pushed the KOSPI above 9,000 in the first half of this year, and when those expectations came into doubt, the foreign selling began.
Summary: the bottom comes when the debt is flushed out and new support arrives
This report looks at the foreign exodus from Korean stocks in 2026, based on exchange data, company filings and the author’s calculations. It asks three questions. When foreigners left after a run-up in chip stocks in the past, how did it end? Who absorbed what they sold this time, and with what money? And so what happens this time? The author’s answer comes first. The bottom comes when the debt is flushed out and new support arrives. Neither condition has been met yet, and the dates on which they could be met cluster at the end of October and in January 2027.
Some Korea-specific background first. The KOSPI is the main board of the Korea Exchange (KRX) and its benchmark index; the KOSDAQ is its smaller, tech-heavy market. Every trading day the KRX publishes net buying (purchases minus sales) for 12 investor types: foreigners, other foreigners, individuals (retail), “other corporations,” and seven institutional groups (financial investment, insurance, investment trusts, private funds, banks, other financial institutions and pension funds). So who sold and who bought is a matter of record, not an estimate. Korea counts large sums in units of one trillion won (jo) and 100 million won (eok); this report shows them as KRW tn and KRW bn. Dollar figures use KRW 1,343.55 per dollar, the October 15, 2026 rate (Yahoo Finance).
The chain runs like this. First, when AI expectations cracked, the market began to doubt how many years memory profits would last, and foreigners sold Samsung Electronics and SK hynix, which make up about half of the KOSPI’s market cap. Since June 22, 85.7% of foreign selling has been in these two stocks. Second, the biggest buyer of that selling was the companies themselves. Samsung Electronics’ KRW 15tn (about $11.2bn) and SK hynix’s KRW 40tn (about $29.8bn) share buybacks show up in the flow data as KRW 52.08tn of net buying by other corporations, equal to 61.2% of foreign selling. Third, with company buying now ending, the support left is retail money, and the cash part of that money is down 30.3% while the debt part is down only 12.8%.
Fourth, the four past bottoms have something in common. They came after margin loans had fallen 17.1% to 33.1% from their peak and a round of forced selling had passed; in the three months after the bottom the buyers were pension funds, foreigners and financial investment, and retail sold all four times. Fifth, this time margin loans are down only 12.8%, and pension funds have little reason under their rules to buy. So the first candidate for new money is company payouts, and in 2025 the two companies returned 3.9% (SK hynix) and 40.9% (Samsung) of net income, less than overseas equipment makers. The author believes foreigners come back only if SK hynix on October 28 and Samsung in January announce returns that are built on share cancellation and tied to earnings by formula.
Key terms and a hypothetical example: why debt deepens a fall
Some terms come up often in this report. Net buying is the amount bought minus the amount sold, and on any day the net buying of all investors adds up to zero. Other corporations are ordinary companies that are not classed as institutions; when a company buys its own shares (treasury shares) on the market, the purchase is counted here. Financial investment means securities firms, and it includes the share trading of ETF liquidity providers, which create and redeem ETF units. Investor deposits are the cash left in brokerage accounts, and margin loans are the balance of shares bought with money borrowed from brokers. Unpaid settlements are money owed after buying shares without paying in by the settlement date, and a forced sale is the broker selling those shares when the loan or the unpaid amount is not covered.
How debt deepens a fall is easy to see with one hypothetical account. Say Kim buys KRW 100mn of shares with KRW 50mn of cash and a KRW 50mn margin loan (author’s assumption). Every day the broker checks the collateral ratio, the value of the shares divided by the loan, and when it falls below a set line, it asks for more money. If the line is 140% (it varies by broker; author’s assumption), the moment the shares fall to KRW 70mn, a 30% drop, Kim has to put in more money or the shares are sold. Lee, who bought the same shares with cash only, has no reason to sell after a 30% fall.
If Kim had bought a 2x single-stock leveraged ETF on margin, it happens faster. A 15% fall in the underlying stock takes the ETF down nearly 30%, so it hits the same line twice as fast. The Samsung Electronics and SK hynix single-stock leveraged ETFs listed this May fell 26% to 29% in a single day on July 28 and stood 56% to 58% below their listing prices (SBS Biz). When Kim’s shares are sold, that selling pushes the price down again, and that price cuts Park’s collateral ratio. Because of this loop, in which falls breed falls, the more debt there is relative to market cap, the more the bottom comes only after the debt is flushed out.
This report follows that loop in numbers: who sold and who absorbed it (the 12 investor types), whether the money that absorbed it was cash or debt (deposits and margin loans), how far debt had to fall before past bottoms (the four past episodes), and where new money that is not debt could come from (company payouts, the pension fund, idle cash and foreigners).
October 15: a KOSPI circuit breaker and a seventh straight fall
On October 15 the KOSPI closed down 454.59 points (-7.57%) at 5,554.22. It opened at 5,673.01 and fell as low as 5,450.81 during the day. At about 12:23 p.m., with the KOSDAQ down 8.01%, a level-1 circuit breaker (a market-wide trading halt after a very large one-day fall) stopped trading there, and 15 minutes later, at about 12:38 p.m., the KOSPI was halted at 5,528.05, down 8.00%. Each market stopped for 20 minutes. It was the KOSPI’s 10th circuit breaker of the year and the first time both markets had been halted on the same day since July 29 (Newsis). The KOSPI has now fallen for seven straight trading days and is 39.1% below its June 22 closing high of 9,114.55.

Net buying by investor type that day shows foreigners (including other foreigners) selling KRW 3,771.8bn, about KRW 3.77tn (about $2.8bn). On the buying side were financial investment (+KRW 2,079.1bn, or +KRW 2.08tn), retail (+KRW 1,455.3bn), other corporations (+KRW 644.7bn), insurance (+KRW 103.8bn) and pension funds (+KRW 35.1bn). Investment trusts (-KRW 225.3bn), private funds (-KRW 300.5bn), banks (-KRW 14.6bn) and other financial institutions (-KRW 5.8bn) were on the selling side. Articles right after the close carried preliminary figures such as foreigners -KRW 4,819.6bn, but this report uses the confirmed KRX figures downloaded again after the close.
Widening the window to the four days from October 12 to 15, foreigners sold KRW 11.54tn, while financial investment bought KRW 4.91tn, retail KRW 4.88tn and other corporations KRW 2.64tn. The KOSPI fell 3.65% on October 12, 5.46% on the 13th, 0.44% on the 14th and 7.57% on the 15th, so three of the four days were heavy falls. On October 15, 72.4% of what foreigners sold was Samsung Electronics (KRW 1,539.8bn) and SK hynix (KRW 1,191.5bn). Samsung Electronics closed down 9.48% at KRW 210,000 (about $156) and SK hynix down 11.06% at KRW 1,262,000 (about $939); the KOSDAQ fell 7.65% to 760.82.
The KOSPI close in the left panel (6/23 to 10/15) shows that this fall is not a one-day accident. From around 9,115 on June 22 the index dropped to near 6,000 at the end of July, recovered above 7,000 in August and September, and broke down again in October. The August-September recovery overlaps with the period of the biggest company buybacks. The later chapters come back to that link in numbers.
How AI expectations broke: Micron, OpenAI, CXMT and US inflation
Why foreigners dumped chip stocks right now becomes clear when the news out of the US from late September to October 14 is put in order. What it had in common was doubt about whether AI investment will earn its money back. The feature of this fall is that the profit numbers themselves were still good.
First, on September 30 Micron reported record quarterly revenue of $54.23bn and raised its guidance for the next quarter to $61.5bn, yet the after-hours share reaction was only about +1.3% (SEC 8-K). The same day TrendForce put the fourth-quarter rise in conventional DRAM contract prices at 10% to 15%, lower than its third-quarter forecast (13% to 18%). Second, on October 8 the FT reported that OpenAI’s annualized revenue at the end of September was near $50bn, not the roughly $70bn that had circulated earlier, and the Philadelphia Semiconductor Index (SOX) fell 3.4% that day (Euronews). Third, on October 10 China’s CXMT said it would release server DRAM with a 4F² structure, which shrinks the memory cell, within the year, and on the 13th SK hynix fell 10.09% (Korea Times).
Fourth, on October 14 US consumer prices for September came in at 3.7%, above the 3.6% expected, and shares of AI data-center company CoreWeave fell 15.5% as the yield on its bonds due 2032 rose to 14.8%. The Nasdaq fell 1.88%, and the SOX fell for a sixth straight trading day, about 10% in all (Newsis, MTN). Meanwhile the US 10-year Treasury yield hit 5.054% on September 23, the highest since 2007, and the Federal Reserve raised rates in September. A growing share of AI investment is funded with debt, and the price of that debt rose just as the size of the revenue came into doubt.
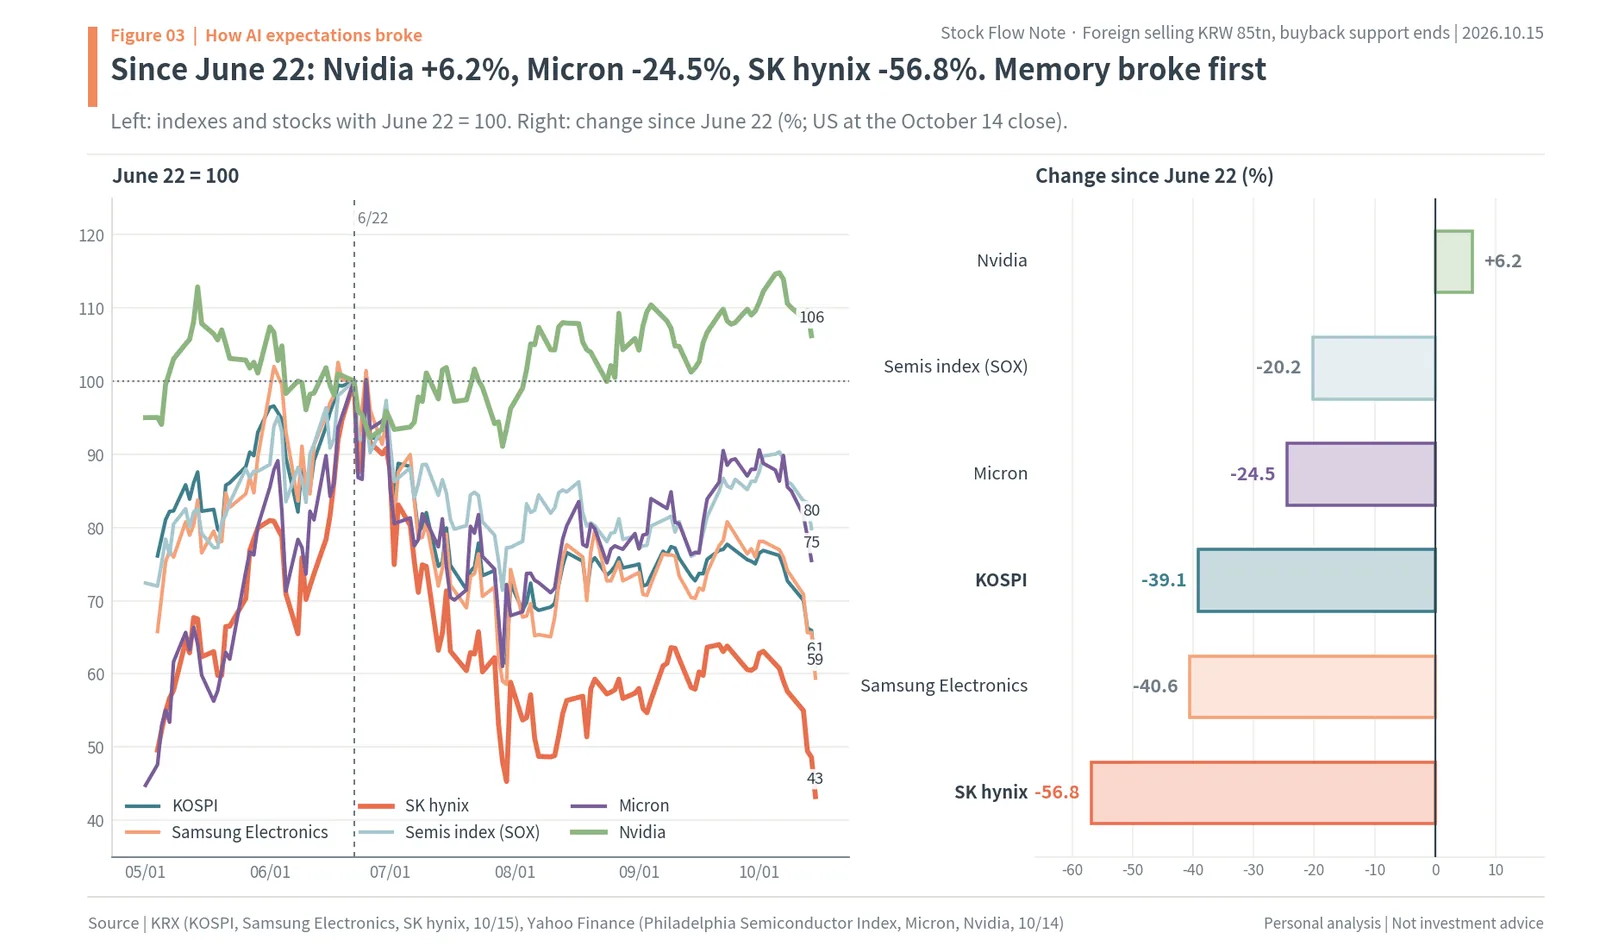
The figure sets June 22 = 100. Since June 22 Nvidia is up 6.2%, while the SOX is down 20.2%, Micron 24.5%, the KOSPI 39.1%, Samsung Electronics 40.6% and SK hynix 56.8% (US at the October 14 close). Nvidia, at the center of AI, has held up; what came into doubt first was how many years the price and volume of the memory that goes into its systems can last. Memory is a business whose profits multiply when prices rise and shrink just as fast when they fall, so when expectations wobble, the shares move before the profits do.
Korea fell especially hard because of what its index is made of. Of the KRW 2,868tn (about $2.13tn) the KOSPI has lost in market cap since June 22, KRW 1,997tn (69.6%) belongs to Samsung Electronics and SK hynix, and even on October 15 the two stocks are 46.9% of KOSPI market cap (author’s calculation). The Nikkei 225 fell 4.90% the same day, while the KOSPI fell more than twice as much. Because doubt about memory profits becomes doubt about the whole Korean index, when foreigners cut chips, they cut Korea.
Who absorbed the selling: companies 55.5%, retail 26.5%, financial investment 15.1%
The KRX splits investors into 12 groups and publishes their net buying every day: foreigners and other foreigners, individuals, other corporations, and the institutional groups of financial investment, insurance, investment trusts, private funds, banks, other financial institutions and pension funds. This report combines foreigners and other foreigners and looks at 10 groups. Because net buying is purchases minus sales, the net buying of all groups over the same period adds up to zero: whatever someone sold, someone else bought.
From June 23 to October 15 the sellers were foreigners (KRW 85.16tn) and investment trusts, private funds, pension funds and banks (KRW 8.6tn). The buyers were other corporations (KRW 52.08tn, about $38.8bn), retail (KRW 24.89tn), financial investment (KRW 14.13tn) and insurance and other financial institutions (KRW 2.66tn). Dividing by the buyers’ total of KRW 93.76tn, other corporations took 55.5%, retail 26.5%, financial investment 15.1% and insurance and other financial institutions 2.8% (author’s calculation). Against foreign selling alone, company buying equals 61.2% of it.
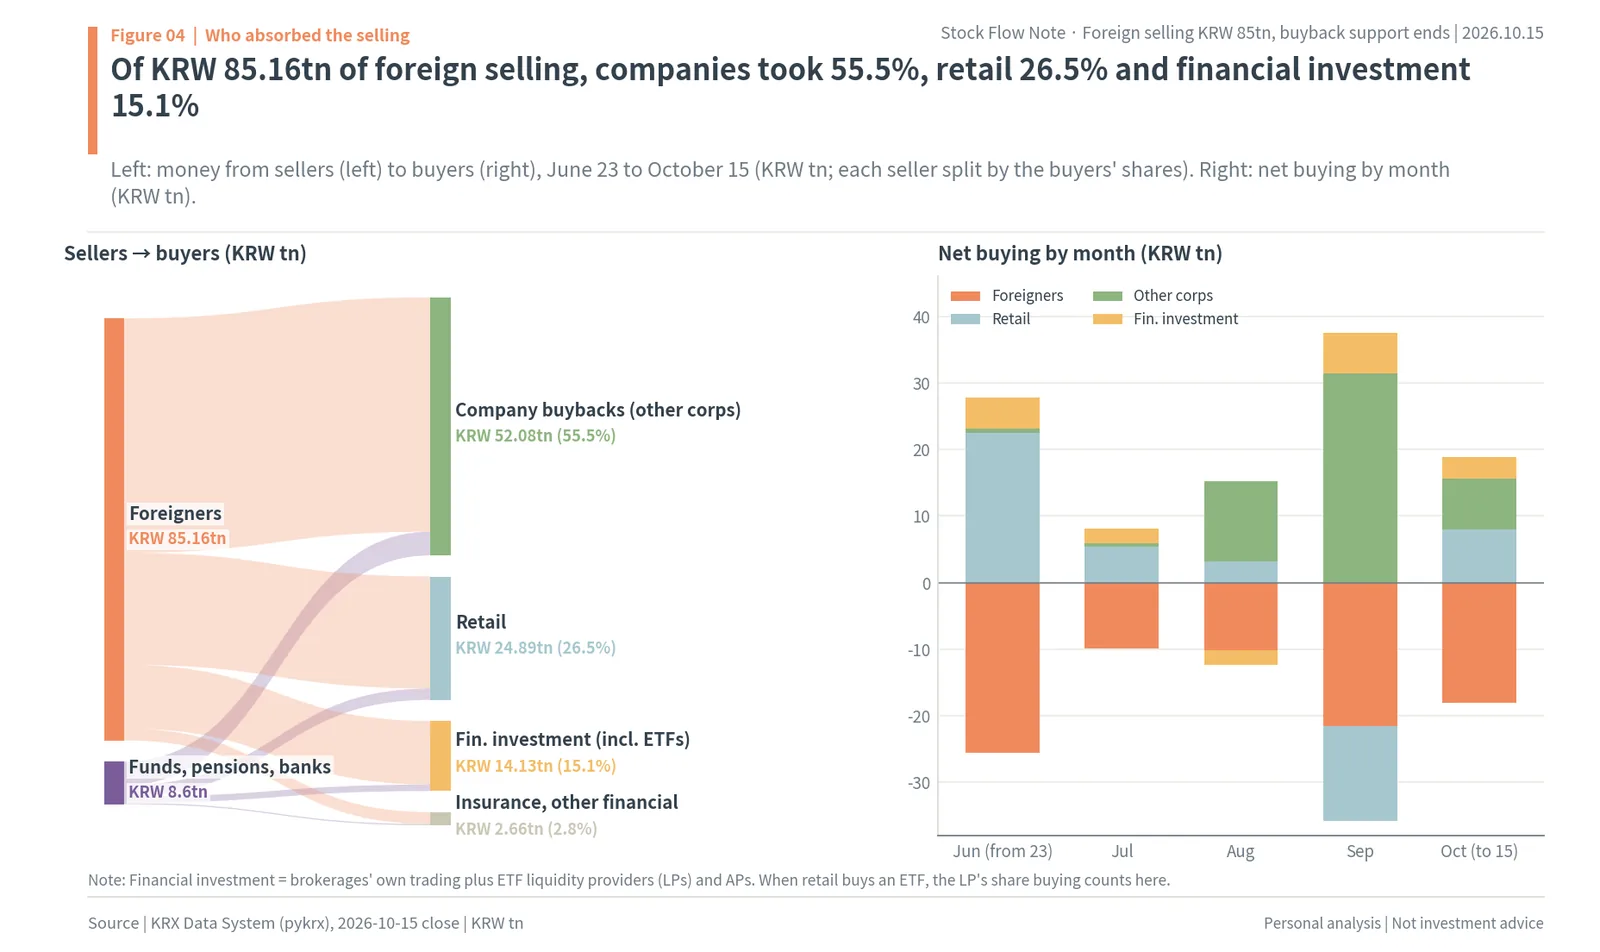
Month by month, the buyer has changed. From June 23 to 30, retail took almost all of the foreigners’ KRW 25.56tn of selling with KRW 22.44tn of buying. In July foreigners sold KRW 9.86tn, and retail bought KRW 5.37tn and financial investment KRW 2.21tn. In August other corporations began to absorb it, buying KRW 11.99tn as foreigners sold KRW 10.17tn. In September foreigners sold KRW 21.59tn and retail KRW 14.20tn, and other corporations bought KRW 31.40tn and financial investment KRW 6.13tn. Through October 15 foreigners have sold KRW 17.98tn, split among retail (+KRW 8.04tn), other corporations (+KRW 7.57tn) and financial investment (+KRW 3.22tn).
Other corporations are ordinary companies that are not classed as institutions, and shares a company buys back on the market through a broker are counted here. The previous flow note (October 12) confirmed that SK hynix’s daily buyback amounts and other-corporations net buying matched at 0.95 to 1.02 times on all 33 trading days. September’s KRW 31.40tn of other-corporations buying was the overlap of Samsung Electronics’ KRW 15tn and SK hynix’s KRW 40tn buybacks.
Financial investment covers brokerages’ own trading together with ETF liquidity providers (LPs) and authorized participants (APs). When retail investors buy an ETF, the LP buys the basket of shares to create new ETF units, and that buying is counted as financial investment, not retail. Retail investors put KRW 13,574.7bn into the Samsung Electronics and SK hynix single-stock leveraged ETFs listed on May 27 through July 15 (Money Today), and one analysis found that most of the KRW 4.8tn of financial-investment net buying on May 29 and June 1 was ETF buying (Herald Economy). So much of financial investment’s KRW 14.13tn since June should be read as retail money.
Samsung Electronics and SK hynix by investor type: 85.7% of foreign selling
By stock over the same period, it is clearer where the foreign selling was concentrated. In Samsung Electronics foreigners sold KRW 24.93tn, absorbed by other corporations (+KRW 15.12tn), retail (+KRW 9.56tn) and financial investment (+KRW 4.67tn). In SK hynix foreigners sold KRW 48.04tn (about $35.8bn), absorbed by other corporations (+KRW 37.85tn) and retail (+KRW 16.35tn), while investment trusts sold KRW 5.81tn. Together, foreign selling of the two stocks was 85.7% of all foreign selling on the KOSPI.
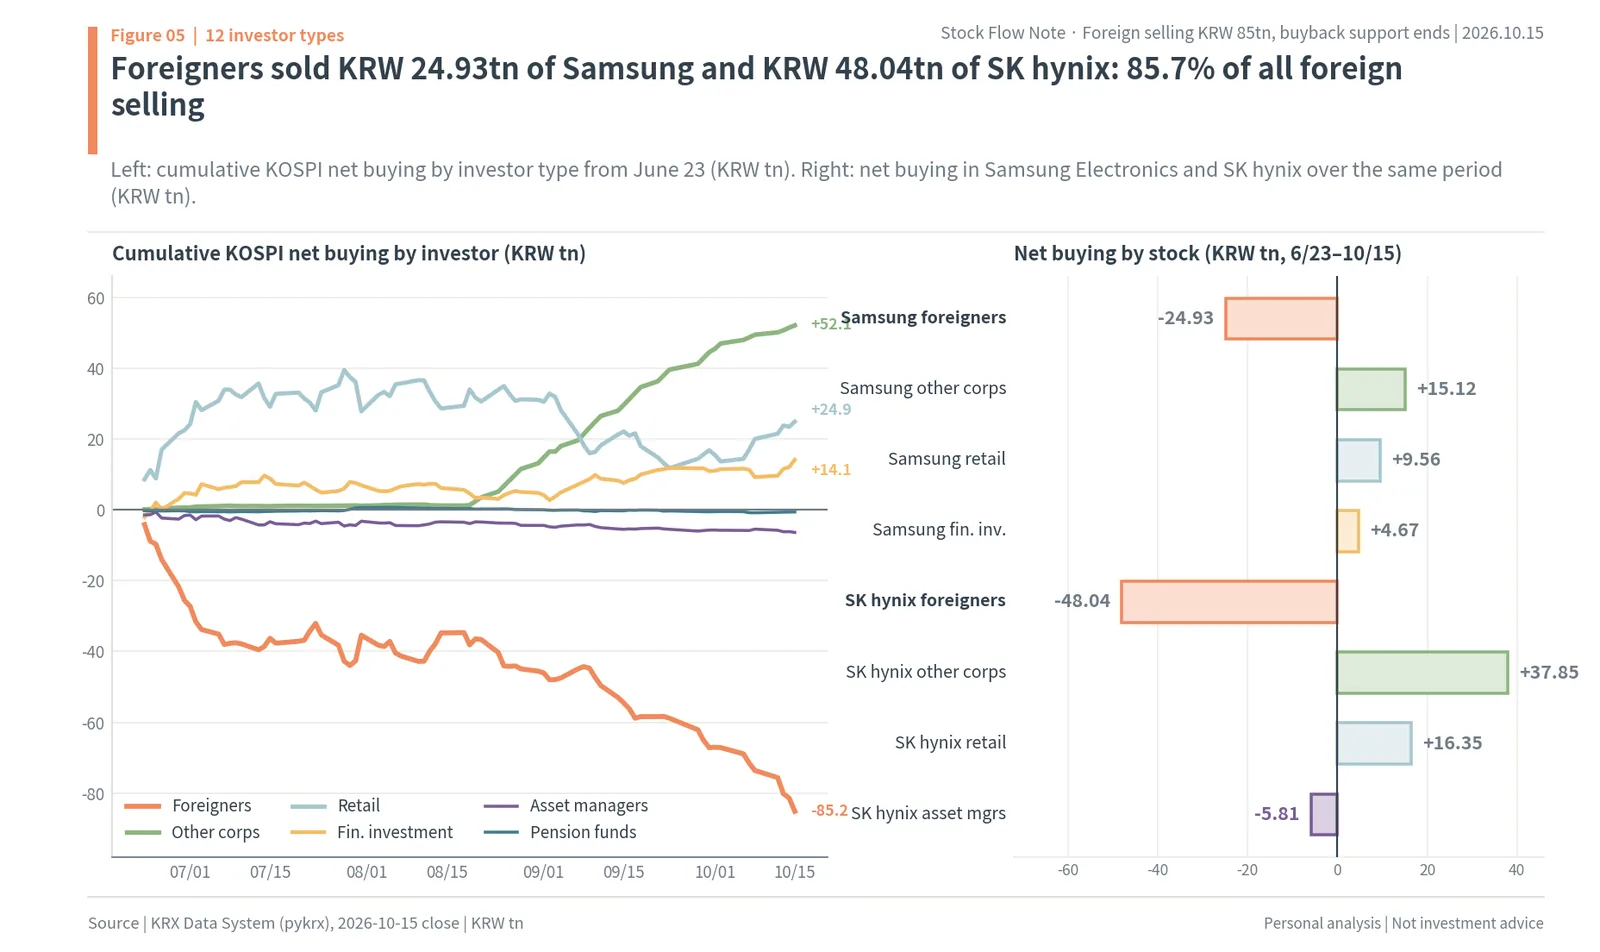
October 15 alone shows the same structure. In Samsung Electronics, foreigners’ KRW 1,539.8bn of selling was absorbed by retail (+KRW 993.0bn) and financial investment (+KRW 647.3bn). In SK hynix, foreigners’ KRW 1,191.5bn was split among other corporations, that is the company (+KRW 583.4bn), retail (+KRW 534.5bn) and financial investment (+KRW 408.1bn). At Samsung Electronics, whose buyback has already ended, retail and ETF money took the selling; at SK hynix, which still has buying left, the company stood in front.
The cumulative lines on the left show when the support changed hands. Retail’s cumulative net buying rose to +KRW 39.49tn on July 28, then fell to +KRW 11.75tn on September 23 as company buying grew, which means what retail sold was also taken by the companies. Other corporations’ line stayed near zero until mid-August, then rose almost in a straight line to +KRW 52.1tn on October 15. The foreigners’ line is at -KRW 85.2tn. Financial investment rose steadily to +KRW 14.1tn, while investment trusts (-KRW 6.4tn) and pension funds (-KRW 0.6tn) stayed on the selling side throughout the period after the peak.
Widening to the whole year, from January 2 to October 15 foreigners net sold KRW 207.92tn (about $154.8bn) of KOSPI stocks, retail net bought KRW 101.63tn and other corporations KRW 65.56tn (author’s calculation, KRX). Measured as a 20-trading-day total, foreign selling was strongest this year on June 5, at -KRW 69.06tn; on October 15 it is -KRW 35.51tn. Foreigners are selling at roughly half the June pace, but with the company buying that absorbed it now ending, the same selling moves prices more.
Foreign ownership: Samsung Electronics at 46.16%, the lowest since 2017
What foreigners sold stays behind in ownership. Summing, for each stock, foreign-held shares divided by listed shares times market cap, and dividing by total market cap, foreign ownership of the KOSPI fell from 41.4% on June 22 to 38.29% on October 15, down 3.11 percentage points (author’s calculation). Foreign ownership of Samsung Electronics fell from 47.56% to 46.16% over the same period, the lowest in KRX data since 2017. The press reported that the 46.37% of October 6 was the lowest since January 2008 (Herald Economy). SK hynix went from 51.25% to 49.03%, below 50%.
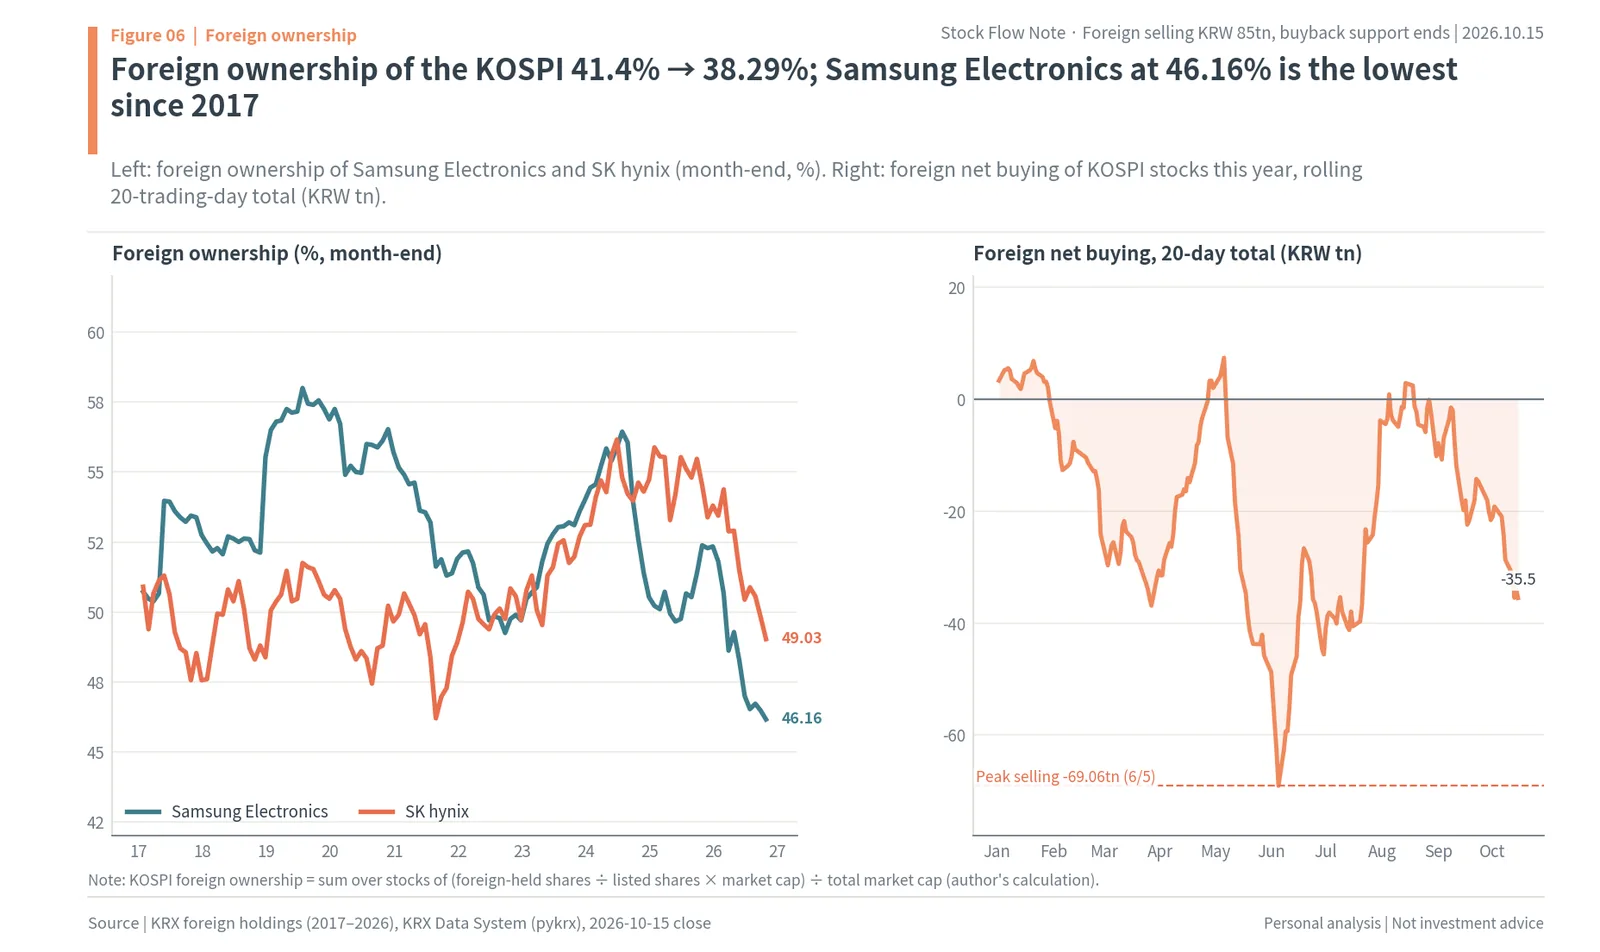
The 20-trading-day foreign net buying total on the right shows that this year’s selling came in waves: down to -KRW 36.87tn in March, to -KRW 69.06tn (June 5) in late May and early June, to -KRW 41.22tn in July, and to -KRW 35.51tn now, since late September. The total rose above zero only in May (peak +KRW 7.41tn) and August (peak +KRW 2.89tn). Right now selling is running at about half of June’s maximum.
The exchange rate shows one more feature of this selling. The won went from KRW 1,531 per dollar on June 22 to KRW 1,344 on October 15, a 14.0% rise in its value (Yahoo). In dollars the KOSPI fell from 5,952 to 4,134, or -30.5%, less than the -39.1% in won (author’s calculation). Foreigners cut chips while collecting currency gains on a stronger won. That is a different fall from 2022, when a weaker won drove foreigners out, and so a move in the exchange rate alone is unlikely to bring them back.
Less money to absorb the selling: deposits down 30.3%, margin loans down 12.8%
Once company buying ends, the support left is retail money, and its size is measured by two numbers. One is investor deposits, the cash sitting in brokerage accounts. The other is margin loans, the balance of shares bought with money borrowed from brokers. Large deposits mean there is money to buy when prices fall; large margin loans mean there are many shares that will be force-sold when prices fall.
Investor deposits hit a record KRW 139.69tn (about $104.0bn) on June 4 and fell to KRW 97.43tn (about $72.5bn) on October 14, a drop of KRW 42.27tn, or 30.3% (KOFIA). Margin loans hit a record KRW 38.63tn on June 24 and were KRW 33.71tn (about $25.1bn) on October 14, down only KRW 4.93tn, or 12.8%. Margin loans as a share of deposits rose from 29.1% on June 22 to 34.6% on October 14 (author’s calculation). Cash is leaving fast while debt shrinks slowly, so debt now weighs more within retail money.
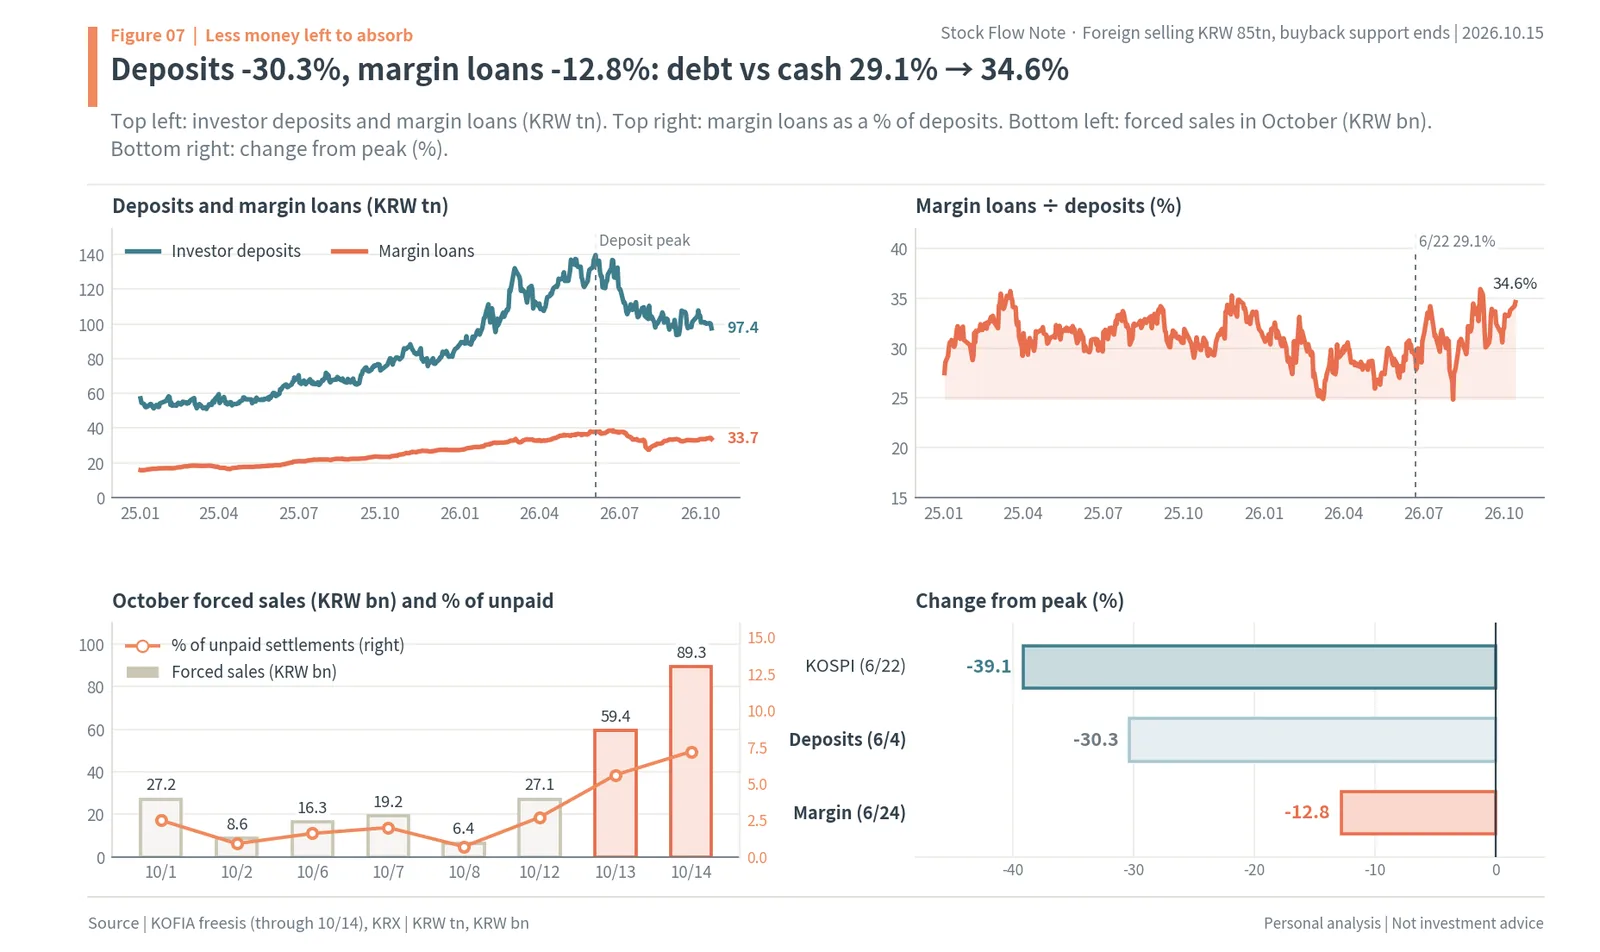
Nor have margin loans only shrunk. They were cut once in the late-July plunge, falling to KRW 27.40tn on August 4, then grew by KRW 6.31tn again through October 14 as the market rebounded. The press reported that margin loans of KRW 34,288.6bn on October 12 were the highest since July 15 (SBS Biz). Buying with new debt in August and September is now facing the fall. When people say debt-financed investing is growing, this is the flow since the August low they mean.
The debt was concentrated in the two stocks. By Kiwoom Securities’ count, margin loans in Samsung Electronics and SK hynix were KRW 7,794.1bn on May 29, 3.1 times the end-2025 level (KRW 2,531.8bn), and more than half of the roughly KRW 10tn rise in margin loans since the start of the year was in the two stocks (Newsis). The stocks foreigners sold and the stocks retail bought with debt were the same, so on days when the two fall, forced selling grows too.
The result is forced selling. When unpaid settlements are not covered, the broker sells the shares at market the next morning. By KOFIA’s count, forced sales rose from KRW 6.4bn on October 8 to KRW 27.1bn on the 12th, KRW 59.4bn on the 13th and KRW 89.3bn (about $66mn) on the 14th. As a share of unpaid settlements they rose from 0.7% to 7.2%, and unpaid settlements stood at KRW 1,357.5bn on October 14. The KRW 89.3bn was the most since July 31 (KRW 122.0bn) (Yonhap); this year’s maximum was KRW 169.8bn on June 9, and the record since the data began was KRW 549.7bn on October 20, 2023, during the Youngpoong Paper affair. Because of how settlement works, the forced selling from the October 13 and 15 plunges will show up in the October 15 to 19 data.
The rules that limit debt are changing too. Since October 1 the 10 large brokerages designated as comprehensive financial investment business entities have managed their credit lending within 90% of their equity capital, and from October 19 margin loans in any single stock may not exceed 15% of that brokerage’s total margin loans, applied to new loans (Sateconomy). That means new debt-financed buying concentrated in Samsung Electronics and SK hynix is blocked from next week. With new debt blocked, what retail can absorb depends more on shrinking deposits.
Where the debt stands: high relative to market cap
Whether the debt is large depends on what it is compared with. Ranking every daily value since 2010, margin loans at 34.6% of deposits are higher than on 58.1% of days, a little above the middle (author’s calculation), because deposits themselves swelled this year. By contrast, KOSPI margin loans divided by KOSPI market cap are 0.53%, higher than on 90.9% of days since 2010. The highest since 2010 was 0.63% in August 2021.
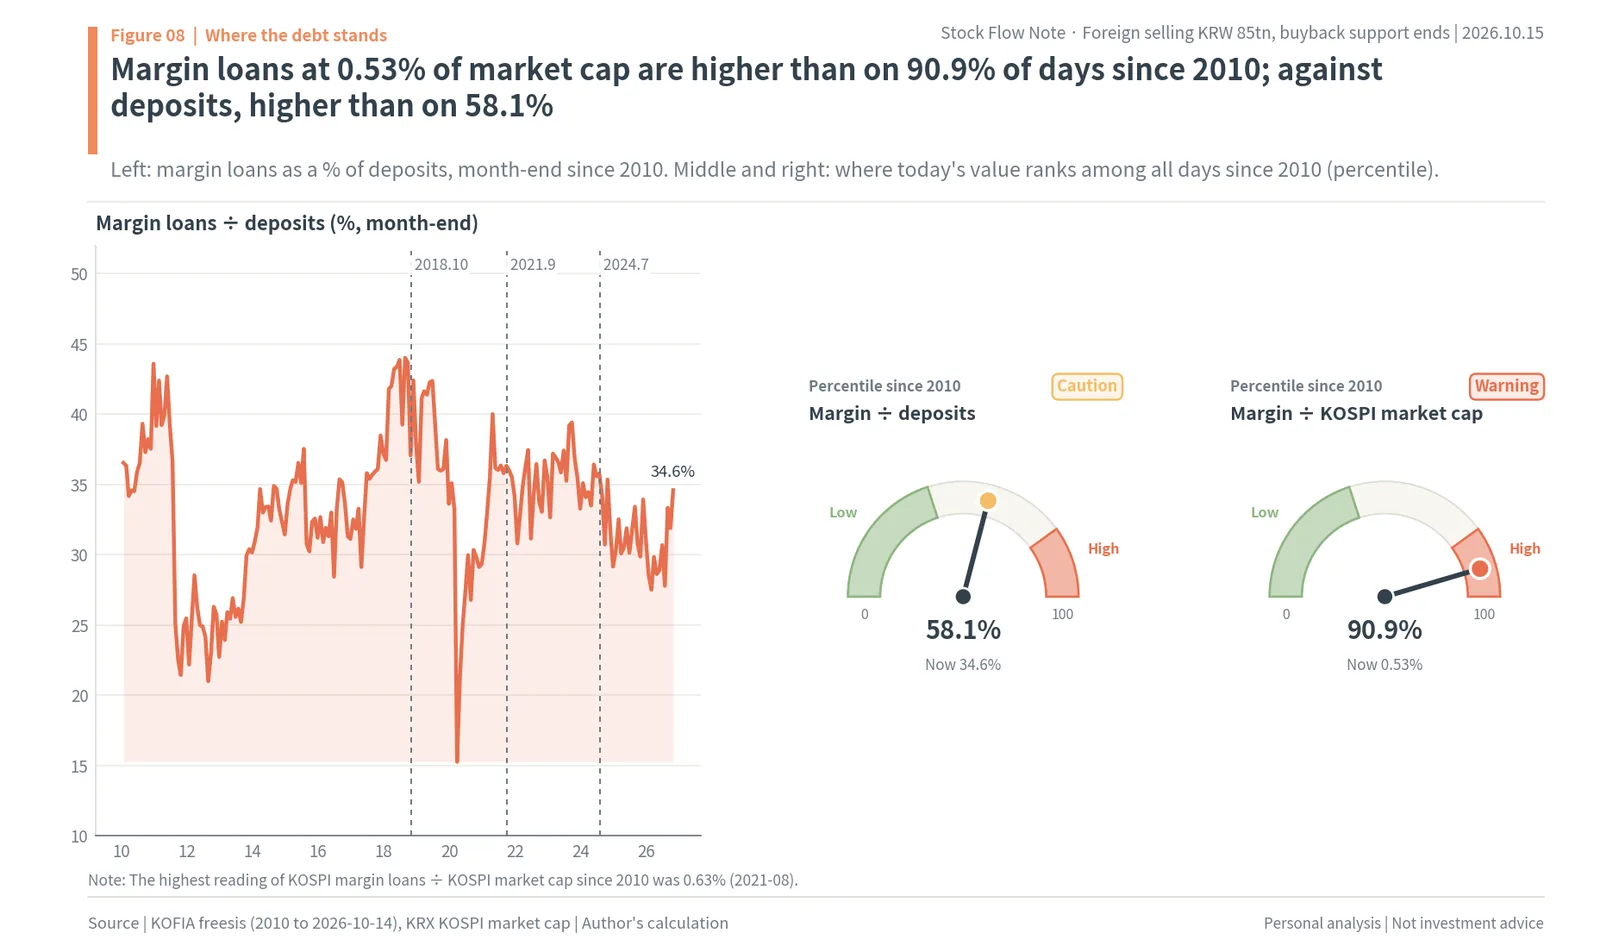
Looking at both measures together sorts the picture out. Even after a 39% fall in share prices, debt is still on the high side relative to market cap, and the cash to back it is shrinking fast. The vertical dotted lines in the left panel are the last three debt peaks (October 2018, September 2021 and July 2024). The highest margin-to-deposits reading was 48.0% on October 10, 2018, and that month the KOSPI had its worst month since 2008. This time it is the high level of debt relative to market cap, more than the ratio itself, that sets the size of forced selling.
Four past episodes: when foreigners sold after chip stocks peaked
To pick out the times foreigners sold heavily after chip stocks had run up, the author took as day 0 the day on which the combined market cap of Samsung Electronics and SK hynix peaked, and as the bottom the day the KOSPI then closed lowest. By this measure there were four episodes in which foreign selling led the fall: 2004, 2017-2019, 2021-2022 and 2024-2025. The year 2000 is covered separately below.
In 2004, chip stocks and the KOSPI peaked together on April 23 (936.06). Amid the “China shock” of Chinese tightening and expected US rate hikes, foreigners sold KRW 2.61tn from April 27 to May 11, and 59% of their two-day net selling on April 29-30 was Samsung Electronics, prompting the phrase “not Sell Korea but Sell Samsung Electronics” (Money Today). Samsung Electronics was sold even though its first-quarter operating profit was a record. The KOSPI bottomed 69 trading days later, on August 2, at 719.59, down 23.1%.
In 2017-2019, chip stocks peaked on November 1, 2017, and on November 27 Morgan Stanley cut Samsung Electronics to “neutral,” sending the stock down 5.08% in a day (BizWatch). In 2018 both companies posted record results, but the shares turned first, and in October 2018, with the trade war on top, foreigners sold KRW 4,638.0bn (Financial Supervisory Service, Aju Business Daily). The KOSPI bottomed 286 trading days later, on January 3, 2019, at 1,993.70, 22.0% below its level on the chip-peak day (2,556.47).
In 2021-2022, chip stocks peaked on January 11, 2021, the day retail investors bought nearly KRW 4.5tn in a single session. In August Morgan Stanley’s “Memory – Winter is Coming” cut its SK hynix target price from KRW 156,000 to KRW 80,000 (Korea Times), and foreigners sold KRW 7,045.4bn that week. In 2022 rate hikes and a weaker won came together, and foreign ownership of the KOSPI fell to 30.77% (New Daily). The KOSPI bottomed 426 trading days later, on September 30, 2022, at 2,155.49, down 31.5%.
In 2024-2025, chip stocks peaked on July 11, 2024, amid SK hynix’s lead in HBM. On August 5 the KOSPI fell 8.77%, and on September 15 Morgan Stanley’s “Winter looms” cut its SK hynix target from KRW 260,000 to KRW 120,000. Foreigners sold KRW 12,939.4bn of Samsung Electronics on consecutive days from September 3 to October 25 (Asia Economy). Chip stocks bottomed on November 14, but with the tariff shock on top, the KOSPI bottomed only on April 9, 2025, at 2,293.70 (-20.7%), 179 trading days after the chip peak.
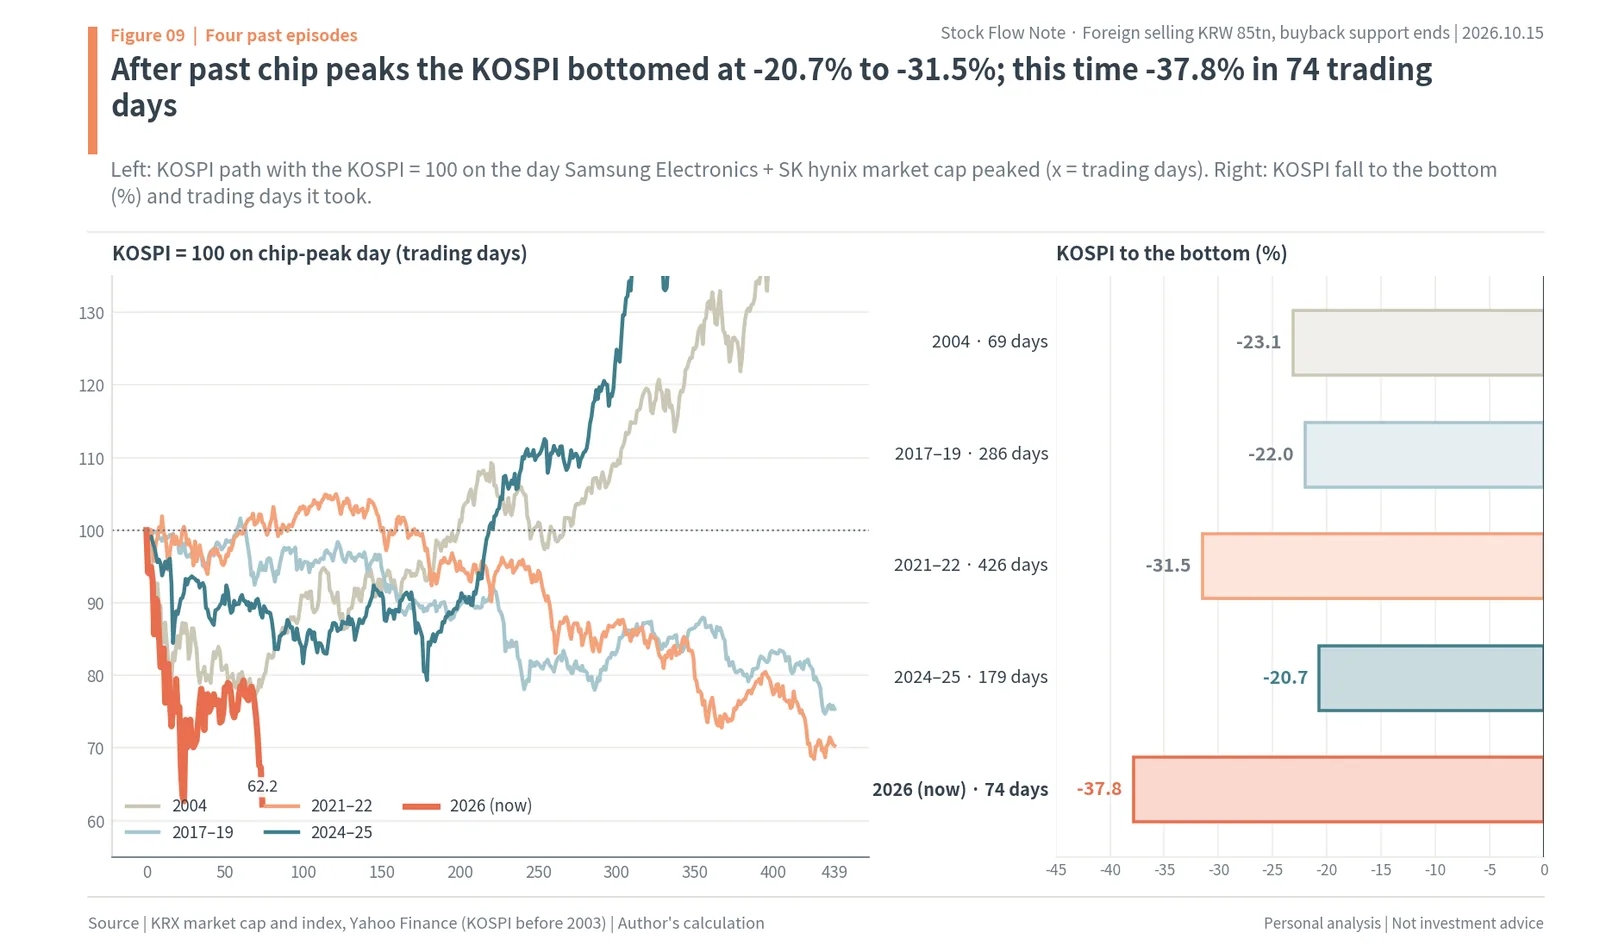
The figure’s horizontal axis is trading days after the chip peak, and the vertical axis is the KOSPI with that day = 100. The four bottoms were -20.7% to -31.5%, reached in 69 to 426 trading days. This time the KOSPI is down 37.8% just 74 trading days after the chip peak (June 25), already deeper than the deepest of the four, 2021-2022, in about the same time as the fastest, 2004. On trading day 74 of the past episodes, the KOSPI stood at 79.28 (2004) to 101.05 (2021-2022). This fall lies outside the four past episodes in both depth and speed.
This fall had a prelude. In the first week of November 2025 foreigners sold KRW 7,264.0bn of KOSPI stocks, beating the weekly record of August 2021 (KRW 7,045.4bn), and 72% of it was SK hynix and Samsung Electronics (Herald Economy). November’s KRW 14,456.0bn of net selling was also a monthly record; retail took about 60% of it, and margin loans reached KRW 26,216.5bn, then a record (Newsis). It was a time when talk of an AI bubble in the US coincided with the won at around KRW 1,450 per dollar. Back then the rally resumed and ran to the June 2026 peak, and margin loans swelled further, to KRW 38.63tn, along the way. The same doubt has now come back on top of a bigger pile of debt.
The record of the four episodes: foreign selling, debt unwinding and recovery
From chip peak to KOSPI bottom, foreigners net sold KRW 7.4tn in 2017-2019, KRW 39.3tn in 2021-2022 and KRW 38.4tn in 2024-2025. In 2004 they sold KRW 2.61tn right after the peak, then started buying again from May, so the total over the period was close to zero. Who absorbed the selling differed each time. In 2017-2019 it was financial investment (KRW 6.85tn), retail (KRW 3.48tn) and other corporations (KRW 3.05tn). In 2021-2022 retail bought KRW 87.21tn while pension funds sold KRW 23.36tn. In 2024-2025 retail (KRW 16.46tn), pension funds (KRW 10.19tn) and other corporations (KRW 9.88tn) absorbed it.
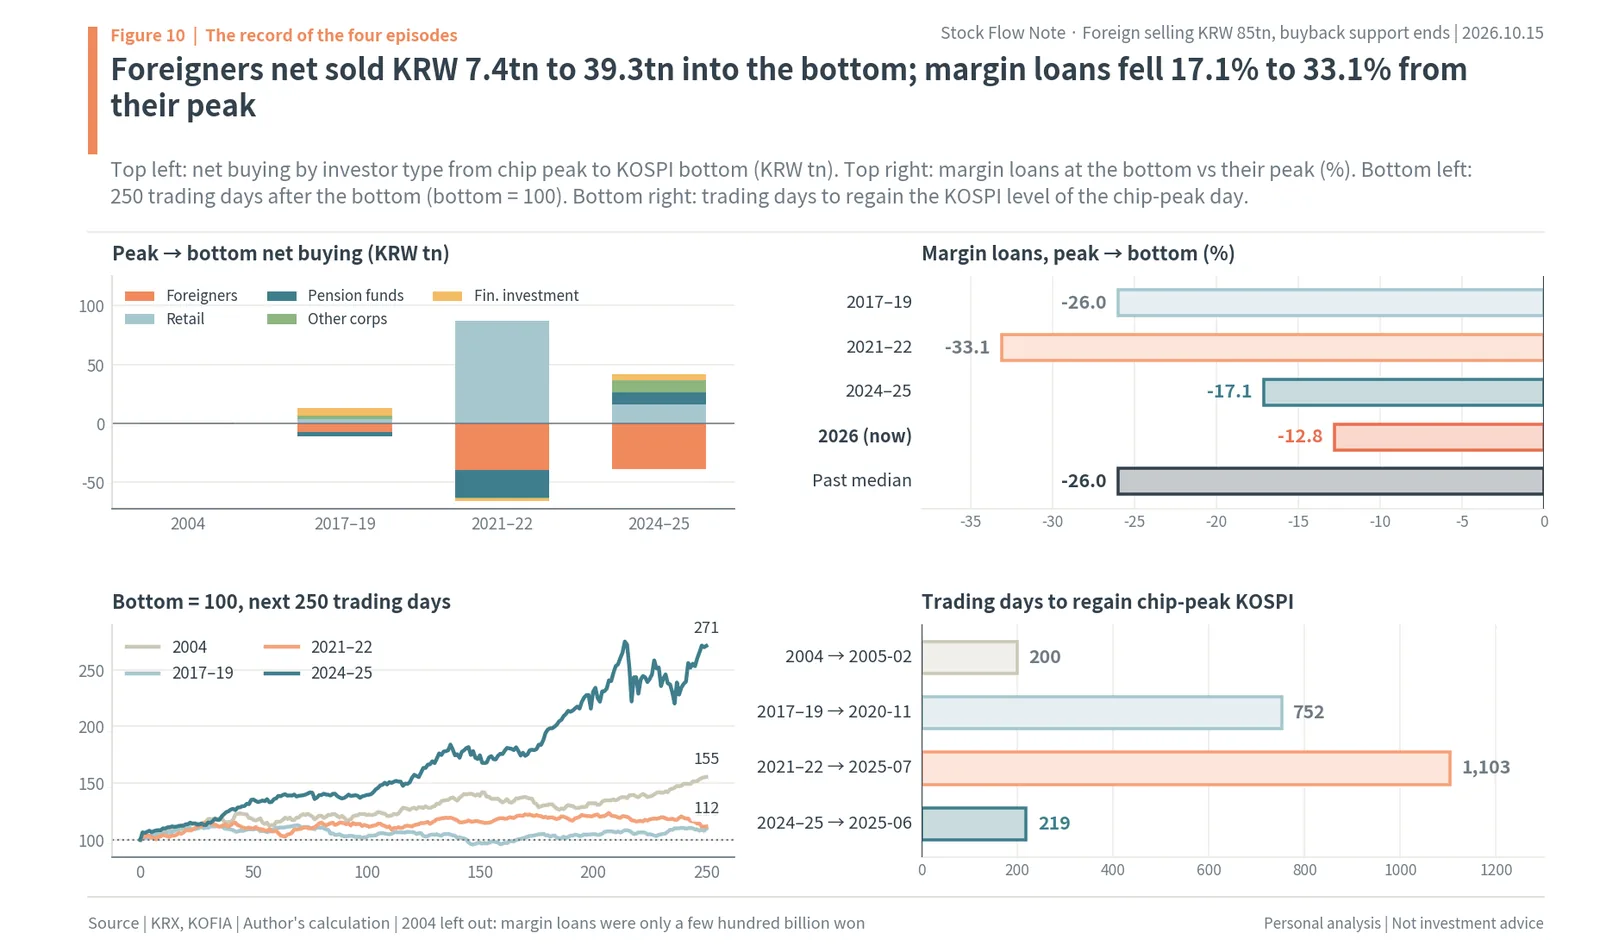
At the bottom, debt had always shrunk a lot. Margin loans were down from their peak by 26.0% in 2017-2019 (KRW 12.65tn → KRW 9.35tn), 33.1% in 2021-2022 (KRW 25.65tn → KRW 17.16tn) and 17.1% in 2024-2025 (KRW 20.25tn → KRW 16.79tn). 2004 is left out because margin loans then were only a few hundred billion won. When margin loans fell from the KRW 12tn range in October 2018 to KRW 8,984.0bn on November 6, the press described forced sales bringing out more selling in a vicious circle (Kyunghyang Shinmun); the bottom came after the debt had been flushed out. This time margin loans are down 12.8%, half the median of the three, -26.0%.
Setting the bottom = 100 and plotting the next 250 trading days, the size of the rebound varied. A year later the KOSPI was up 55.5% (2004), 9.7% (2019), 11.7% (2022) and 171.1% (2025). The KOSPI regained its chip-peak-day level after 200 trading days in 2004 (February 2005), 752 in 2017-2019 (November 2020), 1,103 in 2021-2022 (July 2025) and 219 in 2024-2025 (June 2025). When the bottom came fast, so did the recovery; where the bottom took long, the recovery also took two to three years.
At the bottoms, the KOSPI’s price-to-book ratio (PBR) was 0.94 (2004), 0.85 (2019), 0.83 (2022) and 0.80 (2025). The KOSPI’s PBR on October 14 is 1.50, above all of them (KRX). But book value is a figure from before this year’s profits pile up: by WiseReport consensus, Samsung Electronics’ book value per share is expected to rise from KRW 63,997 in 2025 to KRW 108,812 at the end of 2026. Measured by PBR, today’s level directly reflects the market’s doubt about how many years the profits will last.
The year 2000 looked different. After chip stocks peaked on March 29, 2000, the KOSPI fell 45.9%, to 491.21 on April 10, 2001, and over that period foreigners actually net bought KRW 8.54tn (KRX). The sellers were investment trusts hit by Daewoo bond redemptions (-KRW 4.71tn) and banks (-KRW 1.84tn). By the Bank of Korea’s count, foreign portfolio inflows that year were a record $11.61bn (Kyunghyang Shinmun). It is left out of the comparison because foreign selling did not lead that fall, but it is a record that selling by domestic institutions alone can halve the market.
Who bought after the bottom: retail sold all four times
Net buying over the 60 trading days (about three months) from the day after the bottom shows whose money ended each bottom. In 2004 pension funds bought the most, KRW 2.40tn. In 2019 it was foreigners (KRW 5.06tn), in 2022 foreigners (KRW 5.91tn) and financial investment (KRW 4.62tn), and in 2025 financial investment (KRW 4.79tn) and foreigners (KRW 2.90tn). Retail was a net seller over the same period all four times (-KRW 2.46tn, -KRW 4.84tn, -KRW 8.12tn and -KRW 6.15tn).
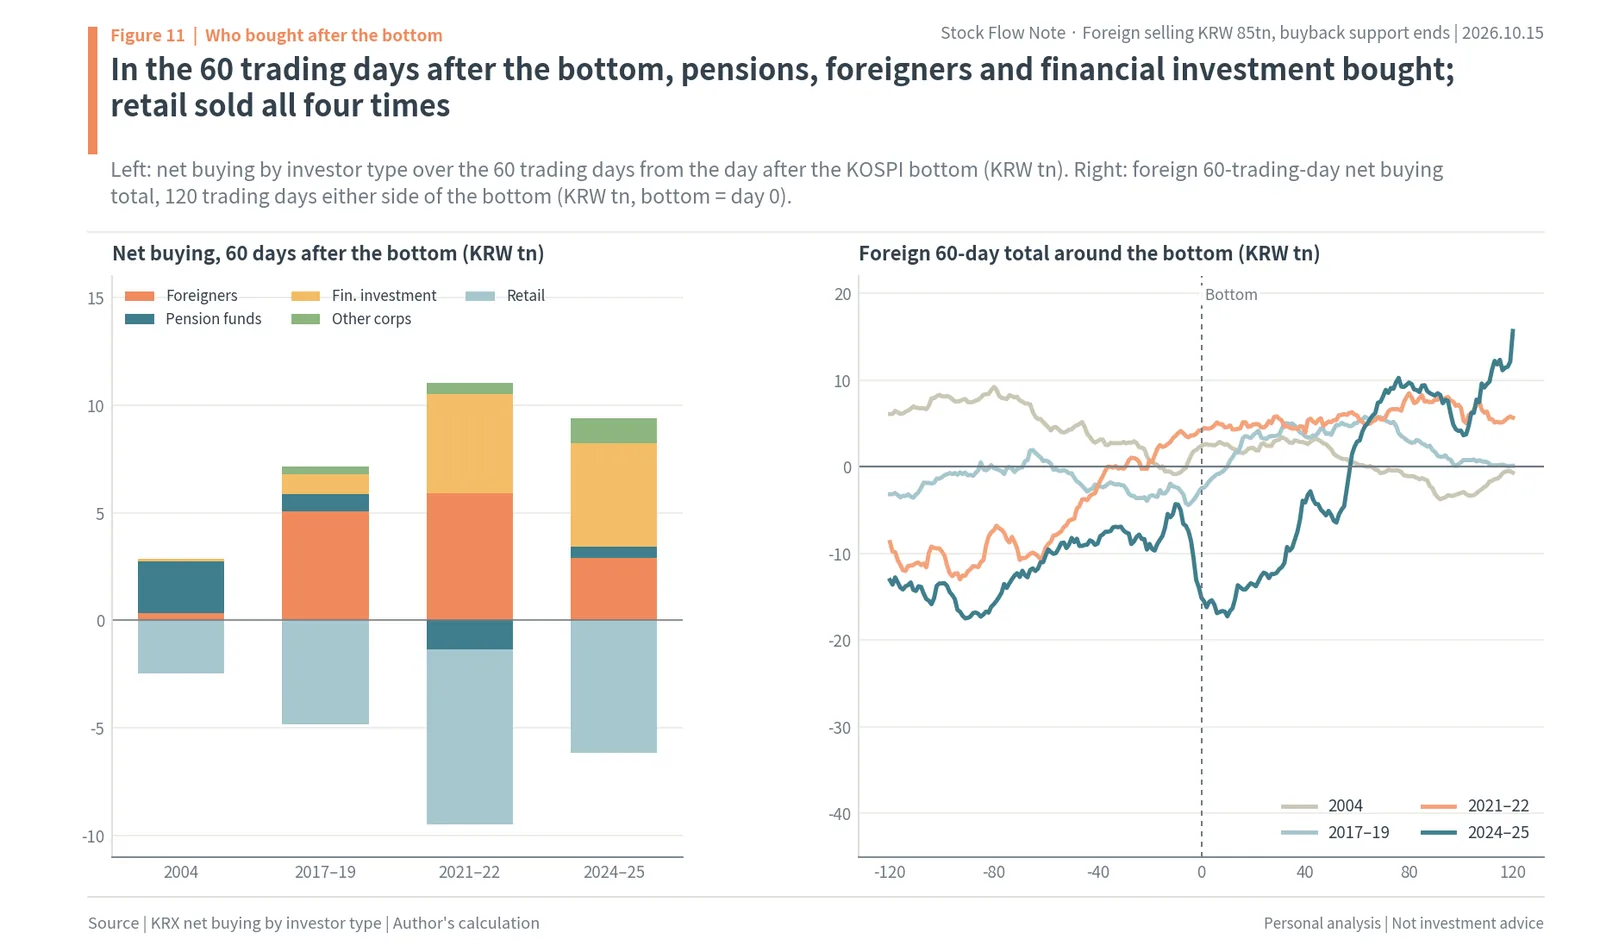
The right panel is the foreign 60-trading-day net buying total over the 120 trading days either side of the bottom. All four times the total passed its deepest point around the bottom and turned up, crossing above zero on the day of the bottom (2004, 2022), 10 trading days later (2019) or 58 trading days later (2025). The end of foreign selling and the bottom came at almost the same time. In October 2022, when foreigners bought KRW 2.2tn over 11 straight trading days, the reason given was that the KOSPI in dollar terms had fallen to 1,174 (Economist Korea).
In short, the four past bottoms were times when three things overlapped. Debt was 20% to 30% below its peak and a round of forced selling had passed; the pace of foreign selling had turned; and new money that was not retail money (pension funds, foreigners, and financial investment through ETFs) had come in. Retail absorbed the selling near the bottom and sold out into the rebound. So the question of where this bottom lies turns into two questions: how much more must the debt shrink, and where will new money come from?
Do they return what they earn? SK hynix 3.9%, Samsung 40.9%, overseas equipment makers 73.4%
It is hard to explain with AI expectations alone why foreigners left in such size this time. Over the same period Nvidia rose, and US and Japanese chip-equipment makers did not fall as much as Korean memory. One difference is how much of their earnings companies return to shareholders. The more a business’s profits are doubted to last, the less a company is doubted when it puts the money in shareholders’ hands while profits are big.
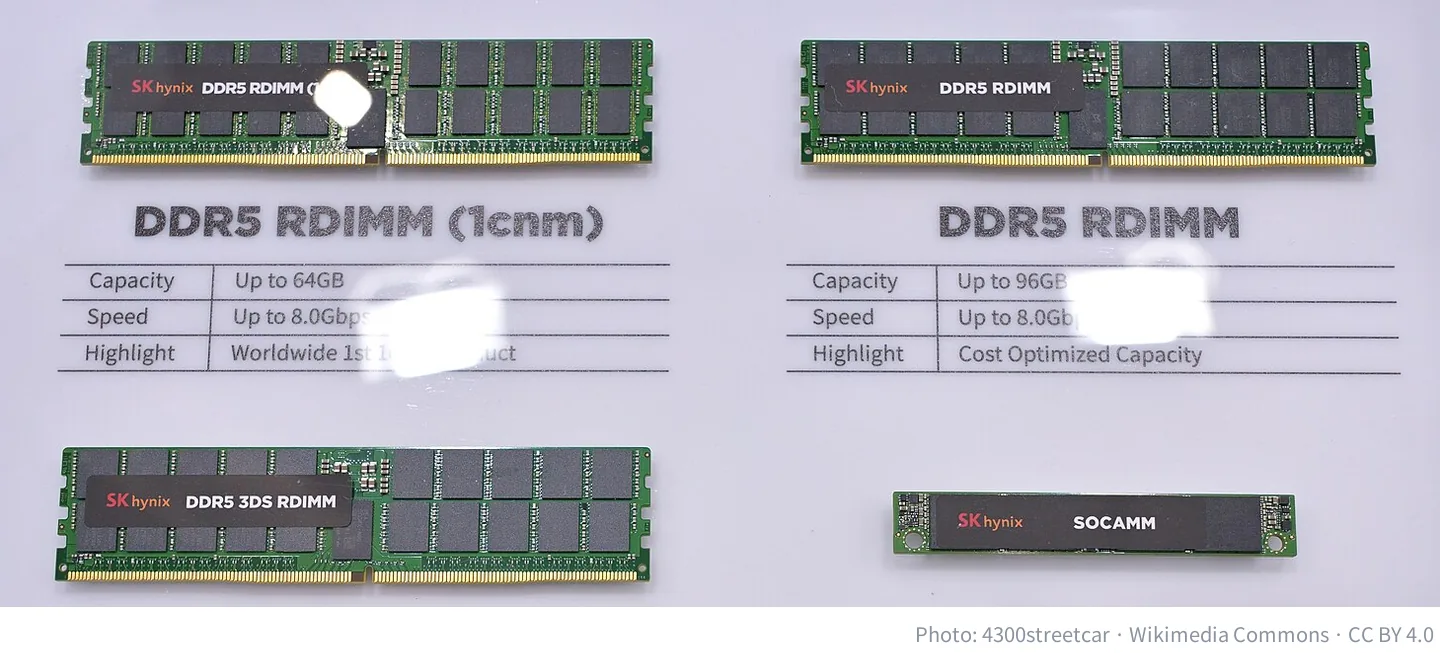
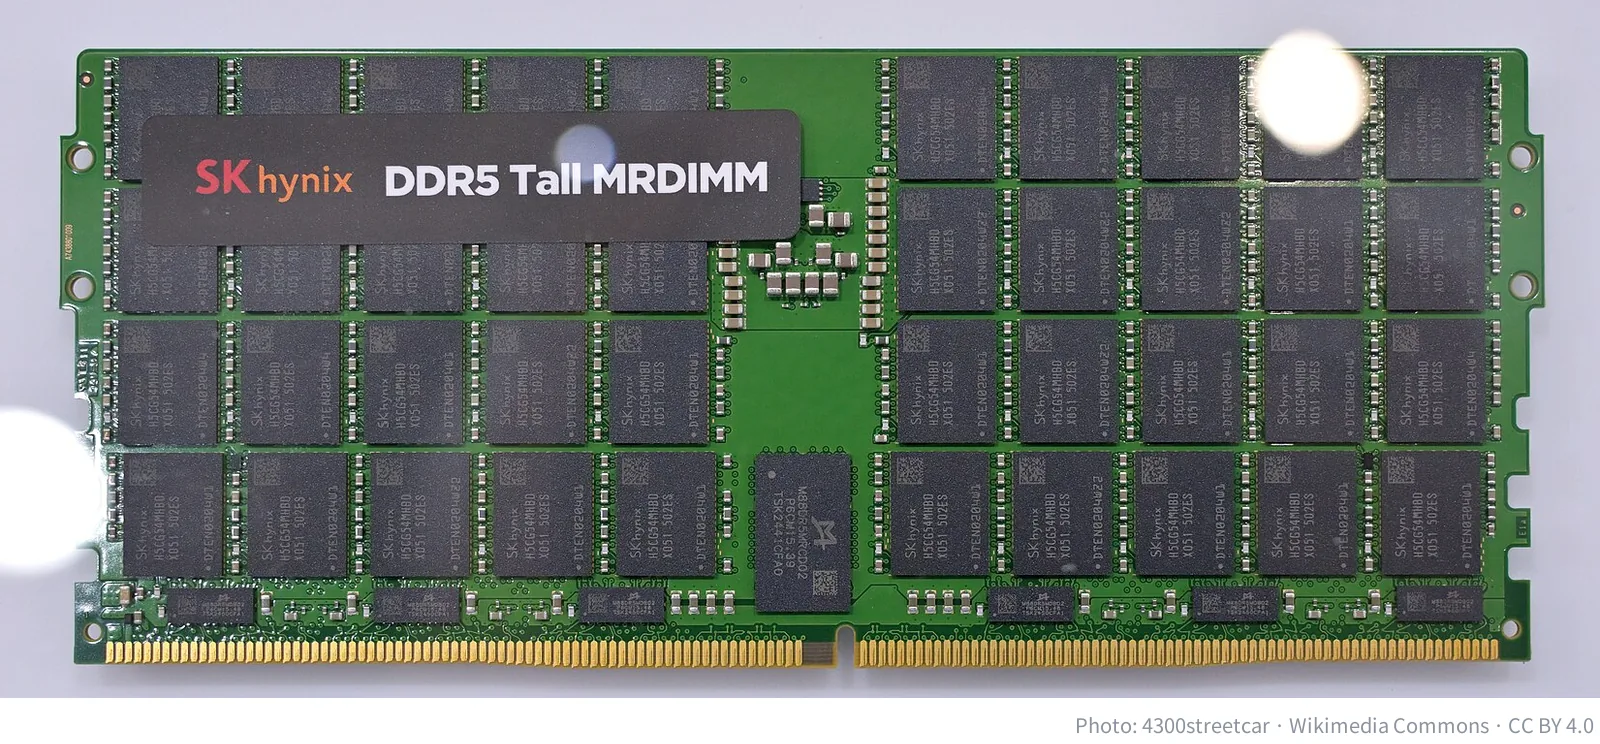
The photo shows several DDR5 memory module form factors displayed by SK hynix at Computex 2025. As the prices of products like these multiplied this year, so did the two companies’ profits. By WiseReport consensus, 2026 net profit attributable to shareholders is expected to be KRW 303.6tn (about $226.0bn) for Samsung Electronics, 6.85 times 2025’s KRW 44.3tn, and KRW 255.7tn (about $190.3bn) for SK hynix, 5.96 times KRW 42.9tn.
The share returned was put on one basis using Yahoo Finance cash flow statements: cash dividends plus share buybacks in the latest fiscal year, divided by net income. In 2025 SK hynix returned 3.9%, all in dividends, with no buybacks. Samsung Electronics returned 40.9%, of which dividends were 54.7% and buybacks 45.3%. Overseas, Applied Materials returned 89.7%, ASML 88.5%, Tokyo Electron 73.4%, Lam Research 70.5% and KLA 69.3%, a median of 73.4% for the five equipment makers. Advantest returned 40.0%, Nvidia 34.2%, TSMC 27.5% and Micron 6.1% (Micron’s fiscal 2025 ended in August; over the previous three years combined it returned 65.0%).
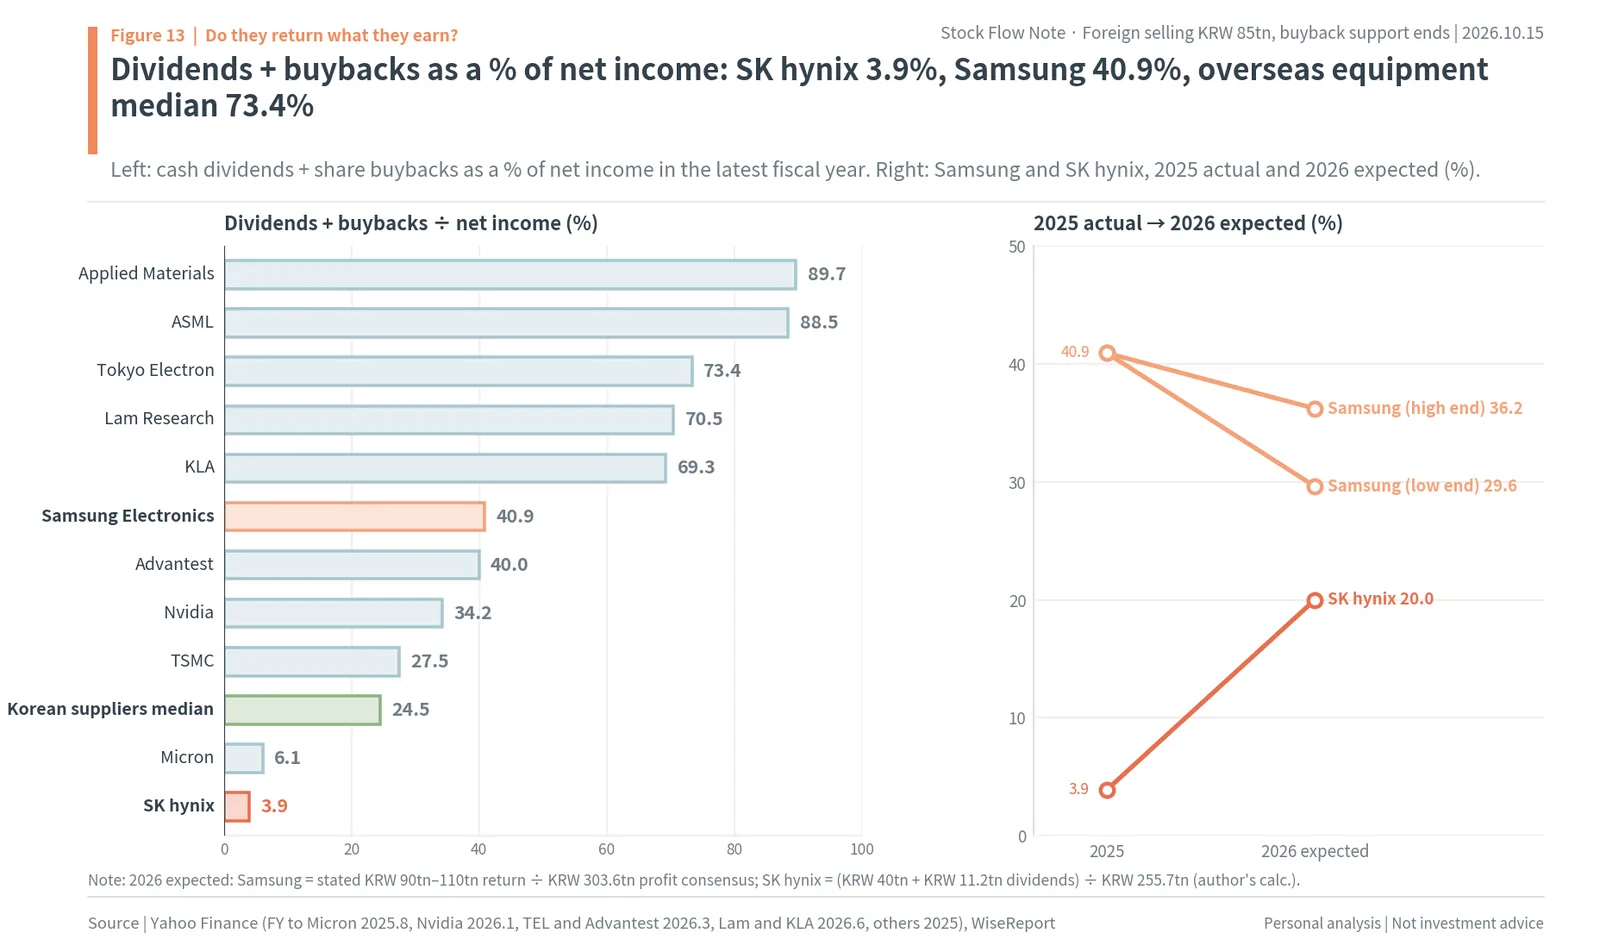
The numbers change in 2026, but the gap remains. On August 21 Samsung Electronics put its 2026 shareholder return at KRW 90tn to 110tn (about $67.0bn to $81.9bn), which is 50% of cumulative 2024-2026 free cash flow (FCF) minus the KRW 29.3tn already returned (Korea Economic Daily). Divided by expected 2026 net income of KRW 303.6tn, that is 29.6% to 36.2% (author’s calculation). For SK hynix, the KRW 40tn buyback plus the KRW 11.2tn dividend consensus, divided by KRW 255.7tn, is 20.0%. As the right panel shows, SK hynix rises from 3.9% to 20.0%, while Samsung’s ratio actually falls because its profit grows faster.
Among 20 profitable Korean chip materials, parts and equipment makers (known in Korea as sobujang), the 2025 median was 24.5%, and 12 were below 30%. That is less than half of what overseas equipment makers return, 70% to 90% of profits through dividends and buybacks with cancellation. The criticism has been made in the market as well. An October 12 Hankook Ilbo column contrasted employee bonuses in the hundreds of millions of won with small dividends for shareholders, and on October 13 UK-based Palliser Capital asked Samsung Electronics to buy back and cancel its preferred shares (Maeil Business).
Samsung Electronics’ 2026 buybacks have one more point to note. The KRW 15tn it bought from August 24 to October 6 (56,856,305 shares at an average of KRW 263,823, about $196) is for employee stock compensation and will not be cancelled (DART result report). Since the share count does not fall, remaining shareholders’ stakes do not grow. The company disclosed that when it calculates 50% of FCF, it also deducts spending on employee stock compensation from FCF.
Stocks that returned more fell less: top third -14.5%, bottom third -29.2%
The author tested with a cross-section whether this was tied to foreigners’ choices. The 101 companies among the top 100 KOSPI stocks by market cap and the chip materials, parts and equipment makers that were profitable in 2025 were split into three groups (thirds) of 34, 33 and 34 companies by dividends plus buybacks as a share of net income. The top third, which returned the most (median 53.8%), had a median share price change of -14.5% from June 22 to October 15 (6/22 → 10/15), while the bottom third (median 7.8%) had -29.2%. The middle third (29.6%) had -29.7%.
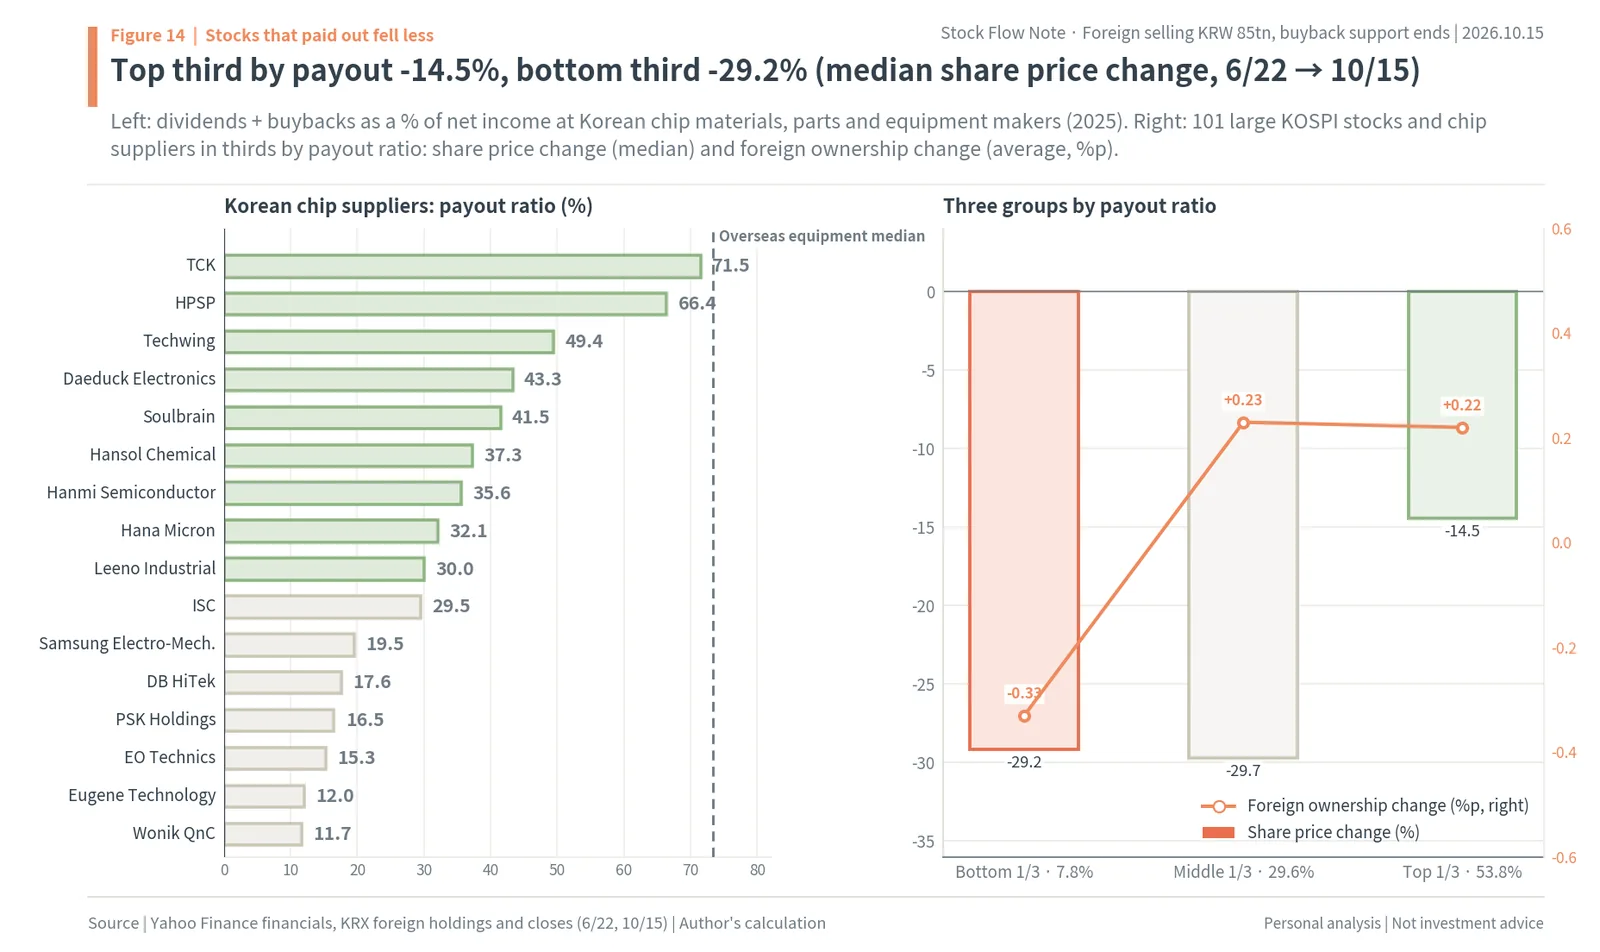
Changes in foreign ownership pointed the same way. Over the same period foreign ownership changed by an average of -0.33 percentage points in the bottom third, +0.23 points in the middle third and +0.22 points in the top third (KRX, author’s calculation). The gap in ownership changes was smaller than the gap in share prices, but the direction was the same. The record that, in the same falling market, companies that returned their earnings fell only half as much shows what foreigners look at when they decide to stay or leave.
Among the suppliers in the left panel, those above 30% were TCK 71.5%, HPSP 66.4%, Techwing 49.4%, Daeduck Electronics 43.3%, Soulbrain 41.5%, Hansol Chemical 37.3%, Hanmi Semiconductor 35.6%, Hana Micron 32.1% and Leeno Industrial 30.0%. Wonik IPS (2.9%), Isu Petasys (5.9%), Dongjin Semichem (11.6%) and Eugene Technology (12.0%) were on the low side. In October, the top foreign net purchases included suppliers such as Samsung Electro-Mechanics, Isu Petasys, Simmtech and Jusung Engineering (Maeil Business). Flows in suppliers followed each company’s earnings outlook, and the place where the gap in payouts showed up most in foreign flows was the two memory makers that move the index.
Buybacks were the support: when Samsung’s buying ended, daily swings nearly doubled
Right now, about the only thing the two companies do for shareholders is buy back shares. What that buying did to the shares has already been tested once inside this fall. Since June 22, company buying (other corporations) of KRW 52.08tn has absorbed 61.2% of the KRW 85.16tn of foreign selling and was more than twice retail’s KRW 24.89tn. For every share the companies bought, foreigners could sell and leave without pushing the price down.
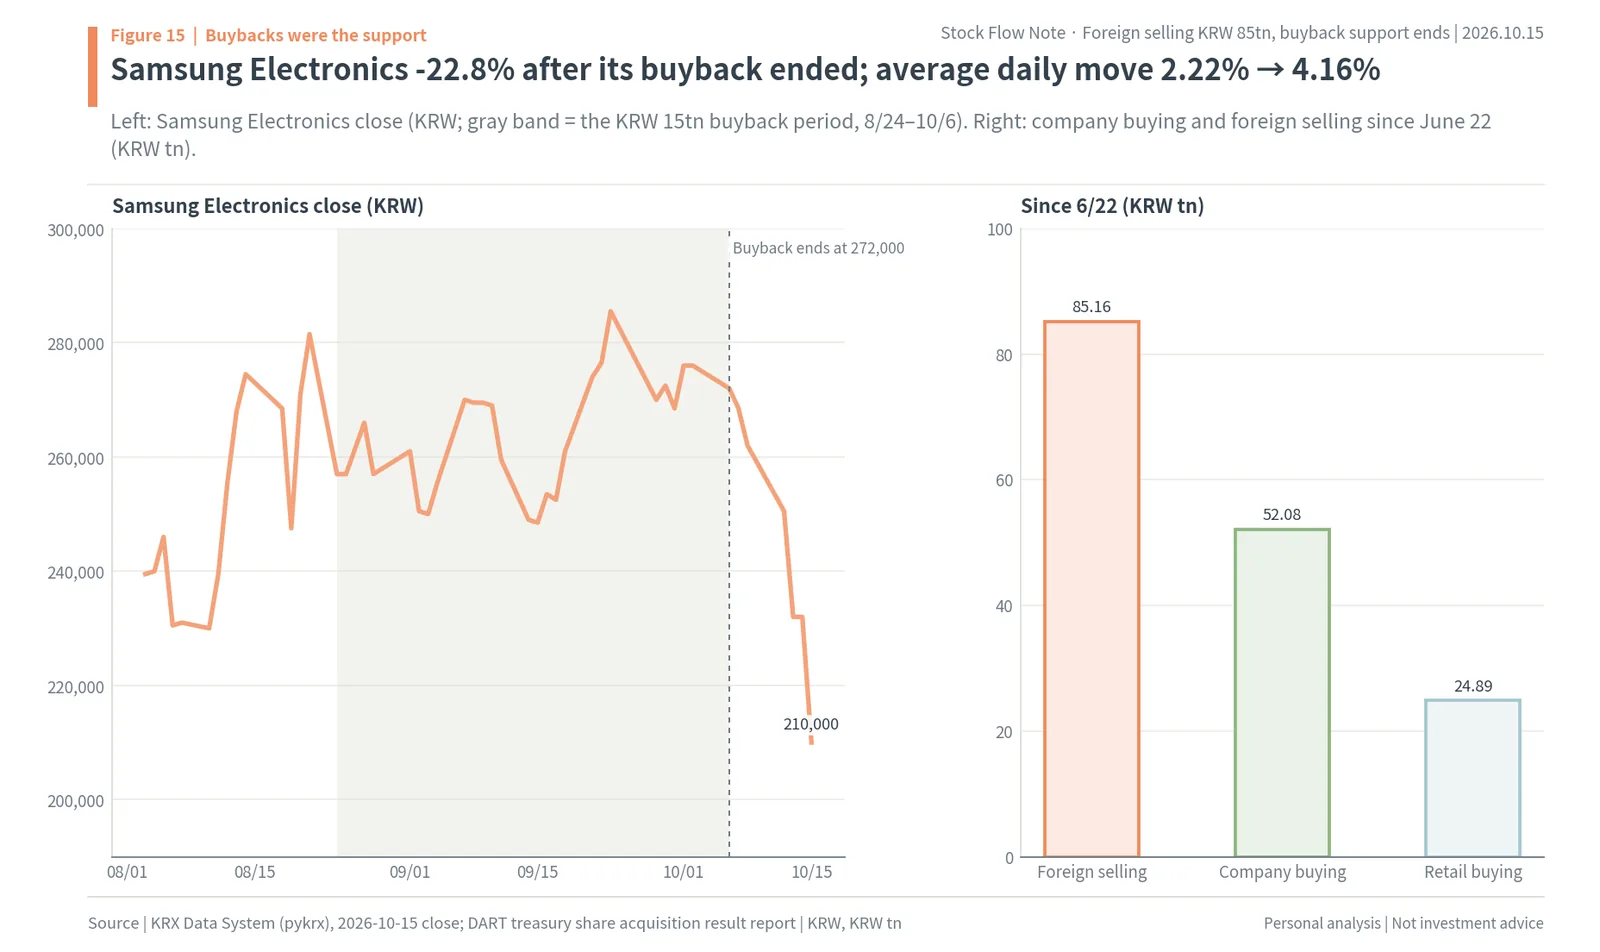
Samsung Electronics shows both the effect and the limit of that support. During the KRW 15tn buyback (August 24 to October 6), the shares stayed between KRW 248,500 and KRW 285,500, and, as calculated in the previous flow note, the average daily move fell from 5.40% in the 60 trading days before the buyback to 2.22% during it. From the October 6 close of KRW 272,000 (about $202), when the buyback ended, to KRW 210,000 on October 15 is -22.8%, against -20.0% for the KOSPI over the same days (author’s calculation). In the six trading days after the end, the average daily move was 4.16%, almost twice the level during the buyback.
So the buyback was a support that slowed the fall rather than something that lifted the shares. Even during the buyback, Samsung Electronics ended at KRW 272,000, below the KRW 281,500 of the day before it started, and the effect concentrates right after announcements: one analysis found the 65 buyback filings from September 1 to October 13 were followed by an average one-week return of +4.78% (Aju Business Daily). When the support goes, the selling that had been held back comes out in the price all at once. Samsung Electronics is at that stage now, and SK hynix enters it around October 21.
Samsung Electronics’ buyback record shows a drift toward compensation. All four of its 2017 purchases (a KRW 9.3tn program) were for cancellation. Its KRW 10tn program from November 2024 to September 2025 was split into a first tranche of KRW 3tn, all cancelled; a second of about KRW 3tn (about KRW 500bn for compensation and about KRW 2.5tn for share price stabilization); and a third of KRW 3,911.9bn (KRW 2,811.9bn for cancellation and KRW 1,100.0bn for compensation). All four rounds in 2026 (January, January-March, March-April and August-October) were for employee stock compensation (DART, previous flow note). The buybacks have grown, but what is left to shareholders through a smaller share count has actually shrunk.
Cancellation or compensation: what the resolution says decided the reaction
The share price reaction after buyback resolutions depended on their purpose. Looking at the excess return, the share price change minus the KOSPI’s, over the two days from the day after Samsung Electronics’ and SK hynix’s resolutions to acquire treasury shares, the six resolutions for cancellation had a median of +2.9 percentage points, and five of them rose. The four for employee compensation had a median of -2.0 points, and all four fell. Cancellation increases remaining shareholders’ stakes, while shares bought for compensation come back to the market later, so the market took the same buying differently.
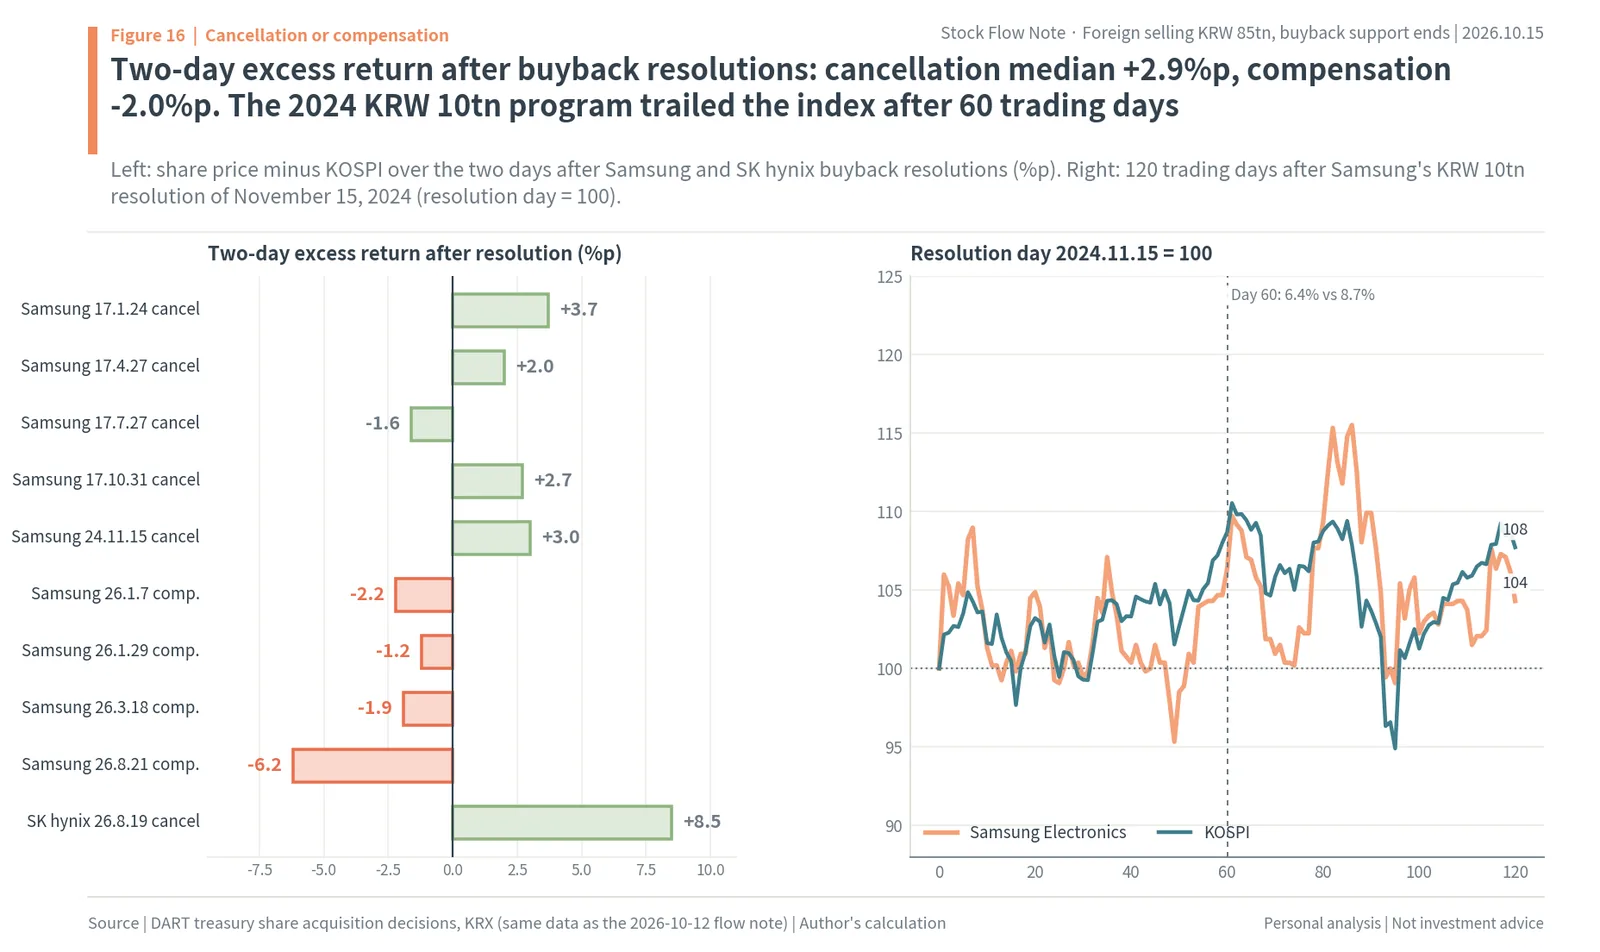
Samsung Electronics’ KRW 10tn resolution of November 15, 2024 (first tranche of KRW 3tn, all for cancellation) is a good test. The shares rose 5.98% the next trading day (Metro). But setting the resolution day = 100 and following 120 trading days, after 60 trading days Samsung Electronics was up 6.4%, less than the KOSPI’s 8.7% over the same period (author’s calculation). The first-day reaction was big, but the shares did not beat the index three months later. What ended the 2024 bottom was not the resolution itself but the turn in chip earnings forecasts and the return of foreigners that followed.
Put the two records together and there is one conclusion. A one-off buyback is a support that slows a fall; shares rise when the resolution is for cancellation and its size is tied to earnings. That is also why the two-day excess return was the largest, +8.5 points, on August 19, 2026, when SK hynix announced a KRW 40tn buyback, all to be cancelled, together with returns of at least 50% of FCF. Whether the next resolution follows this pattern will set the shape of this bottom.
The next support, when and how much: SK hynix on October 28, Samsung in January 2027
The nearest company money is SK hynix’s remaining buyback. From August 20 to October 15, other-corporations net buying in SK hynix was KRW 37.22tn, leaving KRW 2.78tn (about $2.1bn) to reach the KRW 40tn target. At the pace of the last five days (October 8 to 15), KRW 639.3bn a day on average, that takes 4.4 trading days, ending around October 21 (author’s calculation; press reports vary from the 16th to the 23rd). The deadline in the filing is November 19.
Next is October 28. SK hynix has disclosed that it will hold its third-quarter earnings conference call at 9 a.m. that day (KIND), and in August it said it would announce “the size and method of additional shareholder returns, including dividends and share buybacks,” with its third-quarter results. The company’s commitment is to return at least 50% of cumulative 2025-2027 FCF. Taking 50% of the WiseReport FCF consensus (KRW 25.9tn for 2025, KRW 166.2tn for 2026 and KRW 265.1tn for 2027) and subtracting the KRW 40tn and the 2025 and 2026 dividends leaves KRW 42.6tn (about $31.7bn) on a through-2026 basis and KRW 175.2tn (about $130.4bn) on a through-2027 basis (author’s calculation). Some in the brokerage industry expect additional buybacks of at least KRW 30tn (Asia Today).
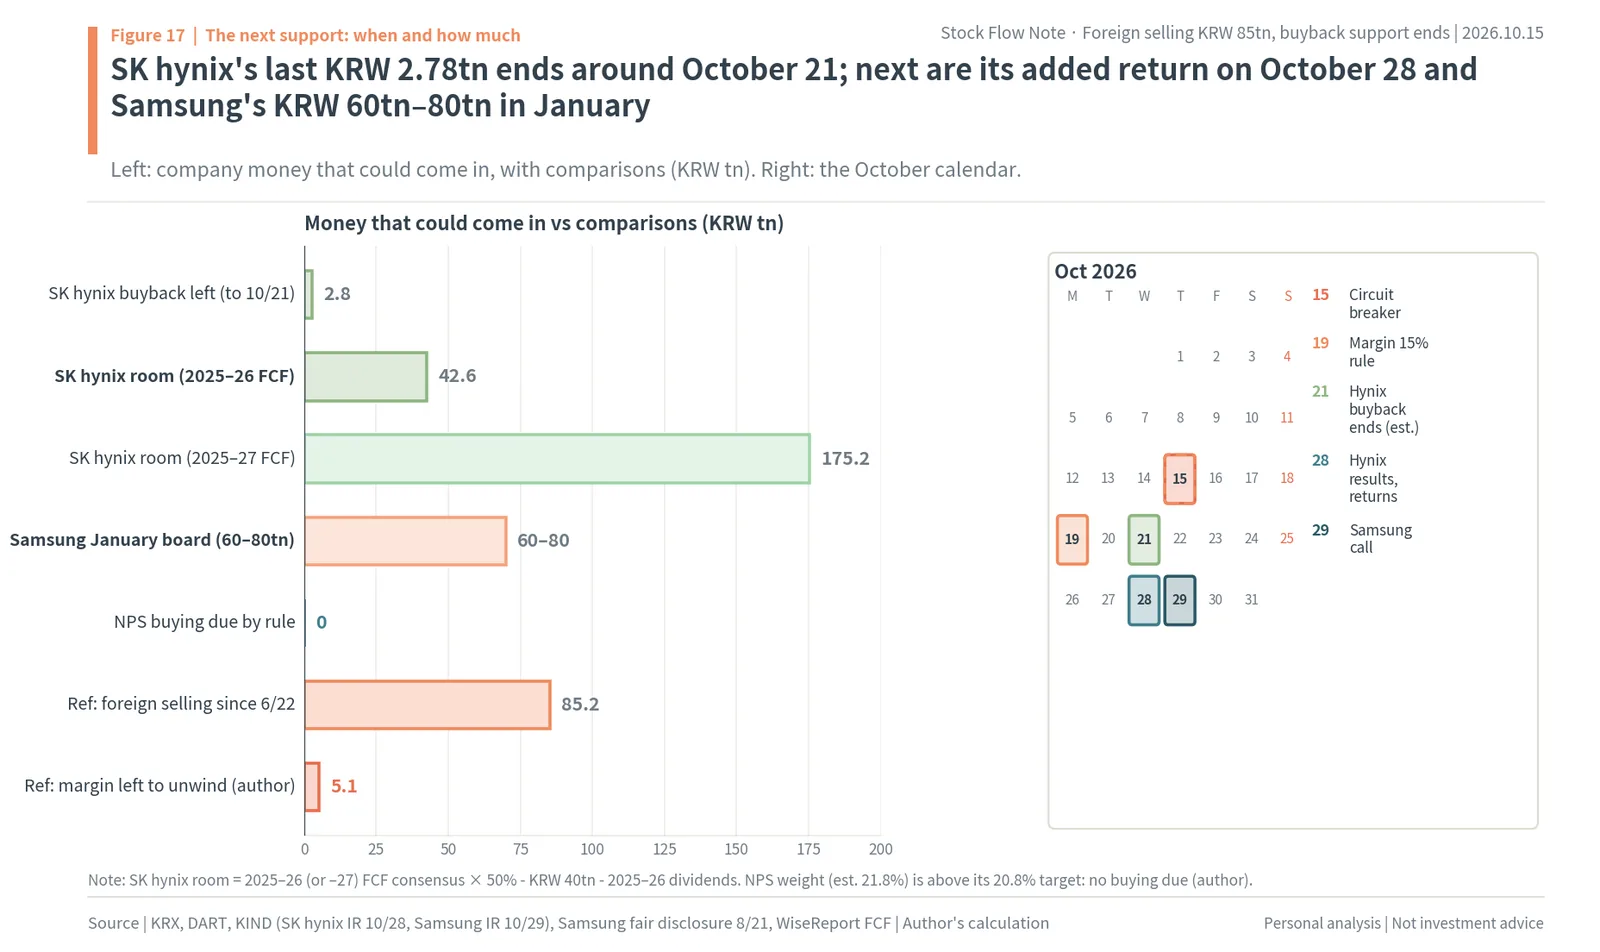
Samsung Electronics holds its conference call at 10 a.m. on October 29, and its board will confirm a third-quarter cash dividend of about KRW 30tn (about $22.3bn) at the end of October. How the remaining KRW 60tn to 80tn (about $44.7bn to $59.5bn) of the KRW 90tn to 110tn 2026 return will be paid, in cash dividends or in buybacks and cancellation, will be decided at a board meeting in January 2027 (Korea Economic Daily, KIND fair disclosure). Between the end of buying on October 6 and the January board meeting lies a gap of more than three months, and the KRW 30tn third-quarter dividend is cash paid out to shareholders, not money that buys shares in the market.
Compared by size, SK hynix’s remaining KRW 2.78tn is small next to the KRW 52.08tn of company buying so far. Adding SK hynix’s KRW 42.6tn of room through 2026 and the KRW 60tn to 80tn from Samsung’s January board gives a sum about the same size as the KRW 85.16tn foreigners have sold since June. In the end, whether SK hynix on October 28 and Samsung in January 2027 choose buybacks centered on cancellation or dividends will set the size of the next support. Even for the same amount, buying in the market becomes support in the flow data; dividends do not.
Market cap makes the size clearer. At the October 15 close, common-share market cap is KRW 921.9tn (about $686.2bn) for SK hynix and KRW 1,227.7tn (about $913.8bn) for Samsung Electronics. SK hynix’s KRW 42.6tn of room is 4.6% of its market cap, and KRW 175.2tn through 2027 is 19.0%. Samsung’s KRW 60tn to 80tn from the January board is 4.9% to 6.5% of its market cap (author’s calculation). If all of this came as buybacks for cancellation, the share count would shrink by that much and remaining shareholders’ earnings per share would rise by roughly the same percentage. If it came as dividends, the share count stays the same and only cash goes to shareholders.
Will the National Pension Service buy? Still above its 20.8% target
After the 2004 bottom, pension funds were the biggest buyers, and in 2008 and 2011 the National Pension Service (NPS), Korea’s public pension fund, net bought about KRW 18tn and KRW 12.8tn of domestic stocks respectively (Yonhap). So whether the pension fund will absorb the selling this time draws attention. At the end of July the NPS fund was KRW 1,684.17tn (about $1.25tn), with domestic stocks of KRW 418.56tn, a weight of 24.9% (Financial News). Its domestic equity target was raised from 14.9% in January to 20.8% on May 28 and stays at 20.8% for 2027 (BizWatch).
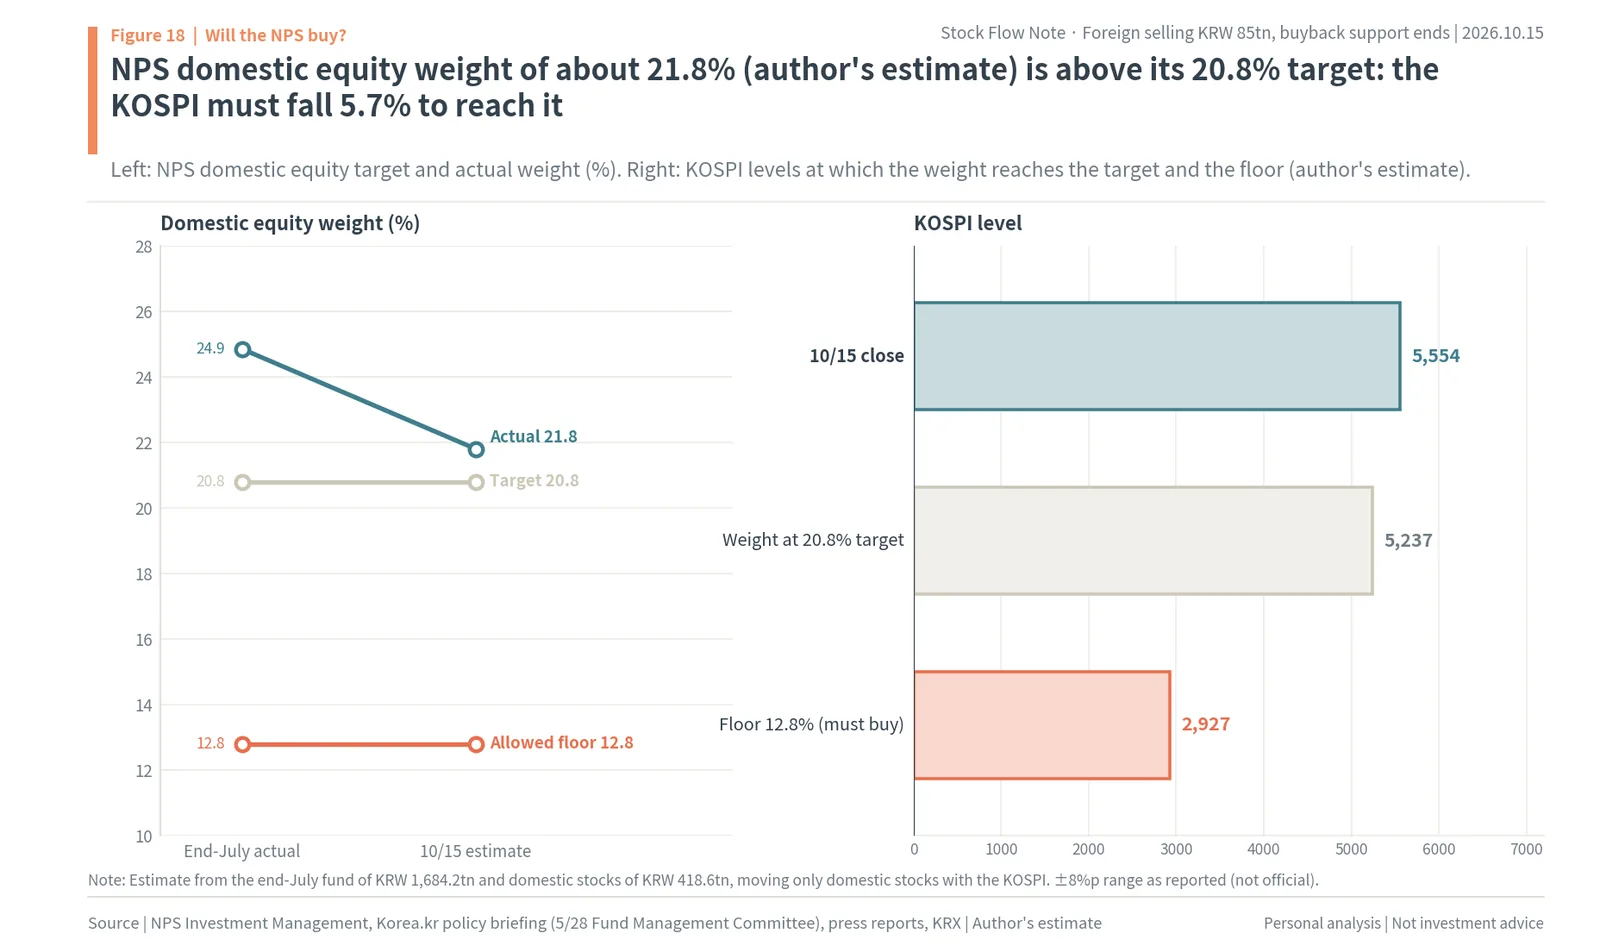
Assuming that since the end of July only domestic stocks moved with the KOSPI and other assets stayed the same, the domestic equity weight on October 15 is estimated at about 21.8% (author’s estimate), still 1 percentage point above the 20.8% target. For the weight to reach the target, the KOSPI would have to fall 5.7% from here to 5,237; the level at which it would hit the 12.8% floor the market estimates (target ±8 points; the formula is not disclosed), where the rules would require buying, is 2,927. By the rules, the pension fund has little reason to absorb the fall. In fact pension funds have net sold KRW 0.61tn since June 22 and KRW 9.03tn this year (KRX).
Conversely, there is room to buy up to the upper limit (market estimate 28.8%), and Daishin Securities calculated a maximum buying capacity of KRW 87.9tn as of the end of July (Newsis). If the pension fund does buy, it will have to be a decision of its Fund Management Committee rather than the rules, and the date to watch is whether the December committee meeting revisits the domestic equity weight. One percentage point of weight is about KRW 16.2tn (about $12.1bn) at the current fund size (author’s estimate).
Other money: the market stabilization fund, idle cash and the conditions for foreigners
There is a market stabilization fund, the KRW 10.76tn committed by 27 institutions in March 2020 (the “Dahamkke Korea Fund”), but it has never been activated, and the cash it could use immediately was about KRW 120bn as of 2024 (Invest Chosun). On October 15 the Financial Services Commission said at an emergency meeting with related agencies that it would “prepare to swiftly implement contingency plans if needed” (Hankyoreh). For that to become actual buying money, the committed institutions would first have to pay in again.
There is plenty of money waiting outside the stock market. Money market fund (MMF) principal was KRW 258.76tn on September 16 (Maeil Business), and time deposits at commercial banks have grown by about KRW 75tn since May to more than KRW 1,012tn, at an average one-year rate of 3.4%. In the third quarter, individuals sold KRW 5,590.2bn of Korean stocks and bought $7.6bn (about KRW 10,146.8bn) of US stocks (Financial News), and their US stock holdings rose again to $200.2bn on October 5. For this money to come back, the expected return on stocks has to beat the 3% to 5% available without risk.
Brokerages generally name three conditions for foreigners to return. Daishin Securities points to daily foreign net selling falling below KRW 1tn and the two chipmakers announcing new returns; Hyundai Motor Securities points to the November 3 US midterm elections and October chip earnings (Edaily, Herald Economy). Even while selling shares, foreigners bought KRW 9.7tn of ETFs this year and KRW 1.99tn of futures from October 12 to 14 (Maeil Business). They have not dumped Korea wholesale; they have cut their weight in chip stocks, and the case for restoring it is how many years memory profits have left and a formula for getting those profits returned.
After one-day falls of 7%: 10 of 12 episodes made a lower low
To gauge in numbers what happens this time, we need past dates that resemble now. The four chip-peak episodes were neither this deep nor this fast, so the author adds one more yardstick. Since 1997 the KOSPI has fallen more than 7% in a day 25 times; grouping falls that came within 20 trading days of each other into one episode gives 12 episodes, not counting today (late 1997, June 1998, July 1999, April 2000, September 2000, September 2001, June 2002, October-November 2008, March 2020, August 2024, March 2026 and June-July 2026). Each episode’s last crash day is set to 100, and what followed is traced.
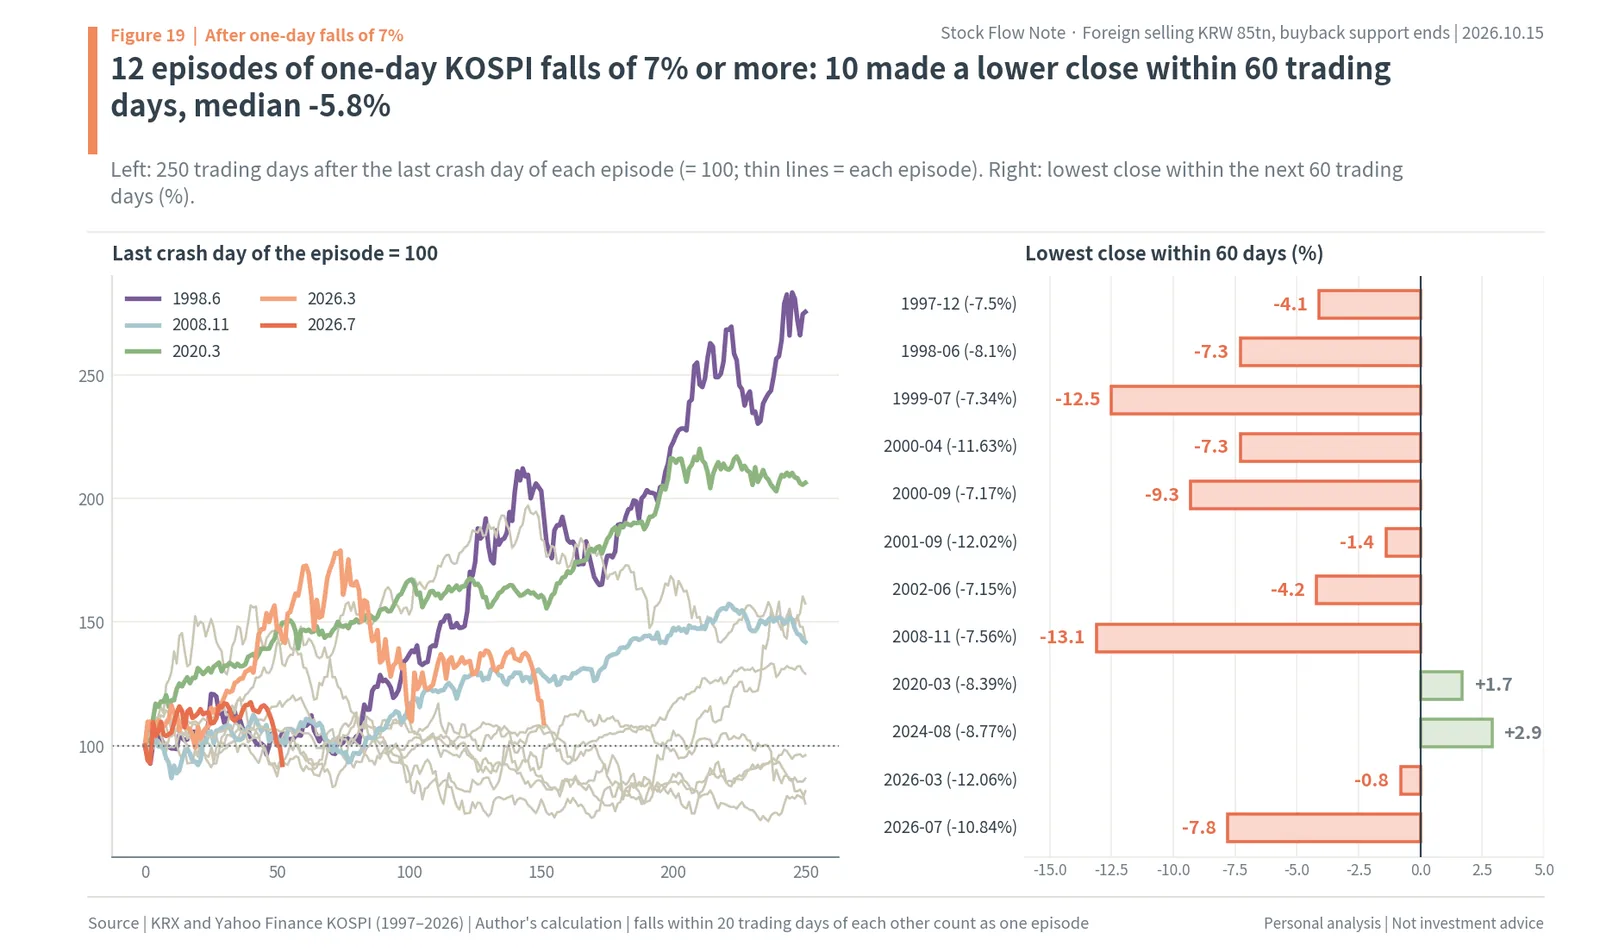
The first fact is that the last crash day was not the bottom. In 10 of the 12 episodes the close went lower again within 60 trading days (three months), with a median lowest close of -5.8%. The two that did not go lower were March 2020 (+1.7%) and August 2024 (+2.9%). Some fell by double digits more, such as July 1999 (-12.5%) and November 2008 (-13.1%) (author’s calculation).
The second fact is the direction afterward. Median returns from the last crash day were +5.0% after 20 trading days, +8.6% after 60, +8.7% after 120 and +35.5% after 250. After 250 trading days the KOSPI was higher in 6 of 10 cases, by +175.5% after June 1998 and +106.4% after March 2020. The 4 that were lower were July 1999 (-23.5%), April 2000 (-18.4%), September 2000 (-13.3%) and June 2002 (-3.9%), all in 1999-2002 as the IT bubble deflated. Because this fall is a correction of AI expectations, these four are the closest pessimistic cases.
So what now: debt unwinding and a gap in support overlap for one to two months
Judging the present by this report’s chain, the heavy foreign selling and its absorption by retail and companies are behind us. The unwinding of debt is under way, and new money has not yet arrived. To reach the median margin-loan decline at past bottoms (-26.0%), margin loans would have to fall to about KRW 28.59tn, 74.0% of the KRW 38.63tn peak, which means about KRW 5.12tn (about $3.8bn) more has to be unwound from the current KRW 33.71tn (author’s calculation). Forced sales rising to KRW 89.3bn on October 14 and new margin loans being capped from October 19 are signs that this unwinding has begun.

The ranges by horizon apply the returns after those 12 episodes to the October 15 close of 5,554.22, taking the 25th, 50th and 75th percentiles as the low, median and high. One month: 5,488 to 6,115 (median 5,832). Three months: 5,621 to 7,559 (median 6,032). Six months: 5,504 to 7,876 (median 6,037). Twelve months: 4,943 to 8,542 (median 7,526) (author’s calculation). Applying the median further low within three months (-5.8%) gives 5,232. These ranges assume that the paths after past crashes repeat; they are not index targets.
The author sees three paths. On the low path, SK hynix’s buyback ends around October 21, its October 28 additional return is dividend-heavy or small, and the gap in company buying lasts until January. Then the KRW 5tn of debt unwinding proceeds with no support, and the market could test below 5,200 again within three months. On the base path, SK hynix announces additional buybacks centered on cancellation on October 28, company buying resumes, and the bottom is built around year-end as the debt unwinding finishes. On the high path, the two companies switch to payout formulas tied to earnings and the pace of foreign selling turns, and, as in 2004 or 2025, foreign and ETF money ends the bottom.
Laid over the ranges by horizon, the low path runs toward 5,488 at one month and 4,943 at twelve months, passing the 5,232 median further low within three months. The base path follows the medians: 5,832 at one month, 6,032 at three months and 7,526 at twelve months. The high path runs toward 6,115 at one month, 7,559 at three months and 8,542 at twelve months. Since the twelve-month range on all three paths sits below the June peak of 9,115, the author believes regaining the peak will take more than a year (author’s view).
Bottom signals: none of the four gauges is lit yet
The conditions of past bottoms are set out here as four gauges. First, debt unwinding: the decline in margin loans has reached 49% of the median at past bottoms (-12.8% ÷ -26.0%). Second, foreign selling: the 20-trading-day net selling of -KRW 35.51tn is half of June’s maximum (-KRW 69.06tn), so this too is about halfway. Third, company buying: only KRW 2.78tn, or 7%, of SK hynix’s KRW 40tn is left, so the support is nearly used up. Fourth, forced-sale pressure: forced sales at 7.2% of unpaid settlements are 69% of this year’s maximum (10.5%) (author’s calculation).
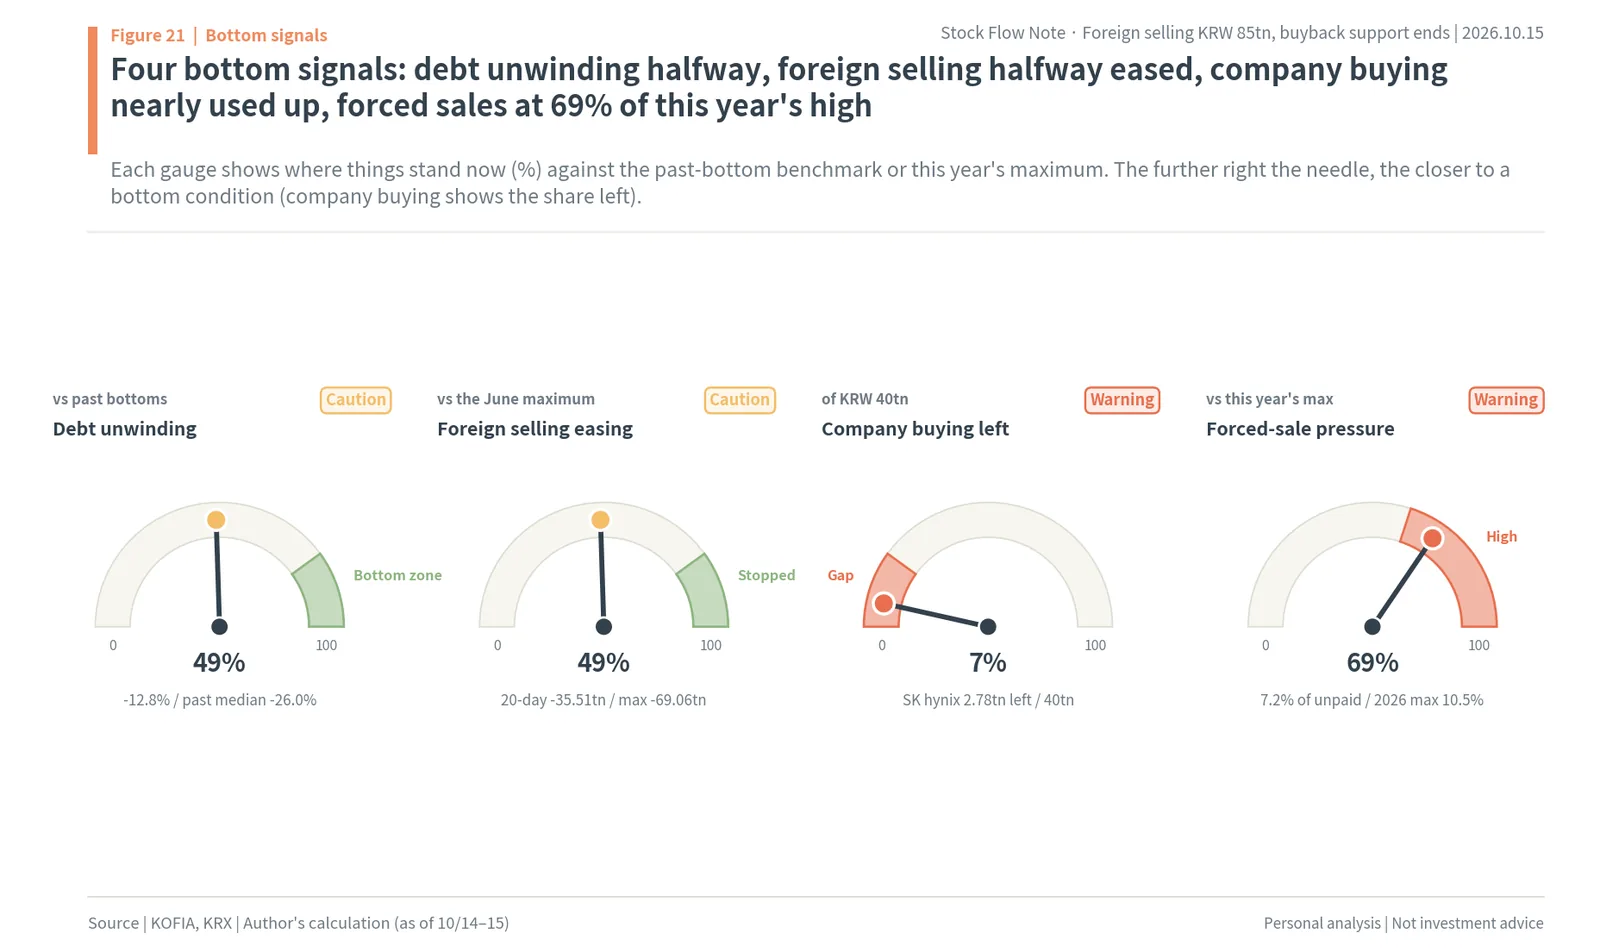
At the four past bottoms, the bottom came when two gauges, debt unwinding finishing and foreign selling stopping, reached the right end. Now both gauges sit in the middle, the support of company buying is emptying, and forced selling is growing. So the author sees the next one to two months as the stretch in which the bottom is built, and October 28 as the first date that could shorten it. The bottom comes when the debt is flushed out and new support arrives.
Dates to watch: October 19, 21, 28 and 29, and January 2027
On October 19 the rule that margin loans in a single stock may not exceed 15% of a brokerage’s total margin loans takes effect for new loans. Around October 21 SK hynix’s KRW 40tn buyback ends (author’s calculation; the deadline in the filing is November 19). The Bank of Korea’s Monetary Policy Committee meets on October 22, and the US Federal Open Market Committee (FOMC) on October 27-28. Then come SK hynix’s third-quarter results and additional returns at 9 a.m. on October 28, Samsung Electronics’ third-quarter conference call at 10 a.m. on October 29, and the confirmation of its roughly KRW 30tn third-quarter dividend at its board meeting at the end of October.
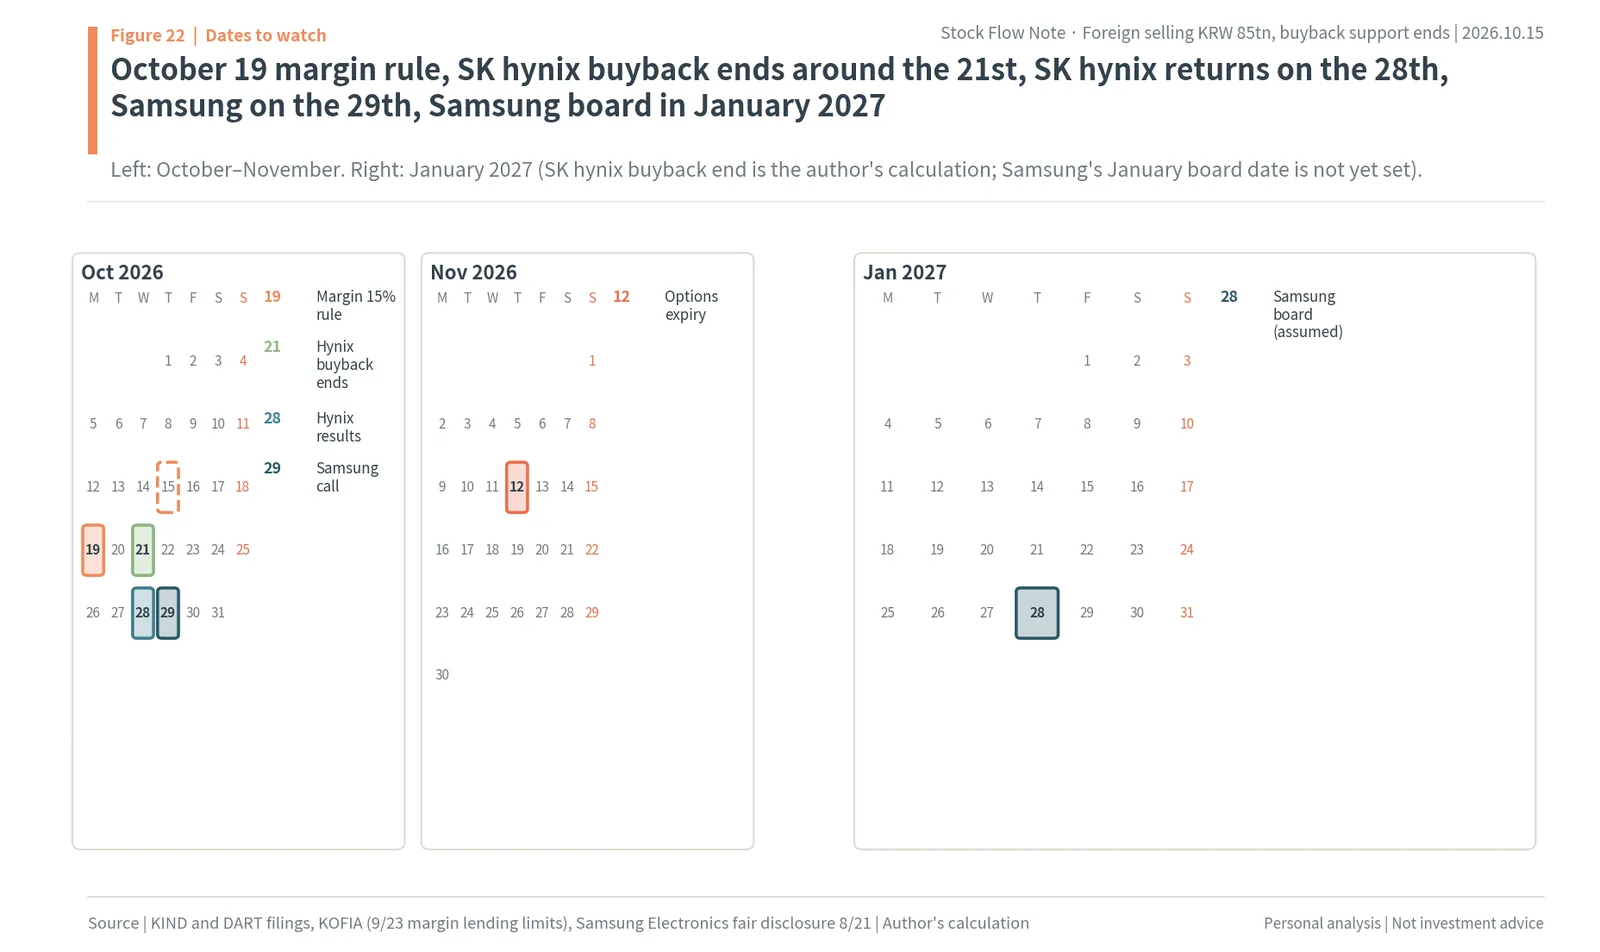
Next are the US midterm elections on November 3, KOSPI 200 options expiry on November 12, and the NPS’s disclosure of its August fund performance at the end of October. In December the NPS Fund Management Committee reviews the allowed range for domestic stocks again. In January 2027 Samsung Electronics’ board will decide how to split the remaining KRW 60tn to 80tn of its 2026 return between cash dividends and buybacks with cancellation (the date is not yet set; the figure assumes January 28). KOFIA’s margin and forced-sale statistics come out a day late, so forced selling from the October 13-15 plunges should be checked in the October 15-19 data.
Data and methods: how the numbers were calculated
Flows use KRX trading by investor type (KOSPI, 12 groups), with foreigners and other foreigners combined. The period after the June 22 peak is the 77 trading days from June 23 to October 15. The shares absorbed were divided by the total of the groups with positive net buying over the period (KRW 93.76tn). October 15 values are confirmed figures downloaded again at 6:27 p.m., after the close. KOSPI foreign ownership on June 22 and October 15 is the sum over stocks of foreign-held shares ÷ listed shares × market cap, divided by total market cap.
Past episodes take as day 0 the day the combined market cap of Samsung Electronics and SK hynix (KRX, from 1999) peaked, and as the bottom the day of the lowest KOSPI close after it (search windows ran to June 2001 for the 2000 episode, March 2005 for 2004, June 2019 for 2017-2019, March 2023 for 2021-2022 and April 2025 for 2024-2025). KOSPI closes before 2003 are from Yahoo Finance. The 60 trading days after the bottom are counted from the day after the bottom. Margin loans and deposits are KOFIA freesis daily values (in KRW mn) converted to KRW tn.
Payout ratios add cash dividends paid and share buybacks from Yahoo Finance cash flow statements and divide by net income attributable to shareholders for the same fiscal year. Korean companies use 2025; overseas companies use their latest fiscal year (Micron August 2025, Nvidia January 2026, Tokyo Electron and Advantest March 2026, Lam Research and KLA June 2026). The supplier median uses the 20 companies profitable in 2025. The cross-section splits the top 100 KOSPI stocks by market cap (as of June 22) and the suppliers, 101 companies that were profitable with ratios below 300% (preferred shares excluded), into three groups in order of the ratio.
SK hynix’s remaining buyback treats total other-corporations net buying since August 20 as company buying and subtracts it from KRW 40tn. Its room is WiseReport FCF consensus × 50% minus the KRW 40tn, the actual 2025 dividend (KRW 3,000 a share) and the 2026 dividend consensus (KRW 15,294 a share). The NPS weight is an estimate from the end-July disclosure assuming only domestic stocks moved with the KOSPI. The ranges by horizon multiply the 25th, 50th and 75th percentiles of returns 20, 60, 120 and 250 trading days after the last crash day of the 12 episodes of one-day falls of 7% or more since 1997 (12, 11, 11 and 10 observations) by the October 15 close. The won-dollar rate is Yahoo Finance’s KRW 1,343.55 for October 15.
Maochaedung’s take. Foreigners have sold KRW 85.16tn of KOSPI stocks since the June 22 peak, and Samsung Electronics’ and SK hynix’s own buybacks took 55.5% of what was bought. That support ended on October 6 at Samsung and ends around October 21 at SK hynix, while margin loans are down only 12.8% against a past-bottom median of 26.0%. The author sees the next one to two months as the time the bottom is built, and October 28 and January 2027 as the dates that decide whether new support comes. Foreigners come back for a payout formula tied to earnings, not for one more buyback.
KOSPI foreign selling FAQ
Q. How much have foreigners sold in the Korean stock market?
From June 23 to October 15, 2026, foreigners (including other foreigners) net sold KRW 85.16tn (about $63.4bn) of KOSPI stocks, and 85.7% of it was Samsung Electronics and SK hynix. For the whole year through October 15, foreign net selling was KRW 207.92tn. On October 15 alone, when the KOSPI fell 7.57% to 5,554.22, foreigners sold KRW 3.77tn.
Q. Who bought the shares foreigners sold?
Korea’s exchange publishes net buying by investor type every day. Since June 22, other corporations, mostly Samsung Electronics and SK hynix buying back their own shares, took 55.5% of what was bought (KRW 52.08tn), retail 26.5% (KRW 24.89tn) and financial investment, which includes ETF liquidity providers, 15.1% (KRW 14.13tn).
Q. Why does the end of the buybacks matter?
Company buying was the largest support, equal to 61.2% of foreign selling. Samsung Electronics’ KRW 15tn buyback ended on October 6, and in the six trading days after, its average daily move rose from 2.22% to 4.16% and the stock fell 22.8%. SK hynix’s KRW 40tn buyback has KRW 2.78tn left and ends around October 21 (author’s calculation).
Q. How did past chip-stock selloffs in Korea end?
In four past episodes (2004, 2017-2019, 2021-2022, 2024-2025) the KOSPI bottomed 20.7% to 31.5% below its level on the chip-peak day. Each bottom came after margin loans had fallen 17.1% to 33.1% from their peak and new money from pension funds, foreigners or financial investment came in; retail was a net seller in the 60 trading days after all four bottoms.
Q. What are the KOSPI ranges and dates to watch?
Applying returns after 12 past episodes of one-day falls of 7% or more to the October 15 close gives 5,488 to 6,115 in one month and 4,943 to 8,542 in twelve months (author’s calculation; not index targets). Dates to watch are October 19 (single-stock margin rule), around October 21 (end of SK hynix’s buyback), October 28 (SK hynix results and additional returns), October 29 (Samsung call) and Samsung’s January 2027 board on the remaining KRW 60tn to 80tn.
Sources
- Korea Exchange (KRX) Data System, KOSPI trading by investor type in 12 groups (2004-2026), net buying by investor in Samsung Electronics and SK hynix, market cap and foreign holdings (pykrx, as of the 2026.10.15 close)
- Korea Financial Investment Association (KOFIA) freesis, investor deposits, credit balances, unpaid settlements and forced sales (1998 to 2026.10.14)
- Yahoo Finance, KOSPI (before 2003), Philadelphia Semiconductor Index, Micron and Nvidia closes, KRW/USD, and cash flow and income statements of Korean and overseas chip companies (downloaded 2026.10.15)
- WiseReport, Samsung Electronics and SK hynix annual consensus (net income, FCF, dividends; retrieved 2026.10.15)
- Newsis, “Black Thursday” as KOSPI and KOSDAQ fall more than 7% (link), 2026.10.15
- Newsis, Warning light on debt-funded AI investment as CoreWeave falls 15.5% (link), 2026.10.15
- Yonhap News, Investor deposits fall below KRW 100tn as forced sales jump to about KRW 90bn a day (link), 2026.10.15
- Hankyoreh, Financial Services Commission: share price fall excessive, contingency plan if needed (link), 2026.10.15
- Euronews, What happened to OpenAI’s $20bn? Revenue scare rattles AI trade (link), 2026.10.09
- Herald Economy, Single-stock leveraged ETFs and financial investment net buying (link), 2026.06.02
- Korea Economic Daily, Samsung Electronics’ KRW 110tn-plus shareholder return (link), 2026.08.21
- SmartToday, SK hynix resolves KRW 40tn share buyback and cancellation (link), 2026.08.19
- KIND, SK hynix investor relations (IR) event notice (2026.10.28 09:00, filed 2026.10.14); Samsung Electronics IR event notice (2026.10.29 10:00, filed 2026.10.08)
- DART, Samsung Electronics treasury share acquisition result report (2026.10.12); SK hynix major-event report (decision to acquire treasury shares, 2026.08.19)
- Financial News, KRW 181tn evaporated in a month at the National Pension Service (link), 2026.10.08
- BizWatch, National Pension Service raises this year’s domestic equity weight (link), 2026.05.28
- Money Today, Not “Sell Korea” but “Sell Samsung Electronics” (link), 2004.04.30
- Kyunghyang Shinmun, Retail borrowing to invest back above KRW 10tn on market rebound (link), 2019.02.17
- Economist Korea, “K-stock bargain sale” as returning foreigners extend net buying to 11 days (link), 2022.10.18
- Etoday, Foreigners turn to “Buy Korea” for the first time in 10 months (link), 2025.06.12
- Photo 1: 4300streetcar, SK Hynix DDR5 Tall MRDIMM (Computex 2025), CC BY 4.0, Wikimedia Commons (link)
- Korea Times, CXMT’s new DRAM tech to test Korean memory makers’ dominance (link), 2026.10.13
- MTN, Wall Street falls on rising prices and AI investment burden (link), 2026.10.15
- SEC, Micron 8-K, fiscal Q4 2026 earnings press release (link), 2026.09.30
- TechNews (citing TrendForce), 4Q26 memory contract price outlook (link), 2026.09.30
- Korea Herald, Kospi down nearly 30% from peak (link), 2026.10.09
- SBS Biz, Debt-financed investing at a three-month high despite KOSPI falls (link), 2026.10.13
- Sateconomy, KOFIA and 10 large brokerages to manage credit lending within 90% of equity (link), 2026.09.23
- Money Today, The betrayal of 2x leveraged Samsung Electronics and SK hynix ETFs (link), 2026.07.17
- BizWatch, Has Samsung Electronics lost momentum? (link), 2017.11.28
- Aju Business Daily, Foreigners net sell KRW 4.6tn of stocks in October (link), 2018.11.12
- Korea Times, A 2017 deja vu? (link), 2021.08.15
- New Daily, Foreign ownership of the KOSPI at its lowest since the financial crisis (link), 2022.06.24
- Korea Economic Daily, The chip “grim reaper” warning (link), 2024.09.17
- Asia Economy, Foreign selling of Samsung Electronics stops after 34 days (link), 2024.10.29
- Kyunghyang Shinmun, Foreign investment trends in 2000 (link), 2001.01.26
- Maeil Business, National Pension Service rebalancing at the parliamentary audit and its target weight (link), 2026.10.14
- Newsis, Daishin Securities’ end-July weight estimate and buying capacity for the National Pension Service (link), 2026.08.03
- Kyeonggi Ilbo, Pension funds net sellers since August (link), 2026.10.15
- Invest Chosun, The stalled market stabilization fund (link), 2026.08.03
- Maeil Business, Money market funds at KRW 258tn (link), 2026.09.20
- Financial News, Individuals sold KRW 5.6tn of Korean stocks and bought KRW 10tn of US stocks (link), 2026.10.12
- Asia Today, SK hynix additional return of at least KRW 30tn expected, 2026.10.15; Aju Business Daily, 65 buyback filings and a 4.78% average one week later, 2026.10.14; Metro, Samsung Electronics up 5.98% after its KRW 10tn buyback announcement, 2024.11.18
- Edaily, Four triggers that could stop the foreign exodus, 2026.10.15; Herald Economy, Foreign return hard for now, November the watershed, 2026.10.15; Hankook Ilbo column, 2026.10.12; Maeil Business (Palliser Capital’s request), 2026.10.14
- Photo 2: 4300streetcar, SK Hynix DDR5 form factors (Computex 2025), CC BY 4.0, Wikimedia Commons (link)
Disclaimer
This post records the author’s personal analysis and views based on publicly available information and does not recommend any particular product or company. It does not recommend buying or selling any financial investment product and is not an investment advisory service.
Figures are as published at the time of writing. The depth and length of past episodes, the amount of margin debt left to unwind, the payout ratios, the expected end date of SK hynix’s buyback and its remaining return capacity, the estimated National Pension Service weight, the KOSPI ranges by horizon and the dollar conversions were calculated by the author from public data and market prices and are not confirmed forecasts. Accuracy and completeness are not guaranteed.
The ranges by horizon are calculations that assume the paths after past one-day falls of more than 7% repeat; they are not index targets. “Author’s calculation,” “author’s view” and “author’s estimate” mark the author’s own calculations and assumptions, not confirmed facts. This post does not recommend trading at any particular time or promise any return.
Author’s interests: not disclosed
Responsibility for decisions and their outcomes lies with the reader.
As of: October 15, 2026
Was this note useful?
Thanks. Your answer helps decide what to cover next.
Korea market snapshot · Oct 23, 2026
New to Korean stocks? Start here for the basics.
Most read
1France Protests 2026: Why Students Are Blocking Schools and Which Stocks Benefit (Munich Re, SCOR)
Get the Saturday note on Korean stocks
One email every Saturday with the week’s new research on Korean listed companies and links to the updated data pages. Built from DART filings and KRX data. Free; unsubscribe in one click. See past issues