Foreign Ownership in Korean Stocks and MSCI: Foreigners Sold KRW 207.6 Trillion, Yet Their Share Rose to 38%
In May 2010, Israel’s stock market left the MSCI Emerging Markets (EM) Index and moved up to developed market status. It was a promotion Israel had wanted for years. Yet once it moved, its share of the benchmark shrank from 3.17% of the EM index to 0.37% of the developed World index, and about $2 billion of equity money flowed out even though nothing about the economy had changed (World Bank). The Bank of Israel later reported that trading volume on the Tel Aviv Stock Exchange fell by about 44% between May 2010 and the end of 2012 (Times of Israel). For emerging market fund managers, Israel had been a country they had to own. For developed market managers, it became a small country they could skip without anyone noticing.
In 2026, Korea stands on the other side of that door. On September 30, Korea made up 21.4% of the MSCI Emerging Markets Index, second only to Taiwan (MSCI factsheet). Moved into the developed index with the same stocks and the same free float, its weight would be about 2.8% (research calculation). And this year, through October 16, foreign investors sold a net KRW 207.6 trillion (about $155 billion) of KOSPI stocks, yet the share of KOSPI held by foreigners rose from 36.28% at the end of last year to 38.19% (KRX data, author’s calculation; Koscom’s count is 37.38%).
So what exactly does the foreign ownership number count, how does MSCI use it, and would developed market status really bring money in? This report answers those three questions in order.
This report is the full English edition of Maochaedung’s Korean note on foreign ownership and MSCI, with the data behind every number.
As of: October 16, 2026 (foreign holdings and market caps at the KRX close on October 16; MSCI index figures from September 30 factsheets). Dollar amounts use KRW 1,340.9 per dollar, the October 16, 2026 close (Yahoo Finance, KRW=X).
Concepts covered: foreign ownership ratio, foreign share of the market (by value), foreign ownership limit, limit used, foreign room (foreign headroom), MSCI Emerging and Developed Markets indexes, free float and the foreign inclusion factor (FIF), quarterly index reviews, the watch list, passive money
Reference data: foreign-held shares, limits, closes and market caps are from the KRX Data System (940 KOSPI and 1,822 KOSDAQ stocks, every year-end since 2019 plus June 30 and October 16, 2026); net buying by investor type is from KRX (January 2023 to October 16, 2026); MSCI rules are from the MSCI Global Investable Market Indexes (GIMI) methodology, August 2026 edition; index weights are from MSCI factsheets (September 30, 2026). Numbers the author calculated are marked as the author’s calculations.
There are three foreign numbers: how many shares, how much value, and how much room is left
The “foreign ownership” figure in the news looks like one number, but three different numbers are used under that name. The first is the foreign ownership ratio of a single stock: the share of a company’s shares held by foreign investors. The second is the foreign share of the whole market: the market value of foreign holdings divided by the total market cap. The third matters only for stocks with a foreign ownership limit: how much of that limit is used, and how much room is left for foreigners to buy (foreign room). The conclusion of this chapter is simple. The three numbers move for different reasons, so they have to be read separately, and the one MSCI looks at is the third.
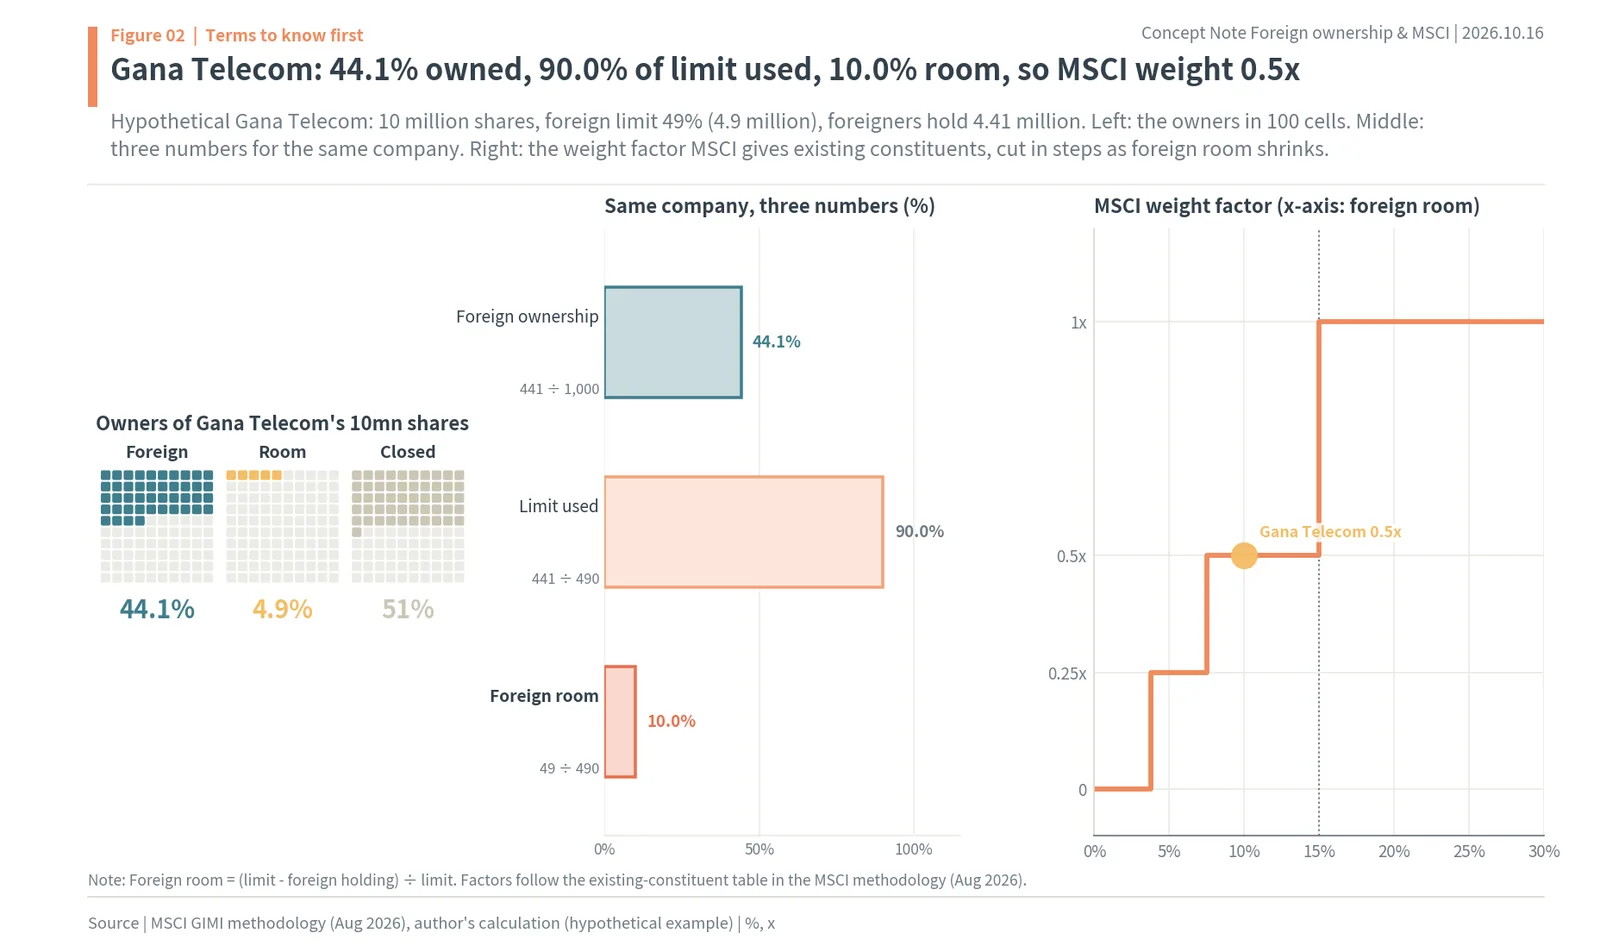
The figure uses a hypothetical company, Gana Telecom, to show the three numbers. Gana Telecom has 10 million shares, and by law foreigners may own only 49% (4.9 million shares). If foreigners hold 4.41 million shares, the foreign ownership ratio is 441 ÷ 1,000 = 44.1%. The share of the limit used is 441 ÷ 490 = 90.0%. Foreign room is the remaining space divided by the limit: (49% – 44.1%) ÷ 49% = 10.0% (author’s calculation). The left panel splits the 10 million shares into 100 cells: 44 held by foreigners, 5 still open to them and 51 closed to them by law. The middle panel puts the three numbers on one scale. The same company shows 44.1%, 90.0% and 10.0%. And because MSCI halves the index weight of an existing constituent once its foreign room falls below 15%, Gana Telecom’s MSCI weight factor would be 0.5x (MSCI GIMI methodology).
The difference between the ownership ratio and the market share causes even more confusion. The ownership ratio is a share count, so it changes only when foreigners buy or sell. The market share is a value, so it rises without a single trade if the stocks foreigners own heavily outperform the market. If foreigners own a lot of Samsung Electronics and Samsung rises more than the market, the foreign share of the whole market can grow even while foreigners sell. That is exactly what happened in Korea this year.
How it works in Korea
Korea has two main boards, both run by the Korea Exchange (KRX). KOSPI is the main market, home to the largest companies such as Samsung Electronics and SK hynix; it had 940 listed stocks in this data. KOSDAQ is the growth board, with 1,822 stocks, many of them small technology and biotech names. Foreign investors play a much smaller role there: the foreign share of KOSDAQ market value was 11.55% on October 16, against 38.19% for KOSPI (author’s calculation).
Korea is one of the few markets that publishes trading by investor type every day. After each session, KRX reports net buying and selling by foreigners, individuals, institutions and “other corporations” (a group that includes listed companies buying back their own shares), and it publishes each stock’s foreign-held shares and foreign limit. That is why Korean news can say “foreigners sold KRW 4.58 trillion today”, and why every number on foreign flows in this report can be checked against exchange data.
Some industries carry foreign ownership limits set by law. Under the Telecommunications Business Act, foreigners may own at most 49% of the telecom carriers SK Telecom, KT and LG Uplus; the limit is 40% for Korea Electric Power (KEPCO) and 30% for Korea Gas (KOGAS) (Smart Today, Saenggeul). Airlines also restrict foreign stakes. In the KRX data for October 16, 17 KOSPI stocks had a separate foreign limit (author’s count). For every other stock there is no limit, so the share of the limit used is simply the ownership ratio.
MSCI’s rules turn these limits into index weights. MSCI only puts into its indexes the shares foreign investors can actually buy. If a stock’s limit is full, a fund tracking the index cannot buy it even if it sits in the index. So MSCI monitors foreign room in Korea every quarter, cuts an existing constituent’s weight in steps as foreign room shrinks below 15%, and takes it to zero below 3.75%. A company with 44.1% foreign ownership and 10.0% foreign room is treated very differently by the index from one with no limit at all.
Foreign ownership is a share count, the market share is a value, and foreign room is the space left under a legal limit. Hypothetical Gana Telecom is 44.1% owned by foreigners, has used 90.0% of its limit, has 10.0% foreign room, and MSCI would cut its weight to 0.5x.
The terms in this report: index, free float and passive money form one chain
A few terms need to be settled before reading MSCI and foreign numbers together. The conclusion of this chapter is simple: once an index provider sets the weights of countries and stocks, passive money that copies the index buys and sells in proportion to those weights. That is why huge volumes trade on index change days regardless of earnings.
An index is a number that groups many stocks under fixed rules. KOSPI is the Korea Exchange’s own index; the MSCI Emerging Markets Index groups 1,165 stocks from 24 emerging markets (MSCI factsheet). Each index has its own rules for picking and weighting stocks. KOSPI holds almost every listed stock by market cap, while MSCI holds only large stocks whose free float available to foreigners passes a cutoff.
Free float market cap is the part of the market cap that can actually trade. Stakes held by controlling shareholders, affiliates or the government rarely come to market, so they are excluded. MSCI calls this ratio the foreign inclusion factor (FIF), and for stocks with a foreign limit it uses the smaller of the free float ratio and the foreign limit (MSCI GIMI methodology). A company 60% owned by its controlling shareholder has a free float of about 40%, so a KRW 10 trillion market cap becomes about KRW 4 trillion of free float.
Passive money is money managed to copy an index, mainly index funds and ETFs. If a stock is 1% of the index, the fund holds it at 1%. So when a stock is added at a quarterly review, passive money buys; when it is deleted, passive money sells. Eugene Investment & Securities estimated passive buying of LG Innotek at the August review at about KRW 430 billion (about $321 million, 2.3 days of average trading value), selling of the deleted HLB at about KRW 224 billion and LG Display at about KRW 158 billion. Active money uses the index as its benchmark but lets managers over- or underweight; it, too, rarely strays far from index weights.
The watch list is MSCI’s public list of markets it is considering reclassifying. Being added does not mean an immediate move: MSCI usually consults for more than a year, then decides, and the actual move comes at a later index review. Greece opened consultation in January 2026, was approved in March, and will actually move in May 2027 (MSCI). The market accessibility review is MSCI’s yearly report card of 18 items on how easily foreigners can trade a country’s stocks.
MSCI picks stocks and weights by free float, and passive money trades to those weights. The watch list is only the start of a review; actual inclusion comes more than a year after the decision.
Foreign ownership of KOSPI in 2026: KRW 207.6 trillion sold, yet the share rose from 36.28% to 38.19%
The author recalculated the foreign share of KOSPI from KRX data for every stock: foreign-held shares times the close, summed, divided by total KOSPI market cap. On October 16, foreigners held KRW 1,787.1 trillion (about $1.33 trillion) of KOSPI stock against a total market cap of KRW 4,679.5 trillion (about $3.49 trillion), a foreign share of 38.19% (author’s calculation). That is above 36.28% at the end of last year and below 40.93% at the end of June. Koscom’s count for the same day is 37.38%, 0.81 percentage point lower (Financial News). The market cap is the same and the gap is about KRW 38 trillion in foreign holdings; this research could not pin down the cause. By Koscom’s count, 41.56% on June 25 was the highest since September 23, 2005 (41.61%) (Herald Economy). Both counts agree that the foreign share this year is higher than at the end of last year. Over the same period, foreigners sold a net KRW 207.6 trillion of KOSPI (KRX). The conclusion of this chapter: the foreign share can rise in a year of heavy foreign selling, because the stocks foreigners own rose more than the market.
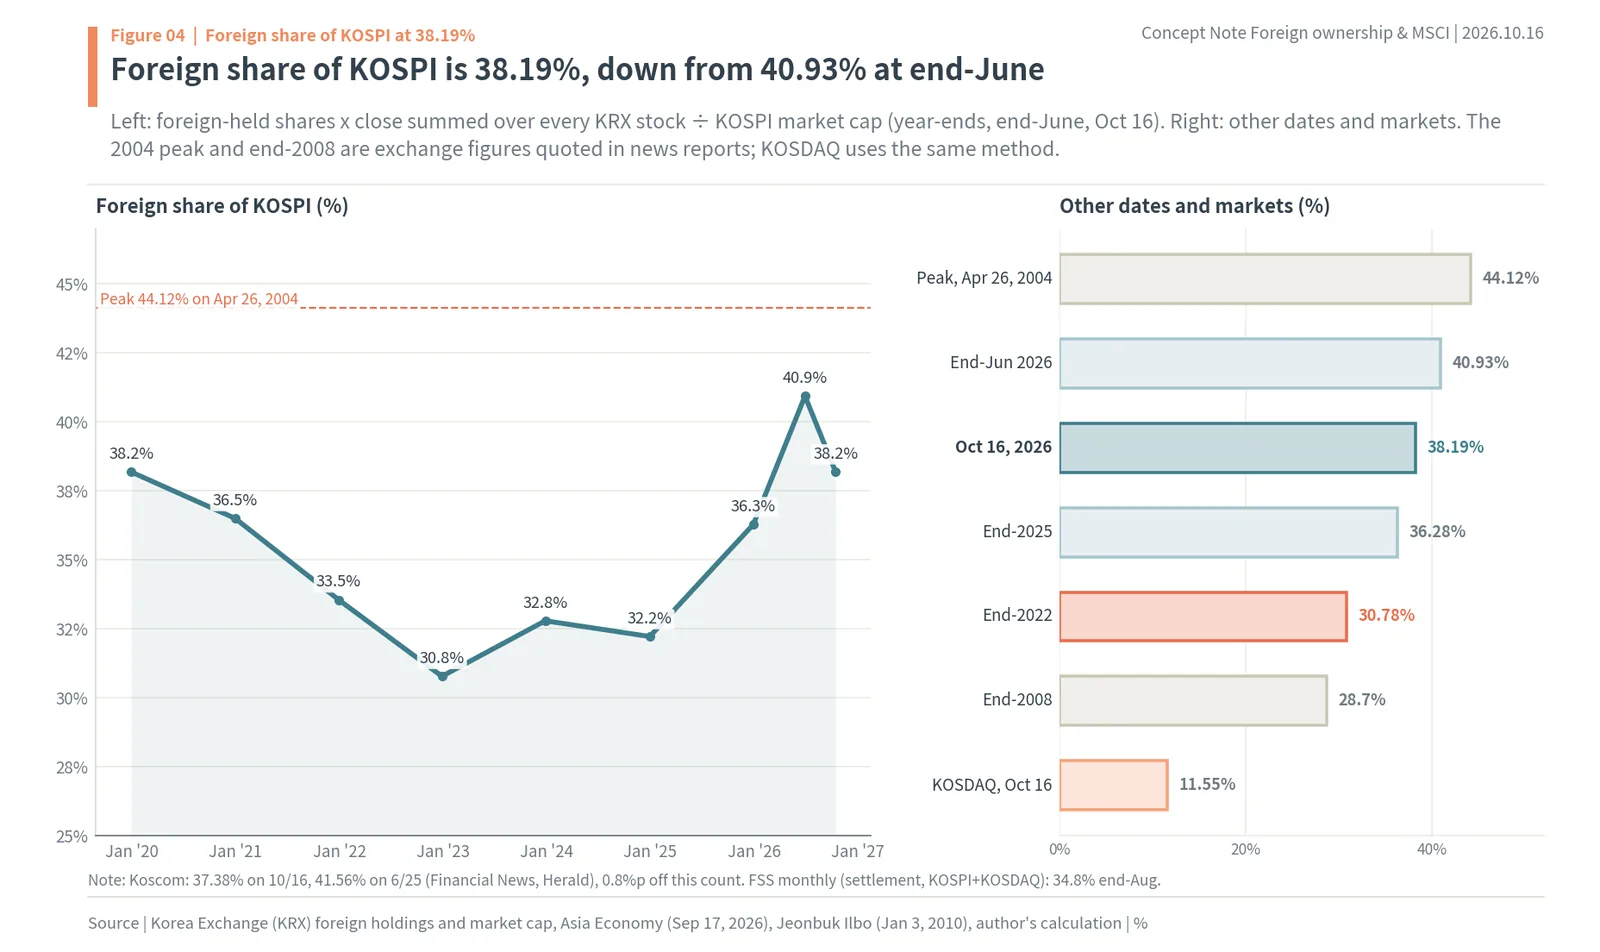
The left panel shows the foreign share of KOSPI at every year-end since 2019, plus the end of June and October 16 this year. It fell from 38.18% at the end of 2019 to 30.78% at the end of 2022, then rose to 32.79% in 2023, 32.22% in 2024 and 36.28% in 2025. At the end of June it was 40.93% (author’s calculation). The right panel compares other dates and markets. According to exchange figures quoted in the press, the record was 44.12% on April 26, 2004 (Asia Economy), and the end of 2008 was 28.7% (Jeonbuk Ilbo). Using the same method, the foreign share of KOSDAQ is 11.55% on October 16. The Financial Supervisory Service (FSS) monthly figure is on a settlement basis and combines KOSPI and KOSDAQ (34.8% at the end of August), so it is not mixed into this chart.
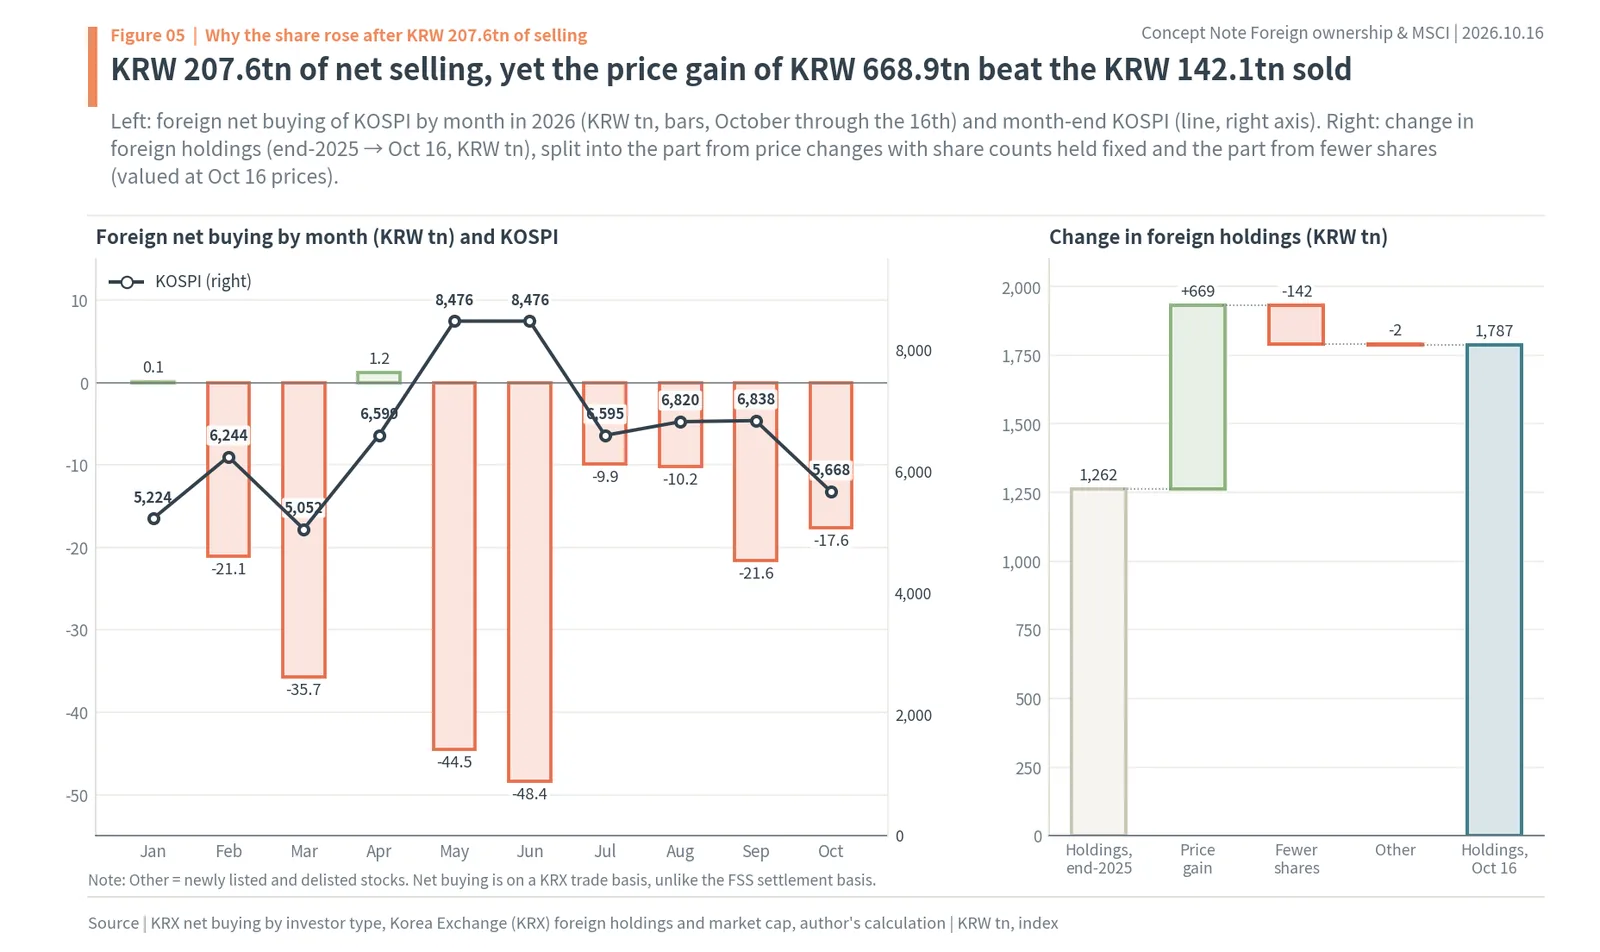
The left panel shows monthly foreign net buying this year (bars) and month-end KOSPI (line). January +0.1 trillion won, February -21.1, March -35.7, April +1.2, May -44.5, June -48.4, July -9.9, August -10.2, September -21.6, and October (through the 16th) -17.6 (KRX, author’s count). June’s net selling of KRW 48.4 trillion (about $36 billion) was the largest of the year. Over the same period, individuals bought a net KRW 101.1 trillion and institutions KRW 40.1 trillion. In all of 2025, foreigners sold a net KRW 4.7 trillion.
The right panel splits the change in foreign holdings into two parts. At the end of last year, foreigners held KRW 1,261.8 trillion. Keeping their share counts fixed and applying only the price changes adds KRW 668.9 trillion (about $499 billion); the shares they sold are worth -142.1 trillion at October 16 prices. New listings, delistings and other items account for -1.5 trillion, bringing holdings to KRW 1,787.1 trillion on October 16 (author’s calculation). The price gain was 4.7 times the part sold. Net selling (207.6 trillion) differs from the drop in share counts (142.1 trillion) because net selling is valued at the prices on the day of each sale, while the share-count change is valued at October 16 prices.
These numbers show how “foreigners are leaving” and “the foreign share is growing” can both be true. Foreigners sold a lot of stock. But the stocks they already owned heavily, above all the big chipmakers, rose much more than the market, so the value of their slice grew. That is why guessing foreign buying from the market share alone goes wrong. The direction of foreign trading shows up in net buying; foreign influence shows up in the market share.
Foreigners sold a net KRW 207.6 trillion of KOSPI this year, yet their share went from 36.28% to 38.19%, because the price gain of KRW 668.9 trillion outweighed the KRW 142.1 trillion of shares they sold.
In October, foreigners sold KRW 17.65 trillion in 16 days, and the buyers were individuals and companies buying back stock
Foreign numbers moved even harder in October’s sell-off. From October 1 to 16, foreigners sold a net KRW 17.65 trillion (about $13.2 billion) of KOSPI. Individuals bought KRW 7.47 trillion, institutions KRW 1.77 trillion and other corporations KRW 8.41 trillion (KRX, author’s calculation). Financial News put foreign net selling over the same period at KRW 17.6854 trillion, the sixth straight month of selling. The conclusion of this chapter: October’s foreign selling pulled down the foreign share along with the index, and companies buying back their own shares (other corporations) absorbed as much of that selling as individuals did.
Day by day, foreigners were net sellers on 8 of the 10 trading days in October. The biggest day was October 13 at KRW 4.58 trillion, and on October 15, when the circuit breaker was triggered, they still sold KRW 3.76 trillion. On October 16 they turned to net buying of KRW 0.32 trillion (KRX, author’s calculation). Other corporations were net buyers on all ten days, at KRW 0.59 trillion to 1.48 trillion a day. Because that group includes listed companies buying back stock, corporate buybacks took up a large part of the foreign selling.
The value of foreign holdings fell quickly as falling prices and selling compounded. Herald Economy, citing Korea Financial Investment Association data, reported that foreign-held market value dropped from KRW 3,038 trillion on June 25 to KRW 1,924.8 trillion on October 13, a fall of KRW 1,113.9 trillion. That includes price declines, so not all of it is money leaving. Koscom’s foreign share fell from 41.56% on June 25 to 37.38% on October 16, the lowest since April 9 (Financial News). By the author’s count it fell 2.74 percentage points, from 40.93% at the end of June to 38.19% on October 16.
This is the reverse side of the puzzle in the previous chapter. In the first half, chip stocks rose faster than foreigners sold, so the foreign share went up. In the second half, chip stocks fell, the value of foreign holdings shrank faster than the market, and continued selling cut share counts too. With price and quantity moving the same way, the share dropped fast. Both on the way up and on the way down, the biggest force was the price of the two stocks foreigners own most.
The same happened inside the EM index. The Bank of Korea noted that from the end of August to October 14, the MSCI EM Index fell 3.5% while KOSPI fell 11.9% (Econovill). With Korea falling more than other emerging markets, its EM weight has likely dropped from the 21.4% of September 30. A smaller index weight means EM-benchmarked money allocates less to Korea, so foreign selling and a falling index weight feed each other.
From October 1 to 16, foreigners sold a net KRW 17.65 trillion of KOSPI, taken up by other corporations (including companies buying back stock) at KRW 8.41 trillion and individuals at KRW 7.47 trillion. The foreign share fell from 40.93% at the end of June to 38.19%.
Samsung Electronics and SK hynix are 57.8% of foreign holdings, and foreign ownership of both fell sharply this year
Look one step deeper into why the foreign share rose and two stocks appear. Of the KRW 1,787.1 trillion foreigners held on October 16, Samsung Electronics was 32.4% and SK hynix 25.4%, together 57.8% (author’s calculation). The two are 46.8% of KOSPI market cap, so foreigners are more concentrated in them than the market is. Yet foreign ownership of both fell sharply this year: Samsung Electronics from 52.34% at the end of last year to 45.98%, SK hynix from 53.82% to 48.85% (KRX, author’s calculation). The conclusion of this chapter: foreigners sold many chip shares, but those shares rose so much that the value foreigners hold in them grew.
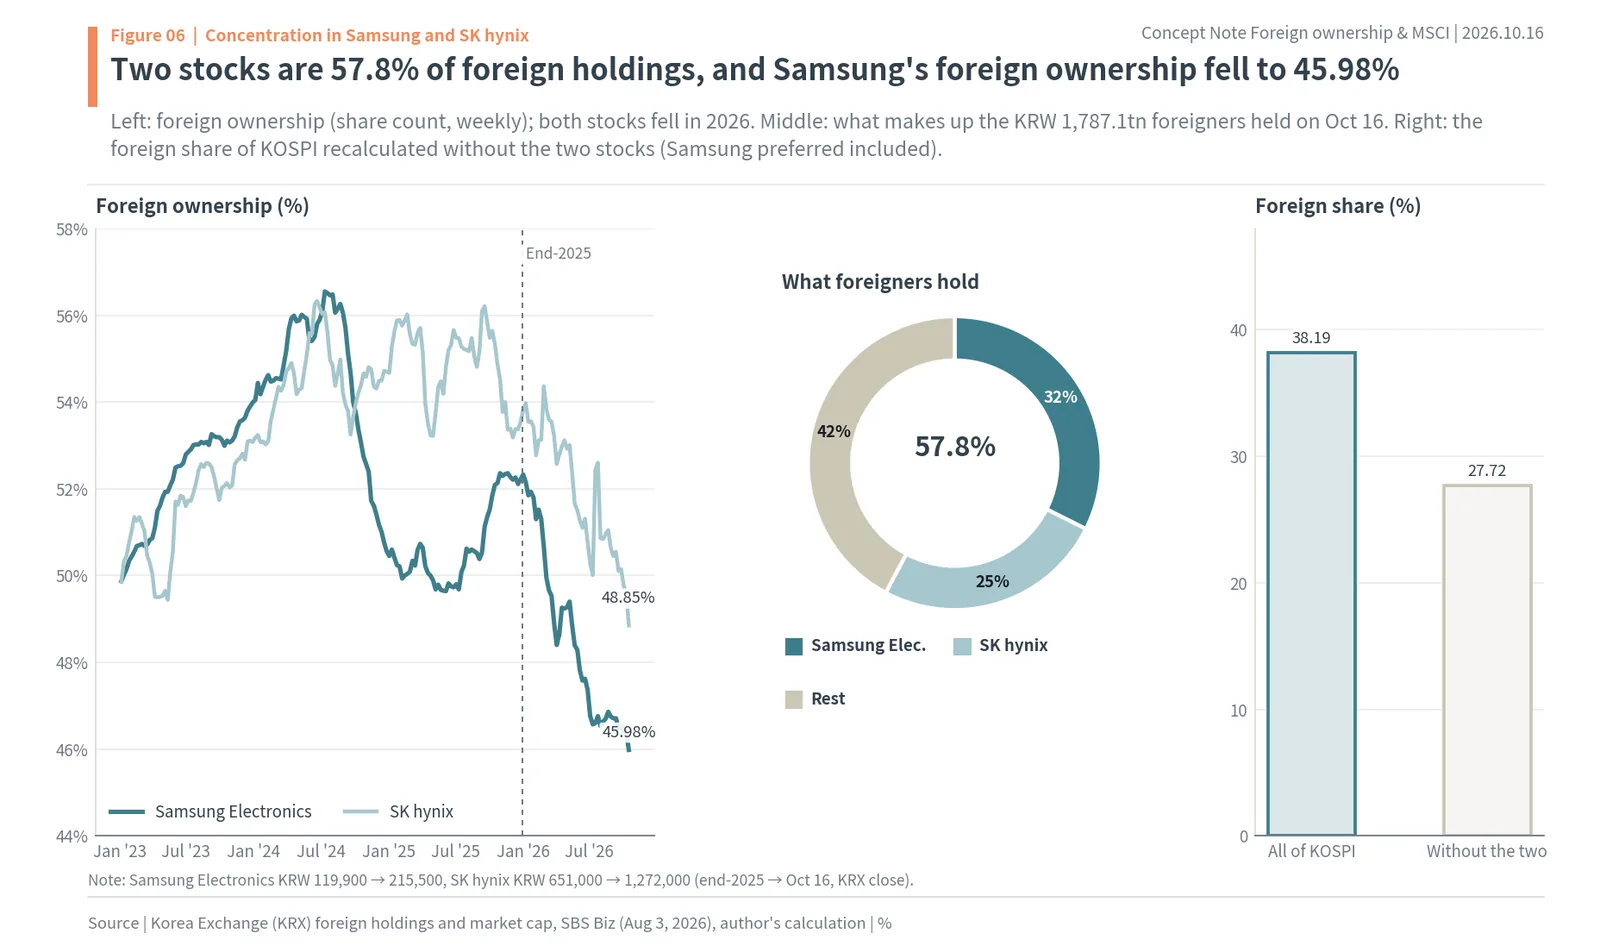
The left panel tracks weekly foreign ownership of the two stocks since 2023. Samsung Electronics peaked at 56.55% on July 12, 2024 and SK hynix at 56.41% on June 19, 2024 (author’s calculation). Both lines turned down this year. Hankyung reported that foreign ownership of Samsung Electronics hit 46.38% on October 8, the lowest since January 11, 2008 (46.35%); by October 16 it was down to 45.98%. Foreign holdings of Samsung Electronics shrank by 410.3 million shares from the end of last year (author’s calculation). Herald Economy found that of KRW 208.647 trillion of foreign net selling through October 15, about 90 trillion was SK hynix and about 87 trillion Samsung Electronics, 85% between them.
The middle panel shows what foreigners hold, and the right panel recalculates the foreign share of KOSPI without the two stocks (Samsung Electronics preferred shares included). The foreign share is 38.19% for all of KOSPI but 27.72% without the two (author’s calculation), lower than the whole-market share at the end of 2022 (30.78%). The “38% foreign” headline is really a number about two chip stocks. From the end of last year to October 16, Samsung Electronics rose from KRW 119,900 to KRW 215,500 (about $161) and SK hynix from KRW 651,000 to KRW 1,272,000 (about $949) (KRX closes).
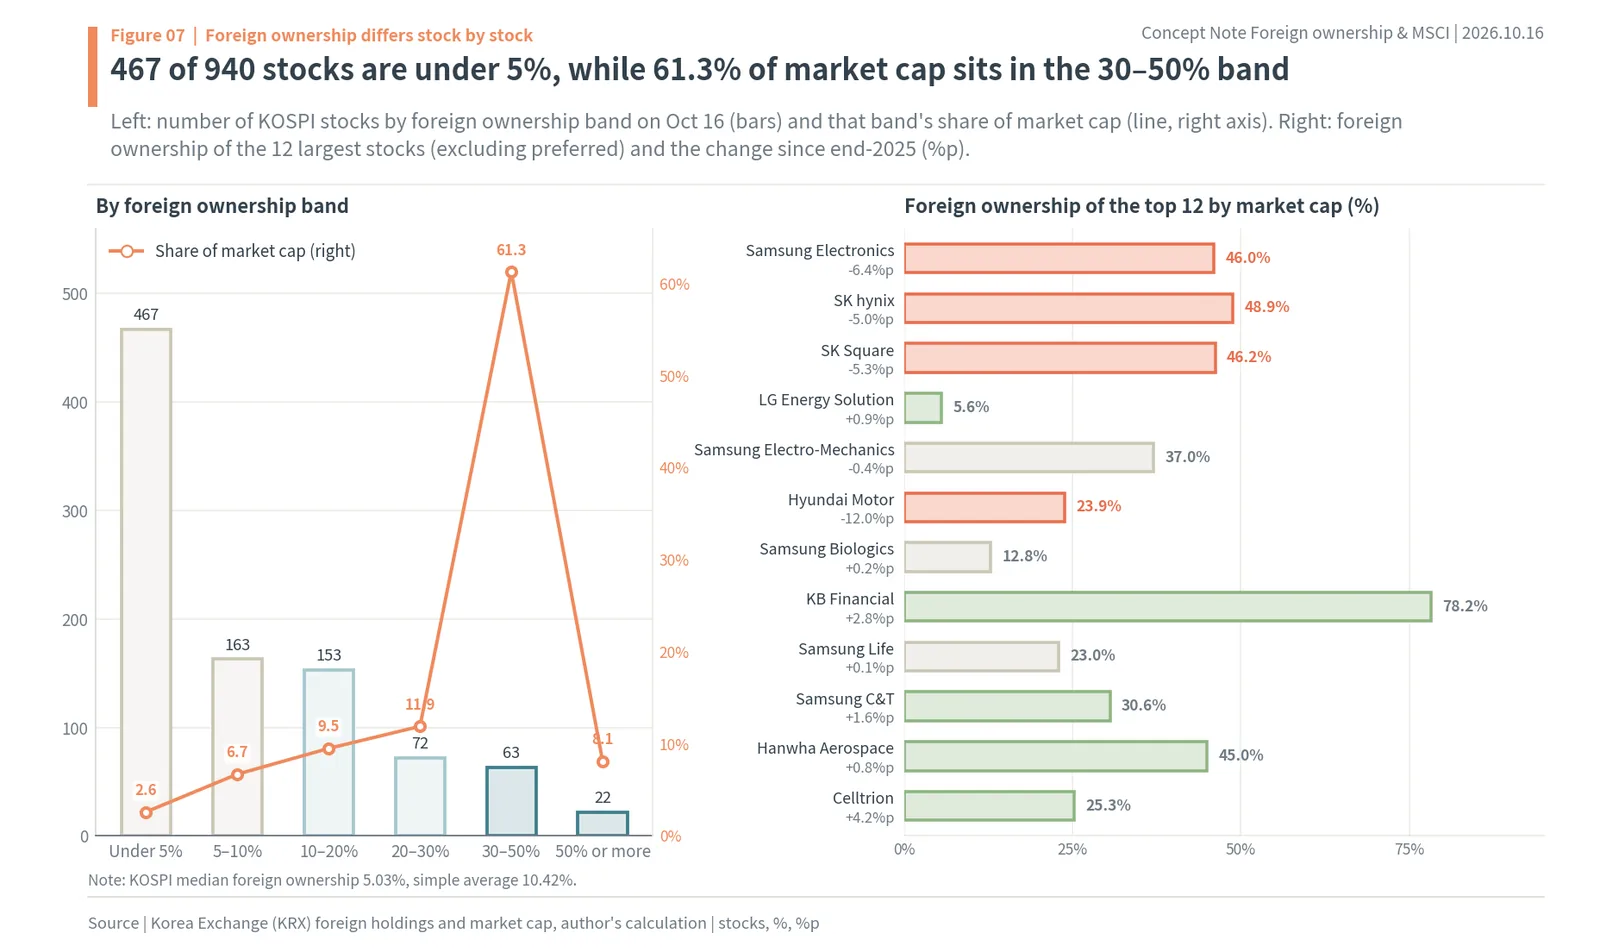
The left panel sorts all 940 KOSPI stocks by foreign ownership band. 467 stocks, almost half, are under 5%; 163 are at 5–10%, 153 at 10–20%, 72 at 20–30%, 63 at 30–50% and 22 at 50% or more (author’s calculation). By count, most companies have almost no foreign owners, but by market cap the 30–50% band holds 61.3%. The median foreign ownership of a KOSPI stock is 5.03% and the simple average 10.42%. Foreigners are concentrated in a few large companies; most small and mid caps are far from foreign money.
The right panel shows the 12 largest stocks by market cap (excluding preferred shares) and the change since the end of last year. Hyundai Motor fell the most, 12.03 points from 35.94% to 23.92%, and SK Square fell from 51.52% to 46.20%. KB Financial rose from 75.44% to 78.22%, Celltrion from 21.08% to 25.29% and Shinhan Financial from 59.40% to 61.13% (author’s calculation). Foreigners cut chips and autos and added some financials and biotech.
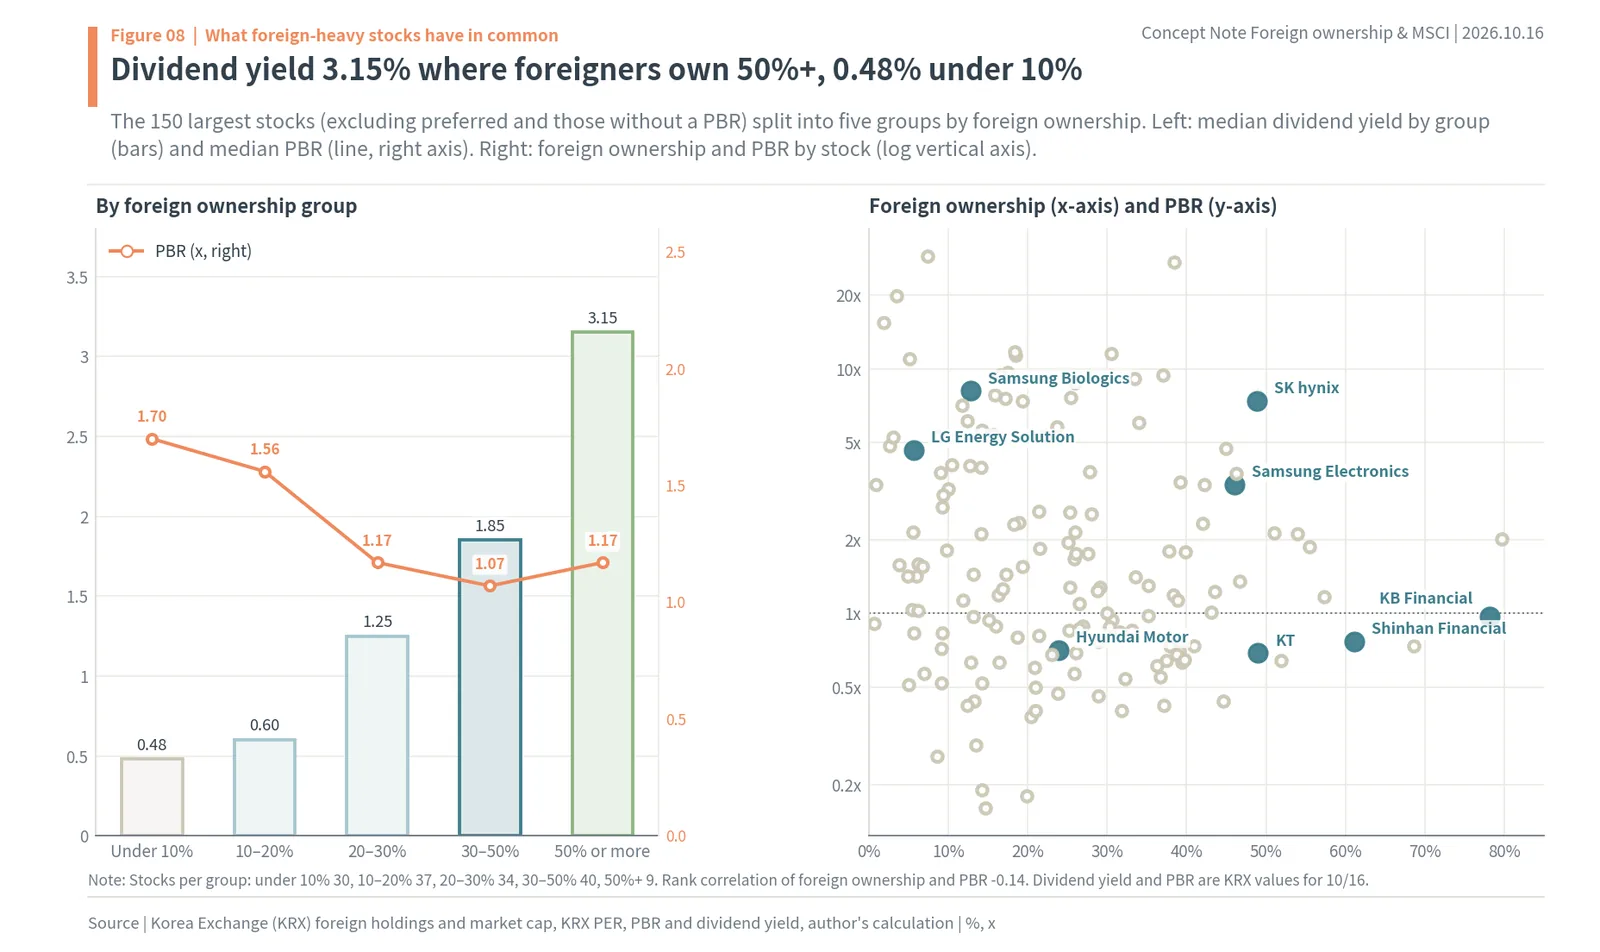
This figure splits the 150 largest stocks (excluding preferred shares and those without a PBR) into five groups by foreign ownership. The median dividend yield is 3.15% for the 9 stocks at 50% foreign ownership or more and 0.48% for the 30 under 10%. Across the groups it climbs 0.48%, 0.60%, 1.25%, 1.85% and 3.15%: the higher the foreign ownership, the higher the yield (author’s calculation). Price-to-book (PBR) runs the other way, highest at 1.70x for the under-10% group and lowest at 1.07x for the 30–50% group, though the rank correlation between foreign ownership and PBR is a weak -0.14. Stocks foreigners own heavily tend to be high-dividend, low-PBR companies such as banks and financial holding companies. A 2022 Financial Services Commission and Korea Capital Market Institute seminar paper also found a positive link between foreign ownership and dividends.
Samsung Electronics and SK hynix make up 57.8% of foreign holdings, and without them the foreign share of KOSPI is 27.72%. Foreign ownership of Samsung Electronics fell from 52.34% to 45.98%.
The 22 KOSPI stocks over 50% foreign-owned split into financial groups and companies with a foreign parent
On October 16, 22 KOSPI stocks were more than half foreign-owned, three fewer than the 25 at the end of last year. Their combined market cap is KRW 377.9 trillion (about $282 billion) (KRX, author’s calculation). The conclusion of this chapter: these stocks fall into high-dividend financials and preferred shares on one side and companies controlled by a foreign parent on the other, and the foreign owners in each group behave very differently.
The first group is financial holding companies and insurers: KB Financial 78.2%, Hana Financial 68.6%, Shinhan Financial 61.1%, Samsung Fire & Marine 57.3% and Woori Financial 51.9%. Foreign ownership rose at all five this year. Woori Financial climbed 4.5 points from 47.4% to 51.9%, crossing 50% this year. The five have dividend yields of 2.73–4.34% and PBRs of 0.64–1.17x (KRX October 16, author’s calculation). While selling chips, foreign investors added financials that pay big dividends and trade below book value. KT&G also crossed 50%, rising from 42.8% to 51.0%.
The second group is preferred shares. Samsung Electronics preferred is 75.0% foreign-owned, Hyundai Motor preferred 56.4% and Hyundai Motor 2nd preferred B 53.8%. Preferred shares carry no vote but pay a slightly higher dividend, so foreign institutions with no interest in control buy them for the dividend and the discount. Both Hyundai Motor preferred lines yield over 6%. Foreign ownership of Samsung Electronics preferred also fell, from 77.6% at the end of last year to 75.0%.
The third group is companies with a foreign controlling shareholder. S-Oil is controlled by Saudi Aramco, so its foreign ownership is 79.7%, among the highest on KOSPI. Smaller companies with a foreign parent, such as Hankook Shell Oil (58.7%), also appear on the over-50% list. Their foreign stakes are mostly strategic holdings that never trade, so high foreign ownership does not mean foreign trading moves the price, and the free float MSCI sees is actually low.
This split is why a high foreign ownership ratio should not be read as “a stock foreigners like”. Foreigners in financial groups are portfolio investors who came for dividends and low valuations; foreigners in companies with a foreign parent are controlling owners. The ratio is high in both cases, but the first group trades with index weights and dividend policy, and the second barely moves. Always check who the largest shareholder is next to the ownership ratio.
22 KOSPI stocks are over 50% foreign-owned (25 at the end of last year). Financial groups such as KB Financial at 78.2%, Hana Financial at 68.6% and Shinhan Financial at 61.1% gained foreign ownership this year, and companies with a foreign parent such as S-Oil at 79.7% are also on the list.
Stocks with a foreign limit need a separate read: KT has been full at 49% since November 2024, and LG Uplus has 16.6% foreign room
For stocks with a foreign limit, the share of the limit used and the foreign room matter more than the ownership ratio. When the limit is full, foreigners cannot buy more on the exchange; they have to trade among themselves off-exchange or pay a premium. On October 16, KT’s foreign ownership was 48.99%, its 49% limit fully used (100.0%), while LG Uplus was at 40.88%, 83.4% of its limit. SK Telecom was at 35.21% (71.9%), KEPCO at 20.45%, 51.1% of its 40% limit, Korean Air at 26.94% (53.9%) and KOGAS at 13.55%, 45.2% of its 30% limit (KRX, author’s calculation). The conclusion of this chapter: even among telecoms, the room left under the limit decides how much index money can buy or sell.
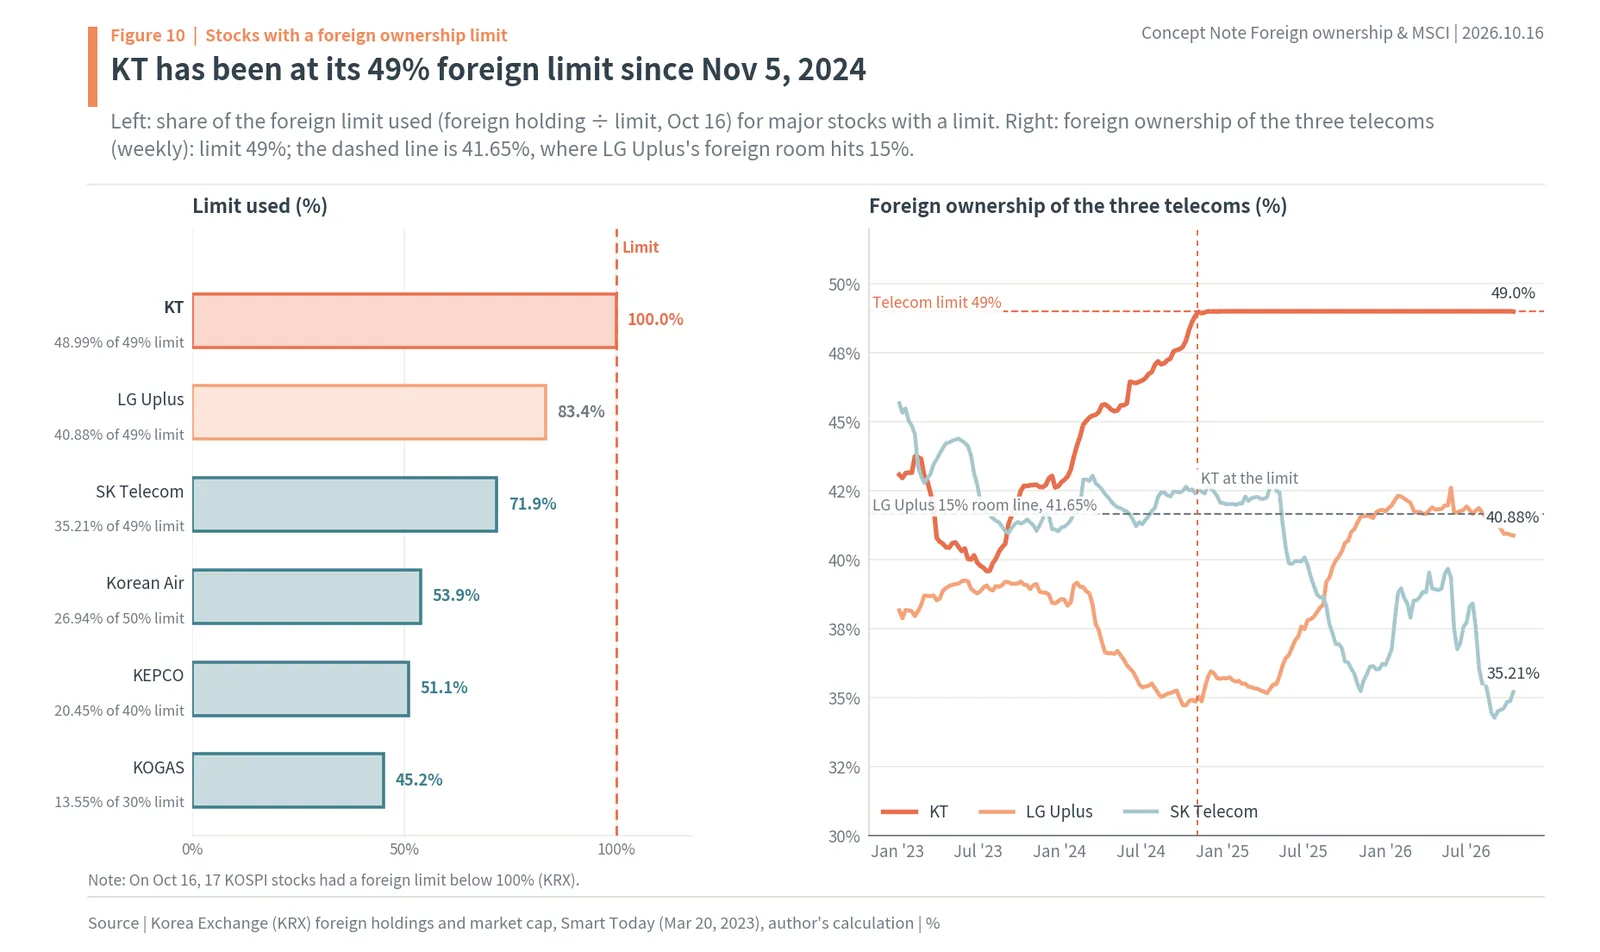
The left panel shows the share of the limit used, and the right panel weekly foreign ownership of the three telecoms since 2023. KT’s foreign holdings have stayed at 99.9% or more of the limit since November 5, 2024 (author’s calculation). Asia Economy reported in December 2025 that KT’s foreign stake was full at 49% and could not be bought further. A full limit also creates an odd problem: if the company cancels treasury shares, the share count falls and the foreign ratio automatically goes over 49% (Asia Economy).
LG Uplus peaked at 42.61% on May 29 this year and fell back to 40.88% on October 16 (author’s calculation), 0.86 point below 41.74% at the end of last year. The dashed line on the right is 41.65%, the ownership level at which LG Uplus’s foreign room hits 15% (49% x 0.85, author’s calculation). LG Uplus crossed that line in May and has since slipped back below it. Asia Economy reported in December 2025 that LG Uplus had entered MSCI’s weight-cut stage. SK Telecom’s foreign ownership fell sharply from 45.71% in January 2023 to 35.21%, so the limit is no longer a concern.
SK Telecom’s 2022 case shows how limits and indexes connect. In June 2022, SK Telecom’s foreign ownership was 47.36%, 1.64 points short of its 49% limit. As foreign room that is (49 – 47.36) ÷ 49 = about 3.3%, below MSCI’s 3.75% line (author’s calculation), and SK Telecom was removed from the MSCI Korea Index at the August 2022 review (Newsis). It left the index not because of its size or earnings, but because foreigners could not buy more.
Some limit stocks have plenty of room. KEPCO has used only 20.45% of its 40% limit, leaving 48.9% foreign room, and KOGAS 13.55% of 30%, leaving 54.8%. Korean Air’s foreign ownership rose sharply from 15.69% at the end of last year to 26.94% on October 16, but its limit of 49.99% is still far away, leaving 46.1% foreign room (author’s calculation). For these stocks more foreign buying does not cut the MSCI weight, so having a limit is not a handicap by itself.
For limit stocks, the more foreigners like them, the worse the index treatment. If foreigners buy enough to shrink foreign room, MSCI cuts the weight and index funds sell that slice. Even if foreign ownership then falls and room returns, MSCI in principle waits 12 months before raising the factor again (MSCI GIMI methodology). So for limit stocks, watch the distance to the limit, not just the direction of foreign ownership.
KT has been full at its 49% foreign limit since November 5, 2024, and LG Uplus has 40.88% foreign ownership and 16.6% foreign room, about 0.77 point above the 41.65% line where room hits 15%. SK Telecom left MSCI Korea in 2022 with foreign room of about 3.3%.
MSCI foreign room rule: free float, and weight cuts below 15% foreign room
MSCI is a US index provider that divides the world’s stocks into developed (DM), emerging (EM) and frontier markets. Pension funds and asset managers worldwide use its indexes as benchmarks to set country and stock weights. Money benchmarked to the MSCI Emerging Markets Index exceeded $1.8 trillion at the end of 2025 (MSCI). On September 30, Korea was 21.4% of the EM index, second to Taiwan (28.94%) and ahead of China (19.8%). The MSCI Korea Index has 74 stocks, and Samsung Electronics (35.31%), SK hynix (27.58%) and Samsung Electronics preferred (4.40%) make up 67.3% of it (MSCI factsheet). The free float of the MSCI Korea Index was $2.6278 trillion at the end of September, 71.3% of it in IT. The conclusion of this chapter: MSCI picks stocks by the free float foreigners can actually buy, not by market cap, so foreign limits and foreign room change index weights.
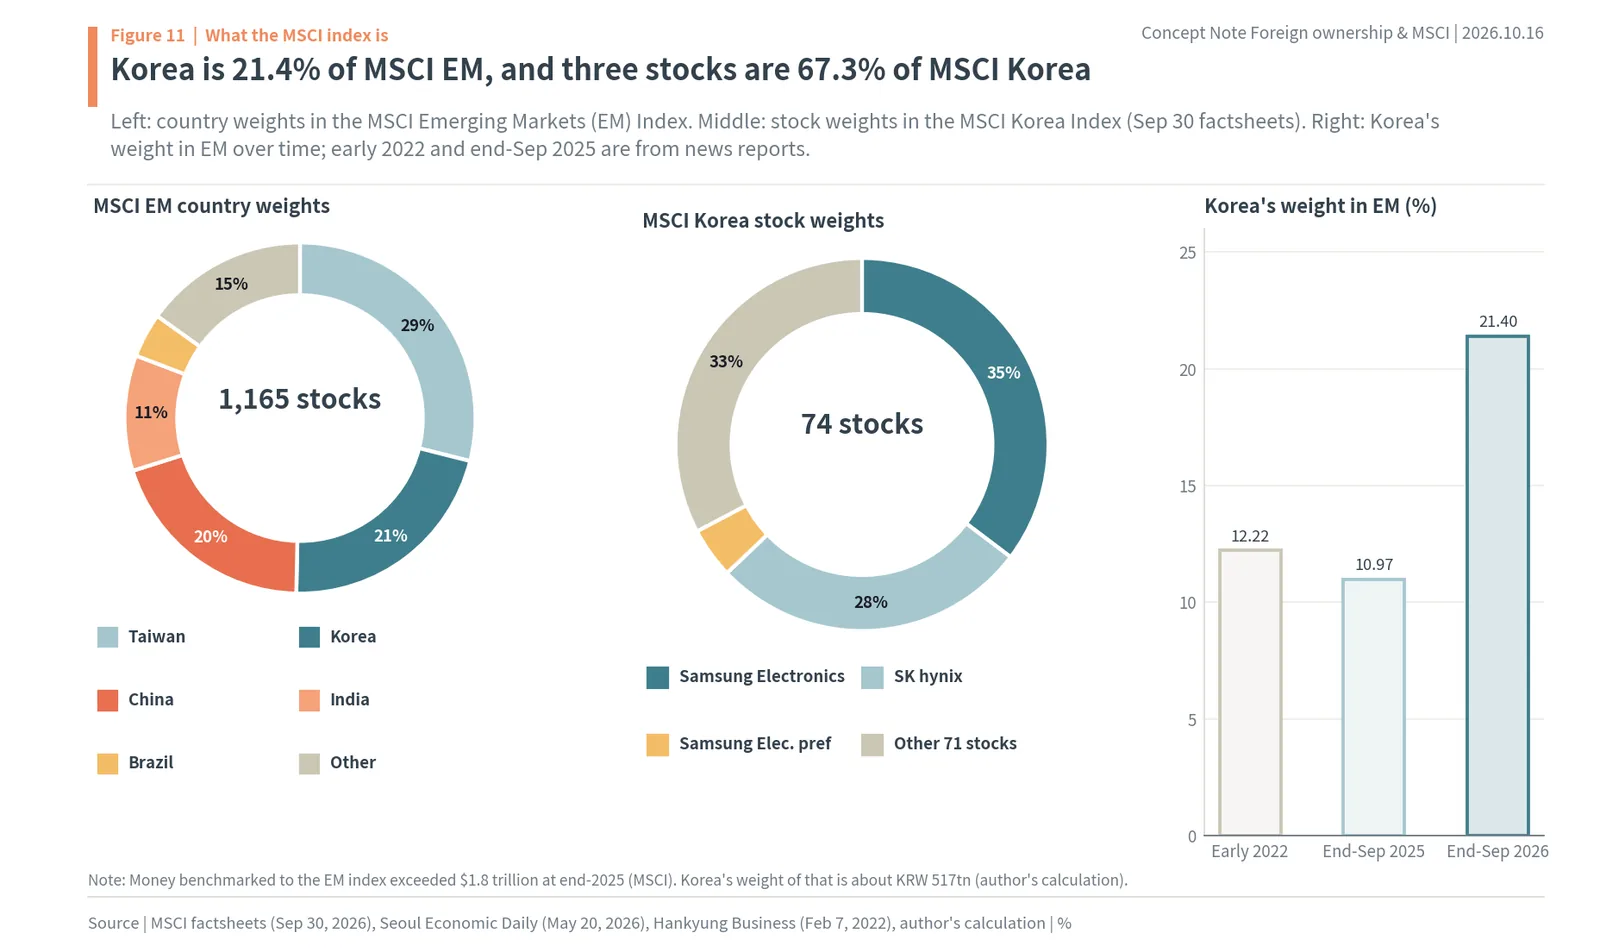
The left panel shows country weights in the MSCI EM Index and the middle panel stock weights in MSCI Korea. The right panel tracks Korea’s EM weight: 12.22% in early 2022 (Hankyung Business), 10.97% at the end of September 2025 (Seoul Economic Daily) and 21.4% at the end of September 2026. Korean stocks outran other emerging markets and the weight doubled in a year. Multiplying $1.8 trillion by 21.4% gives about $385 billion, or about KRW 517 trillion, as Korea’s slice of EM-benchmarked money (author’s calculation; includes active money; not actual holdings).
MSCI builds its indexes in three steps. First, it multiplies market cap by the foreign inclusion factor (FIF) to get free float market cap. The FIF strips out stakes that do not trade, such as controlling-shareholder and government stakes, and for stocks with a foreign limit it is the smaller of the free float ratio and the limit (MSCI GIMI methodology). Next, stocks whose free float passes the country cutoff are included. Finally, stocks with a foreign limit get their weights adjusted for foreign room. MSCI lists Korea as a market where it monitors foreign room every quarter.
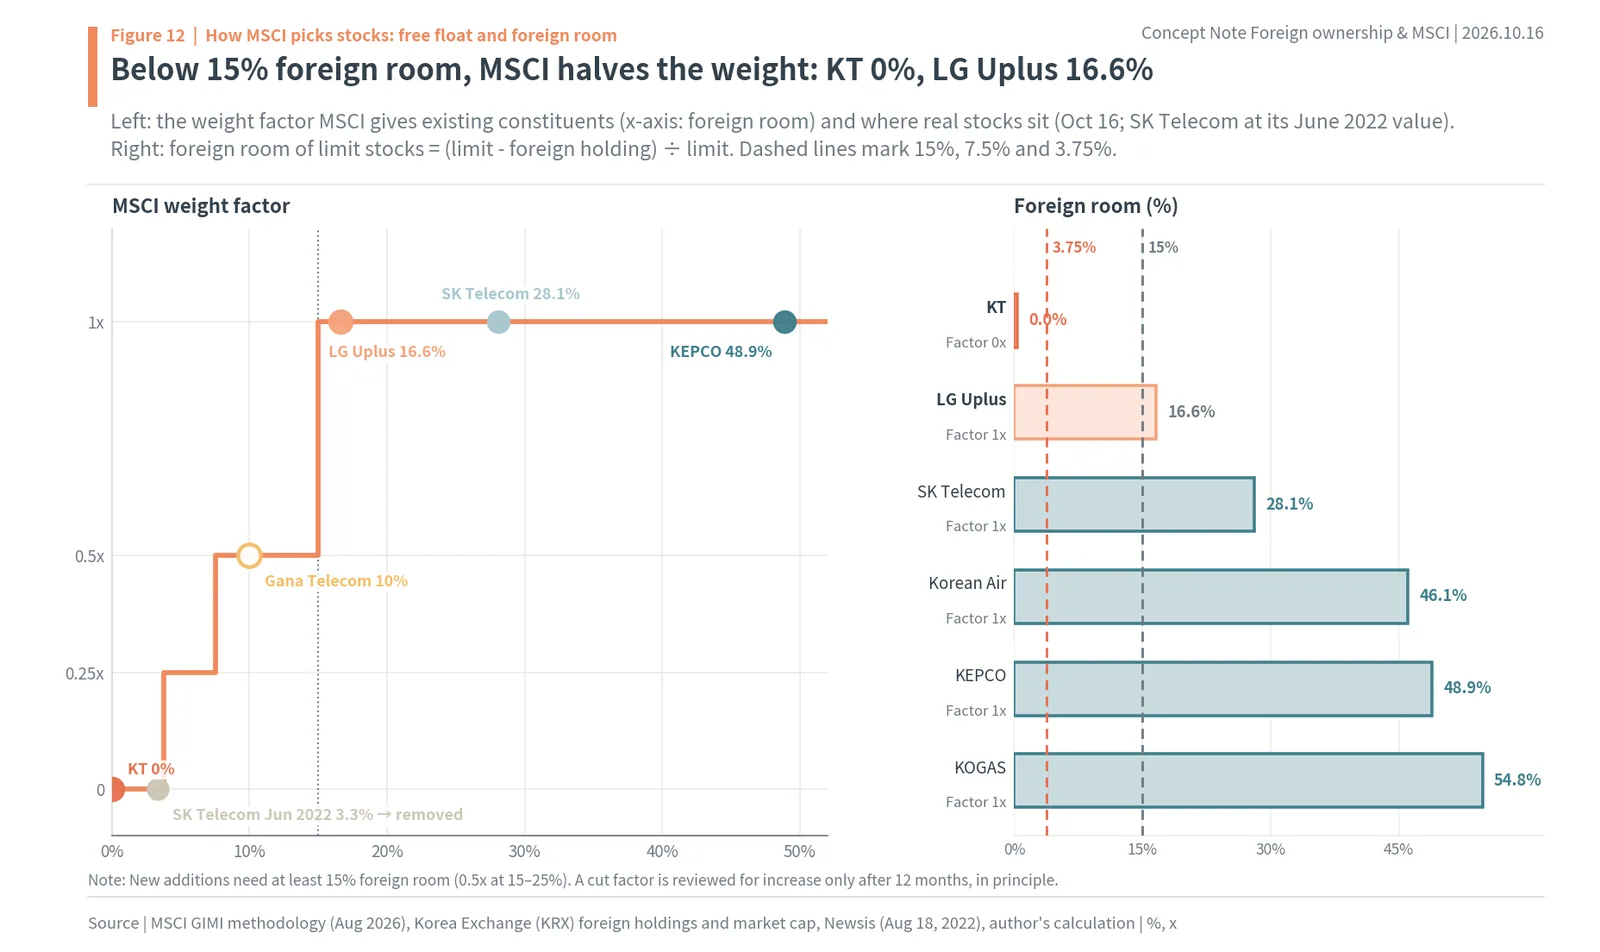
The left panel shows the weight factor MSCI applies to existing constituents. At 15% foreign room or more the factor is 1x; at 7.5–15% it is 0.5x; at 3.75–7.5% it is 0.25x; below 3.75% it is 0, effectively out of the index. New additions need at least 15% foreign room, and at 15–25% they enter at 0.5x from the start. A factor that has been cut is in principle reviewed for an increase only after 12 months (MSCI GIMI methodology, August 2026). The dots on the steps are real stocks. KT, with 0% foreign room, has a factor of 0; LG Uplus at 16.6% is still in the 1x zone, just above the 15% edge. SK Telecom (28.1%) and KEPCO (48.9%) have room to spare.
The right panel lays out foreign room for the limit stocks as bars: KOGAS 54.8%, KEPCO 48.9%, Korean Air 46.1%, SK Telecom 28.1%, LG Uplus 16.6% and KT 0% (author’s calculation). MSCI’s 2026 market accessibility report says stocks whose weights are adjusted for low foreign room are about 0.3–1% of the MSCI Korea IMI index. That is small for the market, but for the stock involved, a weight cut in half or to zero is a big event.
Korea is 21.4% of the MSCI EM Index, and three stocks are 67.3% of MSCI Korea. MSCI cuts the weight to 0.5x below 15% foreign room and to 0 below 3.75%, and looks again only after 12 months.
Quarterly reviews moved prices before the announcement, and the November review is announced on November 12
MSCI changes its index constituents four times a year, in February, May, August and November. Additions and deletions are based on market caps on one of the last 10 trading days of the prior month (January, April, July, October), chosen by MSCI (Eugene Investment & Securities), and index funds trade in bulk at the close the day before the change takes effect. The next review will be announced early on November 12 (Korea time), with rebalancing at the November 30 close and the change effective December 1 (MSCI review calendar). The price window is October 19 to 30. The conclusion of this chapter: most of the inclusion effect came in the 45 days before the announcement, and buying after the announcement left little on average.
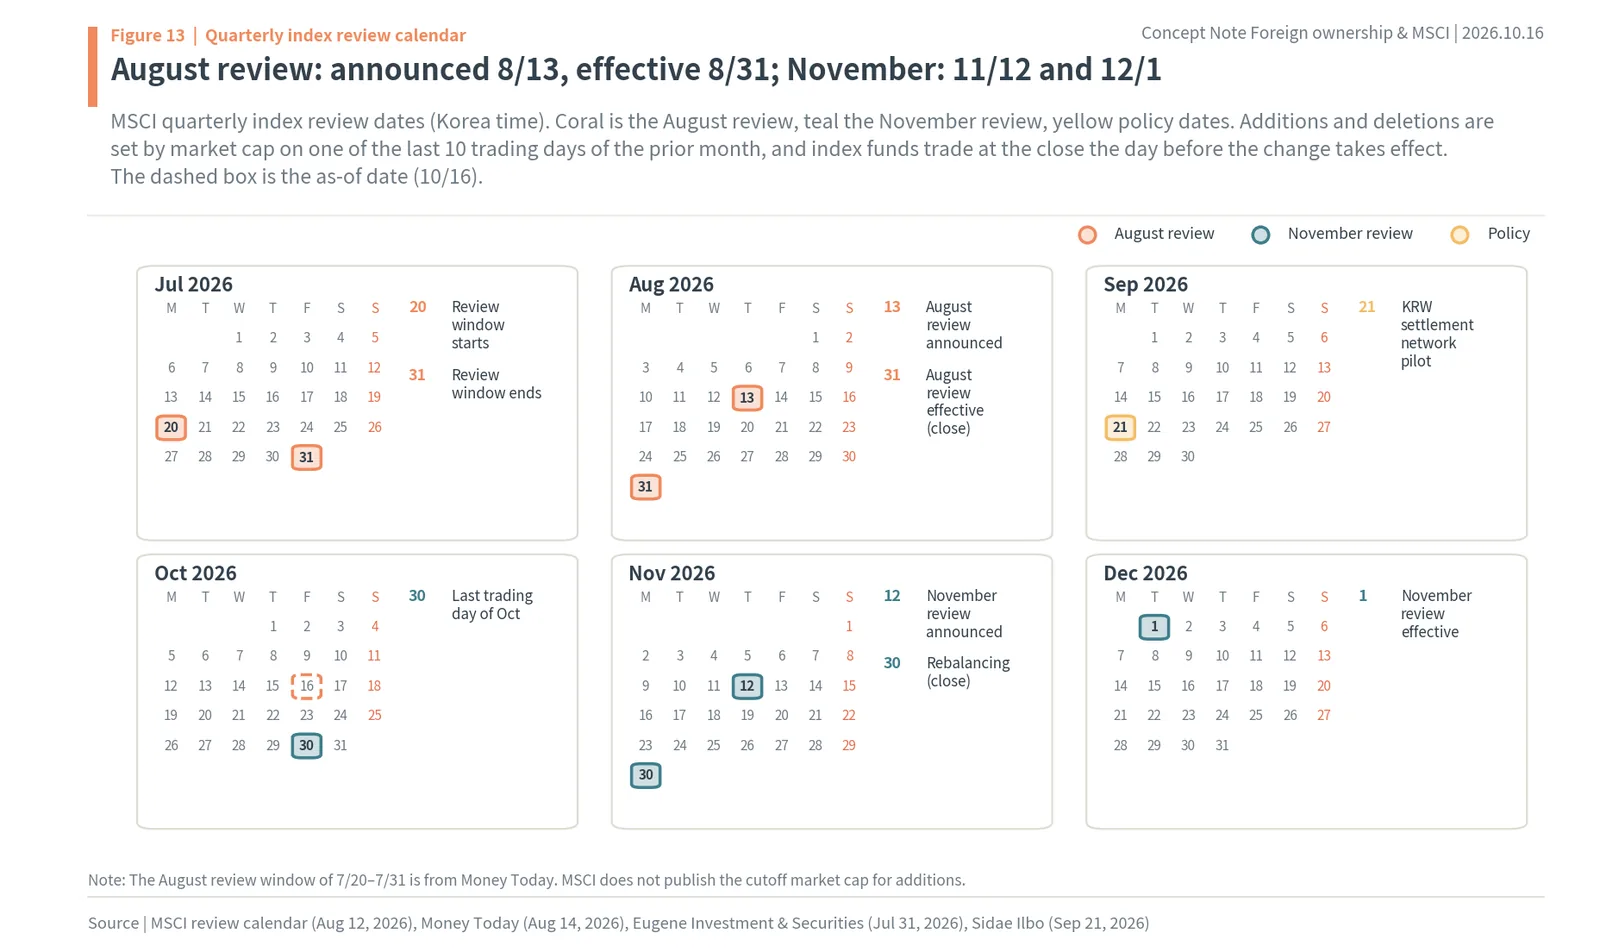
The calendar lays out the review dates from July to December. The August review used a July 20–31 window, was announced early on 8/13 and took effect at the 8/31 close (Money Today). LG Innotek was added to MSCI Korea, and Samsung Epis Holdings, POSCO International, LG Display and HLB were removed, taking the index from 78 to 75 stocks. Ahead of the November review (announced 11/12, effective 12/1), Seoul Economic Daily reported on September 30 that all seven candidates (GS, Samsung E&A, LS, Jusung Engineering, Isu Petasys, Samsung Securities and Coway) fell short of the inclusion cutoff (about KRW 13.3259 trillion, or about $9.9 billion, by Hana Securities’ estimate). LG Uplus (free float 47.0% below the deletion cutoff) and Yuhan (market cap 9.3% below the cutoff) were named as deletion risks. This research found no report recalculating the candidates or cutoff after the October 15 plunge.
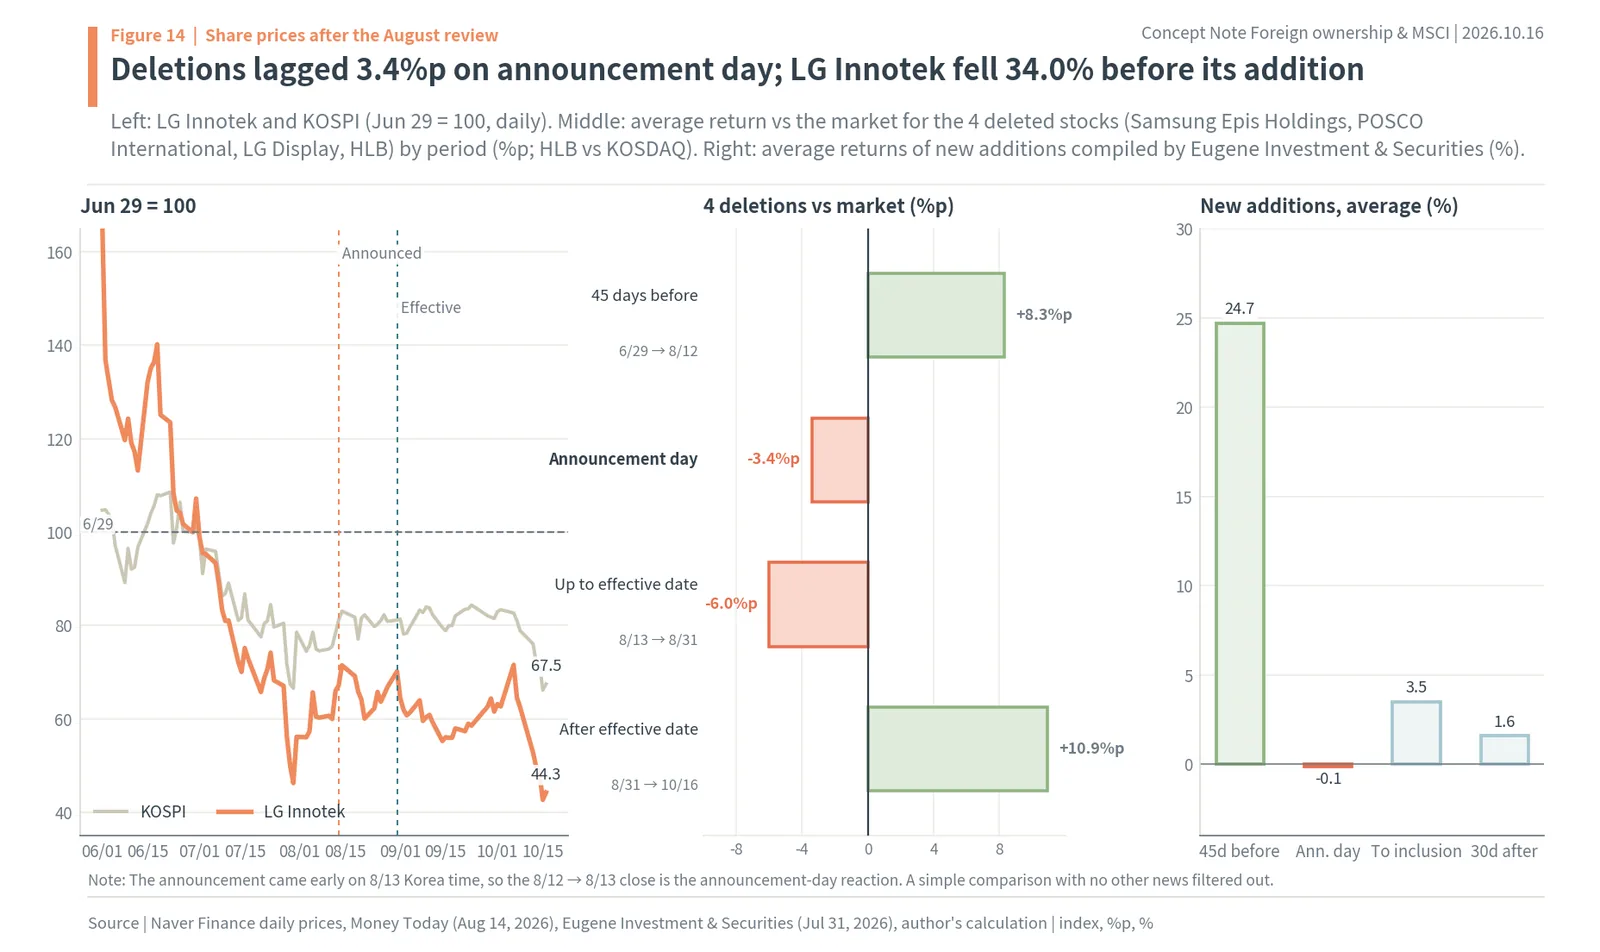
The left panel indexes LG Innotek, added in August, and KOSPI to June 29 = 100. LG Innotek fell 34.0% in the 45 days before the announcement (June 29 to August 12), 12.4 points worse than KOSPI. It gained 1.8% on announcement day and 4.4% through the effective date, then fell 36.8% from the effective date to October 16. From June 29 to October 16 it lost 55.7% in all (Naver Finance prices, author’s calculation). Inclusion did not stop the later fall.
The middle panel shows the average return of the 4 deleted stocks against the market by period. They beat the market by 8.3 points in the 45 days before the announcement, lagged by 3.4 points on announcement day and by 6.0 points through the effective date, then rebounded 10.9 points ahead of the market from the effective date to October 16 (author’s calculation; HLB against KOSDAQ). Prices were pressed down while index funds sold between announcement and effective date, then recovered once the selling was done. This is a simple comparison with no other news filtered out, and each stock has its own story.
The right panel shows Eugene Investment & Securities’ average returns for all new additions since 2020: +24.7% from 45 days before the announcement to the announcement, -0.1% on the day, +3.5% from announcement to inclusion and +1.6% in the 30 days after. Against KOSPI, that is +21.4 points in the 45 days before and -1.2 points in the 30 days after. Eugene noted that announcement-day returns averaged roughly -1% to -4% in most years and concluded that buying on the announcement pays little. On the August 2025 announcement day, LIG Nex1 fell 13.76% (Hankyung).
These numbers show when the hope that “index inclusion brings money” gets priced in. Brokers publish candidate lists well in advance, and many investors buy early. By the effective date, when index funds actually buy, the early buyers are often selling. The November review is also based on market caps in the price window, so the last two weeks of October decide the candidate list.
The November MSCI review uses an October 19–30 window, is announced November 12 and takes effect December 1. LG Innotek, added in August, fell 34.0% in the 45 days before its announcement, and the 4 deleted stocks lagged the market by 3.4 points on announcement day.
The last two weeks of October set the November numbers: an inclusion cutoff near KRW 13.3 trillion, and LG Uplus at risk
What separates additions from deletions in November is market cap and free float on one day of the October 19–30 window, chosen by MSCI. MSCI does not publish the cutoff in advance; brokers estimate it from the size of index constituents. On September 30, Hana Securities put the inclusion cutoff at about KRW 13.3259 trillion (Seoul Economic Daily). The conclusion of this chapter: the October 15 plunge may have lowered both candidates and the cutoff, so the last two weeks decide the November result.
The cutoff moves with the size of all index constituents. MSCI standard indexes aim to cover roughly the top 85% of each country’s free float (MSCI GIMI methodology), so when the whole market falls, the cutoff falls too. A plunge shrinks candidates’ market caps but also lowers the bar. The Invest revised its forecast twice, on October 6 and 12, saying the inclusion cutoff fell 0.5% while the free float cutoff rose 4% (stock names were behind a paywall and are not included). This research found no public forecast recalculated after October 15.
Deletion risks come in two forms. Seoul Economic Daily flagged LG Uplus because its free float was 47.0% below the deletion cutoff. With a 49% foreign limit, the free float MSCI assigns to LG Uplus depends on its foreign limit and foreign room. Yuhan’s market cap was 9.3% below the cutoff (Seoul Economic Daily), while HYBE met the cutoff at the end of September. Once a deletion is announced, index money sells from the announcement to the effective date. The 4 stocks deleted in August lagged the market by 3.4 points on announcement day and by 6.0 points through the effective date (author’s calculation).
Investors should watch two things in this window. One is how far candidates and at-risk stocks are from the cutoff. The other is the size of index buying or selling compared with each stock’s daily trading value. LG Innotek’s passive buying of KRW 430 billion in August equaled 2.3 days of average trading value (Eugene Investment & Securities). The larger that ratio, the more the price can move on rebalancing day. But as the previous chapter showed, most of the inclusion effect came in the 45 days before the announcement, so buying after the announcement left little on average.
The November review is set by market caps on one day between October 19 and 30, and Hana Securities estimated the inclusion cutoff at about KRW 13.3 trillion at the end of September. LG Uplus, with free float 47.0% below the deletion cutoff, is the main deletion risk.
MSCI developed market status for Korea: 18 years of talks, same homework since 2009
Korea has been in the MSCI Emerging Markets Index since 1992. MSCI opened consultation on reclassifying Israel and Korea to developed status on June 18, 2008 (MSCI), and on June 15, 2009 it moved Israel up from May 2010 while keeping Korea in emerging markets. The problems MSCI cited for Korea were won convertibility (free exchange of the currency), the rigid foreign investor registration (ID) system, and anti-competitive clauses that restricted the use of index data. On June 10, 2014, MSCI took Korea off the review list, saying there had been no meaningful progress over the past four years (MSCI 2014 press release). The conclusion of this chapter: the reasons MSCI gave in June 2026 for not adding Korea to the watch list run along the same lines, the won and accounts, so the government’s currency settlement reforms set the timetable.
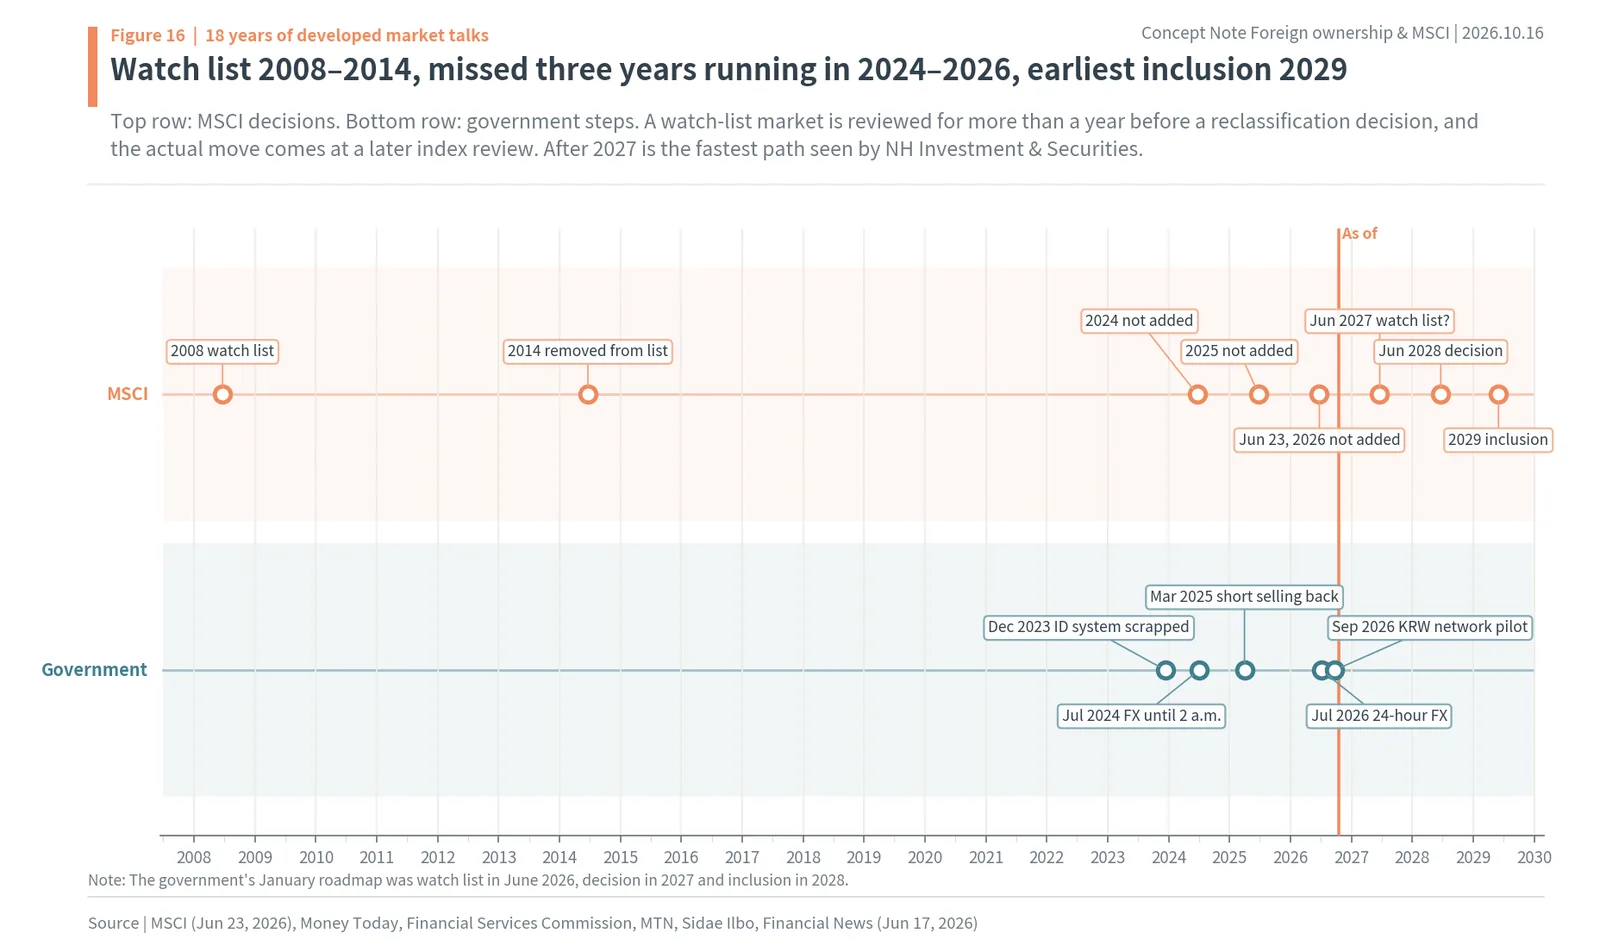
The top row of the figure shows MSCI decisions and the bottom row government steps. Korea was on the watch list from 2008 to 2014, and the bid to return failed three years running in 2024–2026 (Money Today). On June 23, 2026 (New York time), MSCI acknowledged the authorities’ steps but said investors still saw the core problems as not fully solved: the won cannot be settled offshore, the extended FX trading hours lack onshore liquidity, omnibus accounts are little used in practice, and compliance after short selling resumed is burdensome (MSCI press release). It said it would consider reclassification only after all issues are resolved, the reforms are fully in place, and market participants have had time to judge whether the effects last.
The government has acted in the meantime. On December 14, 2023, it scrapped the foreign investor registration system after about 30 years (Financial Services Commission); on July 1, 2024, it extended FX trading hours to 2 a.m.; and on March 31, 2025, it fully lifted the short selling ban. On July 6, 2026, the FX market began 24-hour trading (MTN), and on September 21 the Bank of Korea started a pilot of its international won settlement network (full operation in January 2027, Sidae Ilbo). The Ministry of Economy and Finance said on September 28 that 30 of 39 tasks on its MSCI roadmap were done, that daily won-dollar spot volume rose from about $11 billion in the second half of 2024 to $19 billion in August 2026, and that registered foreign institutions (RFIs) grew from 31 to 84 (Korea Financial Newspaper). On October 13, it proposed raising the reporting threshold for non-residents’ won borrowing from KRW 1 billion to KRW 50 billion a year (Digital Times).
The fastest path is watch list in June 2027, a reclassification decision in June 2028 and actual inclusion in 2029 (NH Investment & Securities scenario, Financial News). The government’s January roadmap aimed for the watch list in June 2026, a decision in 2027 and inclusion in 2028; the first step failed and the schedule slipped by more than a year. For comparison, Greece opened consultation in January 2026, won its return to developed status on March 31, and will actually move at the May 2027 review (MSCI). It takes more than a year from decision to inclusion.
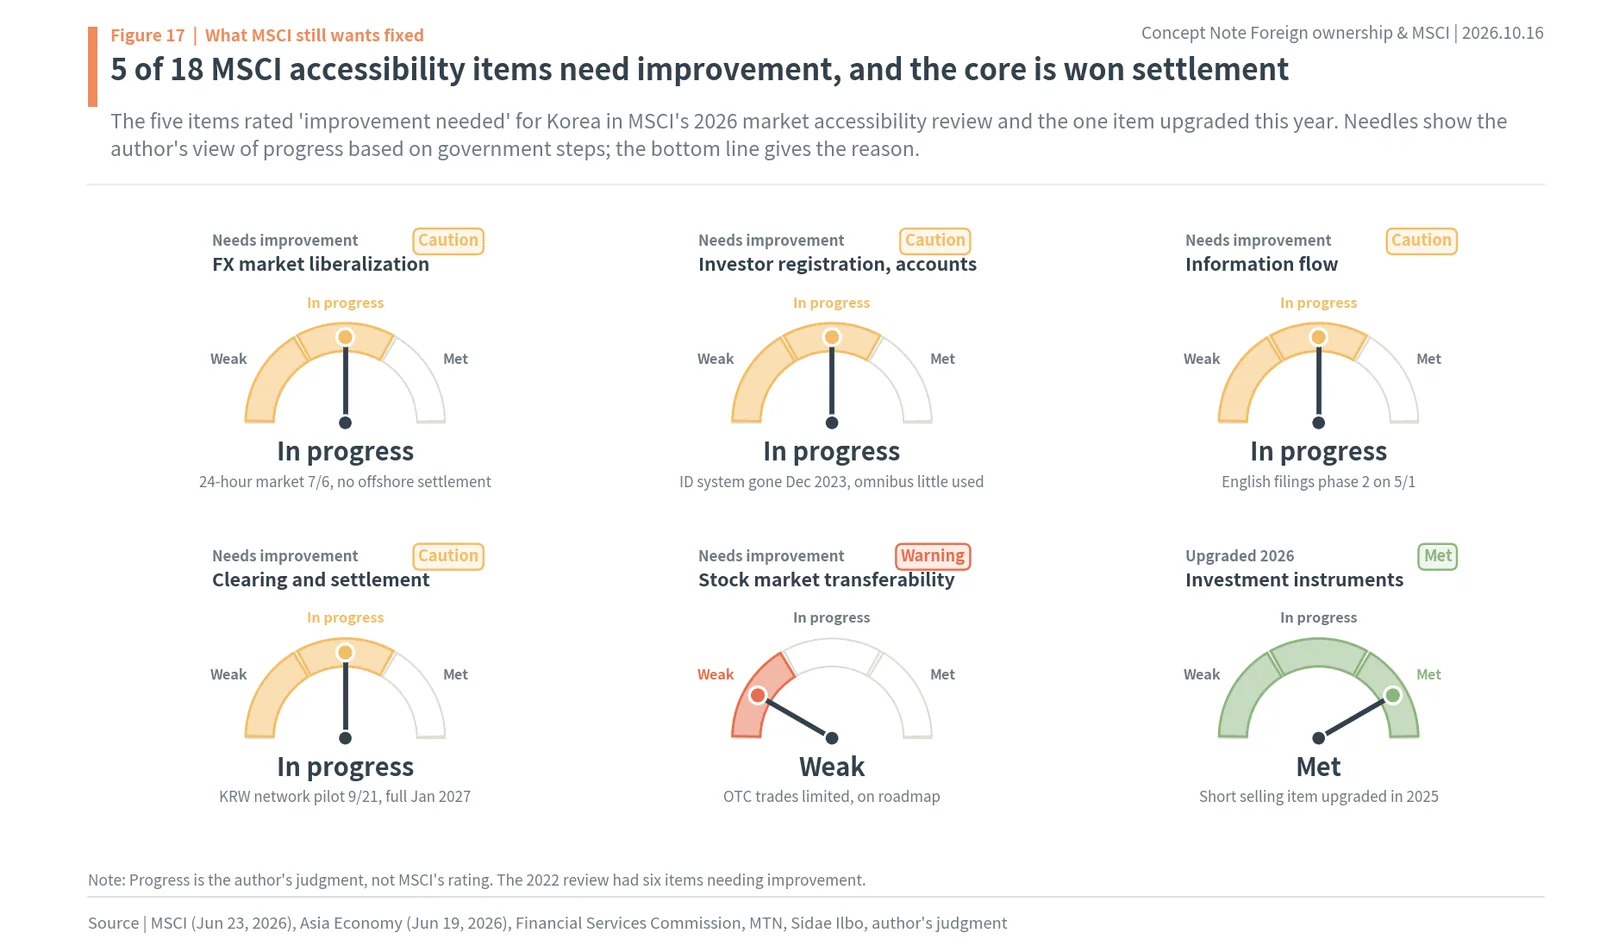
The figure shows the five items rated “improvement needed” for Korea in MSCI’s 2026 market accessibility review and the one item upgraded this year. Of 18 items, five remained in need of improvement: FX market liberalization, investor registration and account opening, information flow, clearing and settlement, and stock market transferability. Investment instrument availability moved up a notch as Korea index derivatives listed on overseas exchanges (Asia Economy). In 2025 short selling access was upgraded, and in 2022 six items needed improvement (Bizwatch). The needles are the author’s reading of progress based on government steps, not MSCI’s rating.
MSCI’s yardstick does not move only one way. On October 15, MSCI opened consultation on moving Indonesia from emerging to standalone status, taking comments until April 30, 2027 and deciding before June 30 (MSCI announcement). The next day the Jakarta Composite Index fell 11.1%, its biggest drop since 1998 (Hankyung). It was already down about 32% this year. MSCI’s concern was that high controlling-shareholder stakes leave few shares actually trading, and Indonesian authorities proposed reforms including disclosure of shareholders above 1%, disclosure of investor types and a roadmap to a minimum free float of 15% (MSCI announcement). The idea that index classification depends on how much stock foreigners can actually trade, as much as on market size, is the same idea as Korea’s foreign room rule. Classification is not settled once; it is reviewed every year, and the result can change a country’s market in a single day.
The problems MSCI cited for Korea in 2009 were won convertibility and the investor registration system, and in 2026 they were offshore won settlement and omnibus accounts. The earliest actual inclusion in developed indexes is 2029.
In developed indexes Korea’s weight goes from 21.4% to about 2.8%, and estimated inflows equal 21.2% of this year’s foreign net selling
The expectation that developed status means a flood of money leaves out one number: the weight in the index. Using free float at September 30, Korea is 21.4% of the EM index, but moved into the developed World index with the same stocks and free float it would be about 2.8% (research calculation from MSCI factsheets, not an MSCI estimate). The Korea Capital Market Institute calculated about 2.4% in 2023. The second-largest country in EM funds would become one of the smaller countries in developed funds. The conclusion of this chapter: developed status brings new money from developed funds and outflows from EM funds at the same time, and the estimated net inflow is a fraction of what foreigners sold this year.
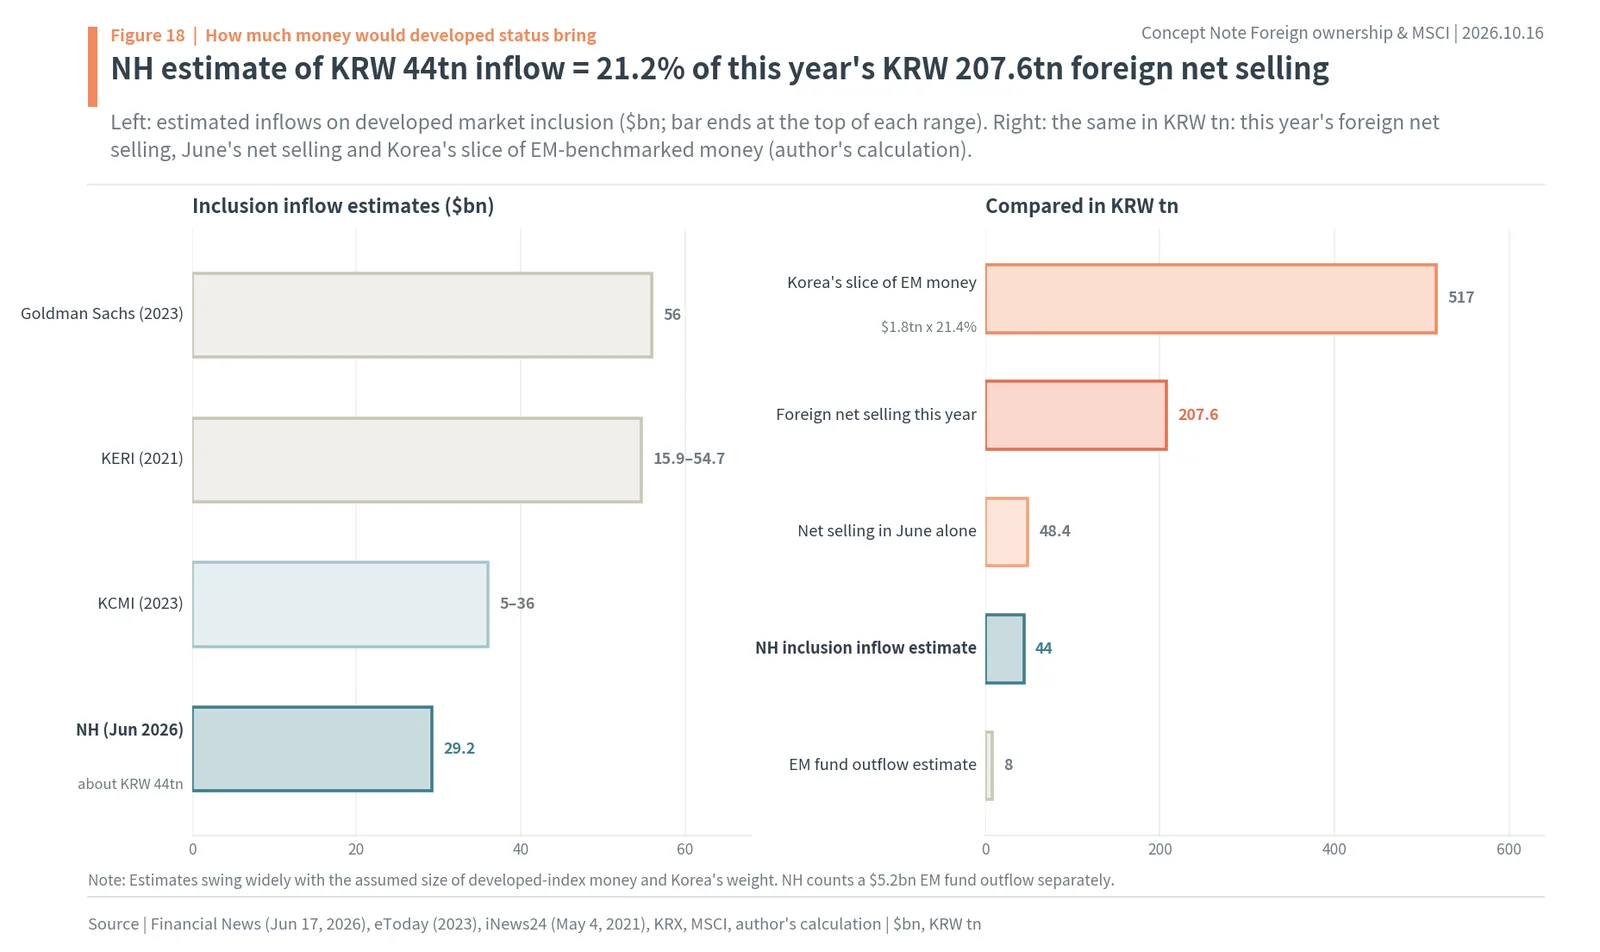
The left panel shows institutional estimates of inclusion inflows. NH Investment & Securities (June 2026) estimated passive net inflows of about $29.2 billion (about KRW 44 trillion) and warned that $5.2 billion (about KRW 8 trillion) could leave as EM funds exit during the transition (Financial News). Goldman Sachs (2023) estimated about $56 billion (eToday), the Korea Capital Market Institute (2023) $5 billion to $36 billion (eToday) and the Korea Economic Research Institute (2021) $15.9 billion to $54.7 billion (iNews24). Estimates differ more than tenfold depending on assumptions. Most were made when Korea’s EM weight was 10–13%; at 21% today, the outflow from EM funds could be larger.
The right panel puts everything in trillions of won. Korea’s slice of EM-benchmarked money is about KRW 517 trillion (author’s calculation), this year’s foreign net selling of KOSPI KRW 207.6 trillion, June’s net selling alone KRW 48.4 trillion, NH’s inclusion inflow estimate KRW 44 trillion and the EM fund outflow estimate KRW 8 trillion. NH’s KRW 44 trillion is 21.2% of this year’s foreign net selling and 0.94% of KOSPI market cap on October 16 (author’s calculation). Developed status is unlikely to be big enough to reverse this year’s foreign outflow. According to the Bank of Korea, $145.03 billion of foreign equity money left Korea from January to September, the eighth straight month of outflows through September (Econovill).
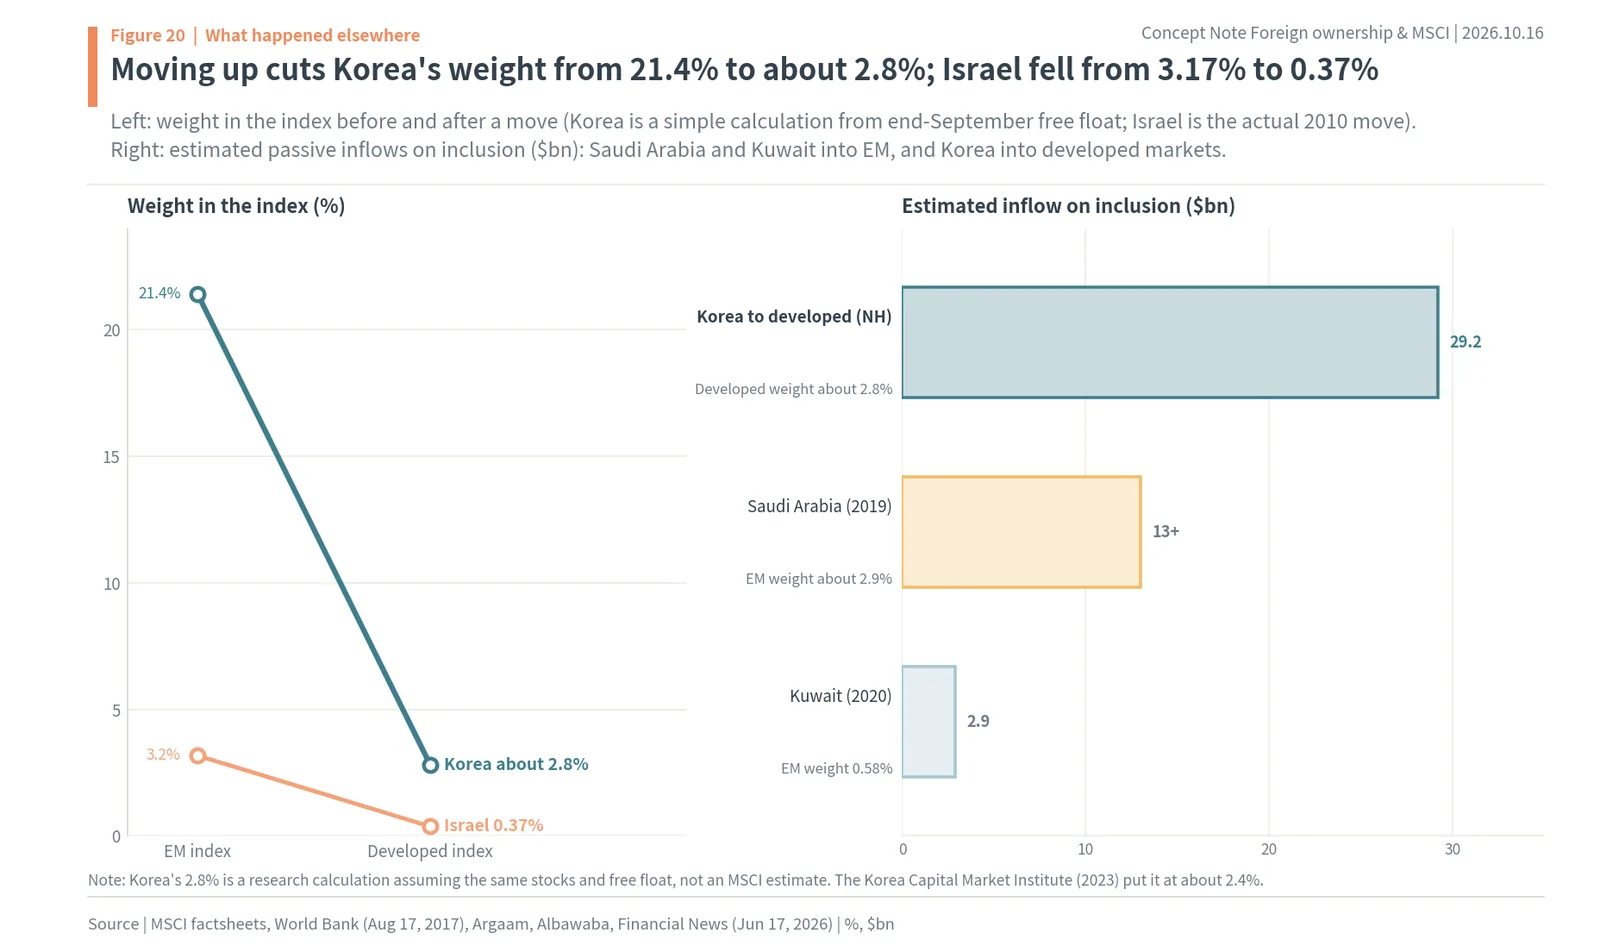
The left panel shows how index weights change when a country moves. Korea would go from 21.4% to about 2.8%; Israel went from 3.17% in EM to 0.37% in developed markets in 2010 (World Bank). After its upgrade, about $2 billion of equity money left Israel, index stocks fell about 4% in the announcement week, and the Bank of Israel reported trading volume down about 44% from May 2010 to the end of 2012 (Times of Israel). The Bank of Israel report pointed to funds tracking European indexes having no reason to move into Israel as one cause of the drop.
The right panel shows estimated inflows for countries that entered the EM index. Saudi Arabia joined in two steps in 2019 with a weight of about 2.9% and estimated passive inflows of more than $13 billion (Argaam). Kuwait joined on November 30, 2020 with a weight of 0.58% and estimated inflows of $2.9 billion (Albawaba). Greece was the only country ever moved from developed to emerging, in 2013, and returns to developed status in May 2027 (MSCI). Korea joined the FTSE developed index in 2009, and one assessment is that no clear flow effect was seen after inclusion (Hankyung Business).
These cases show that developed status does not pull money in only one direction. As the weight shrinks, so does the reason to hold Korean stocks at all. That is why the reforms behind the upgrade, easier won settlement and easier account opening, are a more direct change for foreign investors than the upgrade itself.
In developed indexes Korea’s weight would fall from 21.4% to about 2.8%, as Israel’s fell from 3.17% to 0.37%. NH’s estimated net inflow of KRW 44 trillion is 21.2% of this year’s KRW 207.6 trillion foreign net selling.
Foreigners count returns in dollars: KOSPI is up 34.5% in won this year and 43.9% in dollars
Foreign investors judge returns in dollars, not won. If KOSPI rises by the same amount, a stronger won makes the dollar return bigger and a weaker won makes it smaller. From December 30 last year to October 16, KOSPI rose 34.5% from 4,214.17 to 5,668.05, and the won-dollar rate fell 6.5% from KRW 1,434.7 to KRW 1,340.9 per dollar (a stronger won), so KOSPI in dollars rose 43.9% (Yahoo Finance FX, author’s calculation). The US-listed iShares MSCI South Korea ETF (EWY), which tracks MSCI Korea, rose 52.5%. The conclusion of this chapter: foreign performance shows up only in dollars, and this year the stronger won lifted foreigners’ dollar return 9.4 points above the won return.
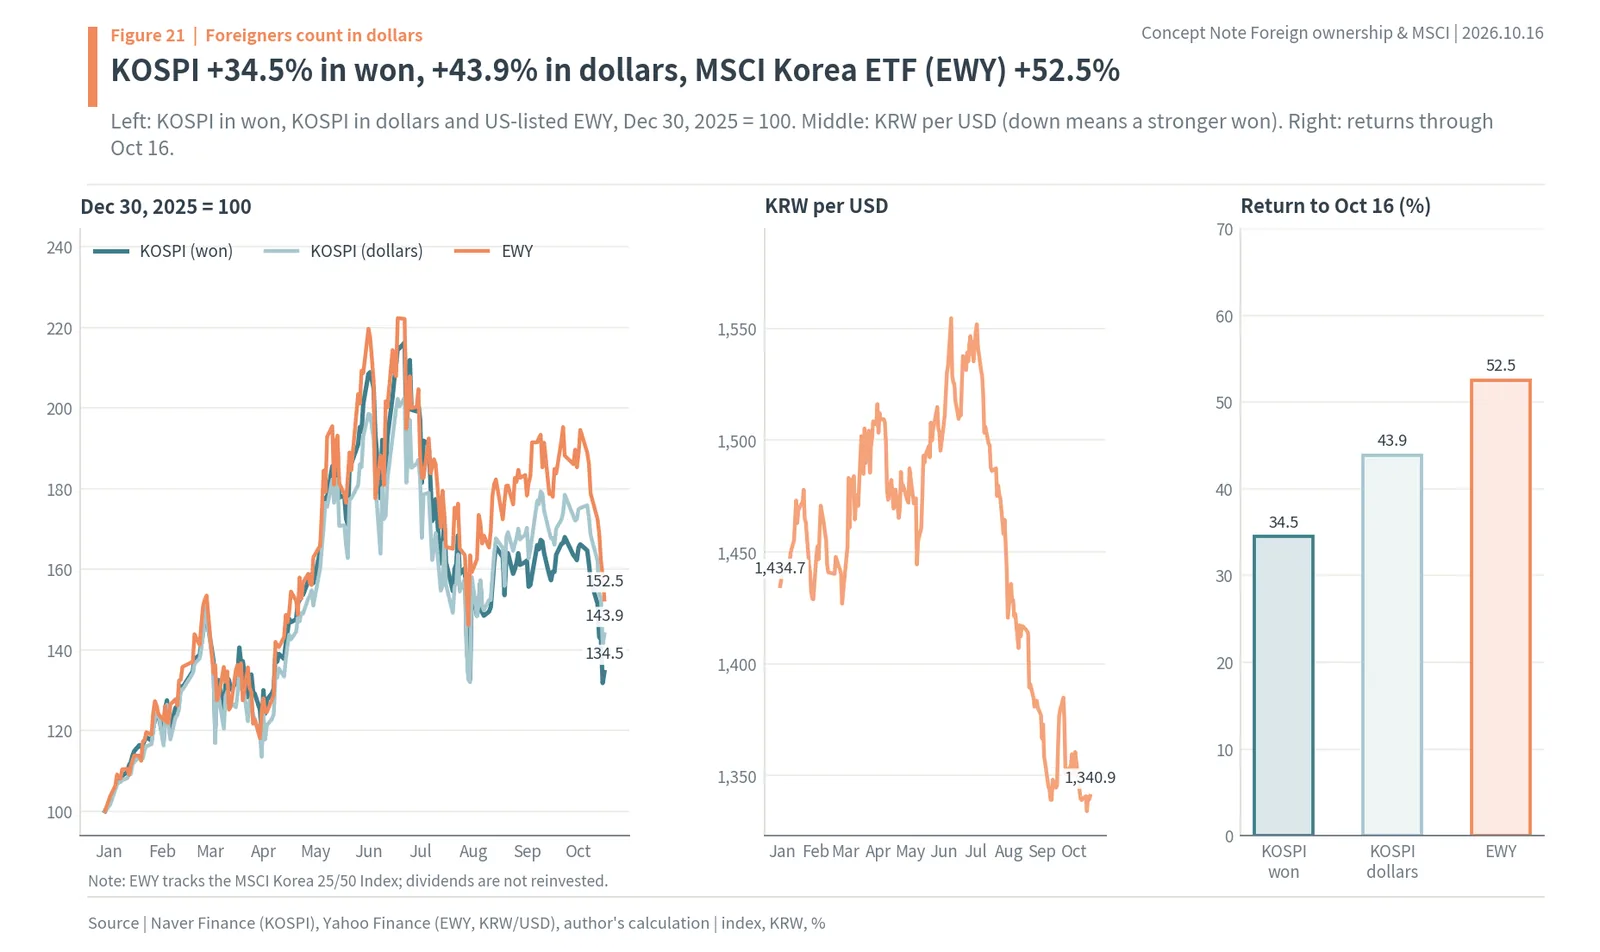
The left panel indexes KOSPI in won, KOSPI in dollars and EWY to December 30 last year. All three peaked in June and came down. The middle panel shows the won-dollar rate; a falling line means a stronger won. The right panel shows returns through October 16. The MSCI Korea index that EWY tracks is 67.3% Samsung Electronics, SK hynix and Samsung Electronics preferred, more concentrated than the 46.8% the two stocks make up of KOSPI market cap. EWY’s return is price only, without reinvested dividends.
The exchange rate also ties into relative performance. The Bank of Korea noted that from the end of August to October 14, the MSCI EM Index fell 3.5% and the developed index 1.0%, while KOSPI fell 11.9% (Econovill). Since Korea fell more than other emerging markets, its EM weight has probably dropped from 21.4% at the end of September. MSCI’s end-October factsheets are not out yet.
The won problem MSCI flagged connects here. If overseas investors cannot freely trade won offshore, they have to manage FX timing and costs separately around every Korean stock trade. The won settlement network and 24-hour FX trading are meant to ease that burden, and the point at which their effect is confirmed is where MSCI’s reclassification talks can start.
This year KOSPI is up 34.5% in won and, with the stronger won (exchange rate -6.5%), 43.9% in dollars; EWY is up 52.5%. Foreign returns show up only in dollars.
Steps to apply this to your own stock: start with foreign ownership, end with foreign room and the MSCI calendar
Here is the order for applying foreign numbers and MSCI rules to a stock you own, in eight steps. The conclusion of this chapter: do not watch only whether foreign ownership is rising or falling; check whether there is a limit, how far foreign room is from MSCI’s lines (15%, 7.5%, 3.75%), and when the next review is. The example is LG Uplus, which carries a 49% foreign limit (KRX, October 16).
Step 1 is to check foreign ownership. Look up the share-count foreign ownership ratio in your broker’s app or on the KRX Data System’s foreign holdings page. LG Uplus is at 40.88%. Step 2 is to check for a foreign limit. If the limit quantity on the same page is smaller than the listed shares, it is a limit stock. LG Uplus has a 49% limit under the Telecommunications Business Act. Step 3 is to calculate the share of the limit used: foreign holding ÷ limit. 40.88 ÷ 49 = 83.4% (author’s calculation).
Step 4 is to calculate foreign room = (limit – foreign holding) ÷ limit and compare it with MSCI’s lines. LG Uplus is at (49 – 40.88) ÷ 49 = 16.6%, above the 15% line. Foreign room hits 15% at 41.65% ownership, 7.5% at 45.33% and 3.75% at 47.16% (author’s calculation). From today’s ownership, only 0.77 point remains to the 15% line. A little more foreign buying would put LG Uplus where MSCI halves an existing constituent’s weight.
Step 5 is to check this year’s direction. LG Uplus has fallen 0.86 point from 41.74% at the end of last year. It crossed the 15% line at 42.61% on May 29 and has since come back below it (author’s calculation). Step 6 is its position in the MSCI Korea Index. Seoul Economic Daily flagged LG Uplus on September 30 as a deletion risk, with free float 47.0% below the deletion cutoff. The November 12 announcement will settle it.
Steps 7 and 8 ask why foreigners own the stock. LG Uplus has a dividend yield of 4.26% and a PBR of 0.74x (KRX, October 16). As shown earlier, stocks with high foreign ownership tend to have high dividend yields. Finally, put the dates on your calendar: October 19–30, the November review window; November 12 (early morning Korea time), the announcement; November 30 close, rebalancing; December 1, effective date; January 2027, full operation of the won settlement network; June 2027, MSCI’s annual market classification review.
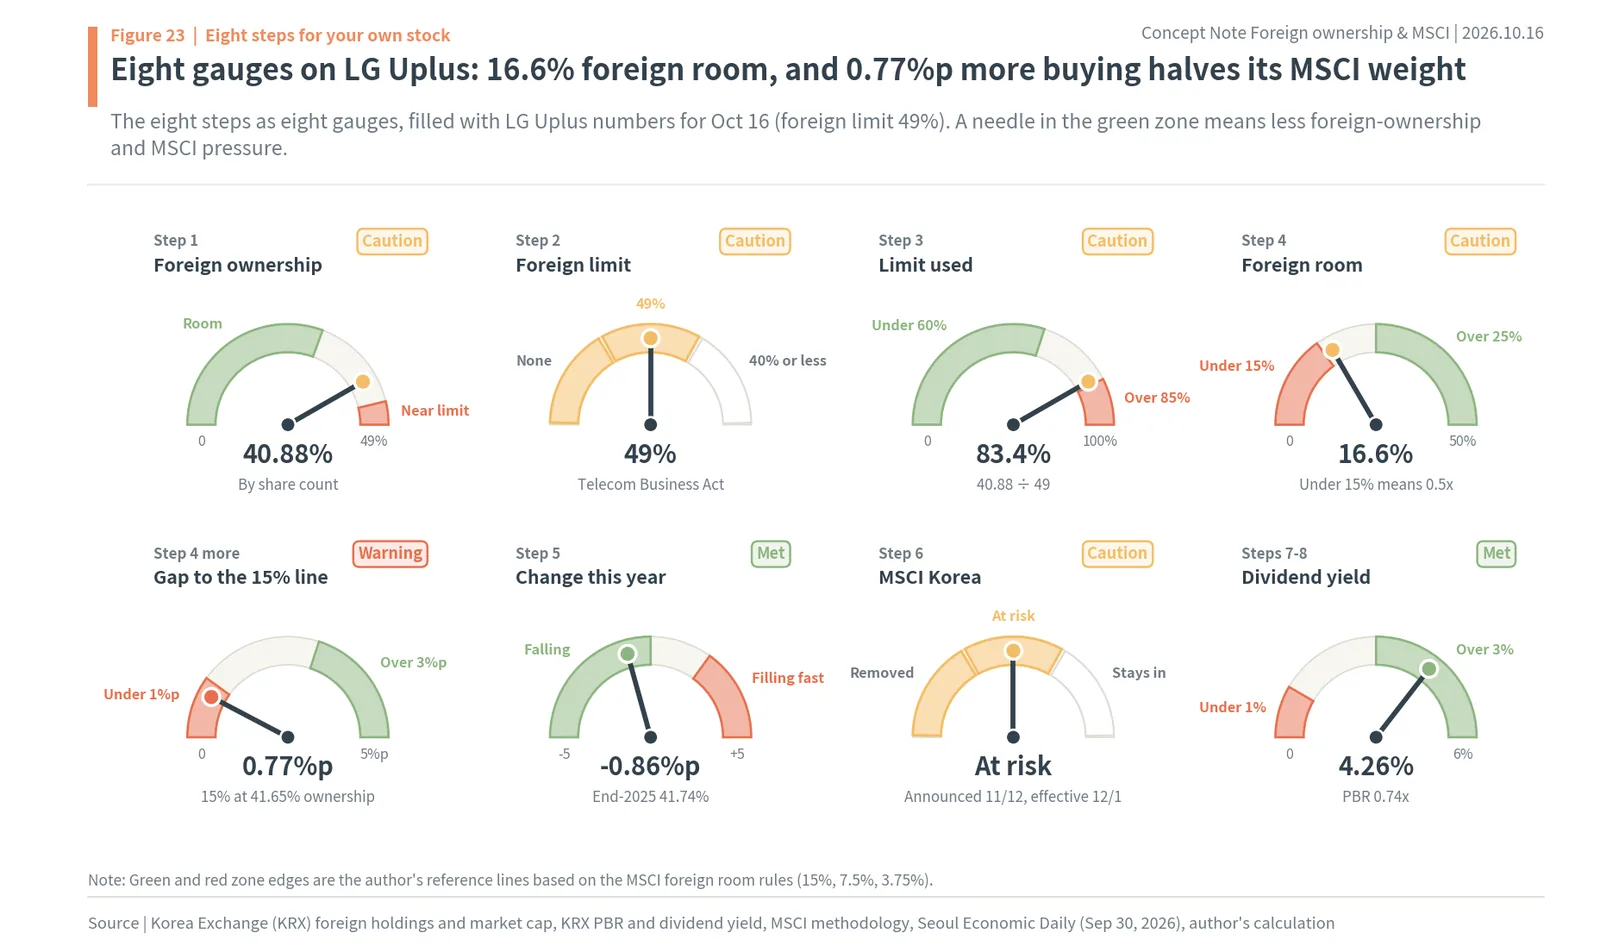
The figure turns the eight steps into eight gauges filled with LG Uplus numbers. A needle in the green zone means less foreign-ownership and MSCI pressure; red means more. The gap to the limit line (0.77 point) and the MSCI Korea deletion risk are the first gauges to watch for this stock. For a stock with no limit, skip steps 2 to 4 and focus on step 1 ownership, step 5 direction and step 6 index position. For a stock like Samsung Electronics, whose foreign ownership has fallen sharply, foreign trading moves the whole index regardless of review dates, as the earlier chapter showed.
LG Uplus has 40.88% foreign ownership, 83.4% of its limit used and 16.6% foreign room, 0.77 point from MSCI’s 15% line. Mark November 12 (MSCI announcement) and November 30 (rebalancing) on the calendar.
The basis for the numbers
The author’s calculations come from research/calc.py, with results in research/calc.json. The foreign share of the market multiplies each stock’s foreign-held shares from the KRX Data System (get_exhaustion_rates_of_foreign_investment) by the same day’s close, sums them and divides by total KOSPI market cap on that day. The dates are the last trading day of each year from 2019 to 2025 plus June 30 and October 16, 2026. Against Koscom’s count for the same day (37.38%), foreign holdings differ by about KRW 38 trillion, and this research could not pin down the cause.
Foreign net buying adds up KRX investor-type trading for total foreigners (foreigners plus other foreigners) by month; 2026 runs from January 2 to October 16. The decomposition of holdings uses stocks present at both the end of last year and October 16: the price part = (October 16 close – year-end close) x year-end foreign shares; the share part = (October 16 foreign shares – year-end foreign shares) x October 16 close. The remainder is new listings and delistings.
Foreign room follows the MSCI definition, (foreign limit – foreign holding) ÷ foreign limit, and weight factors follow the existing-constituent table in the MSCI GIMI methodology, August 2026 edition. The dividend yield and PBR comparison uses KRX values for October 16, splitting the 150 largest stocks (excluding preferred shares and those without a PBR) into five foreign ownership bands and taking medians. Reactions to the August review use Naver Finance daily closes on June 29, August 12, August 13, August 31 and October 16, subtracting KOSPI’s return (KOSDAQ’s for HLB) from each stock’s period return. Exchange rates are Yahoo Finance won-dollar (KRW=X, London close) values. Korea’s developed index weight of about 2.8% is a simple calculation from free float in the September 30 MSCI factsheets, not an official MSCI estimate.
Maochaedung’s take. The foreign ownership number hides three numbers: shares, value and room. This year foreigners sold KRW 207.6 trillion of KOSPI, yet their share rose to 38.19% because Samsung Electronics and SK hynix, 57.8% of what they hold, soared. MSCI counts only what foreigners can buy, so stocks near a legal limit, like LG Uplus with 16.6% foreign room, live on the edge of a weight cut. And developed status would shrink Korea from 21.4% of the EM index to about 2.8% of the developed one, with estimated net inflows of KRW 44 trillion, just 21.2% of this year’s selling. The reforms on the won and accounts matter more than the label.
Foreign ownership in Korean stocks and MSCI FAQ
Q. How can foreign ownership of KOSPI rise while foreigners are selling?
The foreign share of KOSPI is measured by market value. In 2026 foreigners sold a net KRW 207.6 trillion, but the stocks they own most, Samsung Electronics and SK hynix, rose much faster than the market. Price gains on their holdings (KRW 668.9 trillion) outweighed the shares they sold (KRW 142.1 trillion), so the share rose from 36.28% to 38.19% by Oct 16, 2026.
Q. Which Korean stocks have foreign ownership limits?
Telecom carriers (SK Telecom, KT, LG Uplus) are capped at 49% under the Telecommunications Business Act, KEPCO at 40% and KOGAS at 30%, and airlines also restrict foreign stakes. On Oct 16, 2026, 17 KOSPI stocks had a separate foreign limit, and KT had been full at 49% since Nov 5, 2024.
Q. What is foreign room and why does MSCI care?
Foreign room is (foreign limit – foreign holding) divided by the limit. MSCI only counts shares foreigners can buy, so it halves an existing constituent’s weight below 15% foreign room, cuts it to 0.25x below 7.5% and to zero below 3.75%. SK Telecom was removed from MSCI Korea in 2022 with about 3.3% foreign room.
Q. When could Korea join MSCI developed markets?
MSCI did not add Korea to its watch list in June 2026, citing offshore won settlement, onshore FX liquidity, omnibus accounts and short selling compliance. NH Investment & Securities sees the fastest path as watch list in June 2027, a decision in June 2028 and actual inclusion in 2029.
Q. How much money would MSCI developed status bring to Korea?
Estimates range widely: NH Investment & Securities (2026) sees about $29.2 billion (KRW 44 trillion) of passive net inflows with $5.2 billion leaving EM funds, Goldman Sachs (2023) about $56 billion. Korea’s index weight would fall from 21.4% of EM to about 2.8% of developed markets, and NH’s estimate equals 21.2% of foreign net selling in 2026.
Sources
- Korea Exchange (KRX) Data System, foreign holdings, market cap, trading by investor type, PER, PBR and dividend yield (via pykrx), Oct 16, 2026
- Naver Finance, daily prices (KOSPI, KOSDAQ, LG Innotek, Samsung Epis Holdings, POSCO International, LG Display, HLB), retrieved Oct 18, 2026
- Yahoo Finance, KRW per USD (KRW=X) and EWY daily prices, retrieved Oct 18, 2026
- MSCI, Emerging Markets Index, Korea Index and ACWI factsheets (link), Sep 30, 2026
- MSCI, Global Investable Market Indexes Methodology (link), Aug 2026
- MSCI, 2026 Market Classification Review results (link), Jun 23, 2026
- MSCI, 2026 Global Market Accessibility Review report, Jun 2026
- MSCI, Consultation on the reclassification of Indonesia (link), Oct 15, 2026
- MSCI, MSCI to reclassify the MSCI Greece Indexes (link), Mar 31, 2026
- MSCI, Index review calendar (link), Aug 12, 2026
- MSCI, Market classification review results press releases, Jun 15, 2009 and Jun 10, 2014
- World Bank blog, International asset allocations and capital flows: the benchmark effect (link), Aug 17, 2017
- Times of Israel, Waiting for a nod, Israeli traders eye global investor vote (link), Jan 25, 2022
- Financial News, Foreign share of market cap at 37.38% (link), Oct 18, 2026
- Herald Economy, Foreign share hit 41.56% on Jun 25 (link), Oct 15, 2026
- Herald Economy, Foreign net selling reaches KRW 208tn (link), Oct 16, 2026
- Hankyung, Samsung Electronics foreign ownership at an 18-year low (link), Oct 11, 2026
- Hankyung, Indonesian stocks plunge 11% (link), Oct 16, 2026
- Econovill, Bank of Korea September international finance and FX market trends (link), Oct 16, 2026
- Digital Times, Won borrowing reporting threshold raised to KRW 50bn (link), Oct 13, 2026
- Seoul Economic Daily, No stock meets the November MSCI inclusion bar (link), Sep 30, 2026
- Money Today, August MSCI review results (link), Aug 14, 2026
- Money Today, Korea misses the MSCI watch list (link), Jun 24, 2026
- Eugene Investment & Securities (Kang Song-cheol), August MSCI review preview (link), Jul 31, 2026
- Financial News, NH Investment & Securities estimate of developed index inflows (link), Jun 17, 2026
- Financial News, MSCI inclusion scenario (link), Jun 17, 2026
- Asia Economy, MSCI accessibility review (link), Jun 19, 2026
- Asia Economy, Foreign limits at the three telecoms (link), Dec 26, 2025
- Asia Economy, Record foreign share of KOSPI at 44.12% (link), Sep 17, 2026
- MTN, 24-hour FX market (link), Jul 6, 2026
- Sidae Ilbo, Won settlement network pilot (link), Sep 21, 2026
- Financial Services Commission, Foreign investor registration scrapped (link), 2023
- Newsis, SK Telecom removed from MSCI (link), Aug 18, 2022
- Hankyung, LIG Nex1 falls on MSCI inclusion announcement (link), Aug 8, 2025
- Bizwatch, MSCI accessibility review 2022 (link), Jun 29, 2022
- eToday, Goldman Sachs and Korea Capital Market Institute inflow estimates (link), Mar 24, 2023
- iNews24, Korea Economic Research Institute inflow estimate (link), May 4, 2021
- Hankyung Business, Gains and losses of MSCI developed status (link), Feb 7, 2022
- Seoul Economic Daily (English), Korea’s MSCI weighting doubles in 8 months (link), May 20, 2026
- Jeonbuk Ilbo, Foreign share at the end of 2008 (link), Jan 3, 2010
- Smart Today, Stocks with foreign ownership limits (link), Mar 20, 2023
- Argaam, Saudi MSCI inclusion inflow estimate (link)
- Albawaba, Kuwait passive flows projected to hit $2.9bn (link), 2020
- Korea Financial Newspaper and Yonhap Infomax, 30 of 39 MSCI roadmap tasks done, Sep 28, 2026
- Photo: Yaniv Morozovsky, “Tel Aviv Stock Exchange – New Building Lobby 2” (link), CC BY-SA 4.0, Wikimedia Commons, taken Sep 8, 2014
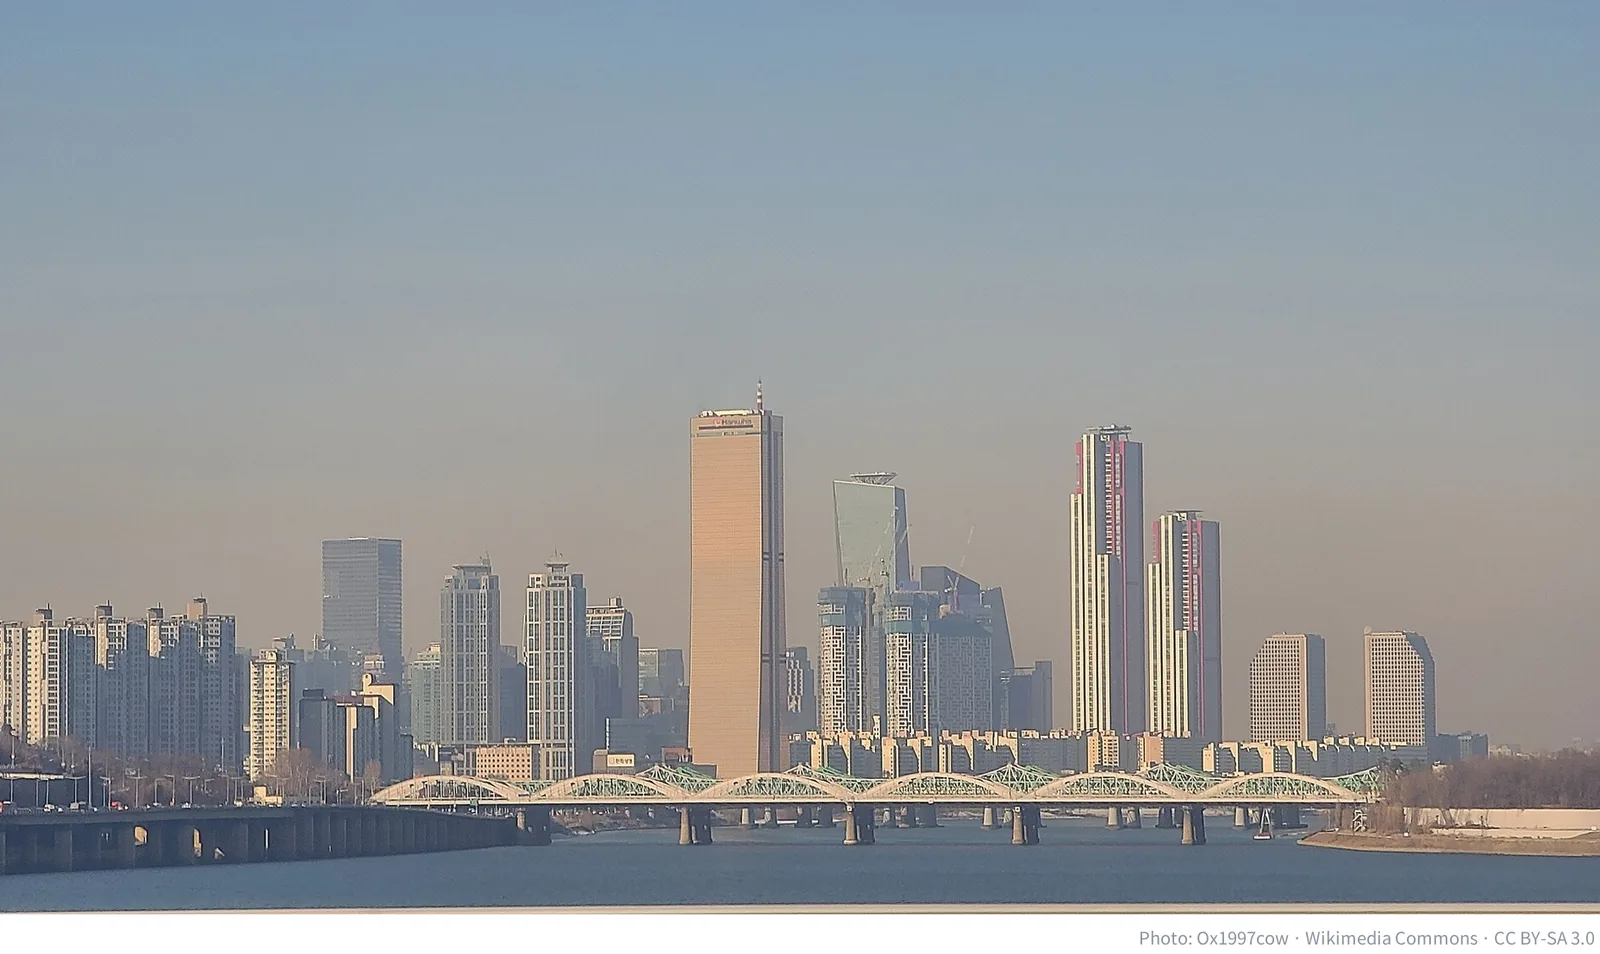
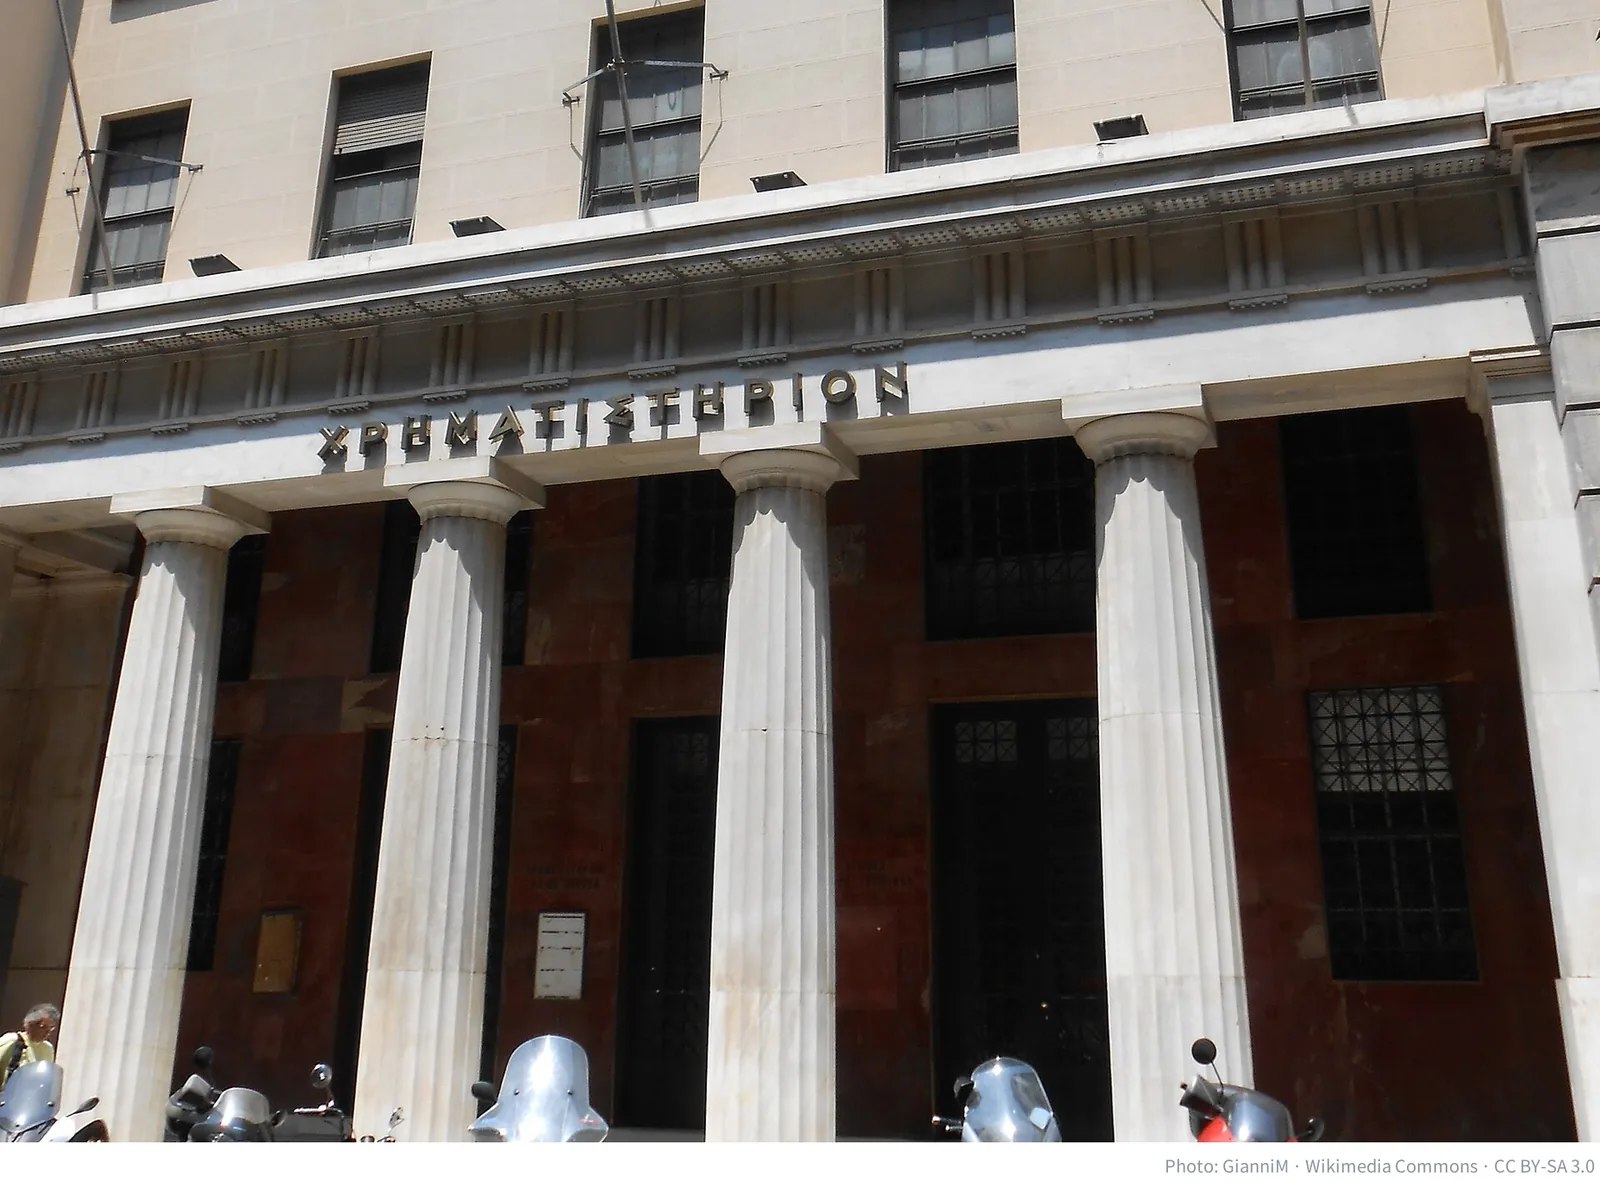
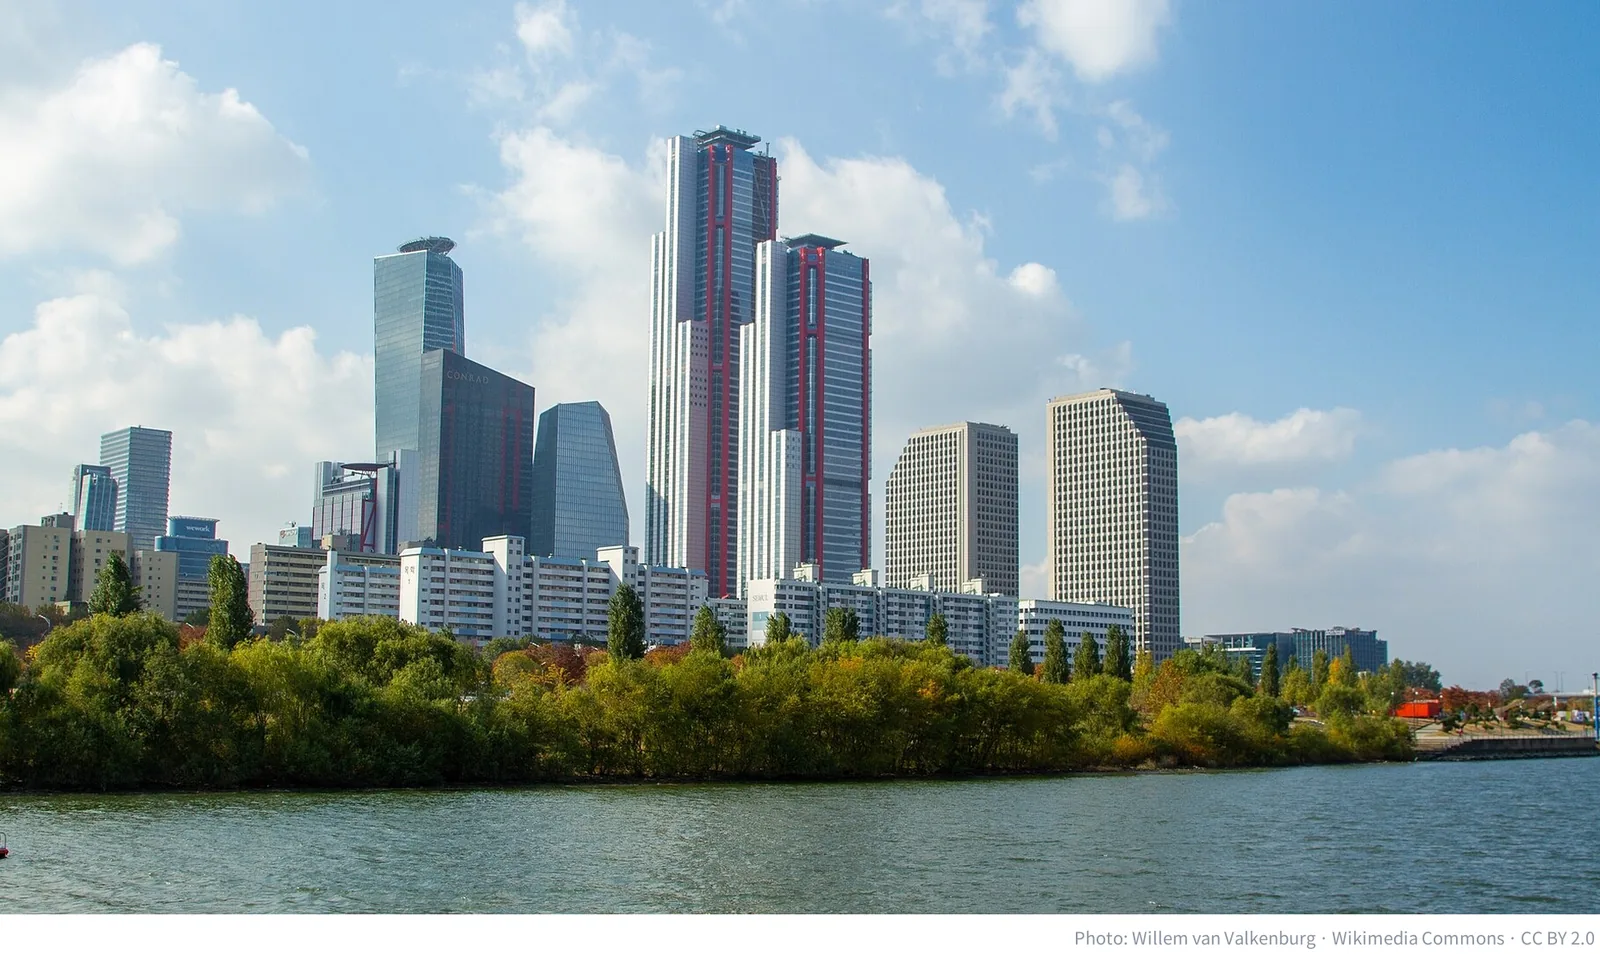
- Photos: Ox1997cow, “Skyscrapers of Yeouido seen from Dongjak Bridge”, CC BY-SA 3.0; hyolee2, “Korea exchange”, CC BY-SA 3.0; 钉钉 (Dingding), “Shanghai Stock Exchange 2”, CC BY-SA 4.0; GianniM, “Old Athens Stock Exchange Sofokleous”, CC BY-SA 3.0; Willem van Valkenburg, “November 2019 Yeouido 02”, CC BY 2.0 (all Wikimedia Commons)
Was this note useful?
Thanks. Your answer helps decide what to cover next.
Korea market snapshot · Oct 23, 2026
New to Korean stocks? Start here for the basics.
Most read
1France Protests 2026: Why Students Are Blocking Schools and Which Stocks Benefit (Munich Re, SCOR)
Get the Saturday note on Korean stocks
One email every Saturday with the week’s new research on Korean listed companies and links to the updated data pages. Built from DART filings and KRX data. Free; unsubscribe in one click. See past issues