Leveraged ETF Decay in Korea: the KOSPI 200 Rose 47.0% in 2026, but KODEX Leverage Made Only 49.9%
On August 18, 2009, the US Financial Industry Regulatory Authority (FINRA) and the Securities and Exchange Commission (SEC) issued a joint investor alert titled “Leveraged and Inverse ETFs: Specialized Products with Extra Risks for Buy-and-Hold Investors.” The example in the alert was short. From December 1, 2008 to April 30, 2009, the US Russell 1000 Financial Services index rose about 8%, yet an ETF built to deliver three times that index’s daily return fell 53%. An ETF built to deliver three times the inverse of the daily return also fell 90% over the same period. Over a stretch when the index went up, both the 3x product and the inverse 3x product lost heavily. The two regulators explained that “most leveraged and inverse ETFs ‘reset’ daily,” so their performance over weeks, months or years can differ significantly from the index (FINRA press release, August 18, 2009).
Seventeen years later, the Korean market in 2026 showed the alert’s example again with much bigger numbers. The KOSPI 200 rose 47.0%, from 605.98 at the end of 2025 to 891.01 on October 21. Doubling the index’s period return gives 94.1%. Yet the net asset value (NAV) of KODEX Leverage, which tracks twice the KOSPI 200’s daily return, rose only 49.9% over the same period. So what ate into the leveraged fund’s share this time? This report starts with what it means for leveraged and inverse ETFs to track a “daily” multiple, then checks, step by step with formulas and real numbers, how that structure separates the period return from a multiple of the index, and by how much.
This report is the full English edition of Maochaedung’s Korean note on leveraged and inverse ETF decay in Korea, with the KRX NAV data behind every number.
As of: October 21, 2026 (Korean ETFs at the NAV published by the Korea Exchange, indexes at the KRX close; US ETFs at the October 20 US close). Dollar amounts use KRW 1,324.7 per dollar, the October 21, 2026 close (Yahoo Finance, KRW=X).
Concepts covered: leveraged ETFs and inverse ETFs; the inverse 2x ETF that Korean investors call “gopbeoseu”; daily resetting of the multiple (rebalancing); negative compounding (volatility drag); annualized volatility; holding period and results
Reference data: Korean ETFs use daily NAV and underlying index values from the KRX Data System (January 2010 to October 21, 2026, via pykrx). The KOSPI 200 is the underlying index of KODEX 200, and the KOSDAQ 150 is KRX index data. US ETFs (QQQ, TQQQ, SQQQ, SOXX, SOXL, SOXS) use Yahoo Finance daily closes. Values the author calculated are marked as the author’s calculations.
How it works in Korea
Korean stocks trade on two boards run by the Korea Exchange (KRX): KOSPI, the main board where Samsung Electronics and SK hynix are listed, and KOSDAQ, the growth board for smaller companies. The KOSPI 200 is the index of 200 large KOSPI stocks, and the KOSDAQ 150 is its counterpart for 150 KOSDAQ stocks. Korea’s best-known leveraged and inverse ETFs, KODEX Leverage (2x), KODEX Inverse (-1x) and KODEX 200 Futures Inverse 2X (-2x), track the KOSPI 200’s daily return by trading KOSPI 200 futures, and KRX publishes each ETF’s NAV every day, which is how this report can measure what the products themselves delivered. Korean retail investors call the -2x product “gopbeoseu,” a blend of the Korean word for “double” and “inverse.” Buying these products also has an entry gate. Since the Financial Services Commission’s 2020 plan to clean up the ETF and ETN market, an individual buying a leveraged ETF must first hold a basic deposit of KRW 10mn (about $7,500) and complete an online course run by the Korea Financial Investment Association (KOFIA). From July 31, 2026, single-stock leveraged products, such as those tracking twice Samsung Electronics or SK hynix, require KRW 30mn (about $22,600) in cash.
Words to know first: leveraged and inverse ETFs track a “daily” multiple, and NAV is the product’s actual value
Before the main part, here are the terms this report uses often. The point is one: when we talk about leveraged and inverse ETFs, the multiple is always a “daily” multiple, and to judge their results we look at net asset value (NAV) rather than the market price.
A leveraged ETF is an exchange-traded fund built to track a fixed multiple (in Korea usually 2x) of its underlying index’s daily return. KODEX Leverage tracks twice the KOSPI 200’s daily return, and KODEX KOSDAQ150 Leverage tracks twice the KOSDAQ 150’s daily return. The US has many 3x products as well. TQQQ, which tracks three times the Nasdaq-100, and SOXL, which tracks three times a semiconductor index, are well-known examples among Korean investors.
An inverse ETF tracks the opposite direction of the underlying index’s daily return. A product at -1x a day is simply called an inverse, and a product at -2x a day is called an inverse 2X, or “gopbeoseu” in Korean slang. In this report, the inverse 2x is KODEX 200 Futures Inverse 2X. In the US, SQQQ and SOXS are -3x daily products.
Net asset value (NAV) is the value per share of the assets an ETF holds, divided by the number of shares. An ETF’s market price is set between buyers and sellers and can sit slightly above or below NAV. To see how well a product kept its daily multiple, look at NAV; to see what an investor actually earned, look at the prices at which they bought and sold.
Futures on the underlying index are what leveraged and inverse ETFs actually trade. Korea’s KOSPI 200 leveraged and inverse products hit their multiple with KOSPI 200 futures. Futures expire, so at every expiry the fund has to roll into the next contract, and there is a gap between the futures price and the spot index. These costs and the management fee mix into NAV, so even on a single day the result is not exactly twice the index.
Rebalancing is the trade made after the close each day to reset the multiple. On up days the fund adds index exposure; on down days it cuts it. This daily trading keeps the “daily 2x” promise and, at the same time, pulls the period return away from twice the index.
Volatility in this report is the annualized figure: the standard deviation of daily returns times √250. A volatility of 20% means daily returns with a standard deviation of about 1.26%; 65.7% means a daily standard deviation of about 4.16%. Negative compounding (volatility drag) is the part by which a multiple product’s period return falls short of the direction part because of those swings.
This report reads a leveraged product’s period result as two parts. The direction part is the index’s period return compounded by the multiple. If the index rises 10% over a period, the 2x direction part is 1.1², or 21%. The swing part is what is left when the actual result is divided by the direction part: the share taken away by the ups and downs during the period. “Period 2x” means simply multiplying the index’s period return by 2 (20% for 10%). It is the number many investors expect, but it is not the number the product promises.
A leveraged ETF is not twice the period; it strings together “daily” doubles, day after day
The most common calculation for someone buying a leveraged ETF for the first time is “if the index rises 10%, I make 20%.” For one day, that is right. Stretch it to a month or a year and it becomes wrong. The conclusion of this chapter is this: leveraged and inverse ETFs reset to a multiple of the daily return at each day’s close, so the period return is the daily return times the multiple, compounded day after day. Even if the index merely goes up and down, that product becomes smaller than the index’s period return times the multiple.
The multiple is reset every day
KODEX Leverage buys KOSPI 200 futures and is run so that its daily return is twice the KOSPI 200’s. If the index rises 1% in a day, this ETF rises 2%. The problem is the next day. If net assets go from 100 to 102 on day one, the manager has to lift index exposure from 202 to 204 to keep 2x the next day. It buys more on up days and sells on down days. The inverse does the opposite to hold -1x of the daily return, and the inverse 2X, the gopbeoseu, holds -2x. This daily resetting is both the product’s promise and the reason its period return drifts away from a multiple of the index.
Resetting is a trade that “buys after a rise and sells after a fall.” When the index moves steadily in one direction, this trade adds to gains, because the next day’s rise lands on a larger exposure. When the index keeps going up and down, it means buying high and selling low over and over. This is the loss usually called “negative compounding” or “volatility drag.”
Buy on up days, sell on down days
The size of the resetting trade comes from a simple formula. When the index moves r in a day, the amount bought or sold to reset the multiple the next day is multiple × (multiple − 1) × r of net assets. For a 2x product that is 2 × 1 = 2; for an inverse (-1x), (-1) × (-2) = 2; for the inverse 2x (-2x), (-2) × (-3) = 6; and for a 3x, 3 × 2 = 6. If the index rises 5% in a day, the 2x and inverse add index exposure equal to 10% of net assets, and the inverse 2x and 3x add 30%. The leveraged fund buys more futures; the inverse fund buys by covering part of its short position. If the index falls 5%, they sell by the same amount (author’s calculation).
This trade runs in the same direction for every multiple product. Leveraged or inverse, they buy near the close on days the index rose and sell on days it fell. On July 31 this year, the KOSPI 200 rose 20.0% in a day. To reset the multiple after that close, the 2x had to buy an extra 40% of NAV and the inverse 2x an extra 120%. On a day like July 28, when the index fell 11.6%, the 2x sells 23.2% of NAV and the inverse 2x 69.6%.
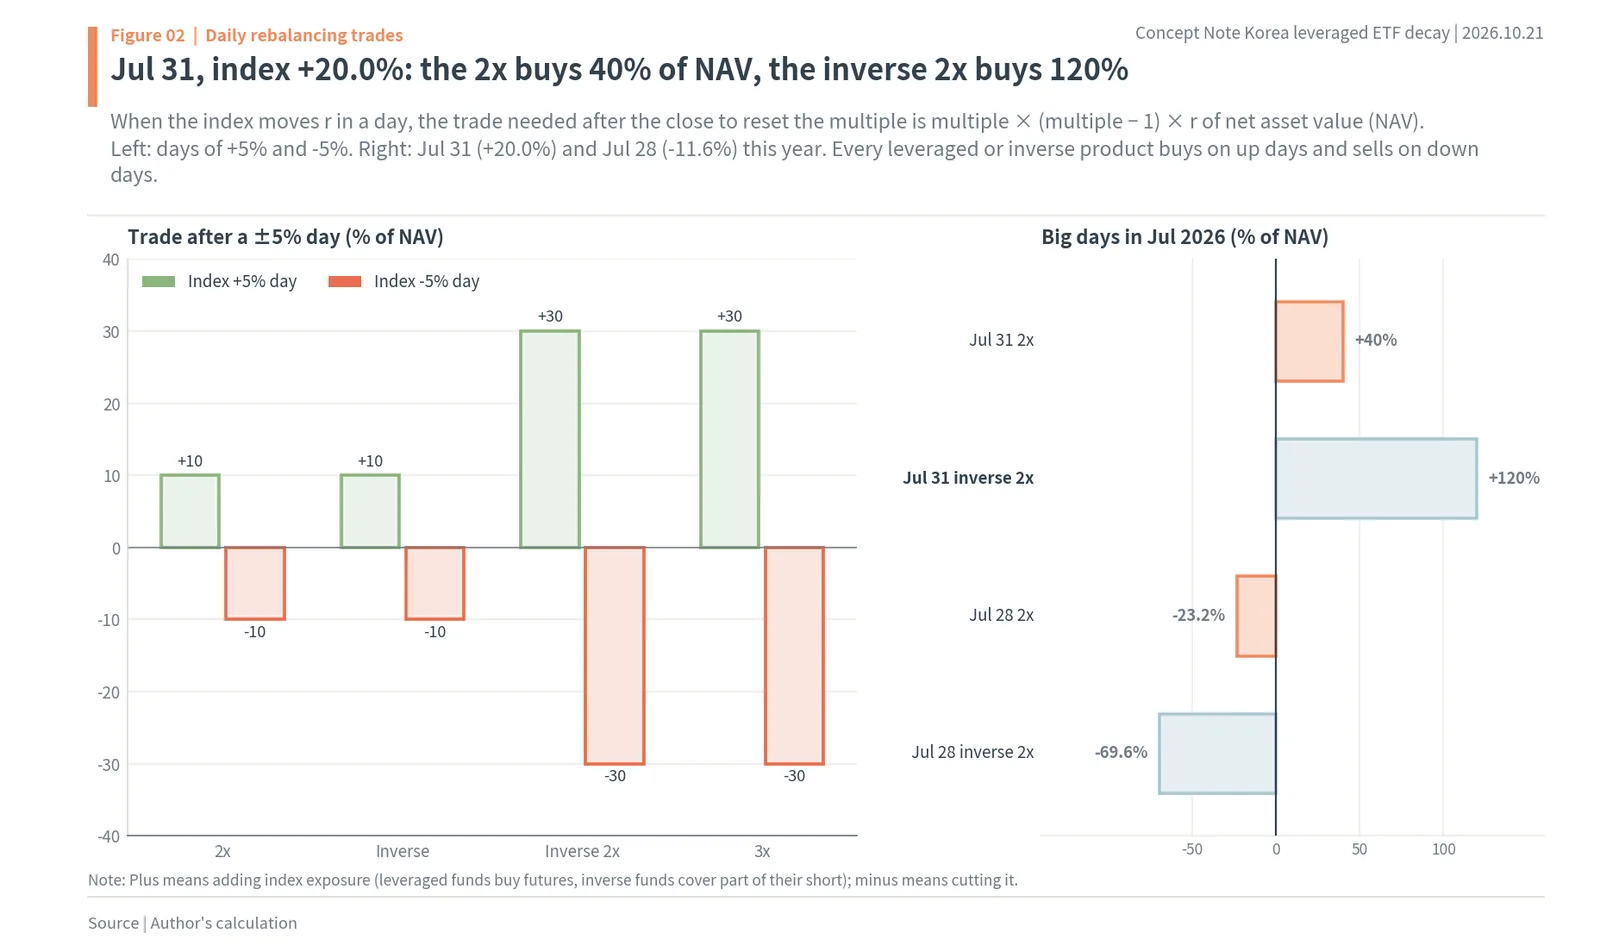
As the figure shows, with the index up 20.0% on Jul 31, the 2x buys 40% of NAV and the inverse 2x buys 120%. The inverse 2x trades in the same size as a 3x because the coefficient is the same. Because its name says “-2x,” the inverse 2x looks like a mirror image of the 2x, but in daily trading size and swing cost it belongs in the same group as 3x products. The next chapter confirms this with the formula.
Even two days show the gap
Take the simplest example. An index starting at 100 rises 10% on day one to 110, then falls 10% on day two to 99. Over two days the index lost 1%. A daily 2x product rises 20% on day one to 120 and falls 20% on day two to 96. It lost not 2% but 4%. A daily 3x product goes from 130 to 91, a 9% loss. The inverse 2x falls 20% on day one to 80, then rises 20% on day two to 96, losing the same 4% as the 2x. The inverse (-1x) goes from 90 to 99, losing the same 1% as the index.

As the figure shows, with the index +10% then -10%, the index ends at -1.0%, the 2x at -4.0% and the 3x at -9.0% (before fees and futures costs). The multiple rose by just 1, from 2 to 3, but the loss more than doubled, from 4% to 9%. It is the first sign that the loss grows not in proportion to the multiple but closer to its square.
The share taken away grows with the square of volatility, and the inverse 2x and 3x lose three times as much as the 2x
The two-day example is extreme. Real indexes rarely move 10% a day. So this chapter asks a more general question: when an index neither rises nor falls much but simply goes up and down, how much does a multiple product lose over the period? Starting with the conclusion, the share lost in a year is roughly (multiple² − multiple) ÷ 2 × volatility². That coefficient is 1 for the 2x and the inverse (-1x), and 3 for the inverse 2x (-2x) and 3x.
Up and down for 20 days
Take a hypothetical index that goes +5% one day and -5% the next, for 20 trading days. Starting at 100, it ends at 97.5 after 20 days, almost where it began. A daily 2x product alternates +10% and -10% and ends at 90.4; the inverse 2x alternates -10% and +10% and ends at the same 90.4. A daily 3x product ends at 79.7. In the 20-day ±5% zigzag, the index is -2.5%, the 2x and inverse 2x are -9.6%, and the 3x is -20.3% (author’s calculation). The inverse (-1x) is -2.5%, the same as the index.

It stands out that the inverse 2x ends at the same value as the 2x even though it moves in the opposite direction. The direction is opposite, but the size of the daily swing is the same. Negative compounding comes not from direction but from swings. Calling the direction right and surviving the swings are two different problems.
In a formula
If the average daily return is small and the swings are steady, the period value of a product with multiple L can be written as follows. Product value ≈ (index value)^L × exp(−(L² − L) ÷ 2 × volatility² × time). In words, there are two parts. The first, (index value)^L, is the direction part. If the index rises 10% in a year, the 2x product makes 1.1² = 1.21, or 21%. The second is the swing part. It gets smaller as the index’s annual volatility rises, as the period lengthens and as the multiple grows. Here annual volatility is the standard deviation of daily returns times √250.
Why a square appears is clear from a single day. Converting a daily return r to a log return gives roughly r − r² ÷ 2. The multiple product’s daily log return is L × r − (L × r)² ÷ 2, and L times the index’s daily log return is L × r − L × r² ÷ 2. The difference is (L² − L) × r² ÷ 2 per day. As this difference piles up day after day, it becomes the sum of r², that is, the variance over the period (volatility² × time), times (L² − L) ÷ 2. Because daily moves are squared before they are added, one day with a 2% move takes away as much as four days with a 1% move.
Calculating (L² − L) ÷ 2 for each multiple gives (4 − 2) ÷ 2 = 1 for the 2x, (1 + 1) ÷ 2 = 1 for the inverse (-1x), (4 + 2) ÷ 2 = 3 for the inverse 2x (-2x), (9 − 3) ÷ 2 = 3 for the 3x, and (9 + 3) ÷ 2 = 6 for the -3x. So the 2x and the inverse lose the same amount to the same swings, and the inverse 2x and the 3x lose three times as much. It is the same story as the two-day example in the previous chapter, where the 2x and the inverse 2x both lost 4% and the inverse lost the same 1% as the index.
Putting numbers into this formula, at an underlying annual volatility of 20%, a year takes away 3.9% from the 2x and 11.3% from the inverse 2x. At 60% volatility, the 2x loses 30.2% and the inverse 2x 66.0% (author’s calculation). This share comes from swings alone, whatever the index’s direction; management fees and futures pricing gaps come on top.

The right side of the figure compares the one-year cost by multiple at two volatility levels. At 20% volatility, the 2x and inverse lose 3.9%, the inverse 2x and 3x 11.3%, and the -3x 21.3%. At this year’s KOSPI 200 volatility of 65.7%, the 2x and inverse lose 35.1%, the inverse 2x and 3x 72.6%, and the -3x 92.5%. When volatility rose a little more than threefold, from 20% to 65.7%, the 2x’s cost grew ninefold, from 3.9% to 35.1%. That is because the share taken away is proportional to the square of volatility.
In a normal Korean market
From 2010 to 2024, the KOSPI 200’s annual volatility was 17.5% (KRX, author’s calculation). With swings of that size, the 2x loses 3.0% a year and the inverse 2x 8.8%. So in most years the leveraged fund did not stray far from twice the index, and investors grew used to the “roughly 2x” calculation. 2026 was the year that familiar calculation stopped working.
Hypothetical example: with the same +10% year for the index, a 2x product ranges from +21.0% to -21.4% depending on the path
Let us make the formula concrete once more. Take three cases in which the index rises the same 10% over a year and only the path differs. The conclusion is that even when the index’s period return is the same, the leveraged product’s result varies widely with how much the path swings, and when the swings are as big as this year’s, a 2x product loses money even though the index went up.
The first path rises by the same rate every day, with no swings, to reach 10% in a year. Here the 2x product makes 1.1², or 21.0%, and the 3x product makes 1.1³, or 33.1%. The inverse 2x loses 17.4%, since it ends at 1 ÷ 1.1². The period return comes out slightly above the index times the multiple; it is the best path for a leveraged product.
The second path swings at the normal volatility of 17.5% and reaches 10% in a year. That was about the size of the KOSPI 200’s swings from 2010 to 2024. The 2x product makes 17.4% and the 3x product 21.4%. The inverse 2x loses 24.6% (author’s calculation). It makes a little less than twice the index (20%), but not far from the “roughly 2x” feel.
The third path swings at this year’s KOSPI 200 volatility of 65.7% and reaches 10% in a year. The 2x product loses 21.4% and the 3x product loses 63.5%. The inverse 2x loses 77.4% (author’s calculation). The index rose 10%, yet the 2x and 3x lost money, and the inverse 2x, which bet on a fall in the index, lost far more than its direction part.

As the figure’s title says, with the same +10% year for the index, the 2x makes +21.0% with no swings, +17.4% in a normal year and -21.4% with this year’s swings. In all three cases, the index starts and ends at the same place. The point of this example is that a leveraged product is priced not only on where it starts and ends but on the whole path in between.
In 2026 the KOSPI 200 rose 47.0%, and KODEX Leverage, at twice the daily return, rose 49.9%
This year the Korean market created the harshest conditions for leveraged products. The index rose a lot, but not in a straight line. The conclusion of this chapter is that this year KODEX Leverage made about as much as the index, not twice the index. There is one reason: the index’s swings were three to four times their usual size.
This year in numbers
The KOSPI 200 rose 47.0%, from 605.98 at the end of 2025 to 891.01 on October 21. Over the same period, KODEX Leverage’s NAV rose 49.9%, from KRW 48,104 (about $36.3) to KRW 72,085 (about $54.4). KODEX Inverse fell 50.7%, and the inverse 2x, KODEX 200 Futures Inverse 2X, fell 83.4% (KRX NAV, author’s calculation).

Doubling the index’s period return gives 94.1%, so the leveraged fund made 44.2 percentage points less than that “period 2x.” The left side of the figure below sets December 30, 2025 to 100 and draws the KOSPI 200, a hypothetical period-2x line, KODEX Leverage and the inverse 2x together. KODEX Leverage stayed above the period-2x line through the first half, then fell below it from July and did not climb back.
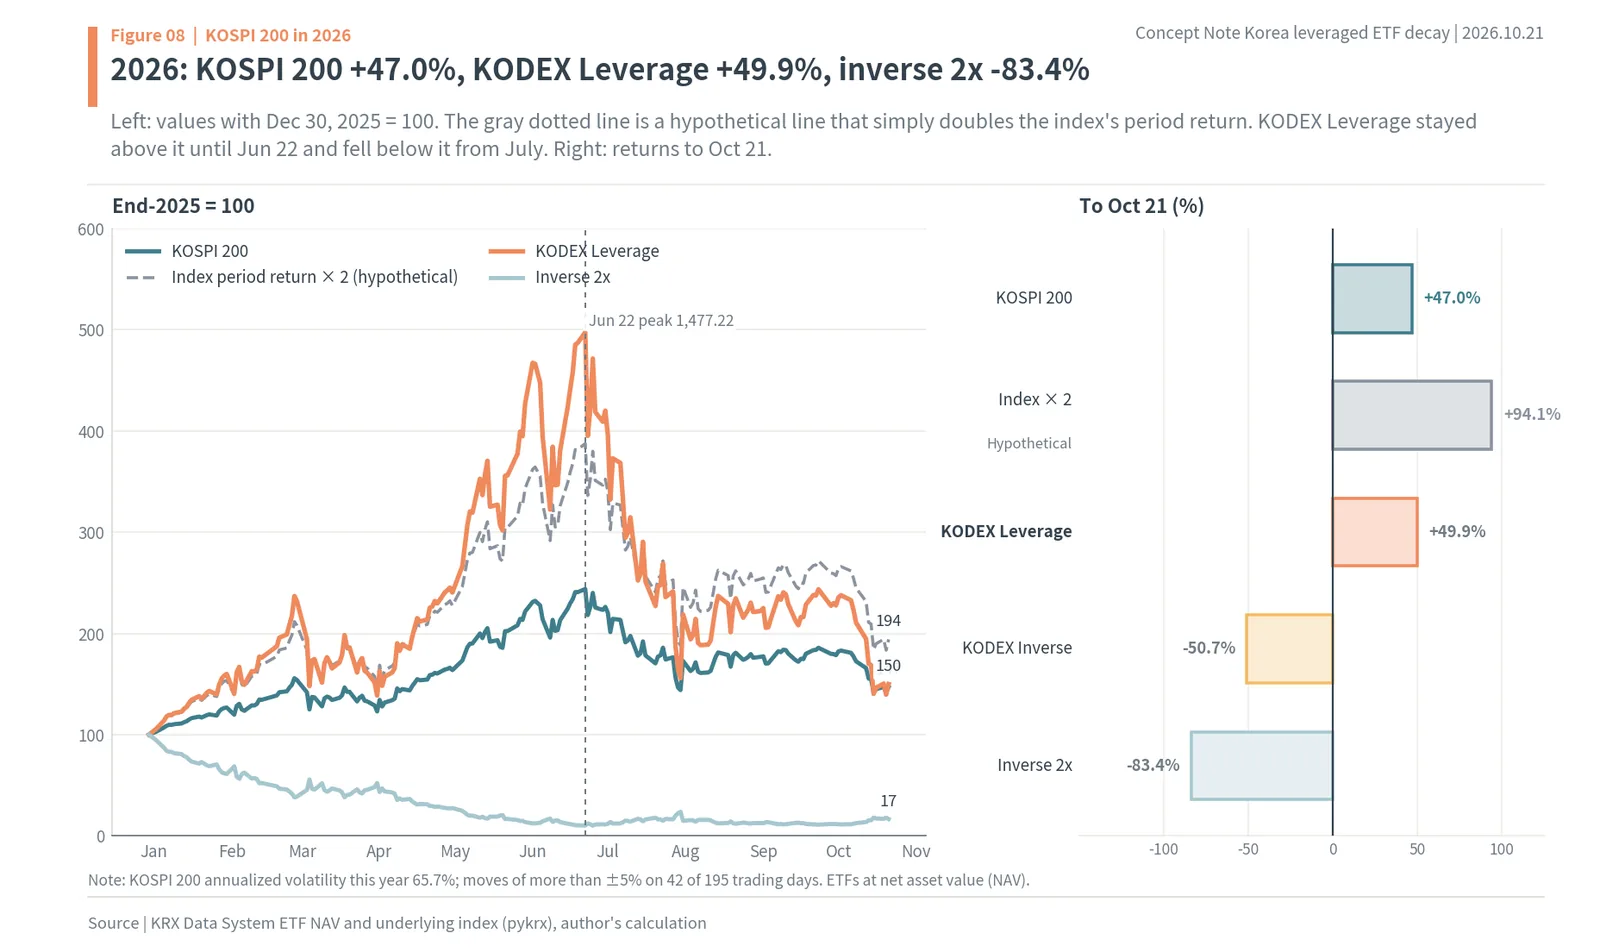
Summing up with the figure’s numbers: in 2026 the KOSPI 200 is +47.0%, KODEX Leverage +49.9% and the inverse 2x -83.4%. This year the KOSPI 200’s annualized volatility was 65.7%, and it moved more than ±5% on 42 of 195 trading days (KRX, author’s calculation). That is nearly four times the 17.5% annual volatility of 2010 to 2024. Putting this volatility and the period (0.78 years) into the previous chapter’s formula and multiplying by the index’s direction part (1.47²) gives a theoretical value of +54.4% for the leveraged fund. The gap from the actual +49.9% can be read as costs such as management fees and futures pricing gaps.
The swings were the biggest in 16 years
How big this year’s swings were becomes clear on a long chart. Annualizing the standard deviation of the KOSPI 200’s daily returns over the most recent 60 trading days, the median from 2010 to 2024 was 14.8%. The big peaks until now were 41.5% in the second half of 2011 and 46.2% in April 2020. This year the measure crossed those lines from January and rose to 88.1% on July 31 (author’s calculation). As of October 21, volatility over the past 60 trading days is still 69.2%.
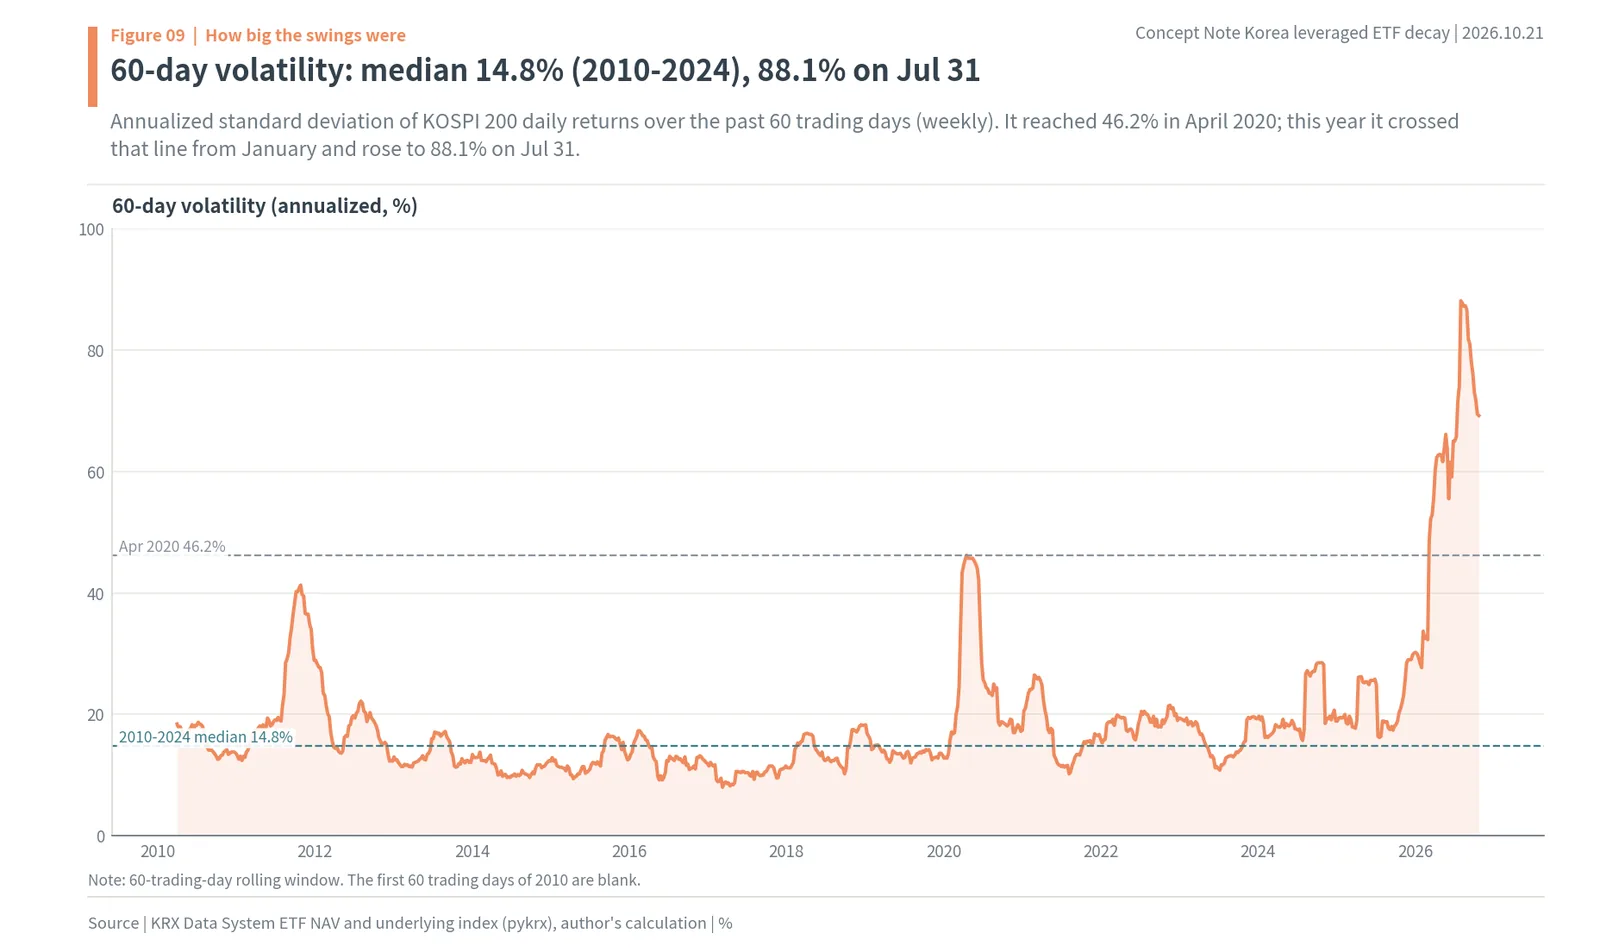
As the figure shows, 60-day volatility had a median of 14.8% (2010 to 2024) and reached 88.1% on July 31. A leveraged product’s swing cost is proportional to the square of volatility, so when volatility rises 6.0 times, from 14.8% to 88.1%, the cost coefficient over the same period rises 35.6 times (author’s calculation). This is why the experience of the 2010s, when holding a leveraged fund for a year left you only a few percentage points away from twice the index, did not hold this year.
A year full of big days
This year the KOSPI 200 moved more than 5% in a day on 42 days, more than the 13 such days in the 15 years from 2010 to 2024. It moved more than 3% on 77 days and more than 10% on 4 days (KRX, author’s calculation). The biggest day was July 31 (+20.0%), followed by March 4 (-11.9%), July 28 (-11.6%), June 23 (-10.5%), July 13 (-9.9%) and March 5 (+9.8%). On those six days KODEX Leverage moved +40.5%, -23.9%, -22.3%, -20.5%, -19.8% and +17.2%. After losing 23.9% on March 4, the leveraged fund rose 17.2% the next day, but strung together, the two days still left it 10.8% lower. The index was down 3.3% over the same two days.
Quarter by quarter
Splitting the year into quarters shows where the leveraged fund’s result was decided. In the first quarter, the KOSPI 200 rose 22.9% and KODEX Leverage rose 38.6%, 7.2 percentage points short of double (45.8%). Volatility that quarter was 57.4%. The second quarter was when the KOSPI 200 rose 84.1%. The leveraged fund rose 202.9%, well above double (168.2%). Despite 63.6% volatility, the trend of one up day after another mattered more. In the third quarter the KOSPI 200 fell 21.1% and the leveraged fund fell 45.8%, losing more than double (42.2%). Volatility that quarter was 75.1%, the highest of the year. In the fourth quarter to October 21, the index is -17.6% and the leveraged fund -34.2%.

Restating the figure’s numbers: in Q2 the index rose 84.1% and the leveraged fund 202.9%; in Q3 they fell 21.1% and 45.8%. In quarters with a big move in one direction, the leveraged fund made more than double or came close to double; in Q3, when the swings were biggest, it lost more than double. Much of what it earned above double in Q2 was lost in Q3. A leveraged product is one where, after an equal-sized rise and fall, the fall leaves the bigger mark.
Month by month
Month by month, the leveraged fund moved close to twice the index in most months. In January the KOSPI 200 rose 26.8% and KODEX Leverage 59.9%; in May, 35.3% and 77.5%. The month that stands out is June. In June the KOSPI 200 was +2.1%, but the leveraged fund was -1.6%. The index swung widely within the month and ended almost where it started, and the swings in between remained as a loss only in the leveraged fund.
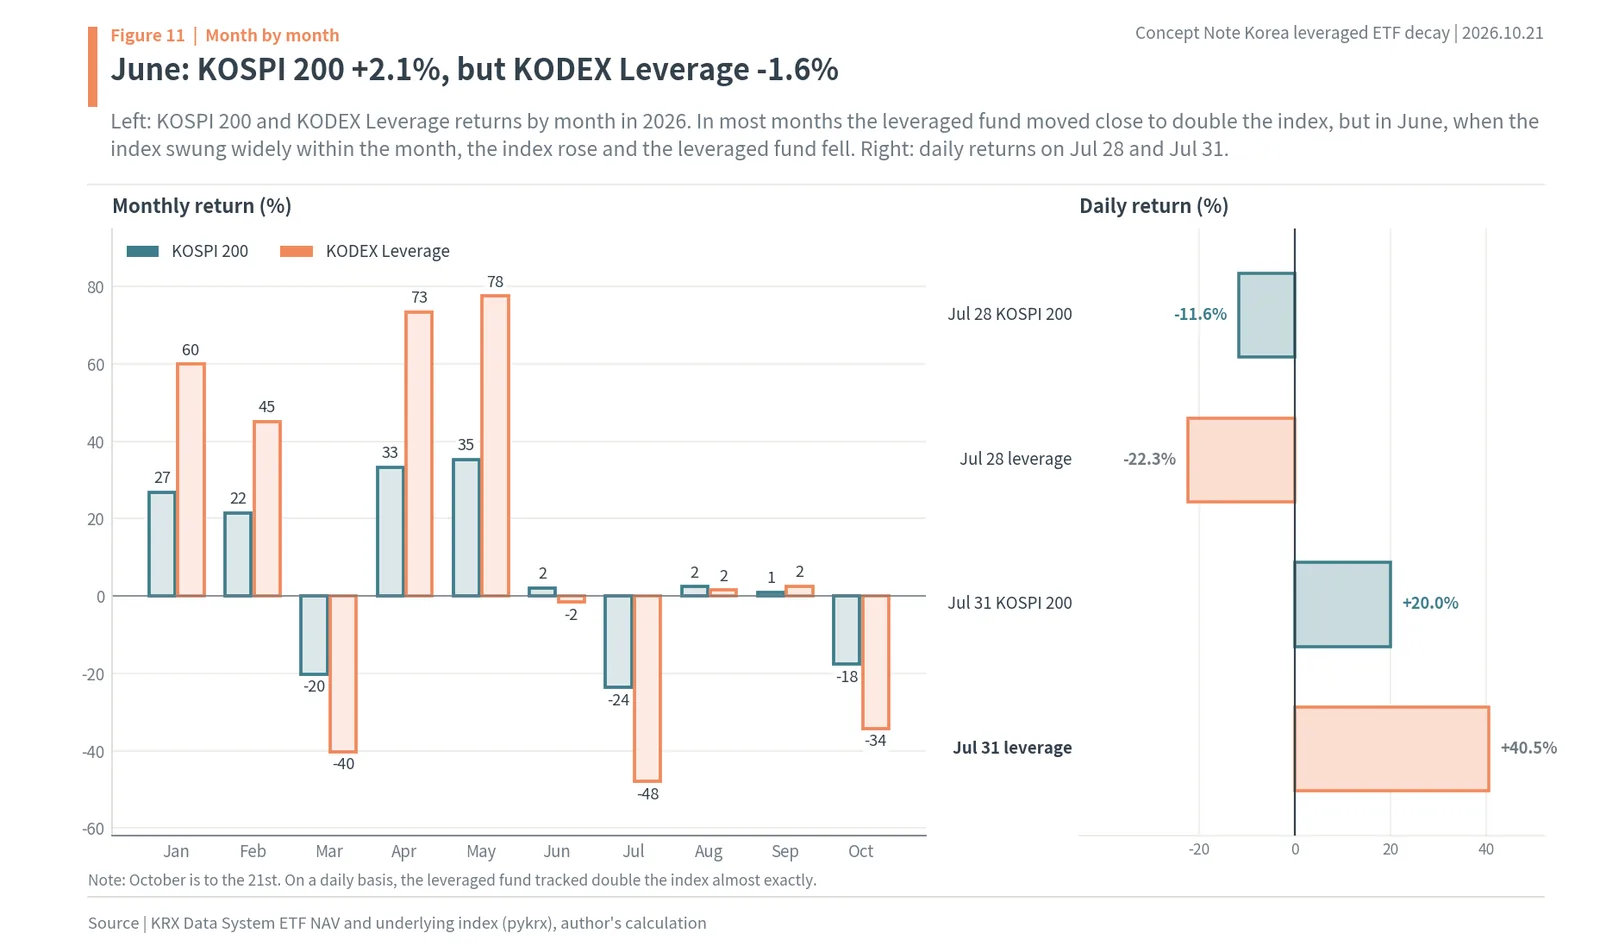
The right side of the figure is daily. On July 28 the KOSPI 200 fell 11.6% and the leveraged fund fell 22.3%. On July 31 the KOSPI 200 rose 20.0% and the leveraged fund rose 40.5%. Day by day, the leveraged fund followed double almost exactly, as promised. The daily promise was kept; it is just that stringing those days together gave a result different from period 2x.
The month of June
June showed negative compounding at its smallest scale. Of June’s 21 trading days, the KOSPI 200 rose on 14 and fell on 7. There were twice as many up days, yet for the month as a whole the index rose only 2.1%. It rose 9.0% on June 9 alone, and on June 23, the day after it hit this year’s high of 1,477.22 on June 22, it fell 10.5%. Within the month the KOSPI 200’s close ranged between 1,186.54 and 1,477.22, and that month’s volatility was 79.8% (KRX, author’s calculation).
That month KODEX Leverage lost 1.6% and the inverse 2x lost 17.7%. In a month when the index rose, the 2x product lost, and the inverse 2x, which bets on a fall, lost more than four times double the index’s gain (4.2%). Over that one month, the direction part was small and the swing part decided most of the result. June put the previous chapter’s hypothetical example into practice: even with the same period return, a path that lurches widely changes a multiple product’s result.
Up to the peak and after it
This year’s path splits in two. The KOSPI 200 rose 143.8% to 1,477.22 on June 22. By that day, KODEX Leverage had risen 397.4%, to a NAV of KRW 239,279 (about $180.6). It made far more than twice the index’s period return (287.6%). In the first half, with many up days, compounding helped the leveraged fund. After that, the KOSPI 200 fell 39.7% from its peak and the leveraged fund fell 69.9%. Big daily ups and downs continued on the way down, and much of what had built up in the first half was lost.
For a leveraged fund that has come down from its peak, the road back is much longer than the index’s. For the KOSPI 200 to return to its June 22 peak, it has to rise 65.8% from here. For KODEX Leverage to return to its peak NAV, it has to rise 232.2%. If the index rose 65.8% at the same rate every day, with no swings, the leveraged fund would rise 175.0% (author’s calculation). In other words, even if the index gets back to its peak, the leveraged fund does not.
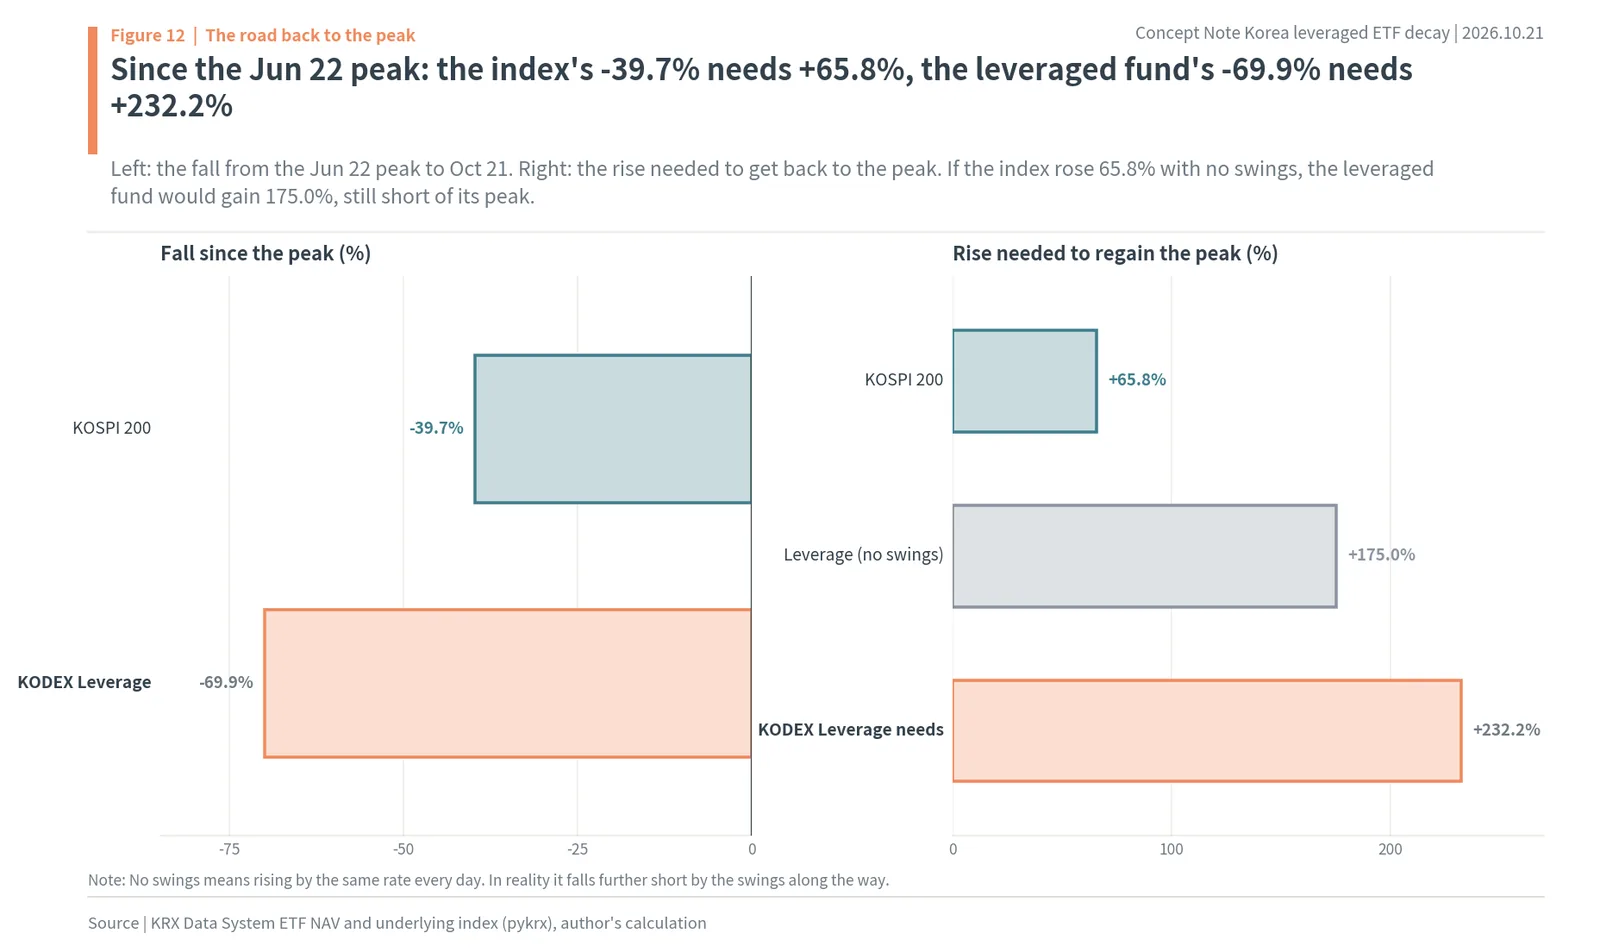
As the figure’s title says, since the Jun 22 peak, the index’s -39.7% needs +65.8% and the leveraged fund’s -69.9% needs +232.2% to get back. For the leveraged fund to reach its peak again, the index has to go beyond its own peak, and the bigger the swings in between, the further beyond it has to go. The leveraged fund’s loss on the way down was smaller than twice the index’s (-69.9% against a doubled -79.4%) because compounding cushioned losses on the way down, but the same compounding lengthens the road back during a recovery.
The same leveraged fund made more than double in 2025: compounding helps in a trend and takes away in swings
A leveraged fund does not always fall short of twice the index. In a year when the index moves steadily in one direction, it actually makes more than double. The conclusion of this chapter is that a leveraged fund’s result is the sum of a direction part and a swing part, and that 2025 and 2026 were years when the two showed up in opposite ways.
2025 and 2026
In 2025 the KOSPI 200 rose 90.7%. KODEX Leverage rose 244.9% from the end of 2024 to the end of 2025, making 63.5 percentage points more than twice the index (181.3%). That year the KOSPI 200’s volatility was 23.3%, a little higher than usual. As the up days continued, a fresh 2x kept landing on a principal that had already grown. 2026 was the opposite. With the KOSPI 200 up 47.0%, the leveraged fund was up 49.9%, 44.2 percentage points less than twice the index (94.1%). Volatility was 65.7%.

The same KODEX Leverage returned +244.9% in 2025 and +49.9% in 2026. The product was the same, and so was the daily promise. What changed was the path the index took.
Separating the swing part
Taking the direction part out of the leveraged return each year leaves only the swing part. The direction part is the index return compounded twice, (1 + index return)². Swing part = (1 + leveraged return) ÷ (1 + index return)² − 1. Separated this way, the swing part (volatility drag) was -5.1% in 2025 and -30.7% in 2026. The previous chapter’s formula gives -5.1% for 2025 and -28.6% for 2026 (author’s calculation). The 63.5-point excess return in 2025 came not from the swing part but from the direction part (1.907² = 3.64 times), and swings still took away 5.1% that year.
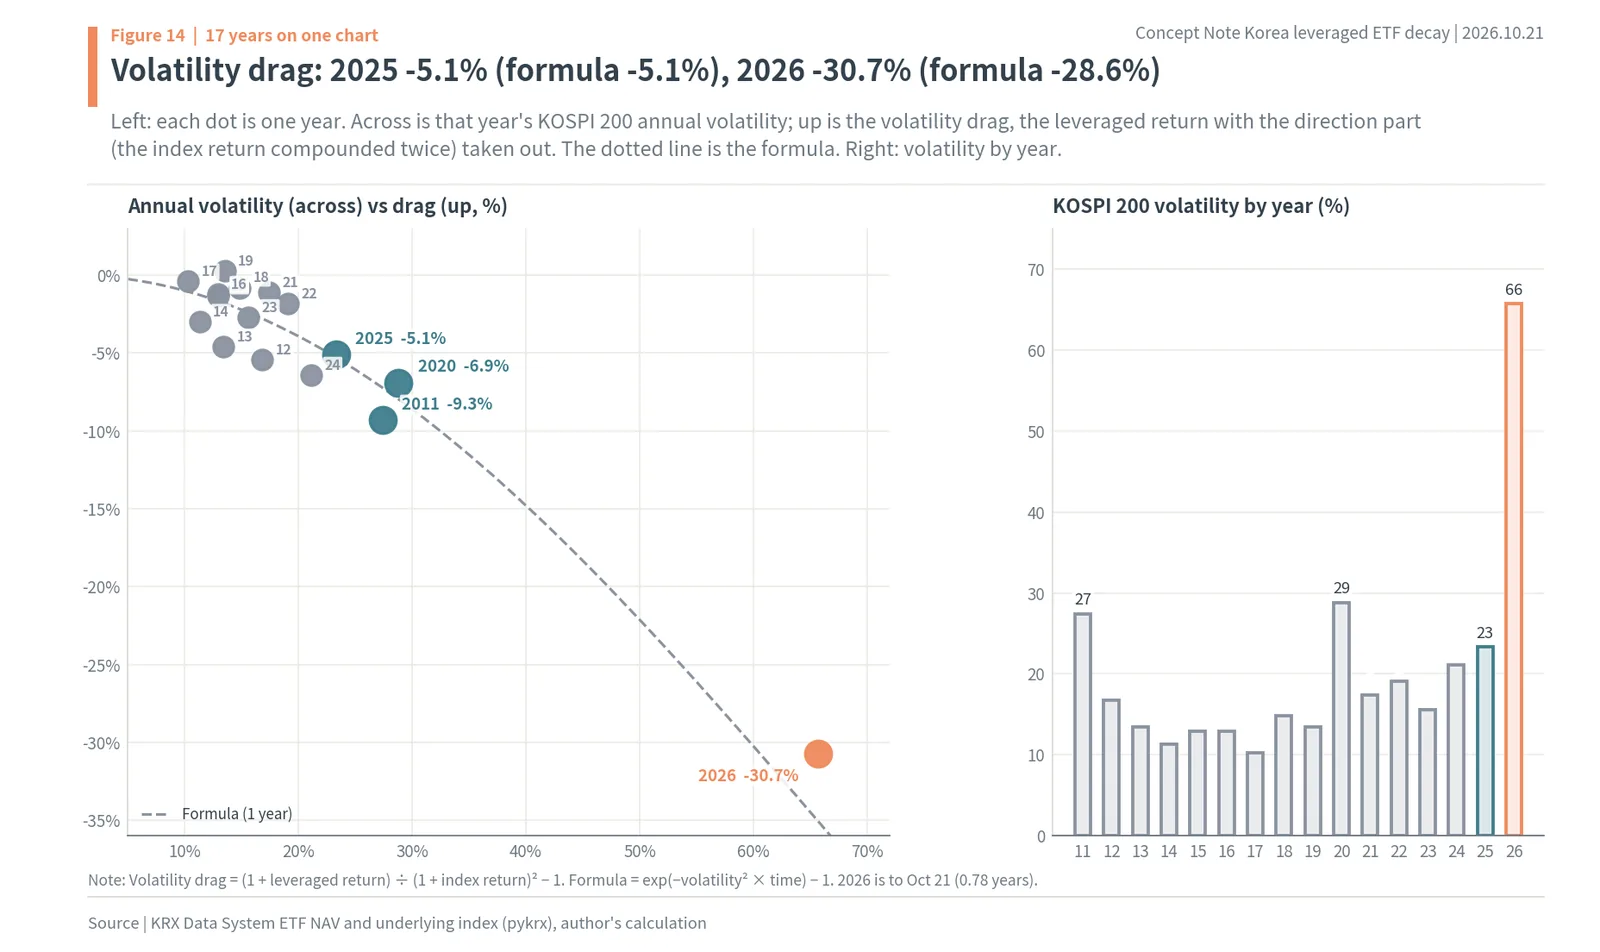
The left side of the figure puts each year from 2011 to 2026 as one dot. Across is that year’s KOSPI 200 annual volatility; up is the swing part. The dotted line is the one-year value from the formula. The dots gather near the dotted line. Most years, with volatility of 10% to 20%, sit between 0% and -5%; 2011, with 27.4% volatility, is at -9.3%; 2020, with 28.8%, is at -6.9%; and 2026, with 65.7%, sits alone at -30.7%. The 2026 dot is above the one-year dotted line because it covers only 0.78 years, to October 21. The formula value for 0.78 years is -28.6%, and the gap from the actual -30.7% is costs such as fees and futures pricing gaps.
Did it beat double each year?
Now, through an actual investor’s eyes, what if we subtract “index return × 2” from the leveraged fund’s return? Of the 16 years from 2011 to 2026, this figure was positive in six: 2017, 2018, 2019, 2022, 2023 and 2025. The two ends are 2025 at +63.5 percentage points and 2026 at -44.2 points.

In the figure, the positive years were years when the index moved far in one direction. 2017 (+24.9%) was steady on the way up; 2018 (-19.3%) and 2022 (-26.2%) were steady on the way down. Even in down years, the fund “lost less” than double. In 2022 the index fell 26.2% and the leveraged fund fell 46.4%, losing 5.9 percentage points less than double (52.3%). By contrast, in the high-volatility years 2011 (-5.6 points) and 2024 (-3.8 points), and in 2026, it fell short of double.
Four years side by side
Putting a few years side by side shows more clearly how direction and swings mix. In 2017, volatility was 10.3%, the lowest of the 16 years, and the KOSPI 200 rose 24.9%. The leveraged fund rose 55.4%, 5.6 percentage points more than twice the index (49.8%). Low swings and a steady rise came together: the best conditions for a leveraged fund. In 2020, volatility rose to 28.8% on the COVID shock, but the index rose 32.5% over the year. The leveraged fund rose 63.5%, 1.5 points short of double (65.0%). It was a year when a big trend almost made up for big swings.
In 2011, volatility was 27.4% and the index fell 12.2%. The leveraged fund fell 30.1%, losing 5.6 points more than double (24.4%). The swing part alone was -9.3%. In 2024, volatility was 21.1% and the index fell 11.2%; the leveraged fund fell 26.2%, losing 3.8 points more than double (22.4%) (author’s calculation). Among down years, in a year of steady decline like 2022 it lost less than double, while in years that fell with ups and downs, like 2011 and 2024, it lost more than double.
If you had held for 16 years
When the yearly gaps pile up, the difference over a long period becomes large. From February 22, 2010, when KODEX Leverage listed, to October 21, the KOSPI 200 rose 317.8%. Over the same period KODEX Leverage rose 608.4% and KODEX Inverse fell 87.8% (KRX NAV, author’s calculation). The leveraged fund made more than the index, but compared with the +1,645.3% from the direction part alone, the index return compounded twice, it made less than half. The inverse should have been at -76.1% on the direction part alone, but was actually at -87.8%.
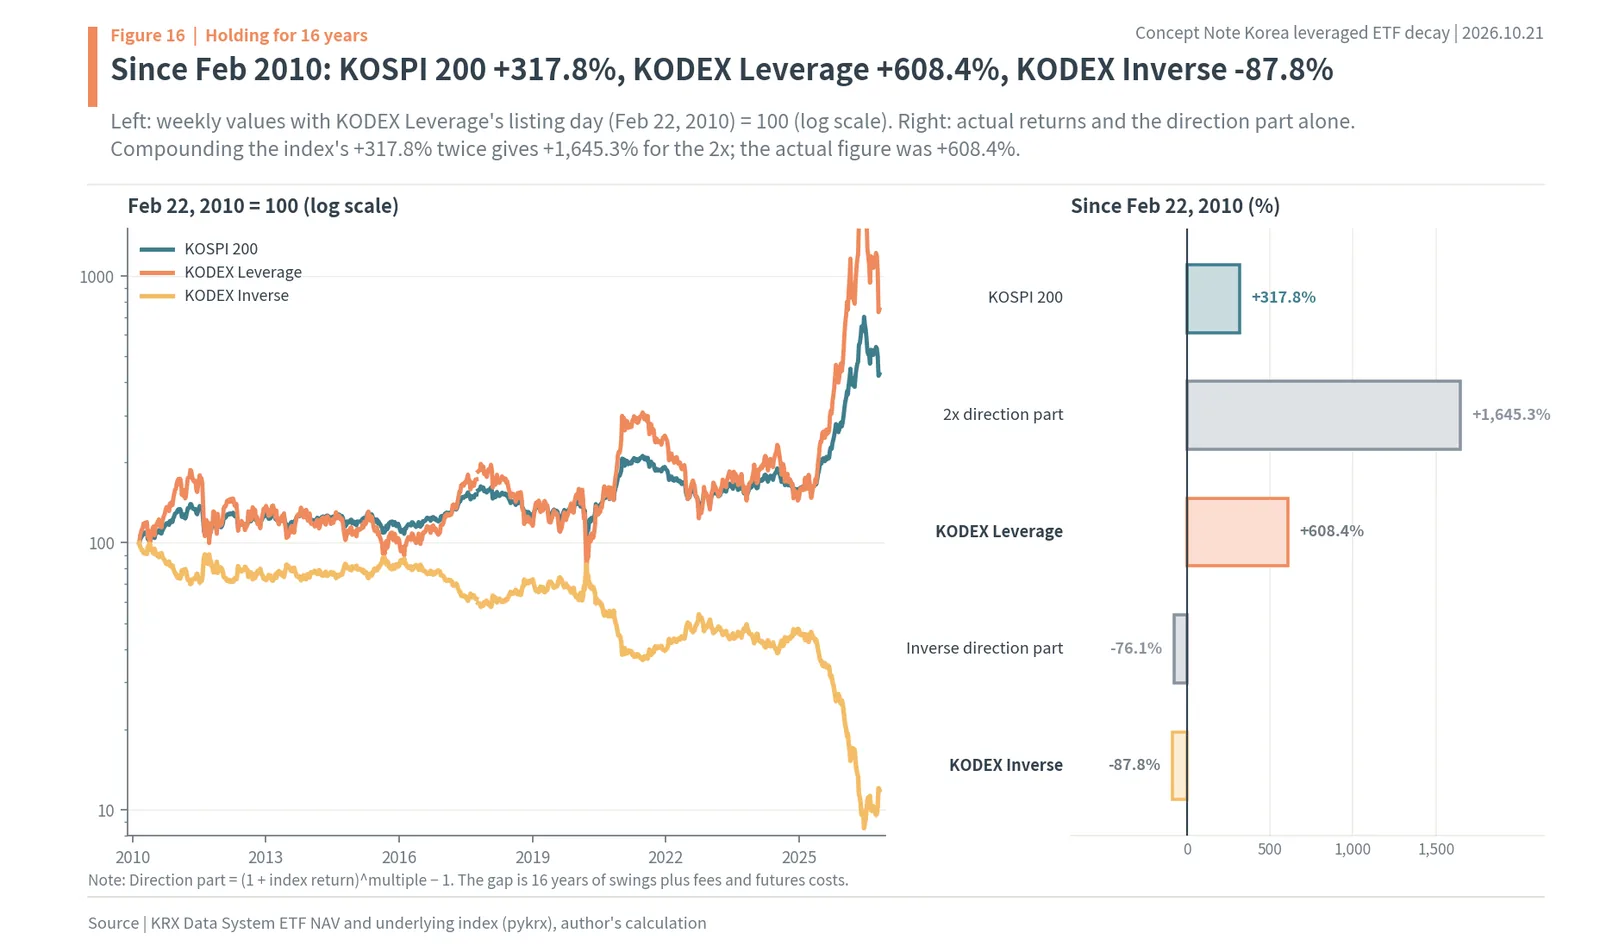
As the figure’s title says, since February 2010 the KOSPI 200 is +317.8%, KODEX Leverage +608.4% and KODEX Inverse -87.8%. On the log scale of the left chart, the leveraged line spent most of the 2010s moving up and down near the index line. In a decade when the index went up and down without rising much, the leveraged fund did not get ahead of the index. It pulled far ahead of the index in 2020 to 2021 and in 2025, when the index rose sharply in one direction. The trends of those two stretches made most of the 16-year result. Even over the same 16 years, depending on which stretch an investor entered and left, the leveraged fund’s result could beat twice the index or fall short of the index itself.
The longer you hold, the more likely you fall short of twice the index: at a one-year hold, 38.2% made double or more
The previous chapters looked at results by year, or at this one year. What an investor actually chooses is “how many days to hold.” This chapter assumes KODEX Leverage was bought on every trading day from February 2010 to October 2026 and held for a set number of trading days, and counts how often its return was at least the KOSPI 200’s return × 2. The conclusion is that the longer the holding period, the more often the fund falls short of double, and the bigger the shortfall when it does.
Results by holding period
Held for one day, the leveraged fund made at least twice the index 48.1% of the time. Even for one day it is below 50% because management fees and futures pricing gaps take a little every day. For 5 trading days it was 43.6%, 20 trading days 36.8%, 60 trading days 37.0%, 120 trading days 42.2%, 250 trading days (one year) 38.2%, and 500 trading days (two years) 36.5% (KRX, author’s calculation). Because every overlapping period is counted, the samples are not independent of one another, but the direction is clear: 1 day 48.1%, 20 days 36.8%, 1 year 38.2%.
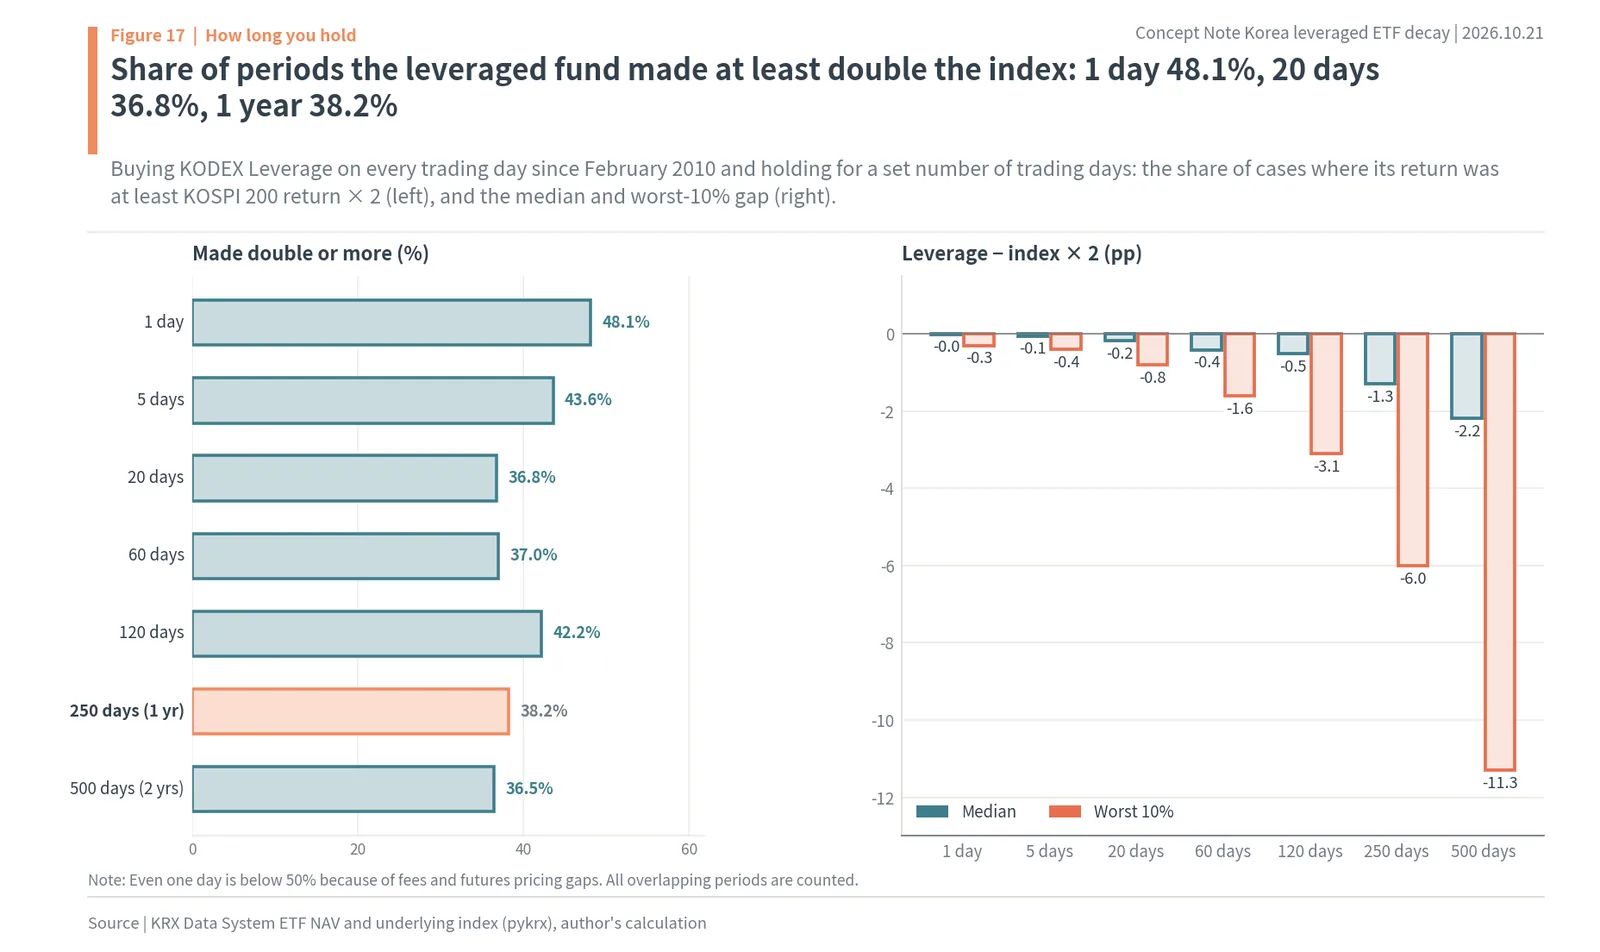
The right side of the figure is the size of the gap. The median of leveraged return − index return × 2 grows from -0.01 points for one day to -0.18 points for 20 days, -1.29 points for one year and -2.19 points for two years. The worst-10% value is -0.8 points for 20 days, -6.0 points for one year and -11.3 points for two years. Most gaps are small, but one time in ten, the fund made more than 11 points less than double over two years.
When you bought mattered more
Even with the same one-year hold, results split widely by the year of purchase. Dividing the one-year samples by starting year, purchases in 2011, 2012 and 2013 never made twice the index or more. For purchases in 2014 and 2015, the share was only 4.5% and 4.4%. By contrast, 98.4% of purchases in 2016, 94.8% in 2020, 97.6% in 2021 and 94.1% in 2025 made at least twice the index (KRX, author’s calculation).
The difference between the two groups was the path of the following year. The one-year periods starting in 2011 to 2015 contained many stretches where the index went up and down without rising or falling much. The one-year periods starting in 2016, 2020, 2021 and 2025 contained many stretches where the index moved far in one direction. For one-year holds bought in 2025, the median gap was +131.4 percentage points, far more than twice the index. Holding the same product for the same length of time, what decided the result was whether that period was a trend or a back-and-forth, and that path cannot be known on the day you buy.
The inverse 2x is the same
Counting the inverse 2x (since its September 2016 listing) the same way, the share of periods in which its return was at least the index return × -2 was 51.5% for one day, 46.9% for 20 days, 42.0% for one year and 35.1% for two years. The median gap was -2.29 points for one year and -8.86 points for two years, bigger than for the leveraged fund. That is because the inverse 2x’s coefficient is 3, larger than the leveraged fund’s 1 (author’s calculation).
The shorter the holding period, the closer a leveraged fund moves to its promise. As the name “daily 2x” says, this product was designed as a tool for betting on the direction of a day or a few days. Holding it for months or years means buying not only a direction but also all the swings along the way.
The inverse 2x has fallen 99.0% since listing, and in three months when the index fell 16.7%, it made only 1.8%
The inverse 2x is a product that makes twice the index’s fall. Yet it often fails to collect that share even over a period when the index fell. The conclusion of this chapter is that even when the inverse 2x calls a fall correctly, it does not get double the fall if the period is long and the swings are big, and in the ten years since listing, rising prices and swings together brought its value down to about one hundredth.
Ten years since listing
KODEX 200 Futures Inverse 2X listed on September 22, 2016. Its NAV was KRW 9,803 (about $7.40) that day and is KRW 102 (about 8 cents) on October 21: down 99.0%. Over the same period the KOSPI 200 rose 244.9% and KODEX Leverage rose 550.8% (KRX NAV, author’s calculation). While the index became 3.45 times larger, the inverse 2x became one hundredth. It is only natural for the inverse 2x to lose in a period when the index rose, but the size of the loss cannot be explained by the direction part alone. With the index at 3.45 times, the direction part alone would leave the inverse 2x near 1 ÷ 3.45², or 8.4% (author’s calculation). In reality, a little over 1% is left. The rest is ten years of swings and costs.
At market prices it is KRW 102 on October 21, and it fell as low as KRW 62 on June 22 this year. When the price is around KRW 100, one tick (KRW 1) is close to 1% of the price. At today’s KRW 102, a KRW 1 tick is 0.98%. That gap is added as a cost every time you buy or sell.
Three months when the index fell
The past three months stand out even more. From July 27 to October 21, the KOSPI 200 fell 16.7%. At twice the index’s fall, the inverse 2x should have risen 33.3%. The actual inverse 2x rose 1.8%. Over the same period KODEX Leverage fell 37.9% (author’s calculation). Investors who bet on a falling index called the direction right but received almost none of the share.

The left side of the figure draws weekly values with the listing day set to 100, on a log scale. The inverse 2x is -99.0% since listing, and since Jul 27, with the index at -16.7%, the inverse 2x is at +1.8%. The bars on the right are those three months. During them the index went through several big days, such as -11.6% on July 28 and +20.0% on July 31. The inverse 2x lost 37.8% on July 31 alone. It only moved as its -2x daily promise said, yet one day like that wiped out what it had earned from several weeks of decline afterward.
Ten months of the inverse 2x this year
Looking at the inverse 2x month by month this year, the months when it called the direction right and the months when it did not are asymmetric in size. In months when the index rose, it lost 38.9% in January, 36.4% in February, 47.3% in April and 50.5% in May. In months when the index fell, it made 34.5% in March, 32.3% in July and 41.9% in October (to the 21st) (KRX NAV, author’s calculation). A loss in a losing month has to be recovered from a smaller principal, so a gain of the same size does not make up for it. June was the month the index rose 2.1% and the inverse 2x lost 17.7%. In a month when the index barely moved, swings alone cut its share sharply.
An investor who bought the inverse 2x at the start of this year, betting on a falling index, is down 83.4% as of October 21. They called the decline in the third quarter and October correctly, but by then the earlier rise and swings had already cut their principal to a sixth. With the inverse 2x, calling a fall is not enough; you also have to be right about when the fall starts and how much the market swings in between to collect the share.
On the KOSDAQ 150 this year, the leveraged and inverse funds both lost: index -13.1%, leverage -47.2%, inverse -15.9%
The clearest scene of negative compounding is when a 2x product and an inverse product on the same index lose money together. The conclusion of this chapter is that the KOSDAQ 150 produced that scene this year. The index fell, so the inverse should have made money, but the swings outweighed that share.
The KOSDAQ 150 this year
The KOSDAQ 150 fell 13.1% from the end of 2025 to October 21. Over the same period KODEX KOSDAQ150 Leverage fell 47.2%, losing 21.0 percentage points more than double the index’s fall (26.2%). KODEX KOSDAQ150 Futures Inverse, which tracks -1x of the daily return, also fell 15.9% (KRX NAV, author’s calculation). Even the inverse, which bet on a falling index, lost money. The KOSDAQ 150’s annual volatility this year was 62.2%. In the formula, the coefficient for the inverse (-1x) is 1, the same as for the 2x, so the share these swings took away through October 21 this year is 26.1%. The direction part, with the index down 13.1%, gave the inverse +15.1%, but the swing part was larger (author’s calculation).
Ten years since listing
The longer view is clearer still. Since KODEX KOSDAQ150 Leverage listed on December 17, 2015, the KOSDAQ 150 has risen 29.3%, but the leveraged fund has fallen 41.2%. The index rose and the 2x product lost. Measured from August 10, 2016, when the inverse listed, the KOSDAQ 150 rose 26.1% and the inverse fell 74.8%. The index’s 26.1% rise alone should have cost the inverse 20.7%, but in reality it lost three quarters.
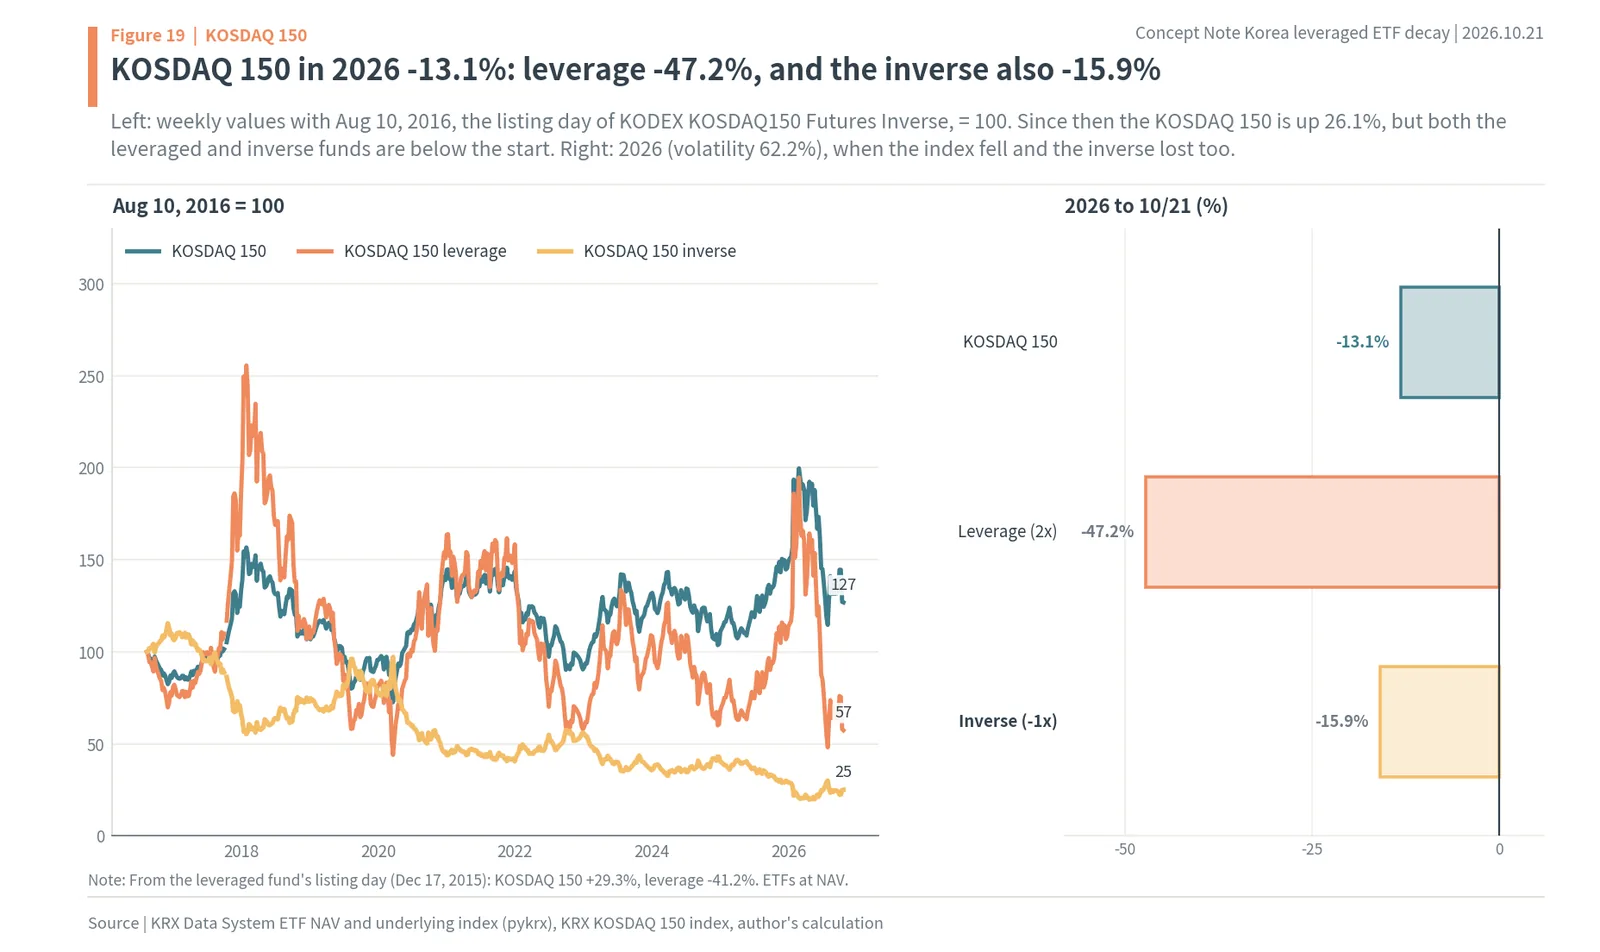
On the left of the figure, the KOSDAQ 150 moved up and down around 100 from August 2016 and is now around 127. The leveraged fund topped 250 during the index’s surge in early 2018 and has come down to 57, and the inverse is at 25. In 2026 the KOSDAQ 150 is -13.1%, the leveraged fund -47.2% and the inverse also -15.9%. The KOSDAQ usually swings more than the KOSPI, so even at the same multiple, the share taken away is bigger. Even over the same holding period, the cost depends on which index the multiple product tracks.
The KOSDAQ 150 year by year
Year by year, 2017 stands out as the year KOSDAQ 150 leverage beat twice the index. That year the KOSDAQ 150 rose 51.0% and the leveraged fund rose 131.2%, 29.1 points above double (102.1%). Volatility was 19.2%. By contrast, in 2018 (volatility 32.0%) the index was -17.5% and the leveraged fund -39.2%, losing more than double (-35.0%), and in 2024 (28.3%) the index was -18.9% and the leveraged fund -42.2%, again losing more than double (-37.8%). In 2022 the index fell a steady 37.2%, so the leveraged fund (-63.5%) lost less than double (-74.3%) (author’s calculation).
The inverse shows the same pattern. In 2018, 2019, 2022 and 2024, when the KOSDAQ 150 fell, the inverse made 10.4%, 5.1%, 38.4% and 18.3%. In 2021, when the index fell only 0.5%, the inverse lost 7.6%. And this year, the index fell 13.1% while the inverse lost 15.9%. Volatility of 62.2% is the highest since KOSDAQ 150 leverage listed, above the previous high of 36.1% in 2020.
US 3x ETFs work the same way: since the November 2021 peak, TQQQ has made 59.0%, less than QQQ’s 77.6%
The US 3x ETFs that many Korean investors buy move on the same principle. The multiple is 3, so the coefficient is 3: the same swings take three times as much as from a 2x product. The conclusion of this chapter is that there are cases in which a 3x product that went through one big decline did not come back even as far as the 1x after the index recovered.
Nasdaq-100 3x
The Nasdaq-100 hit its then-peak on November 19, 2021. From that day to October 20, 2026, QQQ, the 1x ETF tracking the Nasdaq-100, rose 77.6%. TQQQ, which tracks three times the same index’s daily return, rose 59.0%. The 3x product made less than the 1x. SQQQ, at -3x daily, fell 94.9% (Yahoo Finance closes, author’s calculation).

The reason lies in 2022. That year the Nasdaq-100 fell hard. While QQQ fell 33.1%, TQQQ fell 79.2%. With its principal cut to a little over a fifth, the 3x product had to stack three times the gains on that smaller principal even after the index rose again. The swings in between kept taking their share as well.
Semiconductor 3x
The semiconductor index is the same. From the same November 19, 2021, the 1x semiconductor ETF SOXX rose 179.0%, while SOXL, at 3x daily, rose 42.2%. SOXL’s gain was a quarter of SOXX’s. SOXS, at -3x daily, fell 99.9%.
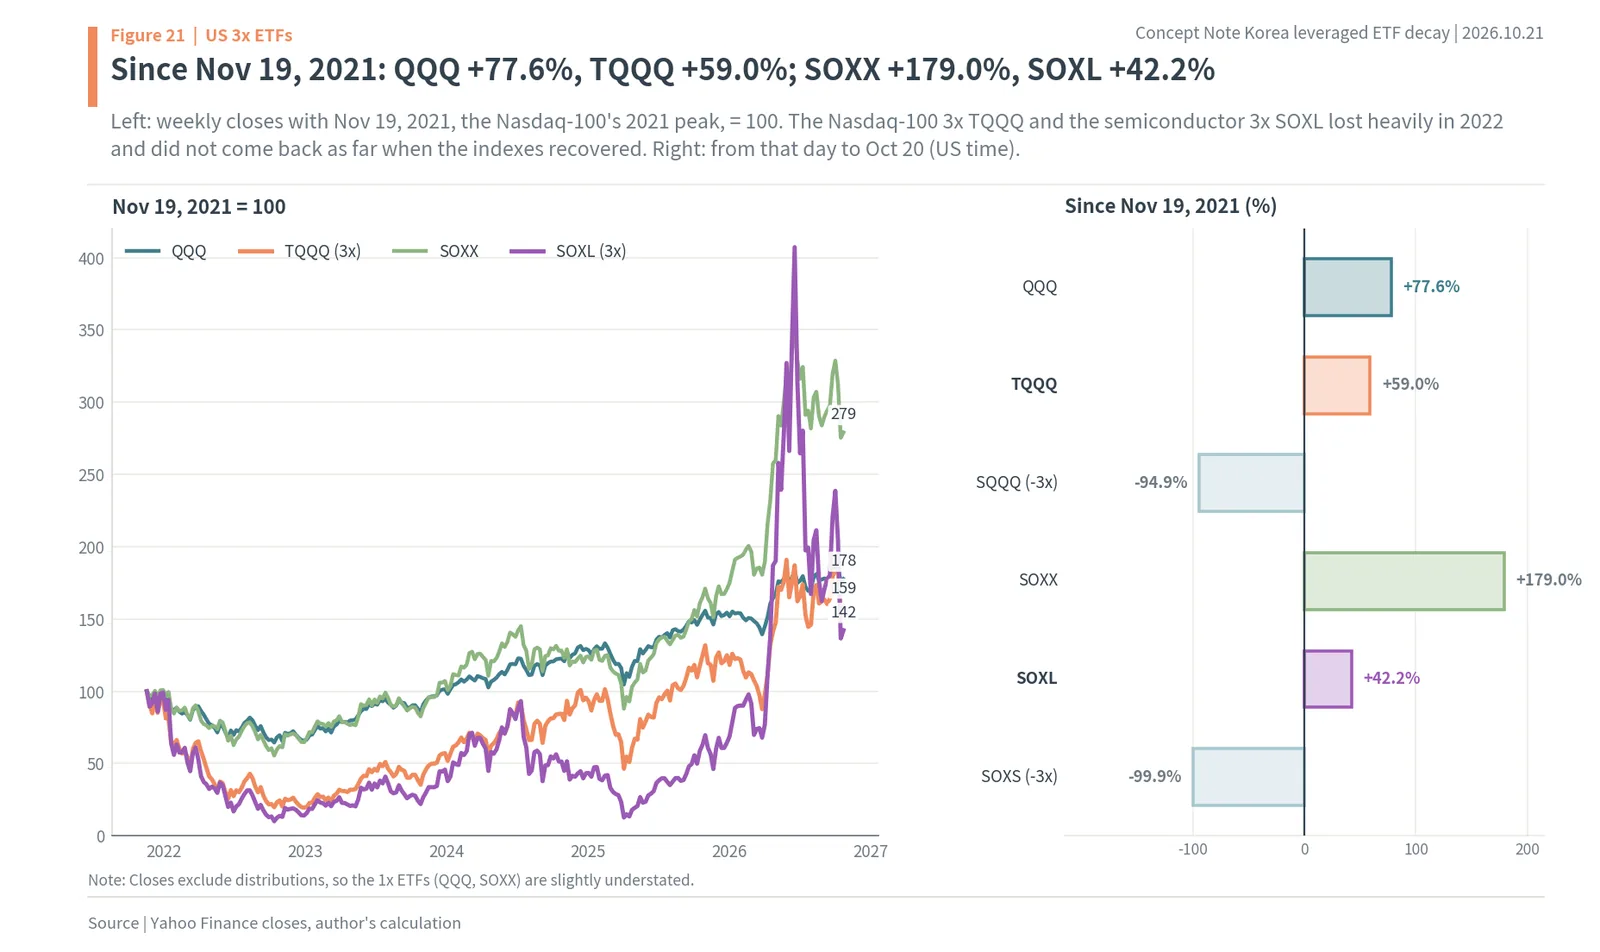
The left side of the figure is weekly closes with November 19, 2021 set to 100. Since Nov 19, 2021, QQQ is +77.6% and TQQQ +59.0%; SOXX is +179.0% and SOXL +42.2%. After the big fall in 2022, the 3x products moved below the 1x lines, briefly rose above 1x when semiconductors surged in 2026, and then came back down.

Taking only this year, when semiconductor stocks rose sharply, the 3x products made a lot too. From the end of 2025 to October 20, SOXX rose 66.0% and SOXL rose 132.1%. Even so, SOXL fell short of three times (198.0%). Over the same period QQQ was 16.8%, TQQQ 33.6%, SQQQ -45.0% and SOXS -92.5%.
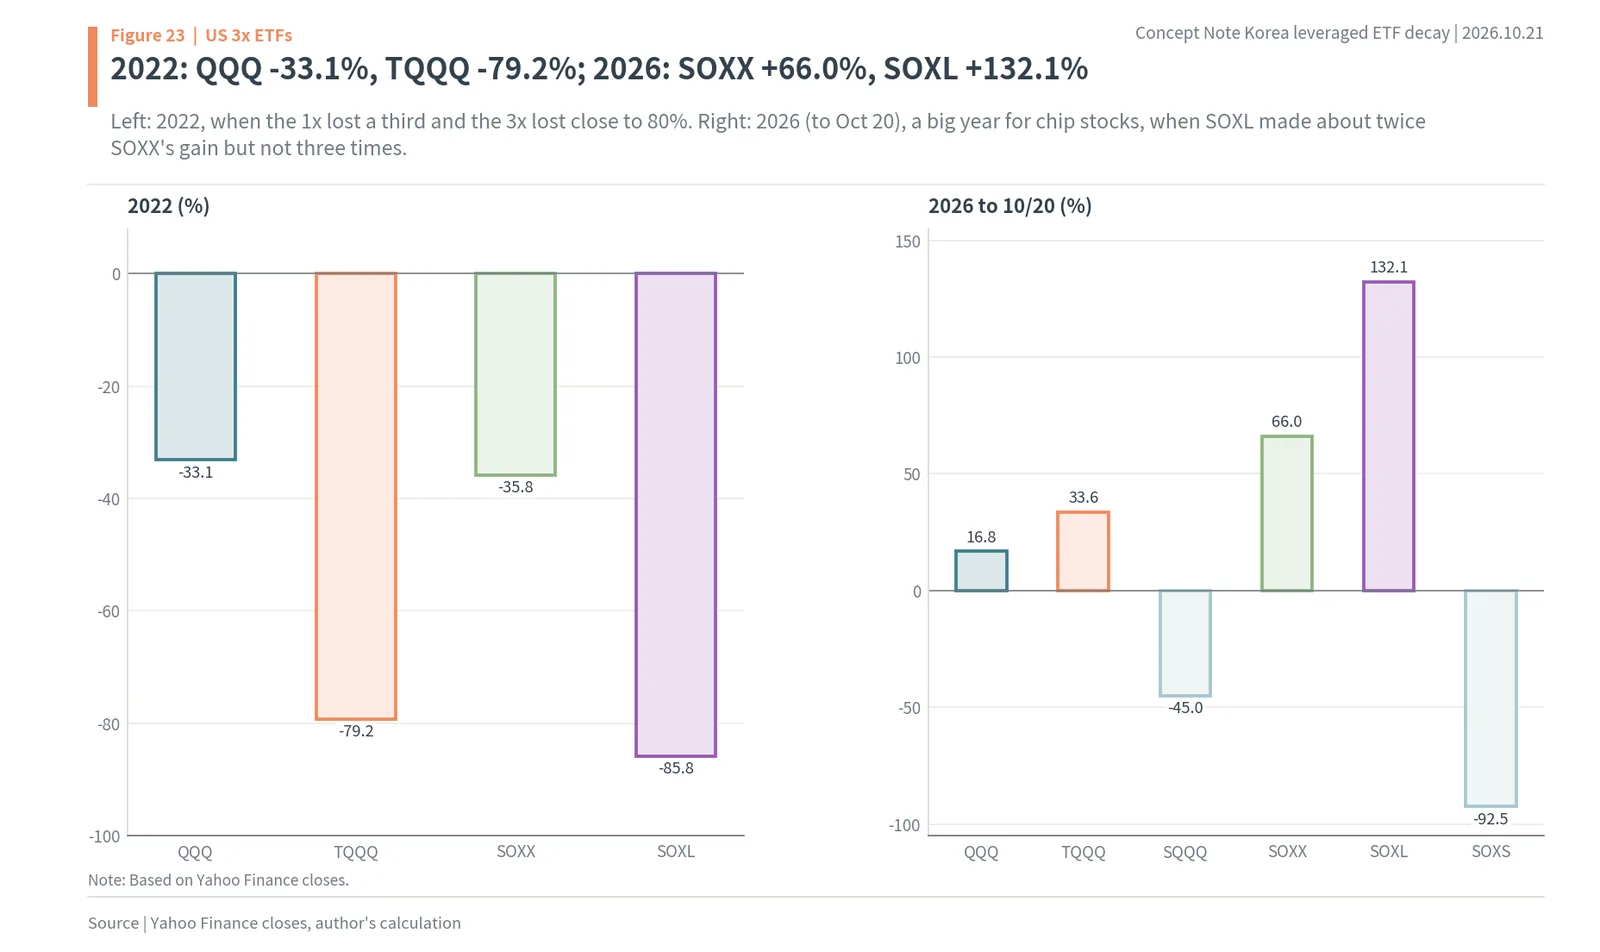
To sum up, in 2022 QQQ was -33.1% and TQQQ -79.2%; in 2026, SOXX is +66.0% and SOXL +132.1%. 3x products lose close to three times in years of big declines, and even in years of big gains they do not collect the full three times when the swings are large. The formula saying that the 3x and the inverse 2x lose three times as much as the 2x to the same swings shows up in the US market just the same.
Sixteen years of long trends
The same formula explains the other side too. From March 1, 2010 to October 20, 2026, QQQ grew 15.8 times and TQQQ grew 290.4 times (Yahoo Finance closes, author’s calculation). The Nasdaq-100 was in a long upward trend for those 16 years, so every day’s triple landed again on a principal that had already grown. Over the same period, SQQQ and SOXS, at -3x daily, lost virtually all of their principal. The long-run result of a leveraged product is decided by the trend and the swings of that period, and in a 3x product both forces grow nearly threefold. In the five years after the November 2021 peak the swings were stronger; over the whole 16 years since 2010, the trend was stronger.
Even when you use an inverse fund to protect against a fall, the swing cost comes along: KOSPI 200 and inverse half and half lost 1.5% in 2026
One common reason to hold an inverse ETF for a long time is hedging, that is, protecting the stocks you own against a fall. The conclusion of this chapter is that a hedge built with an inverse fund inherits the structure of resetting the multiple every day, so in a year when the index swings widely, it leaves a cost whatever the direction.
As the simplest example, suppose someone put equal amounts into KODEX 200 and KODEX Inverse at the end of 2025 and held them without rebalancing. It is a combination meant to stay near the principal, with the two products offsetting each other whether the index rises or falls. Through October 21, KODEX 200’s NAV rose 47.8% and KODEX Inverse’s NAV fell 50.7%. The half-and-half combination lost 1.5% (KRX NAV, author’s calculation). In a year when the index rose 47.0%, the part meant to protect against a fall shrank by a little more than the rising part grew.
The 1.5% lost by the half-and-half combination looks small, but it matters that this is the figure for a year when the index moved far in one direction. In a year that only went up and down by the same amount, KODEX 200 would stay near where it started and only the inverse would lose its swing share, so the combination as a whole would shrink by half that amount. With swings like this year’s, at 65.7% volatility, the swing share an inverse (-1x) loses in a year is 35.1% by the formula. Hedging with an inverse 2x makes the cost bigger, because the coefficient is three times as large for the same swings. The period you hedge with an inverse fund is a period of paying swing costs, and that cost is calculated with the same formula as for leveraged funds.
To buy leveraged or inverse products in Korea, the deposit and education come first: single-stock products need KRW 30mn in cash from July 31
The fact that leveraged and inverse products are hard for individual investors to understand is reflected in Korea’s rules too. The conclusion of this chapter is that to buy a leveraged or inverse ETF in Korea for the first time, you must meet a basic deposit and pre-training requirement, and this year that requirement grew wider, covering overseas and single-stock products, and heavier.
The 2020 rush and the deposit
In May 2020, the Financial Services Commission announced its “plan to make the ETF and ETN market sound.” The core was that individual investors buying leveraged ETFs and ETNs must hold a basic deposit of KRW 10mn and complete an online course on the products’ features run by the Korea Financial Investment Association (Bizwatch, April 11, 2025). At the time, leveraged ETFs’ share of all ETF trading was 38.1% in January 2020, 51.1% in February and 65.5% in March (Financial Services Commission, cited in the same article). When the index was swinging widely on the COVID shock, trading rushed into leveraged products, and the entry conditions followed.
Wider and heavier rules this year
This year the rules changed in two directions. One is scope. From May 22, investors trading overseas leveraged ETFs and ETNs for the first time must also hold a basic deposit of KRW 10mn. Investors in single-stock leveraged and inverse products, Korean or overseas, also face advanced pre-training. The same article reported that the listing of single-stock leveraged ETFs on Samsung Electronics and SK hynix was pushed back from May 22 to May 27 (Herald Economy, May 20, 2026).
The other is weight. In July, the financial authorities decided to raise the basic deposit for single-stock leveraged ETFs from KRW 10mn to KRW 30mn. Before, up to 70% of the KRW 10mn could be met with shares held; now only cash counts. From November, trading will be in lots of 20 shares instead of one, pre-training will grow from two hours to three, and anyone scoring below 60 will have to retake it (Segye Ilbo, July 16, 2026). The start date was moved up from the originally planned early August to July 31. Single-stock leveraged products listed in Korea and abroad are all covered, and investors who already hold them must meet the same conditions to buy more (MTN, July 24, 2026).
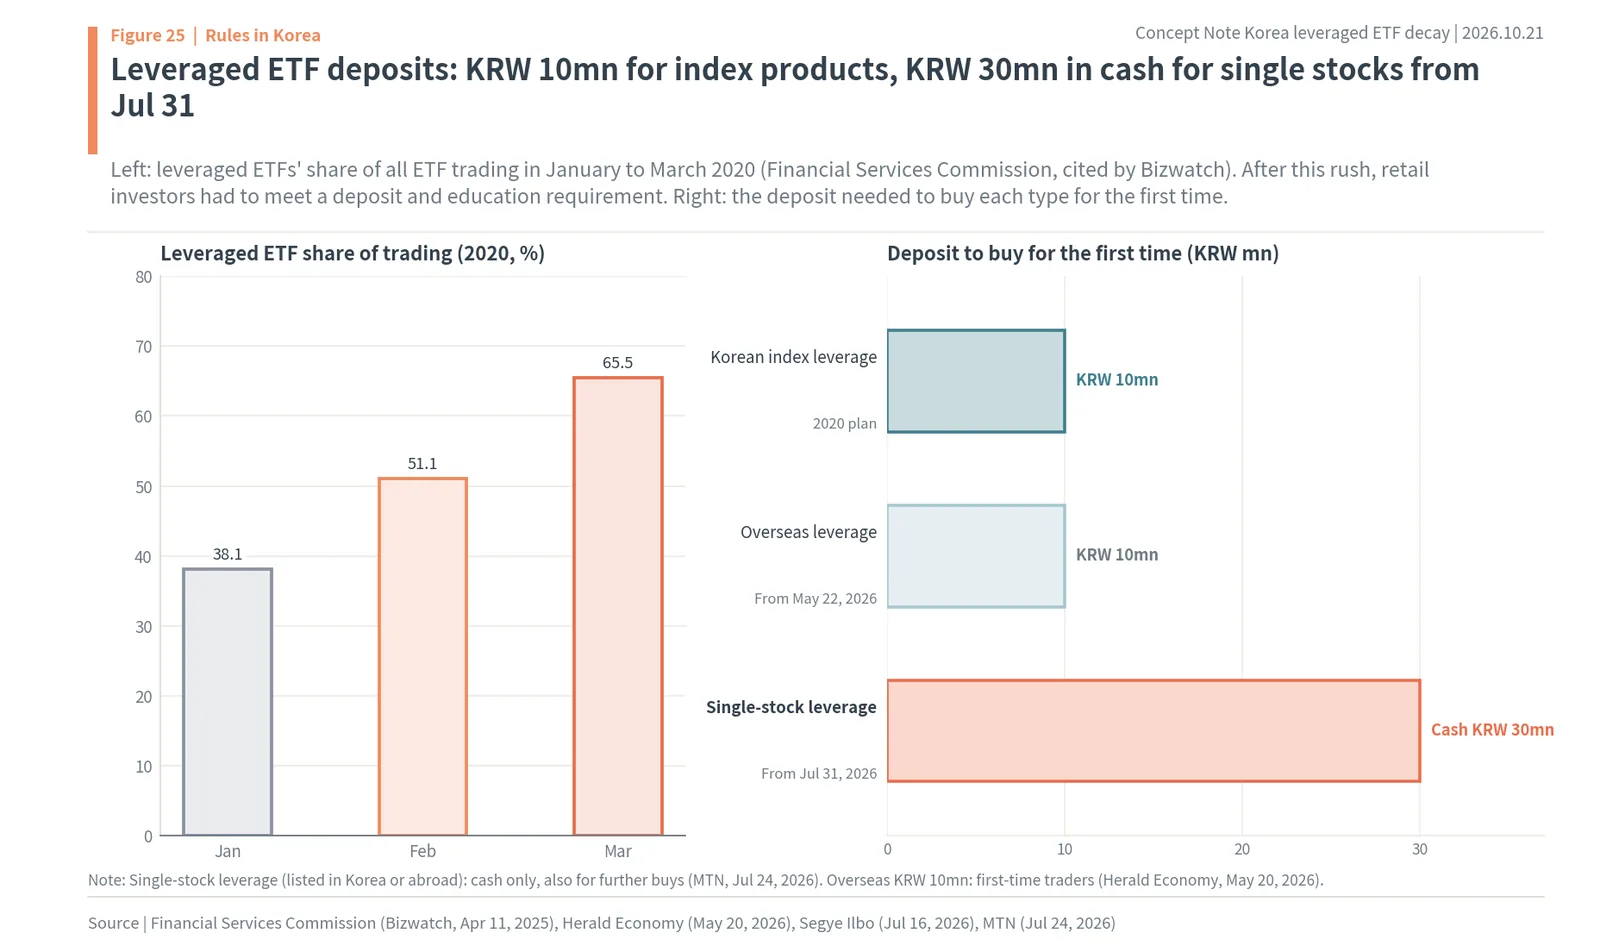
As the figure shows, the leveraged ETF deposit is KRW 10mn for index products and, from July 31, KRW 30mn in cash for single stocks. The order of the rules points the same way as the numbers in the earlier chapters. The more volatile the underlying and the larger the multiple, the bigger the share taken away, and the entry conditions got heavier in the same order.
Tracking twice a single stock
Products that track twice the daily return of a single stock instead of an index follow the same formula. The difference is that a single stock is more volatile than an index. Measured with daily returns over the past 60 trading days, SK hynix’s annual volatility is 106.5% and Samsung Electronics’ is 91.7% (Naver Finance adjusted prices, author’s calculation). Over the same period the KOSPI 200’s was 69.2%. Putting this volatility into the 2x formula, a 20-trading-day hold takes away 8.7% for 2x SK hynix and 6.5% for 2x Samsung Electronics. Held for a year with these swings, 2x SK hynix would lose 67.8% and 2x Samsung Electronics 56.9% (author’s calculation).

From the end of 2025 to October 21 this year, SK hynix rose 97.8% and Samsung Electronics rose 86.4%. Even stocks with directions this good lose a large part of their share to swings when held through a daily 2x product. A single-stock leveraged product loses more than an index leveraged product, and over the same holding period the 20-trading-day cost for 2x SK hynix is 2.29 times that for 2x KOSPI 200 (author’s calculation).
How the numbers were built: ETFs at net asset value (NAV), not market price, and volatility from daily returns
The numbers in this report may differ slightly from other sources, so here is the basis. In short, to see the products’ own results, this report used NAV instead of market prices, used the underlying index values that the ETFs track, and measured volatility as the standard deviation of daily returns times √250.
First, Korean ETF returns were calculated from the net asset value (NAV) that KRX publishes every day. The market price can end the day slightly above or below NAV. For example, on October 21, KODEX Leverage’s NAV was KRW 72,085 and its closing price KRW 71,740 (about $54.2). NAV is the right measure of how well a product kept its promise; what an investor actually earned differs slightly from the NAV return, depending on the prices at which they bought and sold. For a product priced around KRW 100, like the inverse 2x, one tick is close to 1%, so that gap is bigger.
Second, for the KOSPI 200, the index values are those of the underlying index that KODEX 200 tracks. Leveraged and inverse ETFs actually trade KOSPI 200 futures, so the price gap between futures and the spot index and the cost of rolling futures at expiry mix into NAV. The “actual leveraged return” in this report includes those costs and the management fee. The fact that even on a one-day basis the leveraged fund made at least twice the index only 48.1% of the time, below 50%, is a trace of those costs.
How well the daily promise was kept was checked separately. Across every trading day since 2010, the gap between KODEX Leverage’s daily NAV return and the KOSPI 200’s daily return × 2 averaged -0.11bp (0.0011 percentage points), with a standard deviation of 35.1bp. The gap was within ±0.1 percentage points on 33.8% of days and within ±0.5 percentage points on 91.7%. Compounding the average gap over a year (250 trading days) gives -0.3 percentage points, about the size of fees and futures costs. This year the standard deviation of the daily gap was 51.1bp, larger than the 34.5bp through 2024. This can be read as the effect of wider gaps between futures and the spot index on days of big moves. Even so, the daily misses are small compared with the gap in period results (-44.2 points this year). What decided the period result was not daily error but the structure of compounding the days together (author’s calculation).
Third, period returns start from the previous trading day’s close. 2026 starts from December 30, the last trading day of 2025, and 2025 from the last trading day of 2024. Returns since listing start from the NAV on the listing day. US ETFs are calculated from Yahoo Finance closes, which do not include distributions. So the 1x ETFs (QQQ, SOXX) are understated slightly compared with the 3x products, which pay almost no distributions.
Fourth, annual volatility is the standard deviation of daily returns over the period times √250. This year the KOSPI 200’s figure is 65.7% from 195 trading days of daily returns, 69.2% over the past 60 trading days and 49.1% over the past 20 trading days. Over all of 2010 to 2024 it is 17.5%. The formula exp(−(L² − L) ÷ 2 × volatility² × time) is an approximation that assumes daily returns are evenly spread. Real indexes sometimes bunch big days together, so the formula and reality can differ by a few percentage points. The 2026 formula value of -28.6% against the actual -30.7%, and the 2011 formula value of -7.2% against the actual -9.3%, are examples.
Fifth, the holding-period analysis takes every trading day from February 22, 2010 as a starting point and counts all overlapping periods. There are 3,850 one-year (250-trading-day) samples. Because the samples overlap, they are not 3,850 independent experiments. The shares should be read with in mind that the same market phase enters many samples at once.
Five common misconceptions, checked again with numbers
Here are five things people often say about leveraged and inverse ETFs, checked against the numbers in the earlier chapters. The conclusion is that all five come from reading a “daily” multiple as a “period” multiple.
First, “a 2x product makes double when the index rises.” For one day, that is right. On July 31, when the KOSPI 200 rose 20.0%, KODEX Leverage rose 40.5%. Over a period, it is not. This year the KOSPI 200 rose 47.0% and the leveraged fund 49.9%. In 2025, the opposite: with the index at 90.7%, the leveraged fund made 244.9%, far more than double. The period result is decided not by twice the index but by the shape of the path over that period.
Second, “an inverse fund makes money when the index falls.” This year the KOSDAQ 150 fell 13.1%, but KODEX KOSDAQ150 Futures Inverse lost 15.9%. While the KOSPI 200 fell 16.7% from July 27, the inverse 2x rose only 1.8%. Even in a period when the index fell, big swings can shrink an inverse fund’s share or turn it negative.
Third, “if you hold long enough, it ends up converging to twice the index.” For one-year holds since 2010, the leveraged fund made at least twice the index 38.2% of the time; for two-year holds, 36.5%. The median gap grew with length: -1.29 points for one year, -2.19 points for two years. Holding for 16 straight years, the leveraged fund made +608.4%, far short of the +1,645.3% direction part alone. The longer the period, the further from double.
Fourth, “the inverse 2x is a mirror image of the leveraged fund.” In direction it is a mirror, but not in swing cost. The coefficient is 1 for the 2x and the inverse, and 3 for the inverse 2x. At 20% volatility, the one-year cost is 3.9% for the 2x and 11.3% for the inverse 2x. Daily resetting trades on a day the index moves 5% are 10% of NAV for the 2x and 30% for the inverse 2x. In swing cost, the inverse 2x is not the leveraged fund’s mirror but in the same group as 3x products.
Fifth, “the leveraged fund falls short of double because it is badly managed.” Since 2010, KODEX Leverage’s daily return stayed within ±0.5 percentage points of twice the index on 91.7% of days, and compounding the average daily gap over a year gives -0.3 percentage points. This year’s -44.2-point gap in period results came not from daily error but from the structure of compounding the days together. The product kept its promise; the promise was just for “one day.”
Steps for your own ETF: multiply how many days you hold, how much the market swings now and the multiple
The calculation to do before buying a leveraged or inverse ETF is not long. The conclusion of this chapter is to confirm with numbers that when you buy a leveraged or inverse product, you buy not only an expectation about direction but also “how much it will swing” and “how many days you will hold.” Here it is in five steps.
Step 1 is setting the holding period in trading days. First write down which it is closest to: one day, one week (5 trading days), one month (20 trading days), three months (60 trading days) or one year (250 trading days). As seen earlier, since 2010 KODEX Leverage made at least twice the index 48.1% of the time for one day, 36.8% for 20 days and 38.2% for one year.
Step 2 is checking the underlying index’s recent volatility. The KOSPI 200’s annual volatility over the past 60 trading days is now 69.2%. That is nearly four times the 17.5% of 2010 to 2024. Over the past 20 trading days it is 49.1%.
Step 3 is putting it into the formula. Share taken away = 1 − exp(−(multiple² − multiple) ÷ 2 × volatility² × time). At today’s volatility of 69.2%, a 20-day hold takes away 3.8% from the 2x and 10.9% from the inverse 2x. For 60 days it is 10.9% for the 2x and 29.2% for the inverse 2x; for one year, 38.1% for the 2x and 76.2% for the inverse 2x (author’s calculation). Doing the same calculation at the normal volatility of 17.5% gives 0.2% for the 2x and 0.7% for the inverse 2x over 20 days, and 3.0% for the 2x and 8.8% for the inverse 2x over a year.
Step 4 is weighing your view on direction against the share taken away. If you expect the index to rise 5% over a month, the 2x direction part is 1.05² − 1, or 10.25%. At today’s volatility, 3.8% is taken away from that. If you expect the index to fall 5% in a month and use the inverse 2x, the direction part is 1 ÷ 0.95² − 1, or 10.8%, and the share taken away is 10.9%. With today’s swings, the calculation says that even if you correctly call a 5% fall in a month, almost nothing is left with the inverse 2x.
The same calculation for a single-stock leveraged product gives a bigger cost. At SK hynix’s 60-trading-day volatility of 106.5%, a 2x product held for 20 trading days loses 8.7%, and Samsung Electronics (91.7%) loses 6.5%. For an inverse (-1x) on an index with this year’s volatility of 62.2%, like the KOSDAQ 150, the swing share alone was 26.1% through October 21 this year. Depending on the underlying, the cost for the same multiple and the same period differs several times over.
You also need to decide over what period to measure volatility. Measured over the past 20 trading days, the KOSPI 200’s is 49.1%; over 60 trading days, 69.2%. Short-period figures reflect recent conditions quickly but jump with a few days of big moves. This report uses the 60-trading-day figure as the default; if you plan a short hold, it is better to also plug in the 20-trading-day figure and look at a range. At the 20-trading-day volatility of 49.1%, the 20-day holding cost is 1.9% for the 2x and 5.6% for the inverse 2x, about half the 60-trading-day figures (author’s calculation).
Step 5 is checking price and trading conditions. The inverse 2x is now priced at KRW 102, so a KRW 1 tick is 0.98%. To buy a Korean leveraged ETF for the first time, you need a basic deposit of KRW 10mn and pre-training; single-stock leverage needs KRW 30mn in cash (previous chapter).
Three investors
Let us follow the steps to the end for three hypothetical investors. All values are from the formula with today’s KOSPI 200 volatility of 69.2% (author’s calculation).
The first investor expects the KOSPI 200 to rise ahead of an announcement next week and plans to hold KODEX Leverage for 5 trading days. The 5-trading-day swing cost is 1.0% for the 2x. If the index rises 3% that week, the direction part is 1.03² − 1, or 6.09%, and 1.0% is taken away from that. Over a day to a week, a leveraged fund generally delivers close to what its name says.
The second investor expects the index to fall within three months and plans to hold the inverse 2x for 60 trading days. The 60-trading-day swing cost is 29.2% for the inverse 2x. Even assuming the index falls 10% over three months, the direction part is 1 ÷ 0.9² − 1, or 23.5%, smaller than the swing cost. If today’s swings last three months, the calculation says you can lose with the inverse 2x even while being right about the fall.
The third investor expects the KOSPI 200 to rise over a long period and plans to hold the leveraged fund for a year. If today’s volatility lasts a year, the 2x swing cost is 38.1%. If it comes back down to the normal 17.5%, it is 3.0%. The result of a one-year hold depends more on the next year’s swings than on direction, and those swings cannot be known on the day you buy. Weigh this together with the fact that, in actual one-year holds since 2010, only 38.2% made double or more.
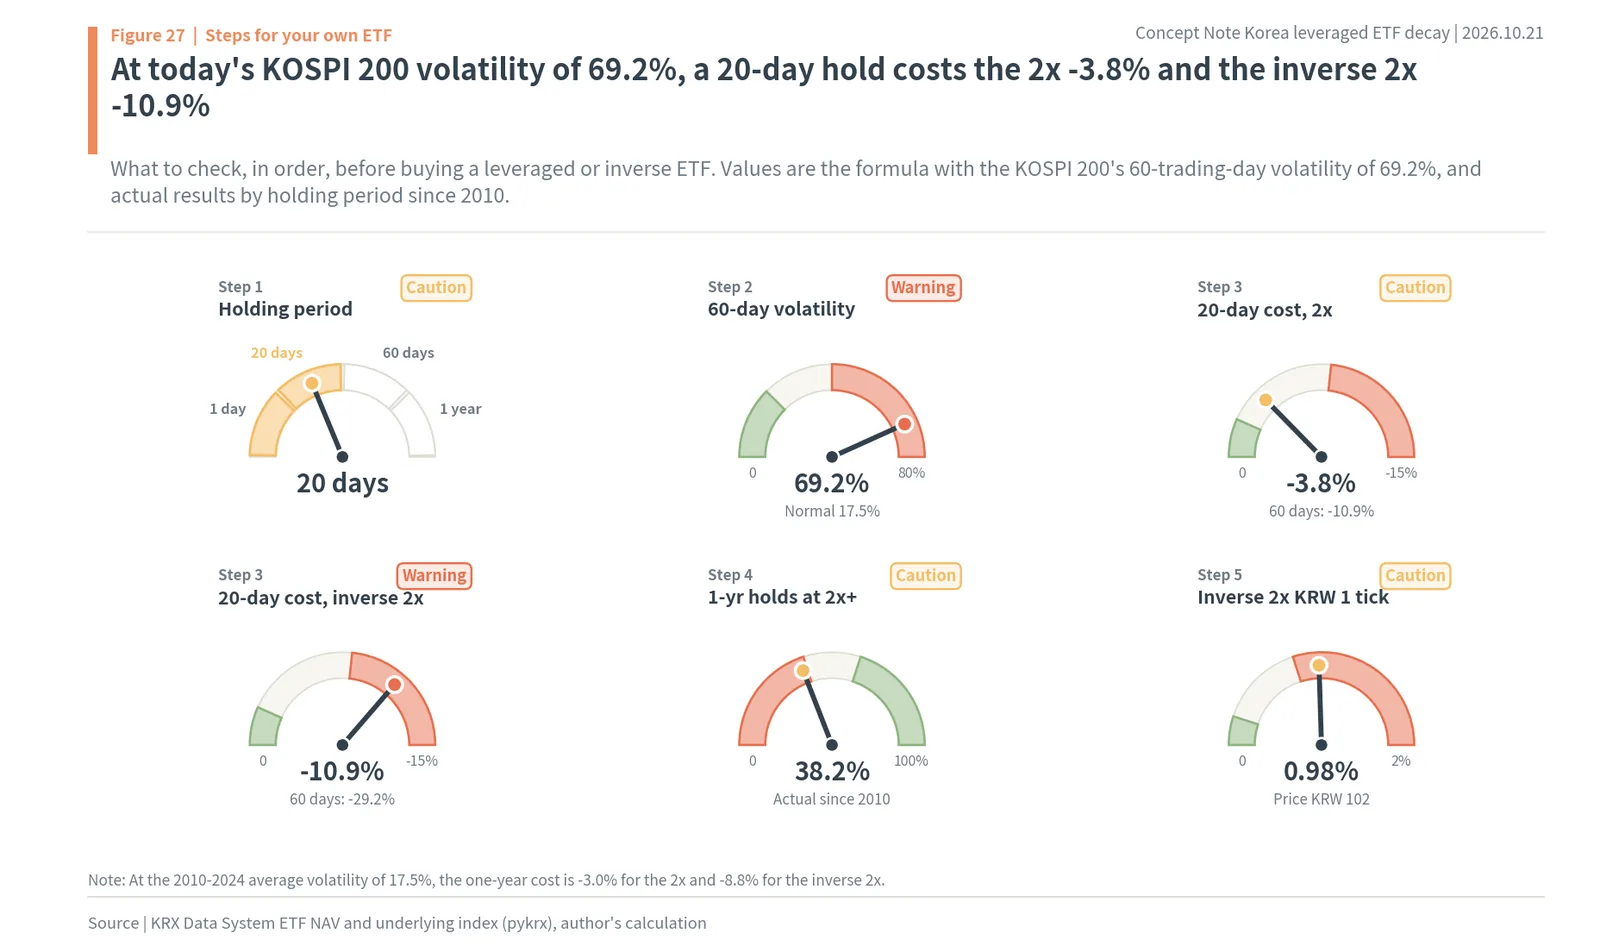
The figure shows the results with today’s numbers. At today’s KOSPI 200 volatility of 69.2%, a 20-day hold costs the 2x -3.8% and the inverse 2x -10.9%; the share of one-year holds that made double or more is 38.2%; and one tick of the inverse 2x is 0.98%.
Maochaedung’s take. Leveraged and inverse ETFs reset a multiple of the daily return every day, so their period return is not the index’s period return times the multiple but the daily return times the multiple, compounded day after day. When the index goes up and down, that product shrinks, and the share taken away is roughly (multiple² − multiple) ÷ 2 × volatility². The coefficient is 1 for the 2x and the inverse, and 3 for the inverse 2x and 3x. In 2025, with volatility at 23.3%, the KOSPI 200 rose 90.7% and the leveraged fund made 244.9%, more than double; in 2026, with volatility at 65.7%, the KOSPI 200 rose 47.0% and the leveraged fund 49.9%. This year the KOSDAQ 150 fell 13.1%, yet its inverse also lost 15.9%, and the inverse 2x has fallen 99.0% since listing. So when buying a leveraged or inverse product, calculate how many days you will hold and how much the market is swinging now, together with the direction.
Leveraged and inverse ETF decay FAQ
Q. Why did KODEX Leverage rise only 49.9% when the KOSPI 200 rose 47.0% in 2026?
KODEX Leverage doubles the KOSPI 200’s daily return, not its yearly return. From the end of 2025 to Oct 21, 2026 the index’s annualized volatility was 65.7%, and it moved more than 5% on 42 of 195 trading days. Compounding those big up and down days took away most of the extra return, so the fund made 44.2 percentage points less than the 94.1% that simply doubling the index would give.
Q. How much does volatility cost a leveraged ETF?
Roughly (multiple² − multiple) ÷ 2 × volatility² per year. The coefficient is 1 for a 2x or -1x product and 3 for a -2x or 3x product. At 20% annual volatility a 2x loses about 3.9% a year to swings and an inverse 2x about 11.3%; at 60% volatility, 30.2% and 66.0%.
Q. Is the inverse 2x (gopbeoseu) a mirror image of the 2x leveraged ETF?
Only in direction. Its swing coefficient is 3, the same as a 3x product, against 1 for the 2x. KODEX 200 Futures Inverse 2X has fallen 99.0% since its Sep 22, 2016 listing, and from Jul 27 to Oct 21, 2026, when the KOSPI 200 fell 16.7%, it rose only 1.8%.
Q. Can a leveraged ETF beat twice the index?
Yes, when the index trends steadily. In 2025 the KOSPI 200 rose 90.7% at 23.3% volatility and KODEX Leverage rose 244.9%, 63.5 percentage points more than double. But buying on every trading day since February 2010 and holding a year, it made at least twice the index only 38.2% of the time.
Q. What do you need to buy a leveraged ETF in Korea?
Since the 2020 rules, individuals need a basic deposit of KRW 10mn and an online course from the Korea Financial Investment Association. From May 22, 2026 the KRW 10mn deposit also applies to first-time buyers of overseas leveraged ETFs, and from Jul 31, 2026 single-stock leveraged products require KRW 30mn in cash.
Sources
- FINRA press release, FINRA, SEC Warn Retail Investors About Investing in Leveraged or Inverse ETFs (as published by Mondo Visione, https://mondovisione.com/media-and-resources/news/finra-sec-warn-retail-investors-about-investing-in-leveraged-or-inverse-etfs-2011124/), Aug 18, 2009
- Bizwatch, “Ahead of the KOSPI surge”: a failed attempt to buy a leveraged ETF (link), Apr 11, 2025
- Herald Economy, Without KRW 10mn you cannot buy leveraged ETFs at all, from the 22nd (link), May 20, 2026
- Segye Ilbo, Deposit for single-stock leverage raised to KRW 30mn as regulators tighten ETF requirements (link), Jul 16, 2026
- MTN, Higher deposit for single-stock leveraged ETFs brought forward to the 31st (link), Jul 24, 2026
- KRX Data System, daily ETF NAV and underlying index (KODEX 200, KODEX Leverage, KODEX Inverse, KODEX 200 Futures Inverse 2X, KODEX KOSDAQ150 Leverage, KODEX KOSDAQ150 Futures Inverse) and KOSDAQ 150 index (via pykrx), Jan 2010 to Oct 21, 2026
- Yahoo Finance, daily closes of QQQ, TQQQ, SQQQ, SOXX, SOXL and SOXS, Mar 2010 to Oct 20, 2026; KRW=X exchange rate, Oct 21, 2026
- Naver Finance, SK hynix and Samsung Electronics adjusted prices, Jan 2025 to Oct 21, 2026
- Photos: AgnosticPreachersKid, “U.S. Securities and Exchange Commission headquarters”, CC BY-SA 3.0; Narubaru7, “Korea Exchange 2025”, CC BY 4.0; ajay_suresh, “Nasdaq MarketSite”, CC BY 2.0; Rob Bulmahn, “Silicon Wafer 20200519”, CC BY 2.0; Seoul Institute, “Government Complex Seoul Main Building”, CC BY 4.0; 4300streetcar, “SK Hynix DDR5 form factors”, CC BY 4.0 (all Wikimedia Commons)
Was this note useful?
Thanks. Your answer helps decide what to cover next.
Korea market snapshot · Oct 23, 2026
New to Korean stocks? Start here for the basics.
Most read
1France Protests 2026: Why Students Are Blocking Schools and Which Stocks Benefit (Munich Re, SCOR)
Get the Saturday note on Korean stocks
One email every Saturday with the week’s new research on Korean listed companies and links to the updated data pages. Built from DART filings and KRX data. Free; unsubscribe in one click. See past issues