
Korean ETF Premium/Discount and Tracking Error: An 85.86% Premium, a 4.99pp FX Hit, and Why the Fee Matters Least
The total fee is the smallest ETF cost. The premium/discount decides how far above or below NAV you trade today, and the exchange rate decides how far an overseas ETF trails its index over a year. This report measures both with Korea Exchange (KRX) data for every Korean ETF, from KODEX 200 (069500.KS) and TIGER US S&P500 (360750.KS) to ACE SK hynix Single-Stock Leverage (0194T0.KS), and ends with five steps to check any ETF. Numbers as of the October 12, 2026 close.
- Normally LPs hold prices near NAV: KODEX 200’s one-year premium/discount averaged 0.15%, and 82.0% of 1,164 ETFs closed within 0.5% of NAV on October 12.
- On March 4, when KOSPI 200 fell 11.94%, 61.3% of overseas equity/commodity ETFs and 50.0% of leveraged/inverse ETFs closed more than 1% from NAV.
- Overseas ETF gaps are mostly a stale NAV: on 10 of 12 days TIGER US S&P500 was over 1% away, the next day’s NAV moved the same way.
- In the June 8 closing auction, when LPs need not quote, ACE SK hynix Single-Stock Leverage closed 85.86% above NAV; KRW 10mn bought there lost KRW 2.7mn the next day.
- TIGER US S&P500 trailed the S&P 500 by 5.36pp in a year, 4.99pp of it from the won-dollar rate, while its fee of 0.0068% costs KRW 680 a year on KRW 10mn.
Key takeaways
- On June 8, 2026, ACE SK hynix Single-Stock Leverage (0194T0.KS) closed in the closing auction at KRW 30,000, 85.86% above its NAV of KRW 16,141, and anyone who bought at that price lost 27.03% the next day. The fund’s NAV rose 35.09% on the same day.
- On March 4, when KOSPI 200 fell 11.94%, 61.3% of overseas equity/commodity ETFs and 50.0% of leveraged/inverse ETFs closed more than 1% away from NAV. On the quiet day of September 15, the shares were 14.2% and 18.6%.
- Over the past year, five US S&P 500 ETFs listed in Korea earned 5.33 to 6.49 percentage points less than the S&P 500, and of TIGER US S&P500’s (360750.KS) gap of -5.36pp, -4.99pp was the fall in the dollar against the won. Total fees of 0.0047% to 0.0068% made almost none of that gap.
As of: October 12, 2026 (ETF prices and NAV are October 12 closes; total fees and tracking error rates were retrieved on October 13)
Concepts covered: NAV, iNAV, premium/discount, LP (liquidity provider), LP quoting exemption times, premium/discount disclosure, tracking error, tracking difference, currency hedging, total fee, total expense ratio
Summary: Korean ETF premium/discount sets today’s price, tracking difference sets the one-year result
This report asks one question with Korean market data: when you buy an ETF, where does the cost you actually bear come from? The answer is not the total fee but the premium/discount and the exchange rate. The premium/discount decides how much more or less than NAV you pay or receive when you trade today, and the exchange rate, together with the choice of currency hedging, separates the one-year results of ETFs that follow the same index. After a fee-cutting race among issuers, total fees on US S&P 500 ETFs in Korea are down to 0.0047% to 0.0068% a year, so KRW 10mn (about $7,446) held for a year costs only KRW 470 to 680 (about $0.35 to $0.51). Dollar figures in this report use KRW 1,342.99 per dollar, the Yahoo Finance rate for October 12, 2026.
An ETF is a fund that trades on an exchange like a stock. Each ETF share holds a slice of the stocks and bonds in the fund, and the value of those holdings per share is the net asset value (NAV). The price on the exchange is set by buyers and sellers, so it is not exactly the NAV. The difference, expressed as a percentage of NAV, is the premium/discount (in Korean, the “divergence rate”). Tracking error, on the other hand, measures how far NAV strays from the underlying index it is supposed to follow. Remember that the premium/discount is the distance between price and NAV, and tracking error is the distance between NAV and the index, and the two numbers never get mixed up.
Most of the time both distances are small. Because liquidity providers (LPs) post buy and sell quotes near NAV, KODEX 200 (069500.KS) averaged a premium/discount of 0.15% over the past year, and of the 1,164 ETFs that traded on October 12, 82.0% closed within 0.5% of NAV. The trouble is the days when the market moves a lot. In 2026, KOSPI 200 moved more than 5% in a day on 40 days, and on such days overseas equity/commodity ETFs and leveraged/inverse ETFs were the first to leave NAV. Most gaps in overseas ETFs arise because NAV, calculated from the previous night’s overseas close, is late: of the 12 days when TIGER US S&P500 was more than 1% away from NAV, on 10 the next day’s NAV moved the same way.
The premium/discount turns directly into a loss when LPs have no duty to quote. Before and just after the open, and in the closing auction (15:20 to 15:30), LPs are exempt from their quoting obligation. ACE SK hynix Single-Stock Leverage’s 85.86% on June 8 came out of exactly that closing auction. Move on to the one-year scorecard, and what makes the difference is the exchange rate. Over the past year the won strengthened from KRW 1,403 to KRW 1,343 per dollar, a 4.29% fall in the dollar, so unhedged S&P 500 ETFs earned more than 5pp less than the index. This report follows the numbers in that order and ends with five steps readers can apply directly to their own ETF.
ETF premium/discount vs tracking error: key terms (NAV, iNAV, LP, tracking difference, total expense ratio)
First, the terms that come up often in this report. NAV (net asset value) is the per-share value of an ETF: its stocks, bonds and cash minus liabilities, divided by the number of shares issued, calculated once a day after the close. iNAV (indicative NAV) is the estimated NAV the exchange publishes every 10 seconds during trading. The price is what actually trades on the exchange, and the close is the day’s last trade. The premium/discount is how many percent the price is away from NAV: a plus is a premium (more expensive than NAV) and a minus is a discount (cheaper than NAV).
An LP (liquidity provider) is a brokerage that contracts with the issuer of each ETF to post buy and sell quotes. LPs must quote near NAV, but they are exempt from that duty around the open and in the closing auction. The underlying index is the index an ETF promises to follow. The tracking error rate is how much the daily return difference between NAV and the index wobbles, and tracking difference is how many percentage points NAV earned more or less than the index over a period. The total fee is the sum of management, distribution, custody and administration fees, and the total expense ratio adds other expenses and trading and brokerage costs to it.
Keep the two distances in mind and the rest is easy. The distance between price and NAV (premium/discount) arises on the exchange and depends on how closely LPs quote. The distance between NAV and the index (tracking error and tracking difference) arises in fund management and depends on fees, taxes, exchange rates and trading costs. The first is a cost at the moment you trade; the second is a cost while you hold.
How ETF trading works in Korea: KRX, LPs, iNAV every 10 seconds and the 1%/2% disclosure rule
Korean ETFs trade on the Korea Exchange (KRX). The KOSPI is the KRX main board and its benchmark index (KOSPI 200 is its 200 largest stocks, the index behind Korea’s flagship ETFs), and the KOSDAQ is the exchange’s growth market. Regular trading runs from 09:00 to 15:30, with a pre-open single-price auction from 08:30 and a closing single-price auction from 15:20 to 15:30. Korea counts large sums in units of 10,000 won (man), 100 million won (eok) and one trillion won (jo); this report shows them as KRW mn, KRW bn and KRW tn.
Every ETF must have at least one LP, a brokerage that keeps two-sided quotes inside a reported spread and, if the spread gets too wide, posts at least 100 shares on each side near iNAV within five minutes. The exchange publishes iNAV every 10 seconds, and Korean brokerage apps show it next to the price, so any investor can work out the live premium/discount. LPs are not required to quote from 08:30 to 09:05 (the pre-open auction and the first five minutes) or from 15:20 to 15:30 (the closing auction).
There are two layers of thresholds. When an ETF closes more than 1% (domestic assets) or 2% (overseas assets) away from NAV, the issuer must file an “ETF premium/discount exceeded” disclosure on KIND, the exchange’s disclosure site. Separately, LPs must keep the closing premium/discount inside a management standard, which was tightened from 3% (domestic) and 6% (overseas) to 2% and 5% on August 19, 2026. If the closing gap exceeds twice that standard, the ETF can be designated for investor caution and moved to single-price trading. Daily premium/discount and tracking error histories for every ETF are free on the KRX Data System, and total expense ratios are on the Korea Financial Investment Association (KOFIA) disclosure site.
Data and methods: KRX premium/discount, NAV and tracking error as of October 12, 2026
The premium/discount, NAV and tracking error figures in this report come from the KRX Data System, downloaded with pykrx. One-year paths for single ETFs use the daily values on the KRX “ETF premium/discount history” and “tracking error history” screens (October 1, 2025 to October 12, 2026), and for cross-sections of all ETFs the author recalculated the premium/discount from the closes and NAVs on the “all ETF prices” screen. The cross-sections cover two quiet days (September 15 and October 12) and four big days (March 4, July 7, July 8 and July 31). ETFs with zero volume have no price and are excluded. The 2020 oil case uses the daily premium/discount of KODEX WTI Crude Oil Futures (H) from March to June 2020.
There is a reason the reference date is October 12 and not October 13. On October 13 the KOSPI fell 5.46% to 6,035.35 and KOSPI 200 fell 6.25% to 942.07 (Naver Finance, as of 16:15). But when the author queried the KRX all-ETF prices twice and the premium/discount screen once that evening, KOSPI 200 came back three different ways: 953.05, 951.3 and 938.47. Calculating the premium/discount from NAVs that had not finished settling would make the numbers depend on the query time, so the October 13 ETF data were left out and the October 12 close is used throughout.
Cross-sections of total fees and tracking error rates were collected for the top 200 ETFs by market cap from the Naver Finance ETF analysis screen (retrieved October 13). Naver’s tracking error rate is the same as the KRX figure (KODEX 200 0.69% and TIGER US S&P500 0.09% in both). The won-dollar rate and the S&P 500 are Yahoo Finance closes. ETFs are grouped as “leveraged/inverse” if the name contains leverage, inverse or 2X; “overseas equity/commodity” if Naver classifies them as overseas equity or commodities; “domestic equity” if they follow a domestic market index, sector or theme; and “bonds/other” for the rest (bonds, rates, mixed and so on).
There are three calculations. The premium/discount is (close − NAV) ÷ NAV × 100. Tracking difference is NAV return minus underlying index return over the same period. The FX share is the dollar index return multiplied by the change in the won-dollar rate, the part an unhedged overseas ETF gains or loses when converting into won. The rest is a mix of fees, dividend tax, distributions and timing. Everything marked “author’s calculation” in the figures and text follows these definitions.
What is an ETF premium/discount? (market price − NAV) ÷ NAV × 100, with KODEX 200 at 0.15%
The premium/discount is how many percent the market price is away from NAV. KB Kookmin Bank defines it as (market price − NAV) ÷ NAV × 100. In a hypothetical example, buying an ETF with a NAV of KRW 10,000 at KRW 10,100 gives a premium of +1%: you paid 1% more than the assets inside are worth. Selling at KRW 9,900 is a discount of -1%: you sold for 1% less than the assets inside. A premium hurts the buyer, and a discount hurts the seller.
NAV is the fund’s assets minus liabilities divided by the number of shares issued, calculated once a day after the close (Samsung Asset Management). Since nobody can wait for that number during trading, the exchange publishes an estimated NAV every 10 seconds. That is the iNAV (Shinhan Asset Management). The “NAV” or “iNAV” next to the current price on a brokerage app’s ETF screen is this value, and the live premium/discount is calculated from the current price and the iNAV.
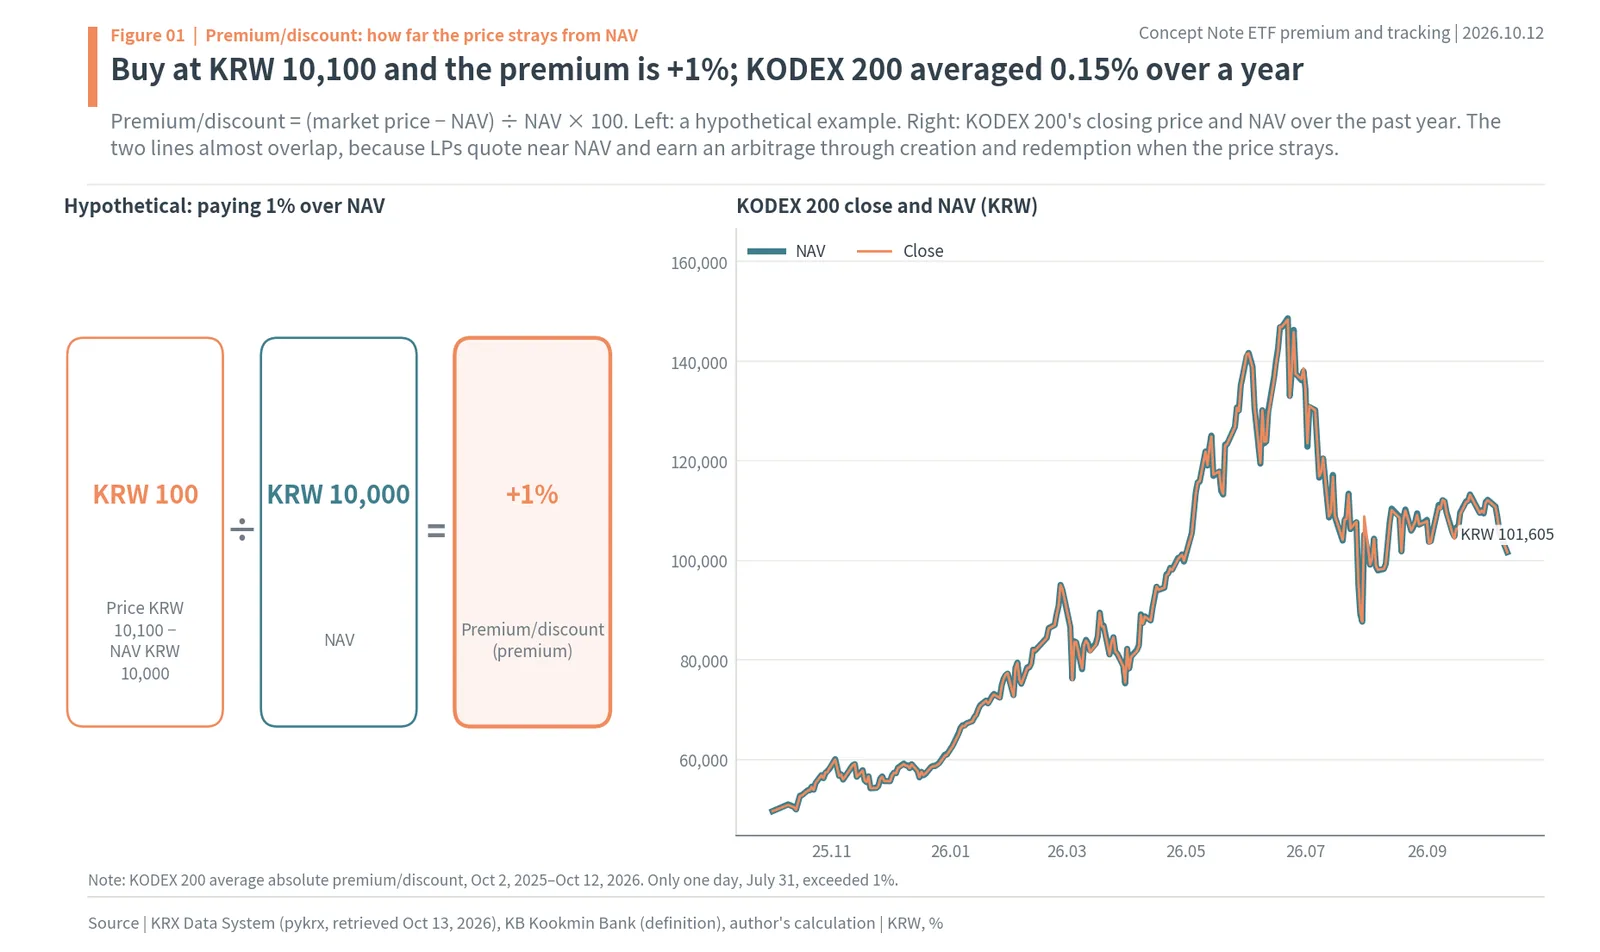
The left side of Figure 01 is the formula with the hypothetical example, and the right side is KODEX 200’s close and NAV over the past year. The two lines almost overlap. While KODEX 200 more than doubled during the year, from KRW 48,135 to KRW 101,605, the average distance between its close and NAV was 0.15%. Buy at KRW 10,100 against a NAV of KRW 10,000 and you pay a +1% premium; KODEX 200 rarely let that happen. The price hugs NAV this closely not by itself, but because of a mechanism called the LP.
An LP is a brokerage attached to each ETF, one or more per fund, that must keep posting buy and sell quotes inside a reported spread (Shinhan Asset Management). If the spread gets wider than a set amount, it must post at least 100 shares on each side near iNAV within five minutes (Hanwha Asset Management PLUS ETF). So when the price gets more expensive than NAV, the LP creates new ETF shares and sells them, and when it gets cheaper, the LP buys and redeems them for an arbitrage profit. This arbitrage pulls the price back toward NAV. The premium/discount opens up at the moments that pull weakens.
Korean ETF market size: 1,172 ETFs worth KRW 437.6tn, 31% in overseas equity
As of October 13, Korea has 1,172 ETFs with a combined market cap of KRW 437.6tn (about $325.8bn) (Naver Finance). By market cap, overseas equity ETFs are the largest at KRW 135.5tn (about $100.9bn, 379 funds), followed by domestic sector/theme ETFs at KRW 98.2tn (340), bonds at KRW 77.3tn (170) and domestic market index ETFs at KRW 74.6tn (99). Domestic derivatives (leveraged, inverse and similar) are 37 funds with KRW 11.8tn, and commodities are 23 funds with KRW 6.9tn.
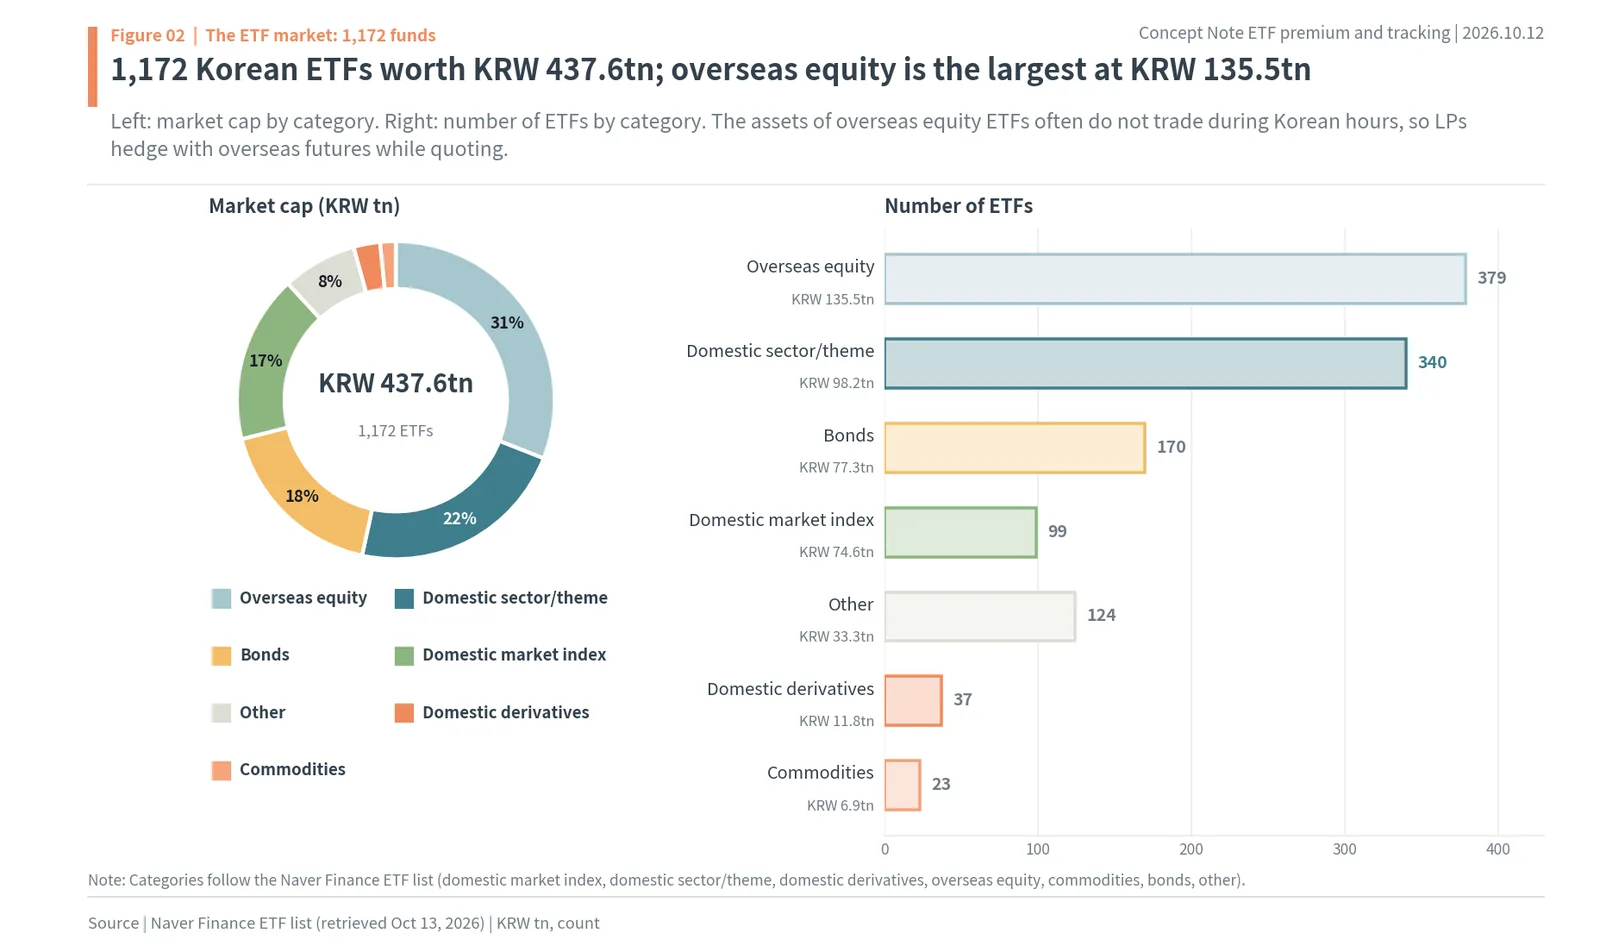
This mix matters for reading the premium/discount because the assets of overseas equity ETFs often do not trade during Korean hours. US stocks trade during the Korean night. During Korean hours, LPs cannot trade US stocks directly, so they quote while hedging with overseas futures (KIND disclosure). With 31% of the market’s value sitting on that structure, any news that could move overseas markets during Korean hours is bound to open a gap between price and NAV.
How LPs keep ETF prices close to NAV: creation, redemption and arbitrage
LPs pull the price toward NAV through creation and redemption. Creation means handing the issuer the basket of stocks the ETF holds and receiving new ETF shares; redemption is the reverse, returning ETF shares and receiving the basket. Because this channel is open, a price that strays from NAV creates an arbitrage profit. If the hypothetical ETF with a NAV of KRW 10,000 trades at KRW 10,100, the LP can build one new ETF share from a KRW 10,000 basket and sell it at KRW 10,100. Whatever is left of the KRW 100 after trading costs is the LP’s share.
If the price is KRW 9,900 instead, the LP buys the ETF, redeems it for a KRW 10,000 basket and sells the basket in the market. As this arbitrage repeats, the expensive side gets sold and the cheap side gets bought, and the price returns to NAV. So the more easily the basket can be traded right now, the narrower the premium/discount. ETFs like KODEX 200, which hold large Korean stocks trading at the same hours, are the narrowest; overseas ETFs whose basket cannot be traded right now, and leveraged ETFs that must deliver twice the daily move, are wider.
This structure also tells you when the premium/discount widens: when the market for the basket is closed; when the basket’s value moves too fast for LPs to hedge; and when orders pile onto one side during hours when LPs have no duty to quote. The big days, the overseas ETFs, the leveraged funds, June 8 and the 2020 oil case in this report each fall into one of these three.
On a normal day 82.0% of Korean ETFs close within 0.5% of NAV
On October 12, KOSPI 200 fell 3.79%, yet 82.0% of the 1,164 ETFs that traded closed within 0.5% of NAV (author’s calculation). In all, 69 ETFs (5.9%) were more than 1% away and five were more than 3% away. The median absolute premium/discount by group was 0.25% for domestic equity, 0.36% for leveraged/inverse, 0.29% for overseas equity/commodity and 0.06% for bonds/other. Bond ETFs are the narrowest because their assets do not move much in a day, which lets LPs quote tightly.
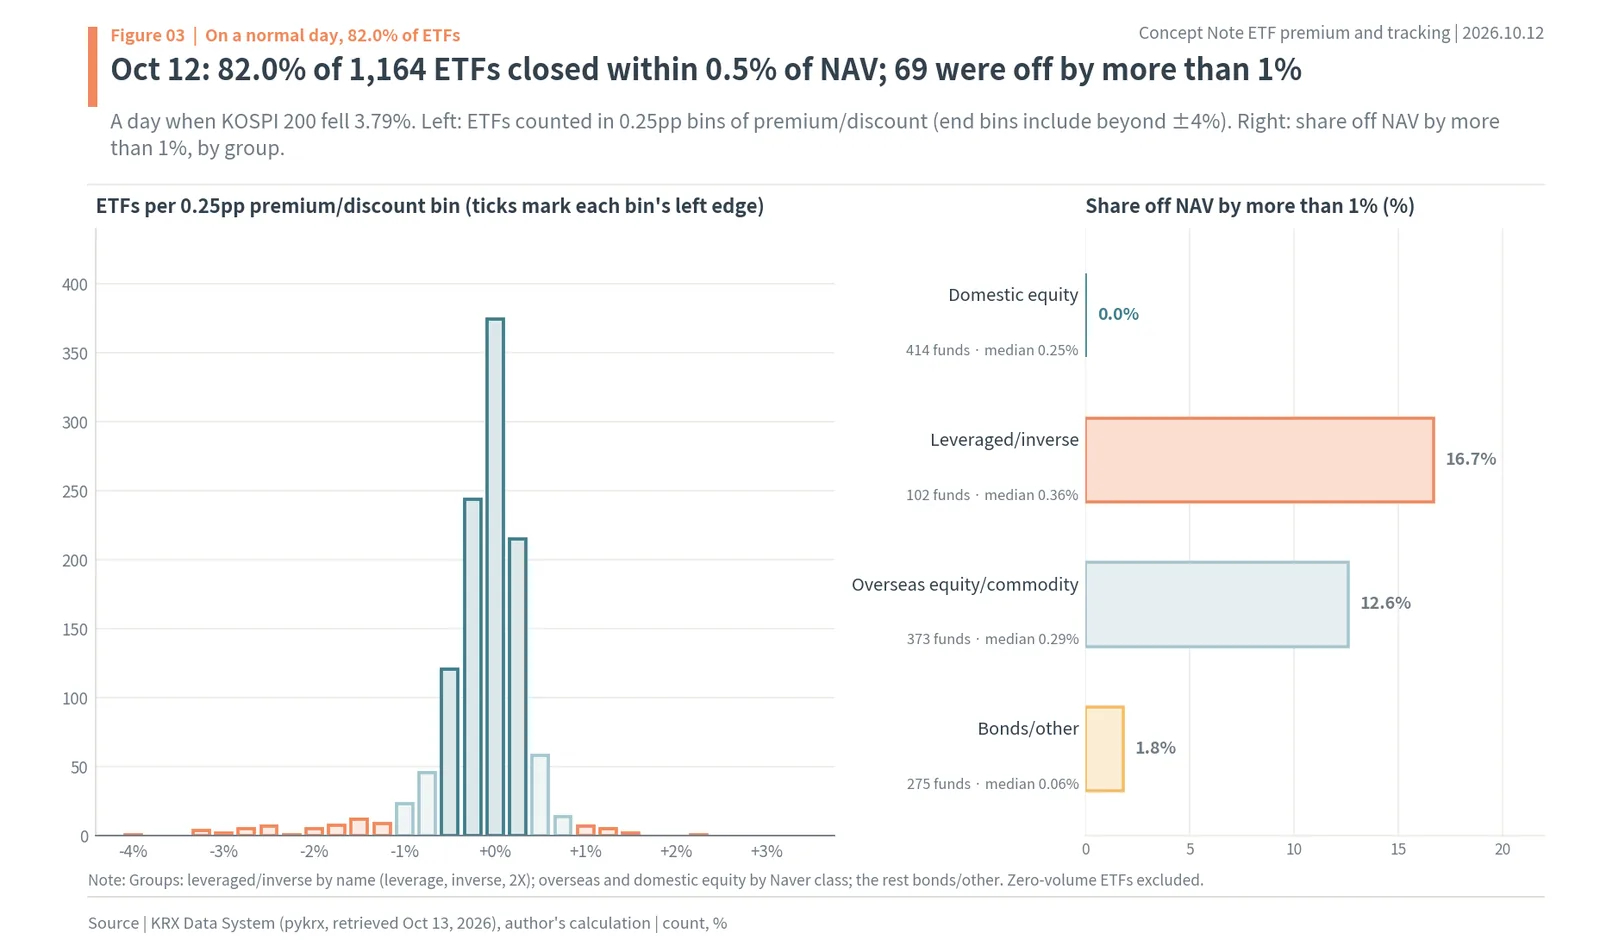
The left side of Figure 03 counts the October 12 premium/discount in 0.25pp bins. Most ETFs pile up near zero and both tails are short. The right side is the share of each group more than 1% away. Domestic equity was 0.0%, leveraged/inverse 16.7% and overseas equity/commodity 12.6%. The widest ETFs that day held Chinese stocks, such as KODEX Korea-China Semiconductor (Synthetic) at -4.08% and RISE China AI Semiconductor TOP4Plus at -3.13%. Even on the same day, the width of the gap depends on where the underlying assets trade.
Follow KODEX 200 alone over a year and the normal pattern is even clearer. Over 246 trading days its average absolute premium/discount was 0.15%, and only one day, July 31, exceeded 1%. The lowest day was September 15 at -0.52%. KOSPI 200 more than doubled over the year, from 479.37 to 1,004.92, with several days of 10%-plus moves, and still the price never left NAV’s side.
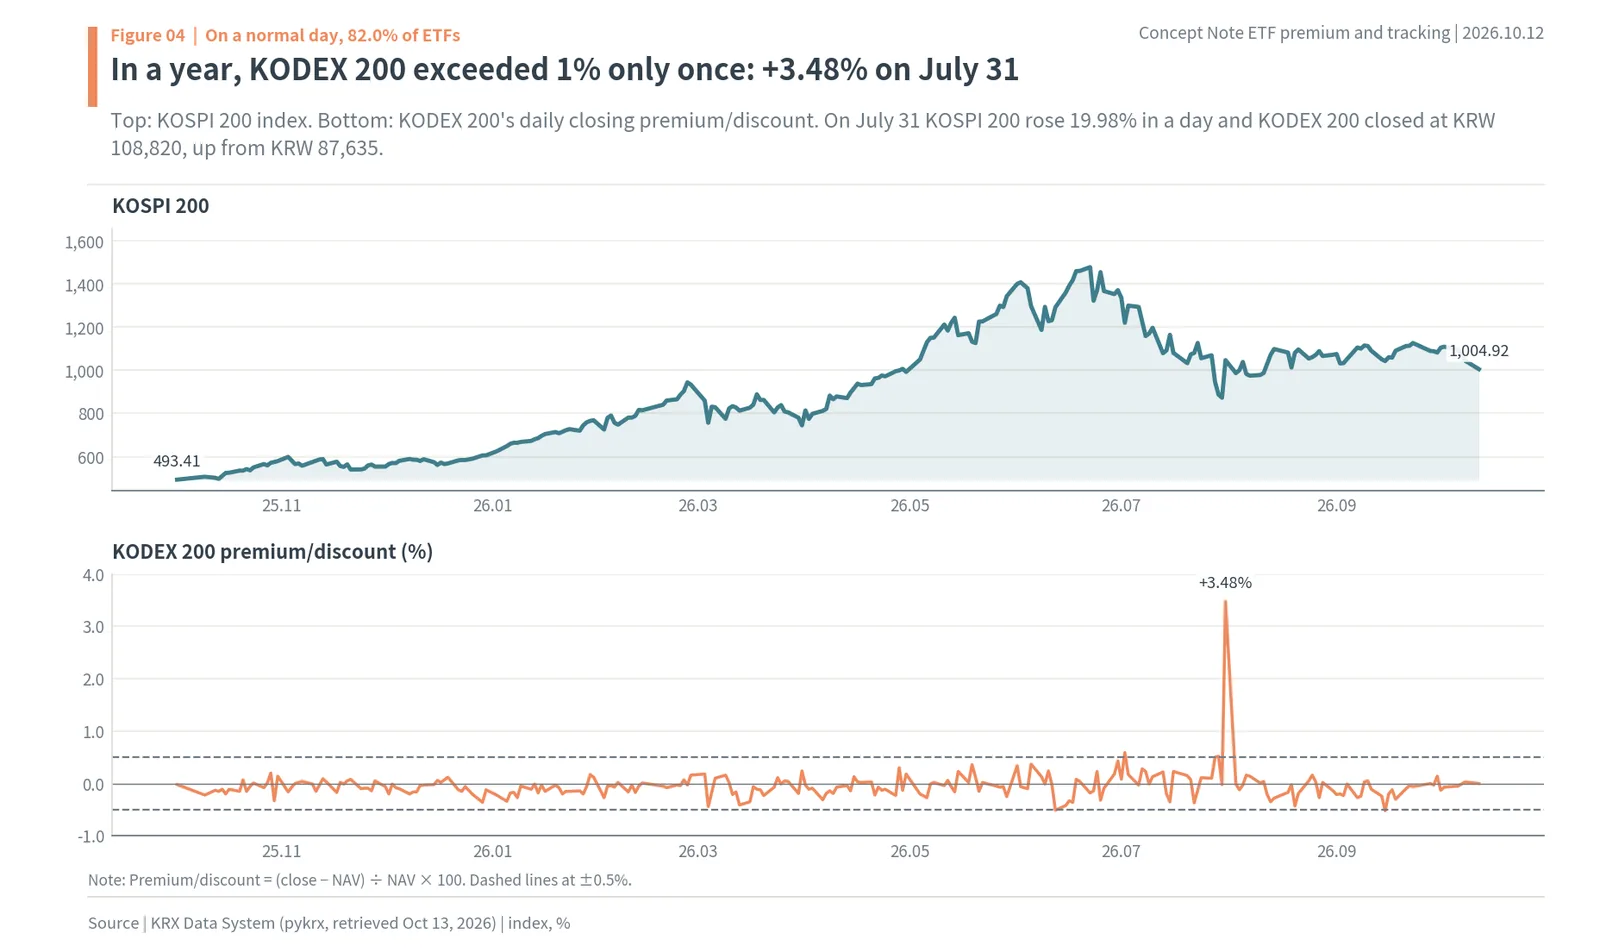
The top of Figure 04 is KOSPI 200 and the bottom is KODEX 200’s daily premium/discount. The line stays mostly inside the ±0.5% band, with July 31 at +3.48% sticking out on its own; in a year, KODEX 200 exceeded 1% only that once. That day KOSPI 200 rose 19.98%, and KODEX 200 closed at KRW 108,820, up from KRW 87,635, against a NAV of KRW 105,157. When the index rises 20% in a day, buy orders overrun the LPs’ quotes, and the excess is left as a premium.
KODEX 200 premium/discount more than doubles on days KOSPI 200 moves over 5%
Sort the days by KOSPI 200’s daily move and KODEX 200’s premium/discount is wider on bigger days. On the 131 days the index moved within ±2%, the average absolute premium/discount was 0.12%. On the 22 days it fell more than 5% it was 0.24%, and on the 18 days it rose more than 5% it was 0.37%. Taking the 40 days the index moved more than ±5% together gives 0.30%, more than double the quiet days (author’s calculation).
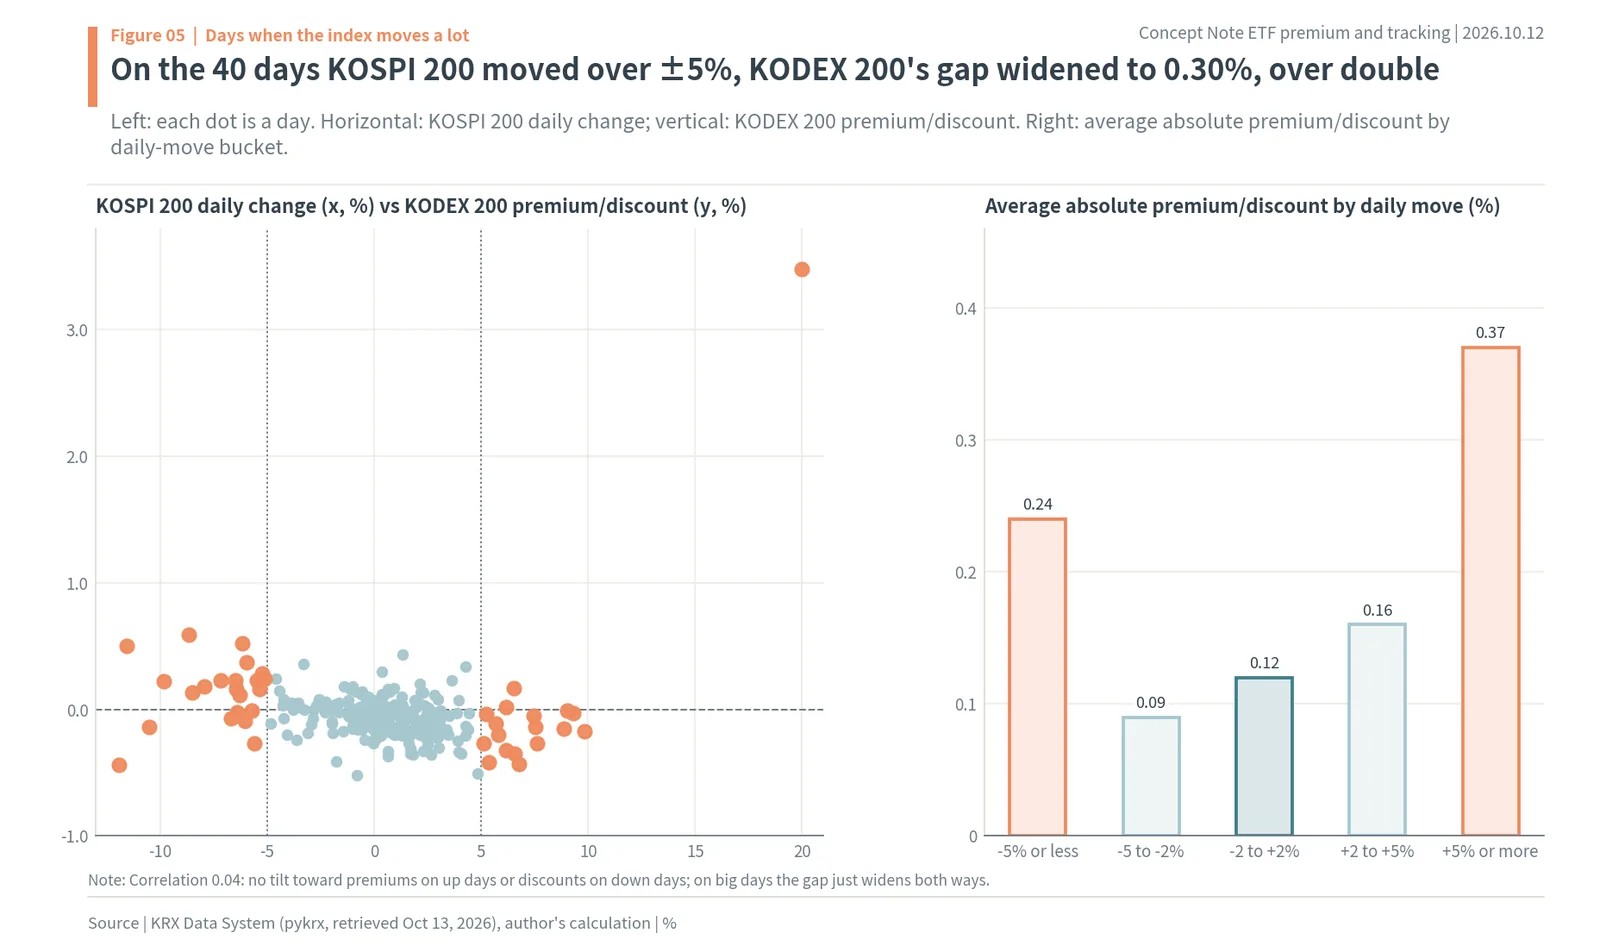
The left side of Figure 05 is a scatter plot with one dot per day. The horizontal axis is KOSPI 200’s daily change and the vertical axis is KODEX 200’s premium/discount. The dots in the middle cluster near zero and spread up and down toward both ends. The correlation is 0.04, so there is no tilt toward premiums on up days and discounts on down days. On big days the gap simply widens, whatever the direction. The bars on the right summarize that width by size of move.
By month, the same picture is drawn over time. In July 2026, when KOSPI 200’s average absolute daily move was largest at 5.33%, KODEX 200’s monthly average absolute premium/discount was also largest at 0.36%. In December 2025, when the index was quietest (1.16%), the gap was 0.11%. In months when the market shakes, even the market’s flagship ETF trades further from NAV than usual.
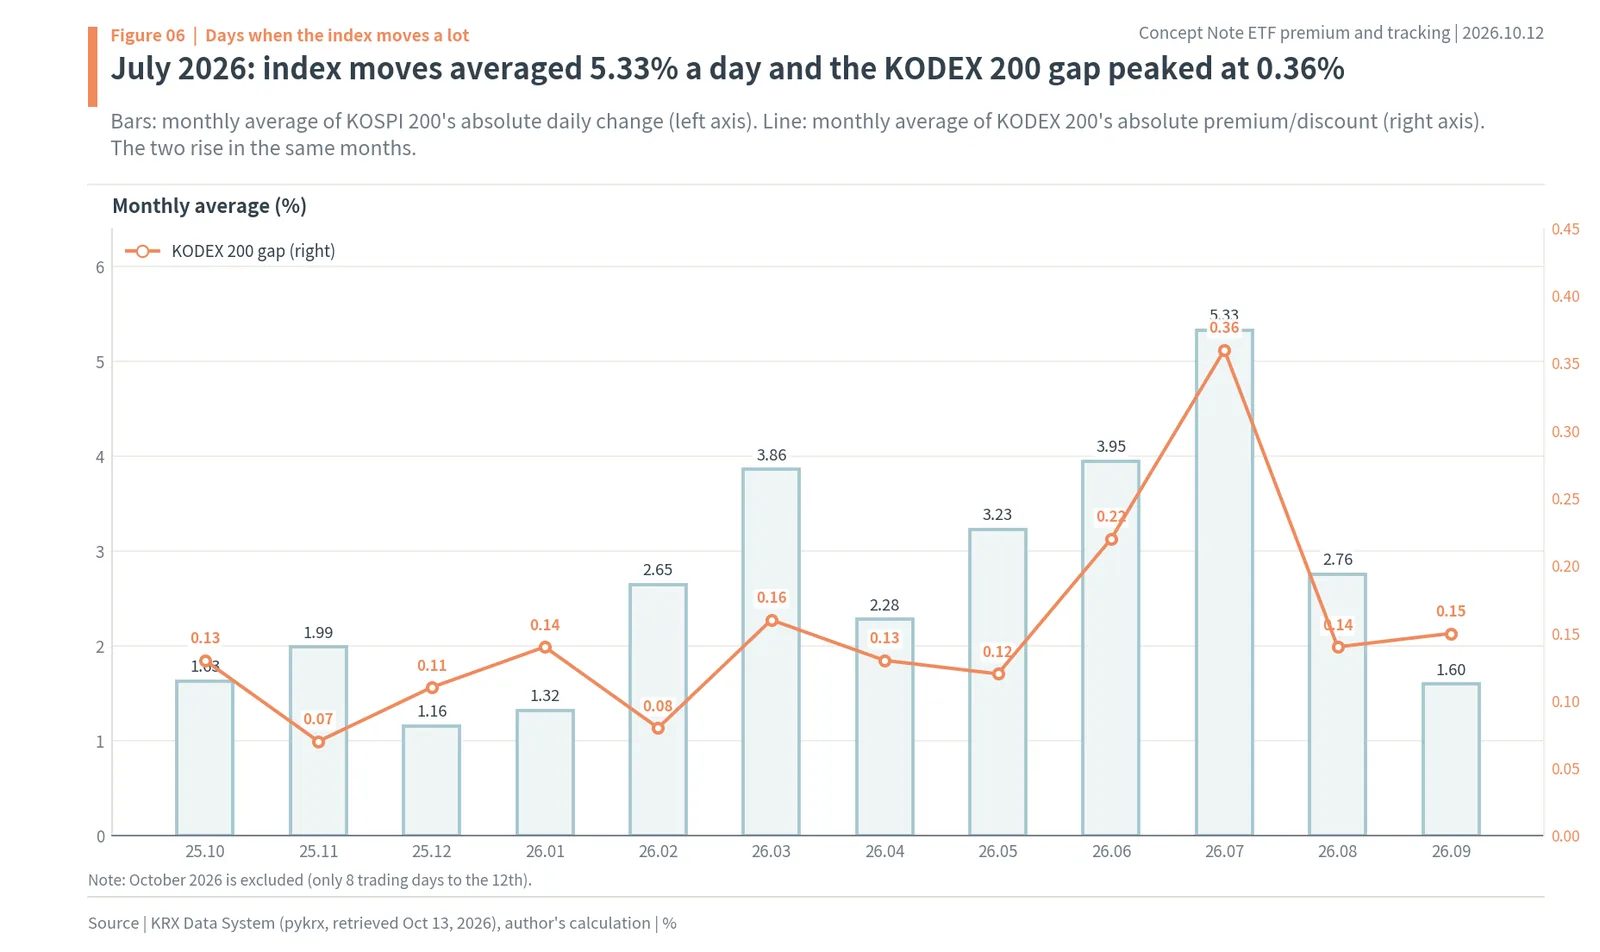
Figure 06 draws the two numbers side by side for each month. KOSPI 200’s average absolute daily move went from 1.63% in October 2025, 1.99% in November and 1.16% in December to 2.65% in February 2026, 3.86% in March, 3.95% in June and 5.33% in July, then eased to 1.60% in September. KODEX 200’s average absolute premium/discount in the same months went from 0.13%, 0.07% and 0.11% to 0.08%, 0.16%, 0.22% and 0.36%, then 0.15% in September. Both lines spike together in June and July. In the month when the index moved more than 5% a day on average, LP quotes also spread nearly three times wider than usual.
KODEX 200 is Korea’s largest ETF and has several LPs. With a market cap of KRW 22.2tn (about $16.5bn) and assets that trade on the Korean market at the same hours, LPs can hedge immediately. On the same big days, other ETFs came loose much further.
Big market days: 61.3% of overseas ETFs and 50.0% of leveraged/inverse ETFs off NAV by over 1%
Compare big days with quiet days across all ETFs and you can see which ones leave NAV first. On the quiet day of September 15 (KOSPI 200 -0.80%), 6.6% of all ETFs closed more than 1% from NAV. On March 4, when KOSPI 200 fell 11.94%, the share rose to 28.0%, and on July 31, when it rose 19.98%, to 33.4%. The increase was not spread evenly.
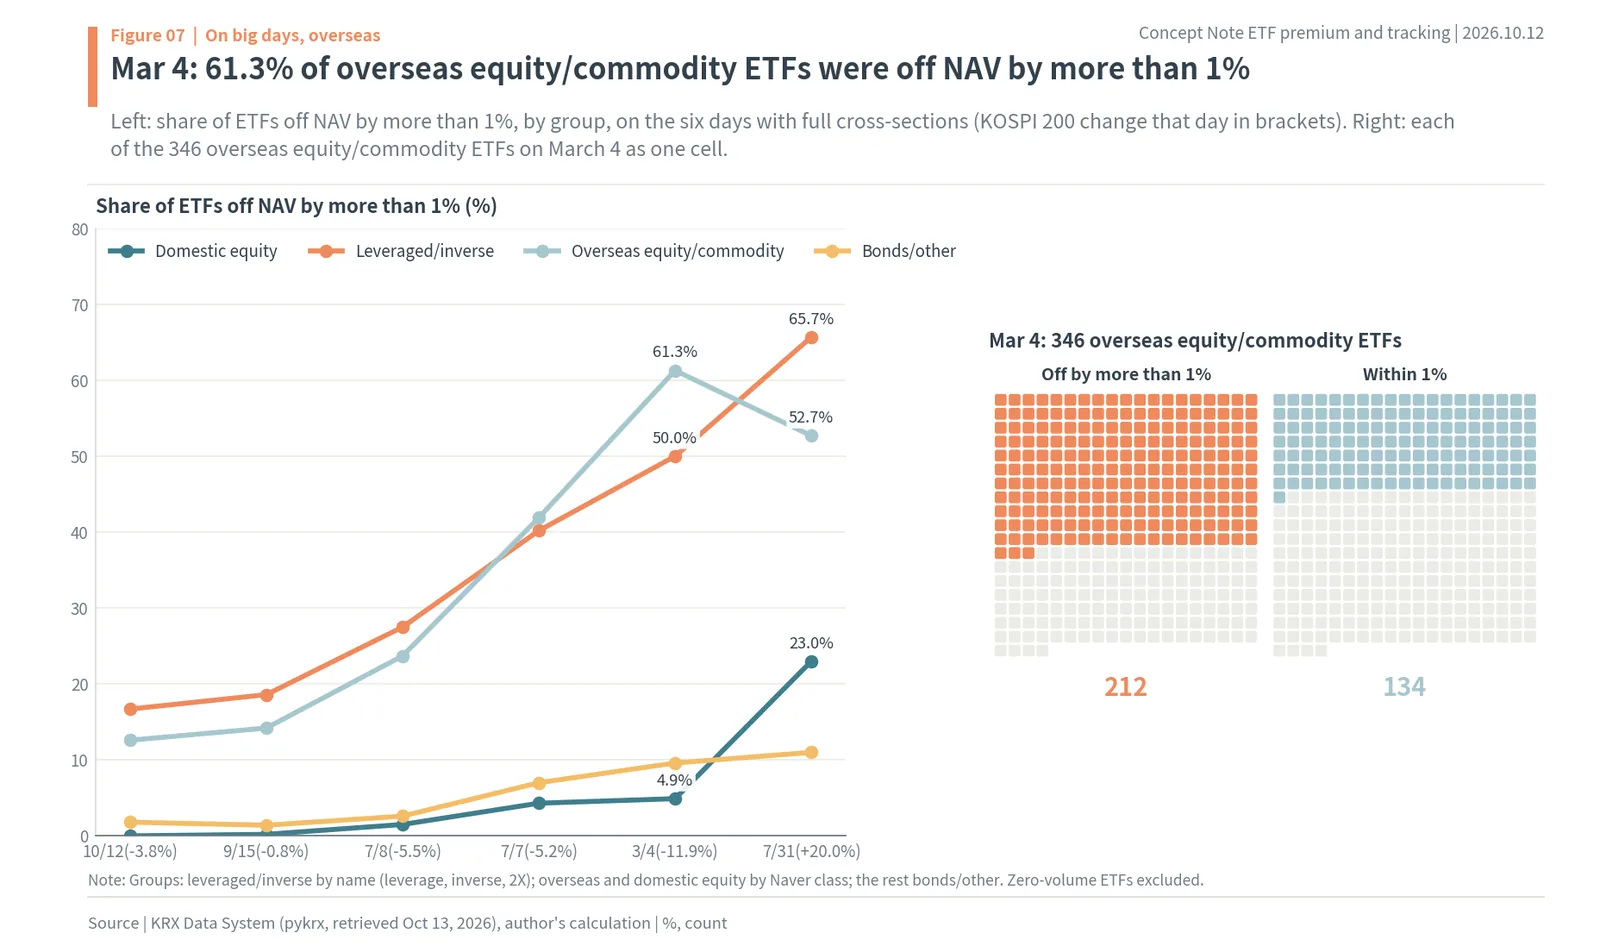
Figure 07 connects the share of each group more than 1% away across the days. Overseas equity/commodity jumped from 14.2% on September 15 to 61.3% on March 4. On March 4, 212 of 346 overseas equity/commodity ETFs were more than 1% away, and the group’s median premium/discount was -1.30%. Leveraged/inverse rose from 18.6% to 50.0%, and domestic equity from 0.2% to 4.9%. On July 31, leveraged/inverse reached 65.7%, overseas equity/commodity 52.7% and even domestic equity 23.0%.
The direction followed the market too. The median for overseas equity/commodity was -1.30% on March 4 and -0.87% on July 7, trading below NAV, and +1.01% on July 31, when the index soared, trading above NAV. On days the Korean market drops hard, investors sell overseas ETFs too, and on days it surges, they buy them too; with the underlying market closed, LPs cannot absorb all those orders, and what is left over becomes the premium/discount.
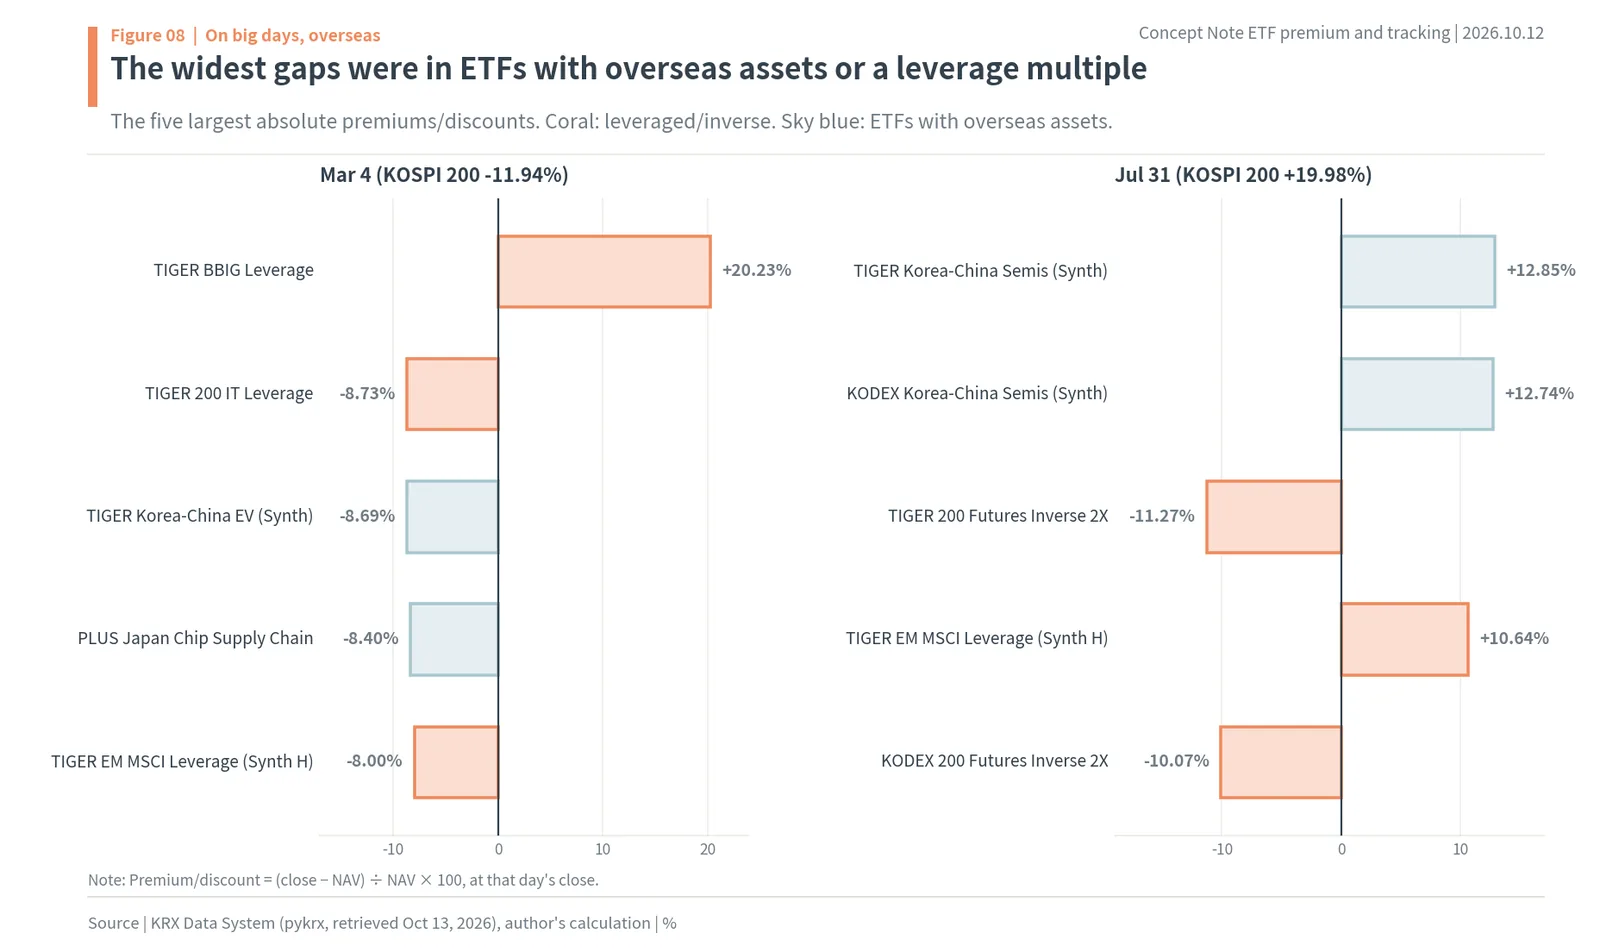
The ETFs with the widest gaps mostly held overseas assets or carried a multiple. On March 4 they were TIGER BBIG Leverage at +20.23%, TIGER 200 IT Leverage at -8.73%, TIGER Korea-China EV (Synthetic) at -8.69%, PLUS Japan Semiconductor Materials & Equipment at -8.40% and TIGER Emerging Markets MSCI Leverage (Synthetic H) at -8.00%. On July 31 they were TIGER Korea-China Semiconductor (Synthetic) at +12.85%, KODEX Korea-China Semiconductor (Synthetic) at +12.74%, TIGER 200 Futures Inverse 2X at -11.27% and KODEX 200 Futures Inverse 2X at -10.07%. On big days, gaps over 1% come from product structure, not from the market itself.
July 31, 2026: KOSPI 200 +19.98% and 23.0% of domestic equity ETFs off NAV by over 1%
Domestic equity ETFs traded tightly on most big days. When KOSPI 200 fell 11.94% on March 4, only 4.9% of 365 domestic equity ETFs were more than 1% away; on July 7 (-5.22%) it was 4.3%, and on July 8 (-5.48%) 1.5%. Because the basket trades on the Korean market at the same hours, LPs can hedge immediately with stocks or futures.
July 31 was different. When KOSPI 200 rose 19.98% in a day, 23.0% of 405 domestic equity ETFs were more than 1% away, and their median premium/discount was +0.27%, above NAV. When buy orders arrive all at once, LP quotes cannot take them all even if the basket is on the Korean market. That day KODEX 200 also closed at +3.48%, its only day above 1% in the year.
The difference tells you something about trading on big days. Selling domestic equity ETFs on a crash day generally fills near NAV, but buying them on a surge day can mean paying above NAV. On the same days, overseas equity/commodity ETFs moved three to four times wider than domestic equity ETFs, at -1.30% on March 4 and +1.01% on July 31. Orders on big days cost more in overseas and leveraged ETFs than in domestic equity ETFs.
Six days compared: ETF premium/discount widens with the size of the index move
Line up the six cross-section days by the size of KOSPI 200’s move and the gap generally widens with it. The median absolute premium/discount was 0.25% on September 15 (-0.80%), 0.23% on October 12 (-3.79%), 0.41% on July 7 (-5.22%), 0.29% on July 8 (-5.48%), 0.54% on March 4 (-11.94%) and 0.58% on July 31 (+19.98%). The number of ETFs more than 3% away rose from 2 on September 15 and 5 on October 12 to 28 on July 7, 33 on July 8, 72 on March 4 and 124 on July 31.
Days with similar moves still differ. July 7 and July 8 were back-to-back 5%-plus falls in KOSPI 200, but the share of ETFs more than 1% away was 20.2% on the first day and 11.2% on the second. The median for overseas equity/commodity was -0.87% on the first day and -0.13% on the second. On the first crash day even overseas ETFs were dumped all at once; on the second, that selling eased. The premium/discount captures both the size of the index move and the size of one-sided order flow.
The bonds/other group was the narrowest on all six days. Its median absolute premium/discount was 0.08% on September 15, 0.11% on March 4 and 0.18% on July 31, and its share more than 1% away peaked at 11.0% on July 31. Bond prices do not move as much in a day as stocks, and they are easy to hedge with rate futures. If you need cash on a big day and must sell an ETF, a bond ETF is where you get closest to NAV.
As of October 12 the cross-section includes 414 domestic equity, 102 leveraged/inverse, 373 overseas equity/commodity and 275 bonds/other ETFs. Overseas equity/commodity makes up nearly a third of the total, so it was also this group that pushed up the overall share of ETFs more than 1% away on big days. Of the 299 ETFs more than 1% away on March 4, 212 were overseas equity/commodity.
Largest Korean ETFs on March 4: US equity ETFs closed 0.6–0.9% below NAV
Narrow it to the ten largest ETFs by market cap and the same picture appears. On March 4 the domestic equity ETFs KODEX 200 (-0.44%), TIGER 200 (-0.49%), KODEX 200TR (-0.46%) and TIGER Semiconductor TOP10 (-0.32%) closed within 0.5%. The same day the US equity ETFs closed lower: TIGER US S&P500 at -0.61%, KODEX US S&P500 at -0.63%, TIGER US Nasdaq100 at -0.91% and KODEX US Nasdaq100 at -0.93%. KODEX Money Market Active (-0.00%) and KODEX CD Rate Active (Synthetic) (+0.01%), which follow short-term rates, were almost zero.
On the quiet day of October 12, all ten were within ±0.25%. The four US equity ETFs closed slightly above NAV at +0.19% to +0.24%, and the domestic equity ETFs near NAV at -0.14% to +0.04%. ETFs with more than KRW 10tn in net assets have several LPs and heavy trading, so their gaps are among the narrowest, yet even these ETFs come loose on big days, starting with the ones whose underlying market is closed. Size narrows the premium/discount, but it cannot remove the structural problem of a late NAV.
Why overseas ETFs trade at a premium or discount: stale NAV from the previous US close
An overseas ETF’s premium/discount means something different from a domestic ETF’s. Its iNAV is calculated from the previous day’s overseas close, and LPs quote until the Korean close at 15:30 while hedging with overseas futures (KIND disclosure). For an ETF of US stocks, NAV during Korean hours is the previous night’s US close times that day’s exchange rate. The price, however, reflects US index futures trading now and expectations for that night’s US session. So much of an overseas ETF’s premium/discount comes not from the price being expensive or cheap but from NAV being late.
TIGER US S&P500 on April 8 shows the structure exactly. It closed at KRW 24,825 against a NAV of KRW 24,167, a premium of +2.72%, the largest of the year. That night the S&P 500 rose 2.51%. The next day NAV rose 3.34% to KRW 24,973, and the premium/discount returned to -0.17%. Whoever paid 2.72% over NAV on April 8 did not overpay for the assets; they bought that night’s US rally in advance.
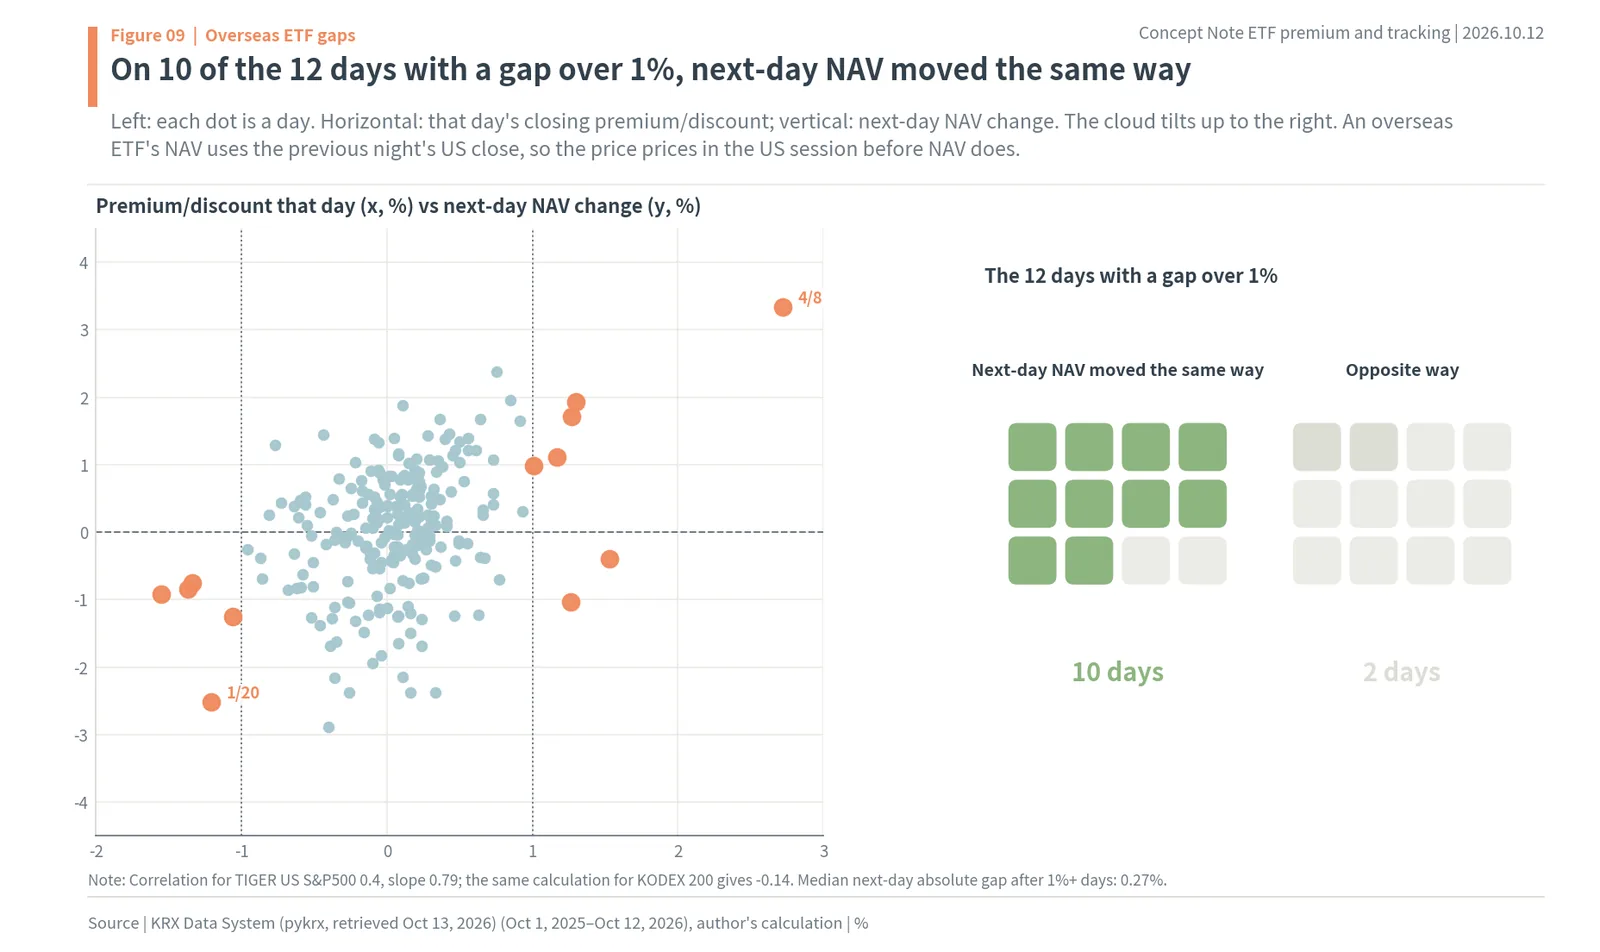
Over the whole year the result is the same. Figure 09 plots TIGER US S&P500’s 246 trading days as dots. The horizontal axis is the day’s premium/discount and the vertical axis is the next day’s NAV change. The cloud tilts up to the right. The correlation between the premium/discount and the next day’s NAV change is 0.40 and the slope is 0.79 (author’s calculation): on a day when the premium/discount was 1pp higher, the next day’s NAV rose 0.79% more on average. The same calculation for KODEX 200 gives a correlation of -0.14, so a domestic ETF’s premium/discount does not foretell the next day’s NAV.
Gather only the days with gaps over 1% and it is even clearer. TIGER US S&P500 was more than 1% away from NAV on 12 days in the year, and on 10 of them the next day’s NAV moved in the same direction as the gap (author’s calculation). After a -1.21% discount on January 20, the next day’s NAV fell 2.51%; after a +1.27% premium on June 15, NAV rose 1.71%. The median absolute premium/discount on the day after these 12 days was 0.27%. Within a day, most of the gap was closed from the NAV side.
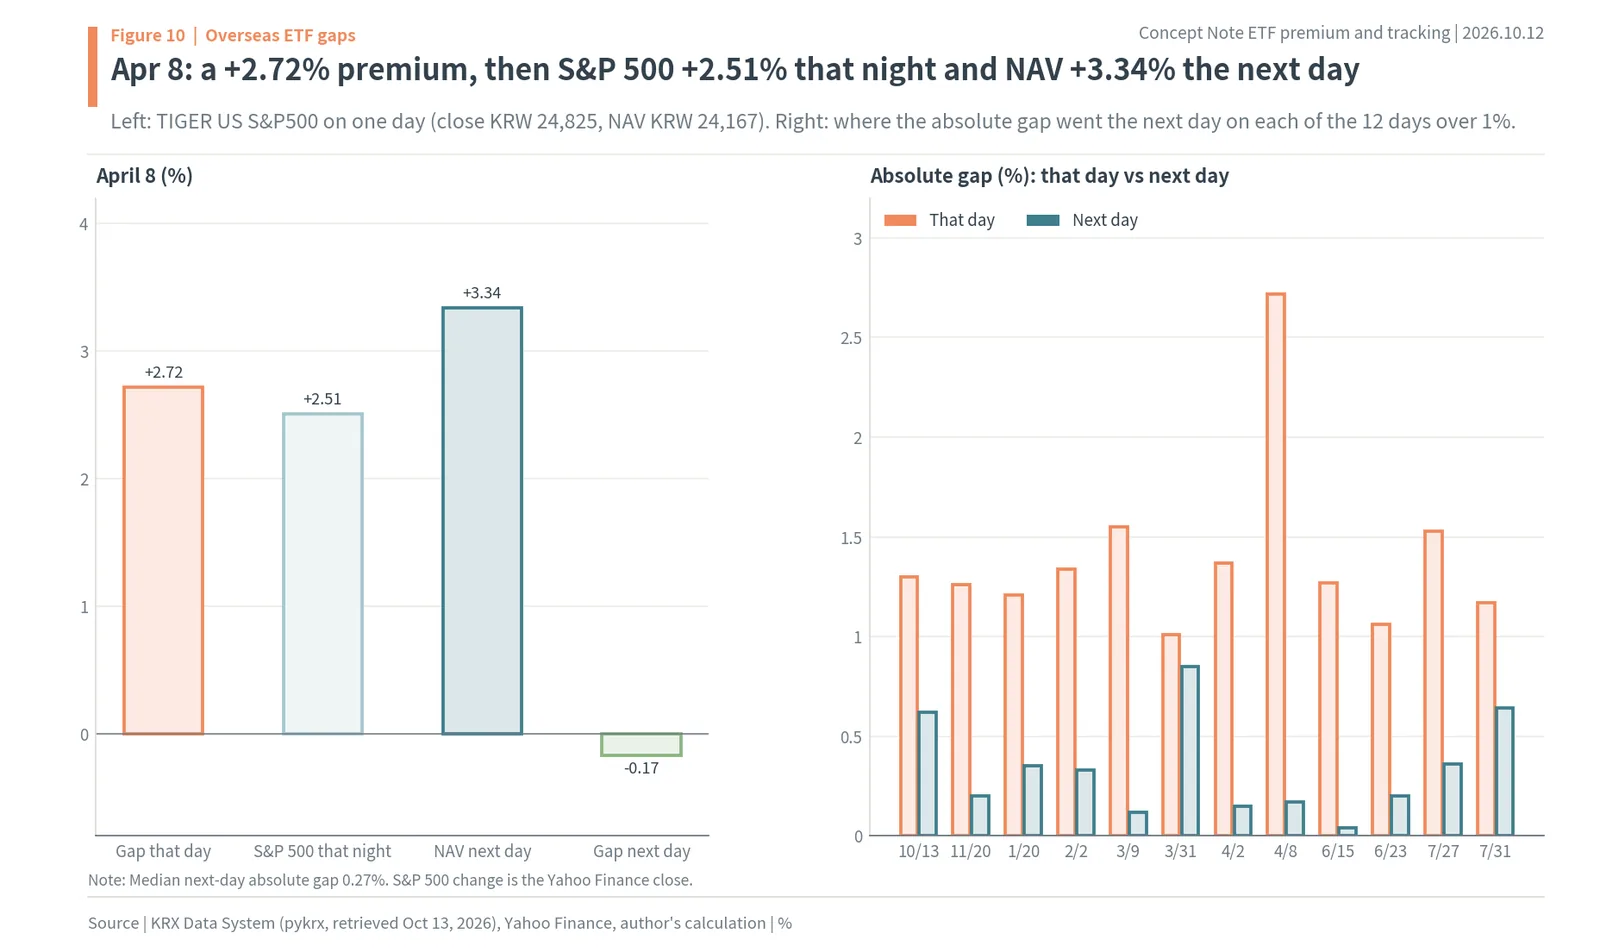
The left side of Figure 10 sets April 8 out in four numbers: a +2.72% premium, then the S&P 500 up 2.51% that night and NAV up 3.34% the next day. The right side shows where each of the 12 days over 1% went the next day. Gaps of 1% to 2.7% on the left mostly shrink to within 0.5% on the right. When you look at an overseas ETF’s premium/discount, the question is not “is it expensive now?” but “is there news that could move the overseas market tonight by this much?”
Because of this structure, the exchange also applies a wider threshold to overseas ETFs. When the closing premium/discount exceeds 1% for a domestic ETF or 2% for an overseas ETF, the issuer files an “ETF premium/discount exceeded” disclosure (Newsis). On June 16, 2026, KODEX US S&P500 Buffer June Active filed one for -2.68%, with a close of KRW 12,370 against an iNAV of KRW 12,711, and the filing gave the overseas close and futures hedging as the cause (KIND). The 2% overseas line is a number that writes into the rules the fact that many overseas ETF gaps come from the time difference.
China equity ETFs: frequent gaps because Chinese markets close after Korea’s
Even on quiet days, the list of ETFs more than 1% away was full of China equity ETFs. The five widest on October 12 were KODEX Korea-China Semiconductor (Synthetic) at -4.08%, RISE China AI Semiconductor TOP4Plus at -3.13%, SOL China Consumer Trend at -3.12%, 1Q Xiaomi Value Chain Active at -3.10% and KODEX China AI Semiconductor TOP10 at -3.08%. On September 15, TIGER China EV Leverage (Synthetic) at -4.50% and TIGER China EV SOLACTIVE at -3.20% topped the list.
Mainland China and Hong Kong keep trading after the Korean close at 15:30. At the Korean close, LPs quote while watching Chinese markets that are still open, and NAV is calculated from the Chinese close that comes afterwards. However much the Chinese market moves after the Korean close shows up as the premium/discount. So a large gap in a China ETF is not, as with US ETFs, the next day’s move, but the part of that same evening’s Chinese session the price could not yet reflect.
July 8 is an example. On that day, with KOSPI 200 down 5.48%, the widest gaps were TIGER China AI Software at +9.91%, TIGER China Hang Seng Tech Leverage (Synthetic H) at +9.79%, KODEX China Humanoid Robot at -7.05% and KODEX China H Leverage (H) at +6.75%, all China equity ETFs. That ETFs holding stocks from the same country closed at +9% on one side and -7% on the other on the same day means that for ETFs whose closing times are out of step, the closing premium/discount varies widely depending on the last prices each LP saw.
Leveraged and inverse ETF premium/discount: KODEX Leverage 0.39%, Inverse 2X 0.49%
A leveraged ETF follows twice the index’s daily return, and an inverse 2X ETF follows twice the opposite. If the index moves 10% in a day, these ETFs’ NAVs move 20%, and the risk LPs must hedge when quoting doubles too. So even on the same KOSPI 200, their premiums/discounts are wider. Over the past year the average absolute premium/discount was 0.15% for KODEX 200, 0.39% for KODEX Leverage and 0.49% for KODEX 200 Futures Inverse 2X (author’s calculation).
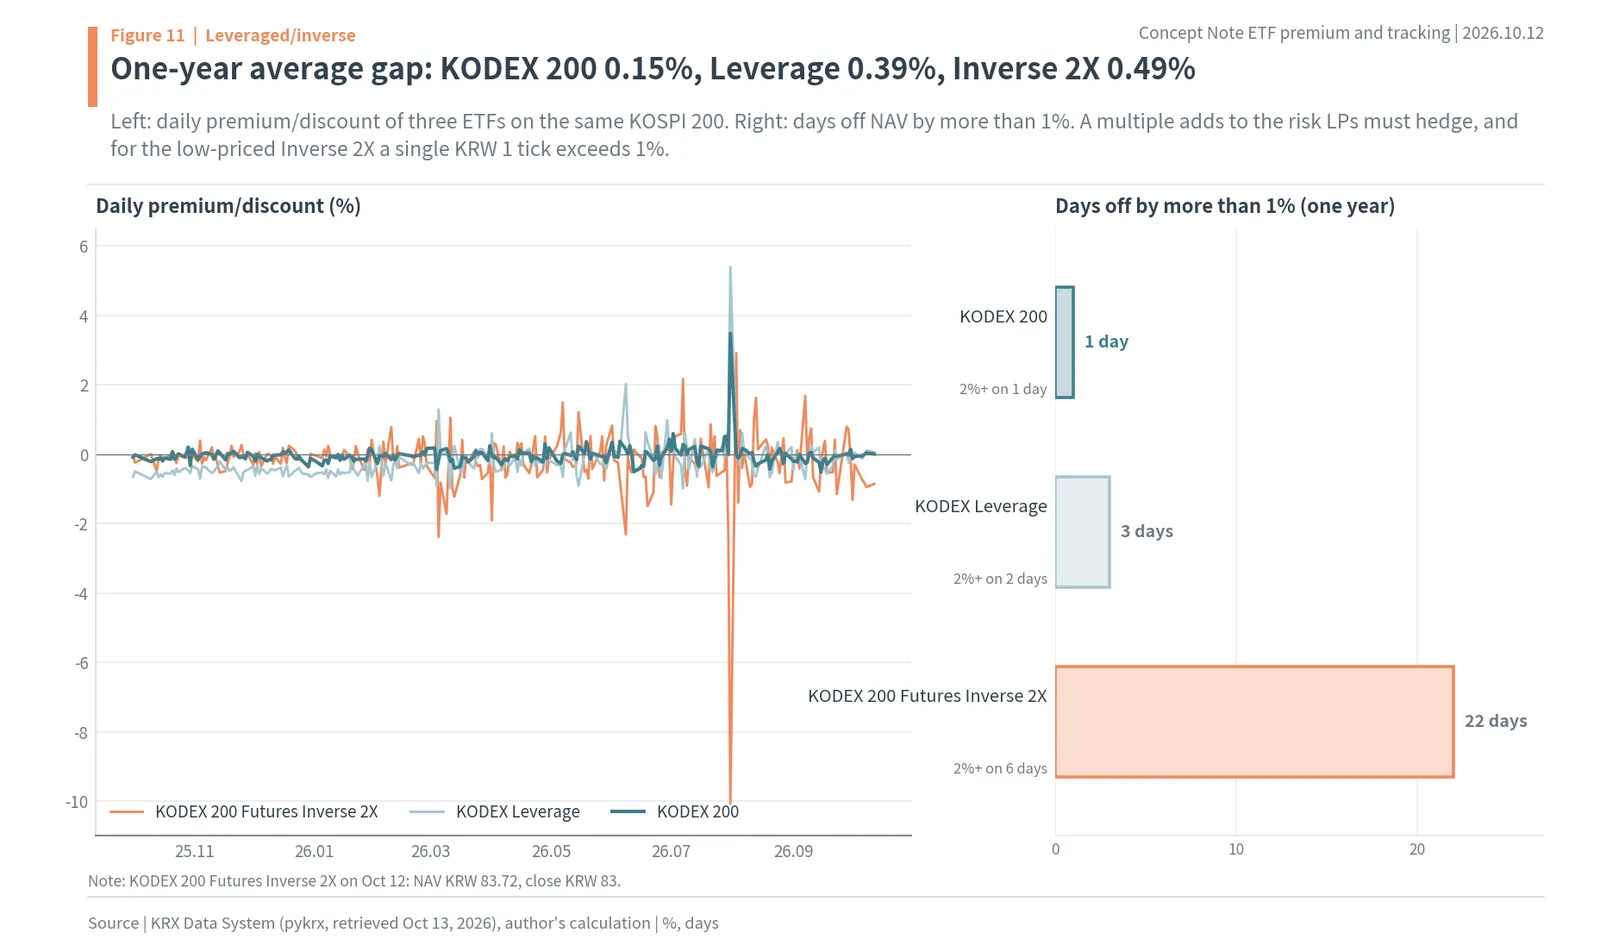
Figure 11 plots the three ETFs’ premium/discount for the year on one axis. Days more than 1% away numbered 1 for KODEX 200, 3 for KODEX Leverage and 22 for KODEX 200 Futures Inverse 2X. Days more than 2% away were 1, 2 and 6. For all three, the widest day was July 31, when KOSPI 200 rose 19.98%. KODEX Leverage was at +5.39% and KODEX 200 Futures Inverse 2X at -10.07%. When the index rises 20% in a day, an inverse 2X NAV has to fall almost 40%, and its price fell even further, closing 10% below NAV.
The price unit also helps explain why the inverse 2X gap is so wide. While KOSPI 200 more than doubled over the year, KODEX 200 Futures Inverse 2X fell so far that on October 12 its NAV was KRW 83.72 and its close KRW 83. A single KRW 1 tick is more than 1%, so however tightly LPs quote, a gap of around 1% remains. On October 12 this ETF’s premium/discount was -0.86%. For leveraged and inverse ETFs whose prices have fallen this low, one tick is the premium/discount.
SK hynix single-stock leveraged ETFs: gaps over 1% on 23 of 92 trading days
On May 27, 2026, 18 single-stock leveraged and inverse products (16 ETFs and 2 ETNs) that follow twice the daily return of Samsung Electronics or SK hynix were listed on the KOSPI (Herald Economy). Following one stock rather than an index at twice the daily move makes daily swings larger, and the only hedging tool LPs have is that one stock. In the 92 trading days from listing to October 12, ACE SK hynix Single-Stock Leverage was more than 1% away from NAV on 23 days and KODEX SK hynix Single-Stock Leverage on 17 (author’s calculation).
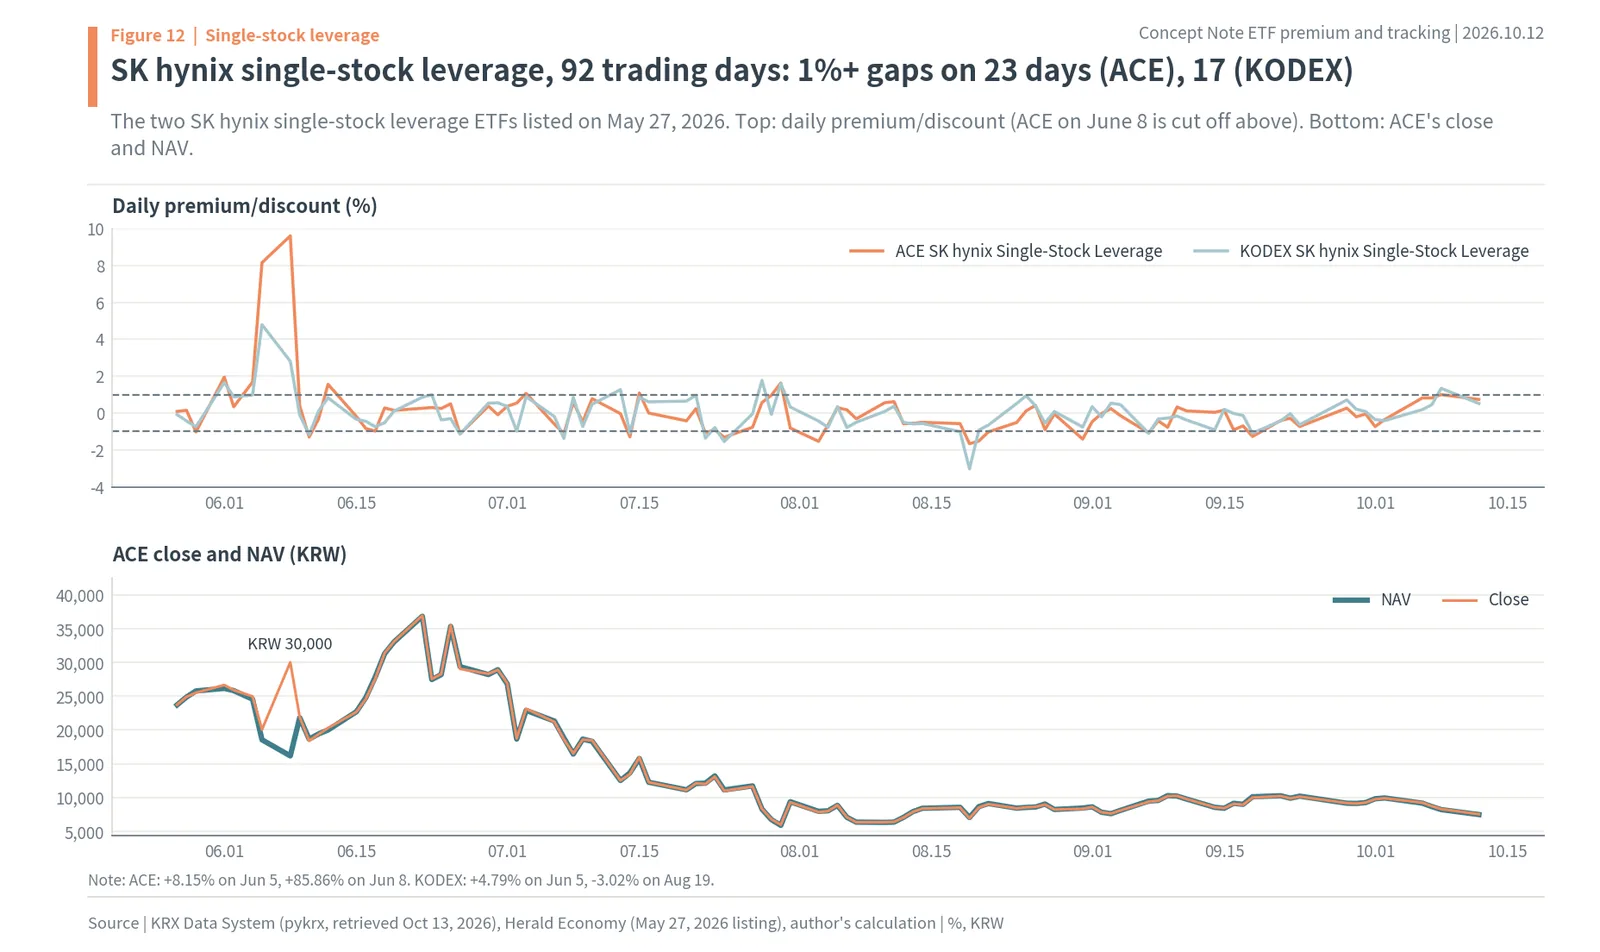
The top of Figure 12 is the two ETFs’ daily premium/discount, and the bottom is ACE SK hynix Single-Stock Leverage’s close and NAV. The two lines mostly stick together, then split sharply on June 5 and June 8. ACE was at +8.15% on June 5 and +85.86% on June 8. KODEX SK hynix Single-Stock Leverage was also at its widest since listing at +4.79% on June 5, and at -3.02% on August 19. ACE’s median absolute premium/discount over the 92 trading days was 0.56%.
ACE SK hynix Single-Stock Leverage on June 8: an 85.86% premium in the closing auction
What happened to ACE SK hynix Single-Stock Leverage on June 8 shows exactly how a premium turns into a loss. That day SK hynix fell 7.68%, and the ETF’s NAV, which follows twice that move, fell 12.89% from KRW 18,529 to KRW 16,141. Its price, however, rose 49.7% from KRW 20,040 to close at KRW 30,000 (about $22.34). Large market buy orders piled into the closing auction, a volatility interruption was triggered, and at that hour LPs had no duty to quote (Newsis).
LPs are exempt from quoting in the pre-open auction (08:30 to 09:00), the first five minutes after the open (09:00 to 09:05) and the closing auction (15:20 to 15:30) (Newsis). On a daily timetable, LPs must hold quotes from 09:05 to 15:20, leaving 35 minutes before and 10 minutes after uncovered. In the 10-minute closing auction, orders are collected and filled at a single price at 15:30; if LPs do not post enough sell quotes, piled-up buy orders eat through the thin remaining sell quotes one level after another. At that hour there may be nobody willing to sell near NAV. Market buy orders climb to the most expensive remaining sell quote and fill there, and that price becomes the day’s close. A premium of 85.86% means paying 1.86 times NAV.
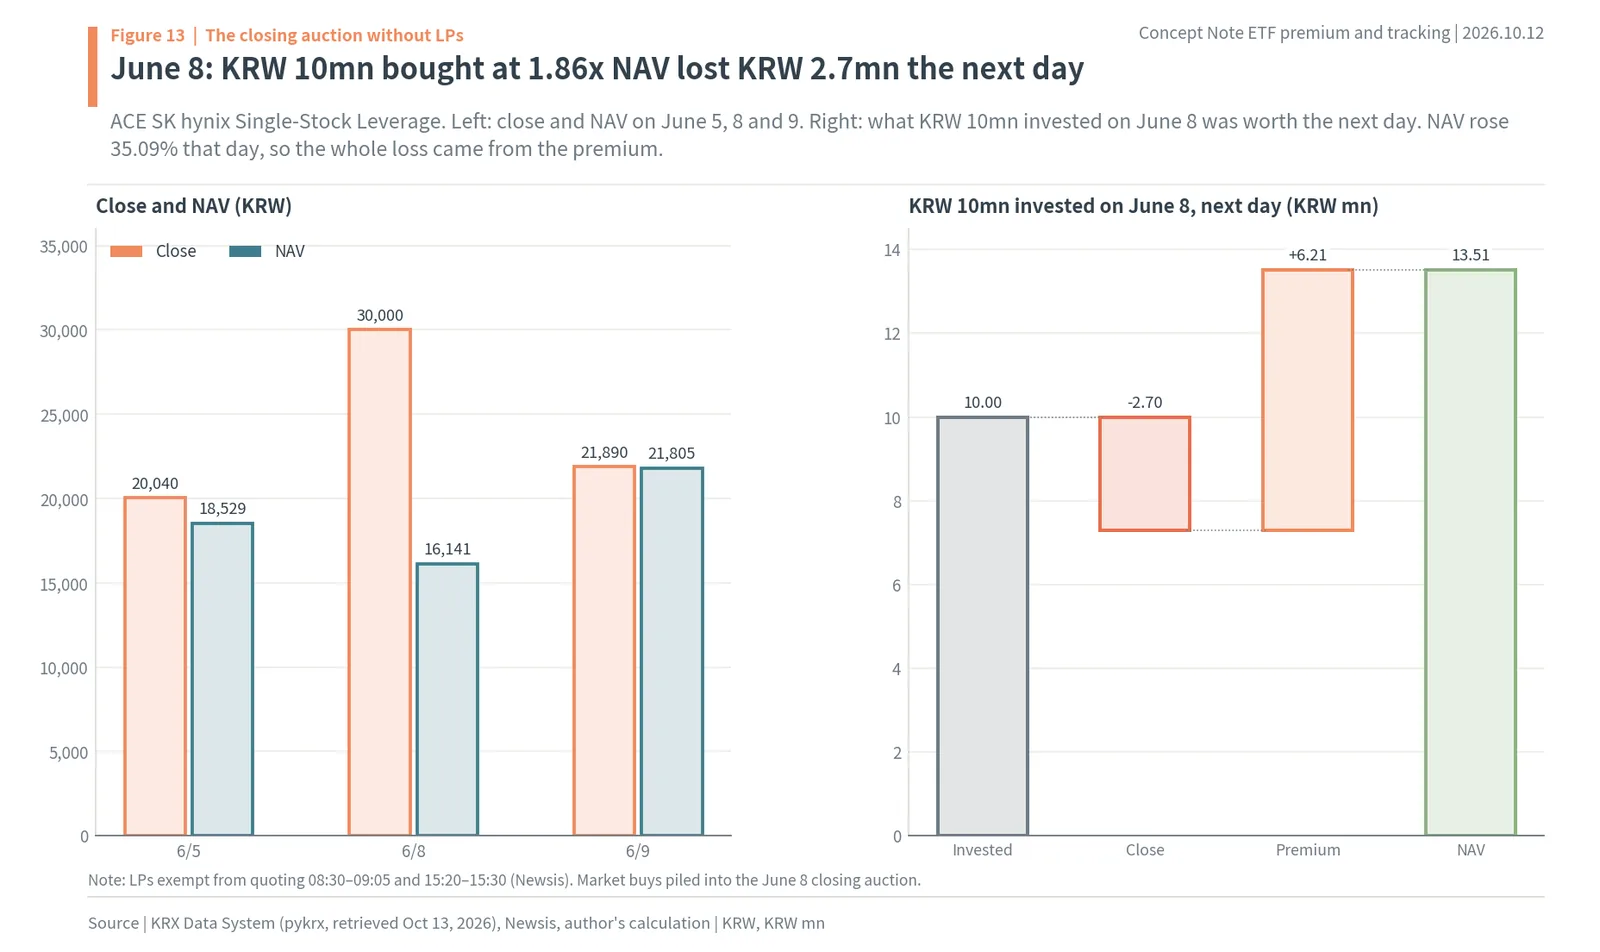
The next day, June 9, the price came down to KRW 21,890 against a NAV of KRW 21,805, and the premium/discount returned to 0.39%. Someone who bought KRW 10mn (about $7,446) at the June 8 close of KRW 30,000 lost 27.03%, or KRW 2.7mn (about $2,010), in a day (author’s calculation). Bought at 1.86 times NAV, the KRW 10mn lost KRW 2.7mn the next day. NAV rose 35.09% from KRW 16,141 to KRW 21,805 the same day, so buying at NAV would have made KRW 3.51mn. The underlying asset rose, but the investor lost. The KRW 6.21mn difference (about $4,624) came entirely from the premium. Figure 13 lays that day out as two KRW 10mn paths, one at the price and one at NAV.
The June 8 premium vanished the next day, leaving a 27.03% loss
The 85.86% premium on June 8 did not last. The next day, June 9, ACE SK hynix Single-Stock Leverage’s premium/discount was 0.39%, and on June 10 it was back in its usual range at -1.30%. Once LPs started quoting again during regular hours, the price was pulled straight back to NAV. That the gap vanished in a day means the June 8 close was a price made by 10 minutes of orders, not by the value of the underlying asset.
There was a warning two days earlier, on June 5. That day the premium was +8.15%, with a close of KRW 20,040 against a NAV of KRW 18,529, and KODEX SK hynix Single-Stock Leverage was also at its most expensive since listing at +4.79%. Buy orders for the double-tracking products were already overrunning LP quotes, and three days later the closing auction delivered the extreme: 85.86%. When a single-stock leveraged ETF starts trading several percent away from NAV each day, it is a sign that orders are piling into it.
2020 KODEX WTI crude oil ETF: closing premium of 20.09%
The case where a premium lasted for days is the oil ETF of spring 2020. As oil prices collapsed in March and April 2020, retail investors betting on a rebound piled into KODEX WTI Crude Oil Futures (H). NAV fell 79.28% from KRW 15,454 on March 2 to KRW 3,202 on April 29, yet the price traded above NAV. Of the 83 trading days from March 2 to June 30, the closing premium was above 5% on 12, and at its peak on April 22 the ETF closed at KRW 3,960 against a NAV of KRW 3,298, a premium of 20.09% (KRX, author’s calculation).
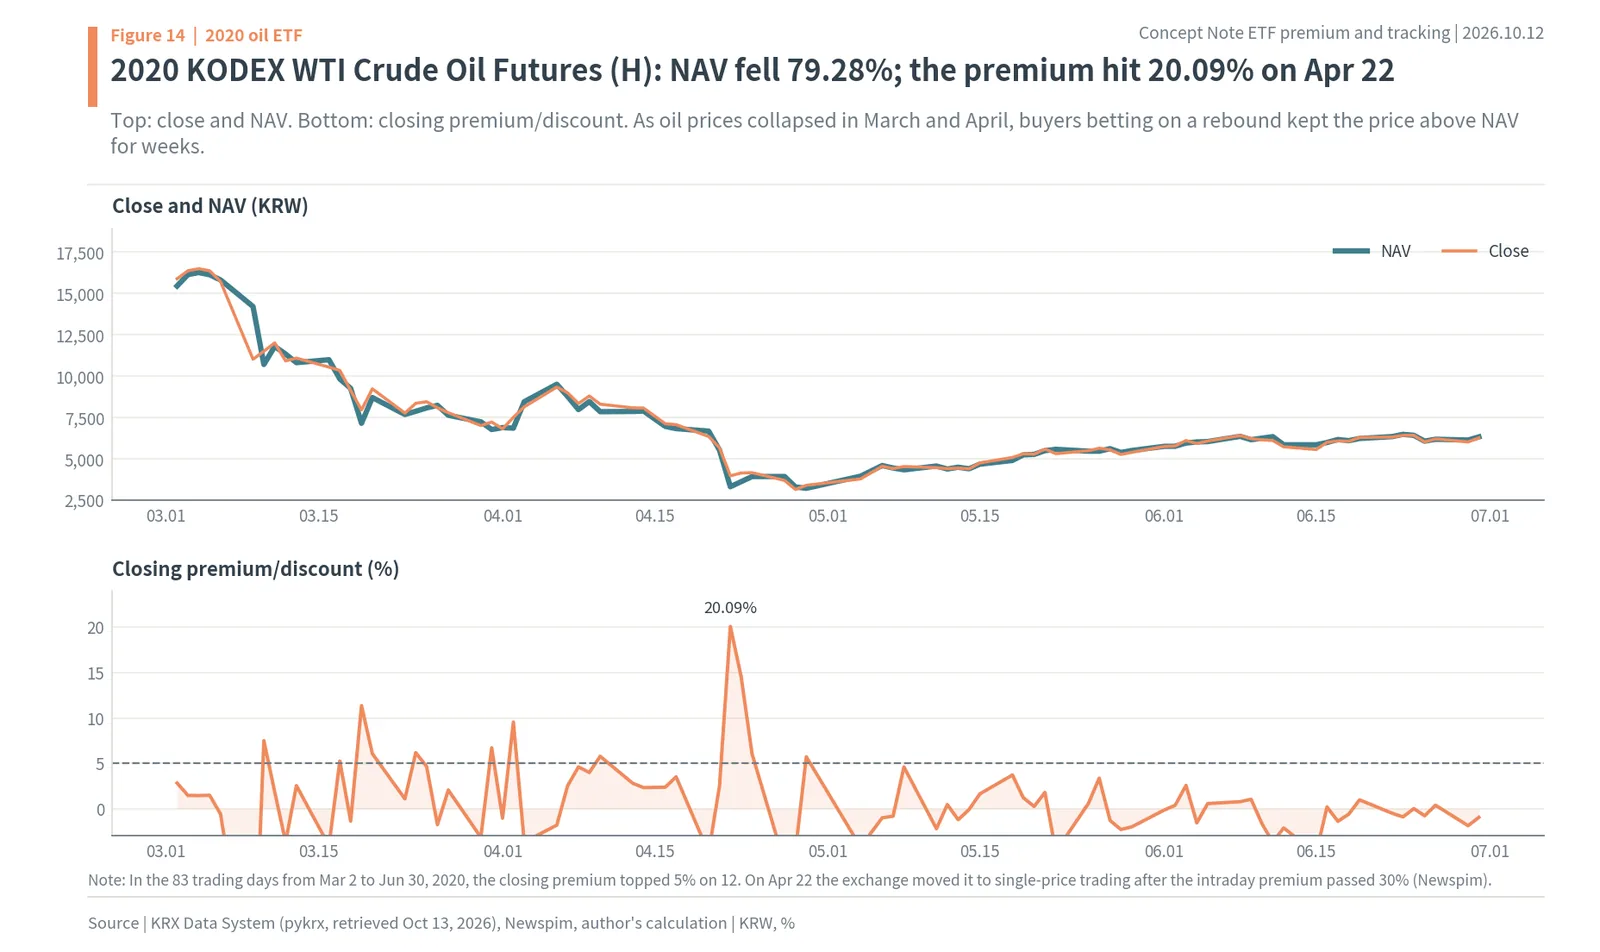
On April 22 the exchange moved the ETF to single-price trading after its intraday premium passed 30%, and the same day the premium on leveraged oil ETNs reached as much as 1,044%, according to the Financial Supervisory Service (Newspim). Oil futures trade during Korean hours too, but when supply on the underlying side is blocked and only buy orders pile in, demand outruns what LPs can quote. On May 17 that year the government announced “measures to stabilize the ETF and ETN market,” requiring a KRW 10mn deposit and one hour of prior training to buy leveraged ETFs and ETNs (Dailian).
Korean ETF premium/discount rules: disclosure at 1%/2%, LP standard at 2%/5% from August 19, 2026
The premium/discount has two layers of thresholds. The first is the disclosure line. When the closing premium/discount exceeds 1% for a domestic ETF or 2% for an overseas ETF, an “ETF premium/discount exceeded” disclosure is filed (Newsis). By early June 2026 there were 2,889 such filings, 32.0% more than the 2,189 in the same period a year earlier and 2.7 times the 1,077 two years earlier. The second is the LP management standard. The closing premium/discount LPs must keep within was 3% for domestic and 6% for overseas ETFs, narrowed to 2% and 5% from August 19, 2026 (Toyo Economy, MTN).
If the closing premium/discount exceeds twice the LP management standard, the ETF goes through a designation warning and is then designated for investor caution, which moves it to single-price trading. On July 16, 2026, the Financial Services Commission cut that process from three steps to two, raised the basic deposit for single-stock leveraged products from KRW 10mn to KRW 30mn (about $22,338; effective July 31), and suspended new listings of single-stock products (MTN). Premium/discount violations in January to August 2026 numbered 219, 2.5 times the 86 for all of 2025 (Toyo Economy).
Delisting is judged by tracking, not by the premium/discount. If the correlation between the daily change in NAV and the daily change in the underlying index stays below 0.9 for three months, the ETF is delisted. For active ETFs the threshold is a correlation of 0.7 with the benchmark. Net assets that fall below KRW 5bn, triggering an administrative designation that is still not cured by the end of the next half year, or a gap of more than one month in LP contracts, are also grounds for delisting (Samsung Asset Management). The premium/discount is a trading problem; tracking is a management problem. Next, the management problem: tracking error.
ETF premium/discount violations: 581 cases, about 38% leveraged/inverse
The violation record shows which products widen again and again. From 2021 to August 2026 there were 581 premium/discount violations across 306 products, about 38% of them leveraged/inverse (Toyo Economy). The most frequent violator was TIGER US Philadelphia Semiconductor Leverage (Synthetic) with 21, followed by TIGER Copper Physical with 15. When overseas underlying assets, a 2x multiple and a synthetic structure that earns returns through swaps overlap in one product, LPs have the fewest tools to hedge with.
This record draws the same picture as the big-day cross-sections in this report. The five widest ETFs on July 7 included TIGER US Philadelphia Semiconductor Leverage (Synthetic) at -5.11%, and on March 4 TIGER Emerging Markets MSCI Leverage (Synthetic H) at -8.00%. Products on the repeat-violation list reappear by name on every big day.
Leveraged ETF compounding: KODEX Leverage +204.02% vs 2x the index’s 219.27%
When looking at how a leveraged ETF tracks, do not miss that its benchmark is twice the daily return. Over the past year KOSPI 200 rose 109.63%, from 479.37 to 1,004.92. Twice the period return would be 219.27%, but KODEX Leverage’s NAV rose 204.02%, from KRW 30,778 to KRW 93,572 (author’s calculation). The gap of more than 15pp is not bad management but the result of compounding twice the move day after day. When the index swings widely, chaining together daily doubles gives less than double the period return.
For inverse 2X the gap is much larger. Twice the opposite of the period return would be -219.27%, but an ETF’s value cannot go below zero. KODEX 200 Futures Inverse 2X’s NAV fell 92.0% over the same year, from KRW 1,046.57 to KRW 83.72. Once its price dropped below KRW 100, as shown earlier, a single KRW 1 tick became more than 1% of the price. When reading the one-year scorecard of a leveraged or inverse ETF, compare it not with twice the index’s period return but with the daily double index over the same period.
Overseas holidays: the oil ETF’s 5.77% premium on Good Friday 2020
The 2020 oil case also includes a day that coincided with an overseas holiday. April 10, 2020 was Good Friday, a US market holiday. The underlying oil futures could not be traded, so LPs could not hedge, and KODEX WTI Crude Oil Futures (H) closed at KRW 8,295 against a NAV of KRW 7,842, a premium of 5.77% (KRX). The day before, April 9, it was 3.99%, and on the next trading day, April 13, it was 2.80%.
When an overseas holiday falls on a Korean trading day, an overseas ETF’s route to trade its underlying assets is closed entirely. Mirae Asset’s TIGER ETF investor notice also states that the gap can widen when business days or trading hours on the Korean and overseas exchanges do not match. When choosing a day to trade an overseas ETF, check the holiday calendar of the underlying market, not just Korea’s.
Following the oil ETF’s path shows how a premium builds over days. On March 2 the ETF closed at KRW 15,890 against a NAV of KRW 15,454, already 2.82% expensive. The premium widened and narrowed repeatedly, to 7.49% on March 10, 11.36% on March 19 and 9.55% on April 2, then came down from 20.09% on April 22 to 14.52% on April 23 and 6.04% on April 24. Meanwhile NAV fell 79.28% to KRW 3,202 by April 29 (KRX, author’s calculation).
The premium over this period was not a time lag that closes in a day. While the price of the underlying oil futures collapsed, rebound buying kept coming, and the price spent weeks above NAV. Those who bought in this period lost the 79.28% fall in NAV and then lost again as the premium shrank. When a premium persists in one direction for days, it is not a time lag but a surcharge created by demand.
Single-stock leverage after the KRW 30mn deposit and the 2% LP standard: fewer gaps over 1%
On July 31, 2026, the basic deposit for single-stock leveraged products rose to KRW 30mn, and on August 19 the LP management standard narrowed to 2% for domestic ETFs. Split the post-listing period into three at those two dates and the change in the premium/discount is visible. ACE SK hynix Single-Stock Leverage was more than 1% away on 15 of the 45 trading days from listing to July 30, on 1 of the 12 trading days from July 31 to August 18, and on 7 of the 35 trading days from August 19 to October 12 (author’s calculation).
KODEX SK hynix Single-Stock Leverage went the same way. Its days more than 1% away fell from 12 in the first 45 trading days to 1 in the next 12 and 4 in the last 35, and its median absolute premium/discount came down from 0.78% to 0.50% and 0.42%. ACE’s median also went from 0.58% to 0.56% and 0.47%. A higher entry bar reduced the rush of retail orders, and a tighter standard for LPs pulled the price closer to NAV.
This change shows that the premium/discount depends not only on product structure but also on who orders and how. With the same ETF and the same LP, the gap widens on days when market orders pile into one time slot and narrows on days when orders are spread out. The way investors can reduce the premium/discount lies in the same place: avoid the closing auction and use limit orders.
Tracking error vs tracking difference: daily wobble vs the gap over the whole period
If the premium/discount is the distance between price and NAV, tracking error is the distance between NAV and the underlying index. There are two numbers for it. The tracking error rate is how much the daily difference between NAV return and index return wobbled over a period, that is, the standard deviation of that difference. Korean ETFs usually measure it over the most recent year (Samsung Asset Management). Tracking difference is how many percentage points NAV earned more or less than the index over the whole period. What shows up on an investor’s one-year scorecard is the tracking difference.
The two numbers move separately. In a hypothetical example, suppose the index rose 1.59% over 10 days, ETF A earned exactly 0.05pp less than the index every day, and ETF B swung ±0.2 to 0.3pp each day but ended where the index did. ETF A’s tracking error is 0.00%, which looks perfect, but its tracking difference is -0.51pp. ETF B’s tracking error is 0.28%, which looks large, but its tracking difference is only -0.01pp. A small wobble does not mean a small loss.
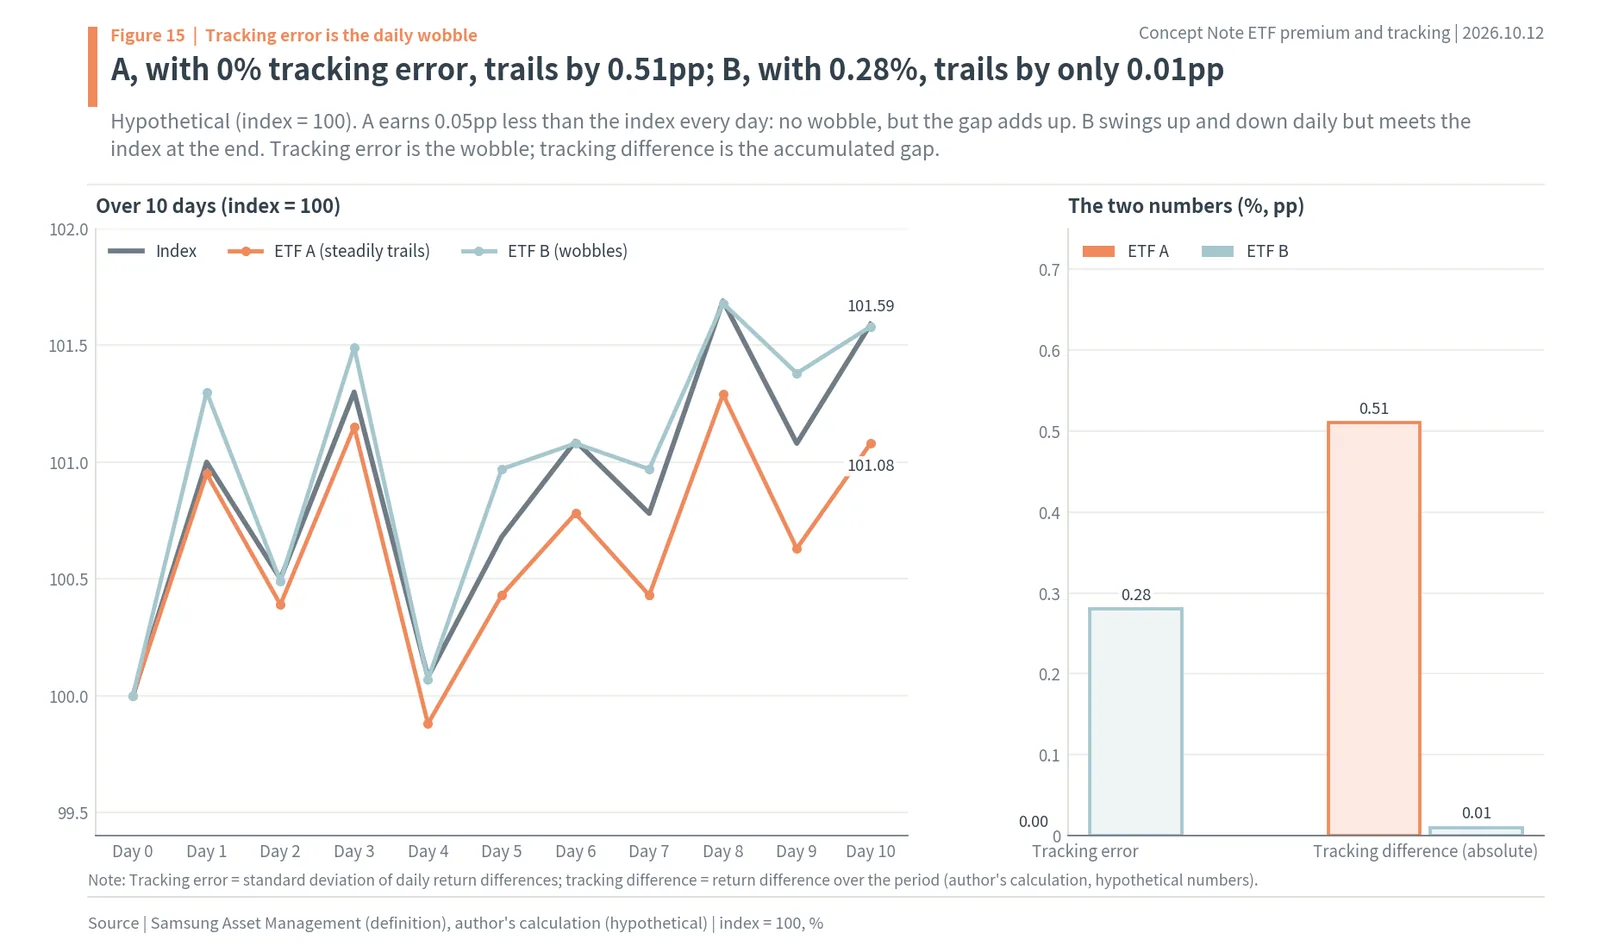
Figure 15 draws this hypothetical example with the index at 100. A, with 0% tracking error, trails by 0.51pp; B, with 0.28%, trails by only 0.01pp. ETF A’s line follows just under the index at a steady distance that slowly widens, while ETF B’s line crosses the index line up and down and meets it at the end. In real ETFs, the steady gap like A’s comes from fees, dividend tax and trading costs. The wobble like B’s comes from the difference between the day a dividend arrives and the day it is reflected in the index, trading on index rebalancing days, and the time lag and exchange rate of overseas ETFs (Samsung Asset Management, Shinhan Asset Management).
S&P 500 ETF tracking difference: -5.36pp, of which -4.99pp was the won-dollar rate
Over the past year (October 1, 2025 to October 12, 2026), the S&P 500 rose 16.33% in dollars (underlying index value on KRX). Over the same period, TIGER US S&P500’s NAV rose 10.97%. KRW 10mn invested should have become KRW 11.63mn had it matched the index, but it became KRW 11.10mn. The tracking difference is -5.36pp. This ETF’s KRX tracking error rate is a tiny 0.09%. It tracked without wobbling and still earned more than 5pp less.
Most of the difference is the exchange rate. Over this period the won-dollar rate fell 4.29%, from KRW 1,403.15 to KRW 1,342.99 per dollar (Yahoo Finance). An unhedged ETF converts its dollar assets into won to calculate NAV, so even if it earns 16.33% in dollars, the won return is cut by that much. Multiplying the dollar index return by the change in the exchange rate gives an FX share of -4.99pp. The remaining -0.38pp is a mix of fees, US dividend tax, distributions and timing (author’s calculation).
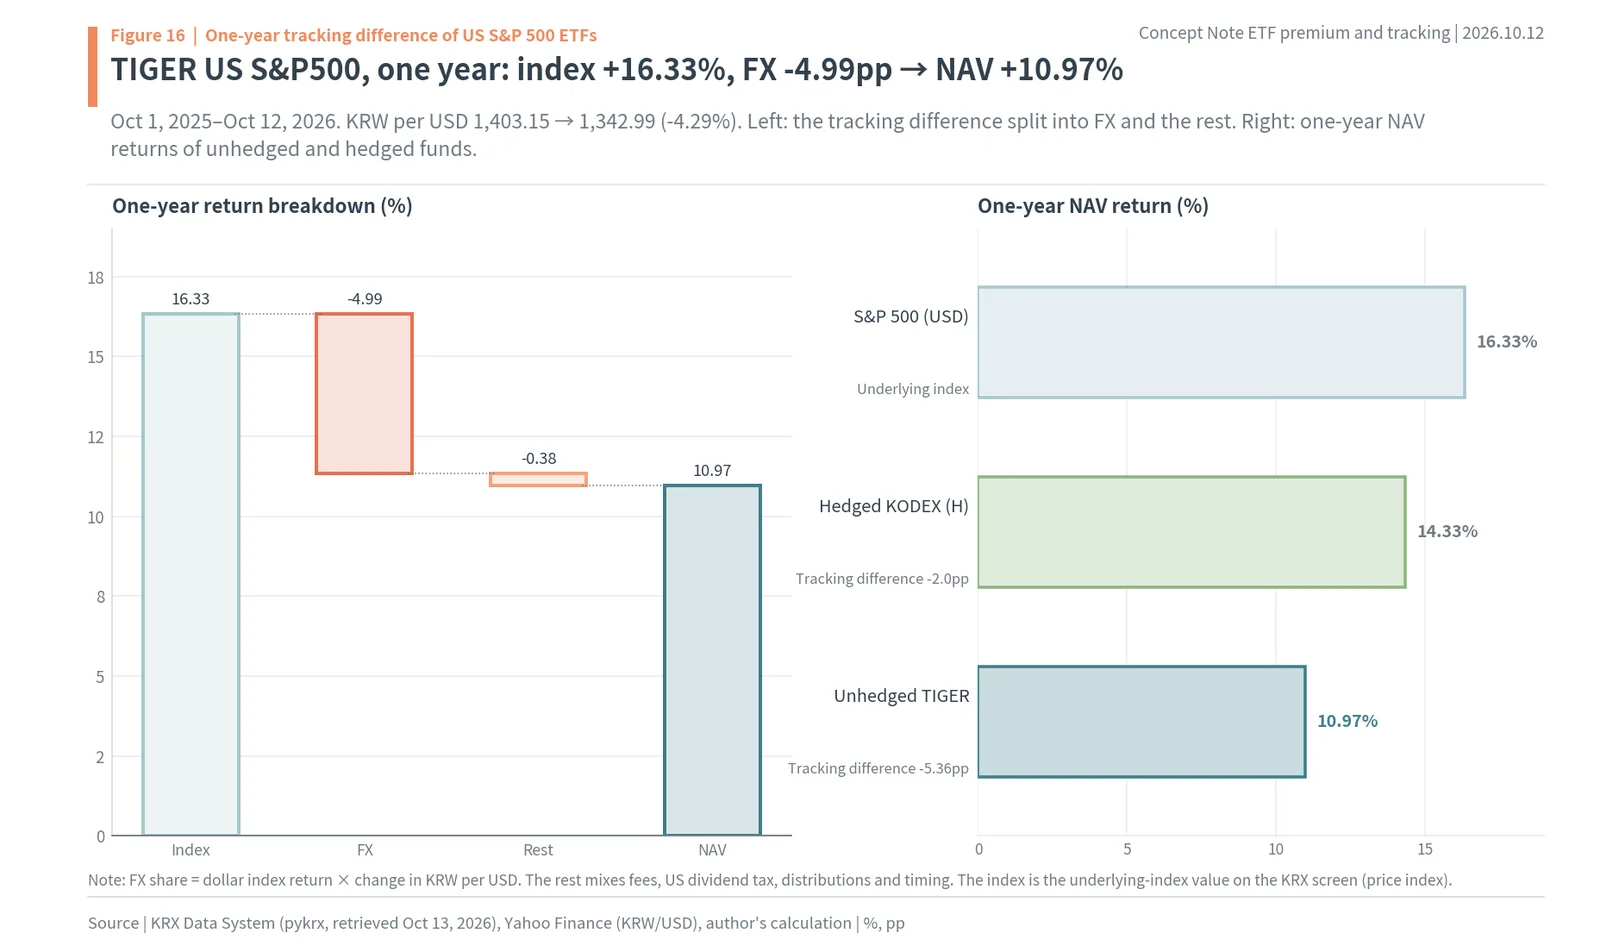
The left side of Figure 16 draws this breakdown as a waterfall: TIGER US S&P500 over one year, index +16.33%, FX -4.99pp, the rest -0.38pp, NAV +10.97%. The right side compares it with the hedged version. The NAV of currency-hedged KODEX US S&P500 (H) rose 14.33% over the same period, a tracking difference of -2.00pp. It avoided the fall in the dollar, but its figure includes the cost of hedging and fees. Hedging reduces currency risk but does not remove it entirely (Mirae Asset Management).
Had the won-dollar rate instead risen 4.29% over the same year, the math would run the other way. A dollar index return of +16.33% compounded with a +4.29% exchange rate gives a won return of +21.32%, a year in which the unhedged version earns nearly 5pp more than the index (author’s calculation). Hedging is not a choice that raises returns but a choice of whether to keep the exchange rate as your own exposure. That is why the one-year gap between hedged and unhedged S&P 500 ETFs changes direction from year to year.
The year this report examined was one in which the won strengthened, and so the unhedged version earned more than 5pp less than the index. When choosing among ETFs that follow the same index, the choice that makes the biggest difference is not the issuer but whether to hedge the currency.
Korean S&P 500 ETFs compared: TIGER, ACE, RISE, SOL and KODEX one-year NAV returns and costs
The one-year NAV returns of five unhedged ETFs following the same S&P 500 were 11.00% for ACE, 10.99% for RISE, 10.97% for TIGER, 10.83% for SOL and 9.84% for KODEX. The gap between the highest, ACE, and the lowest, KODEX, is 1.16pp, and without KODEX the four differ by 0.17pp (author’s calculation). KODEX US S&P500’s underlying index is a total return index that reinvests dividends, but the underlying index value on the KRX screen is the same price index value as the other four (6,711.20 on October 1), so all five are compared on the same yardstick.
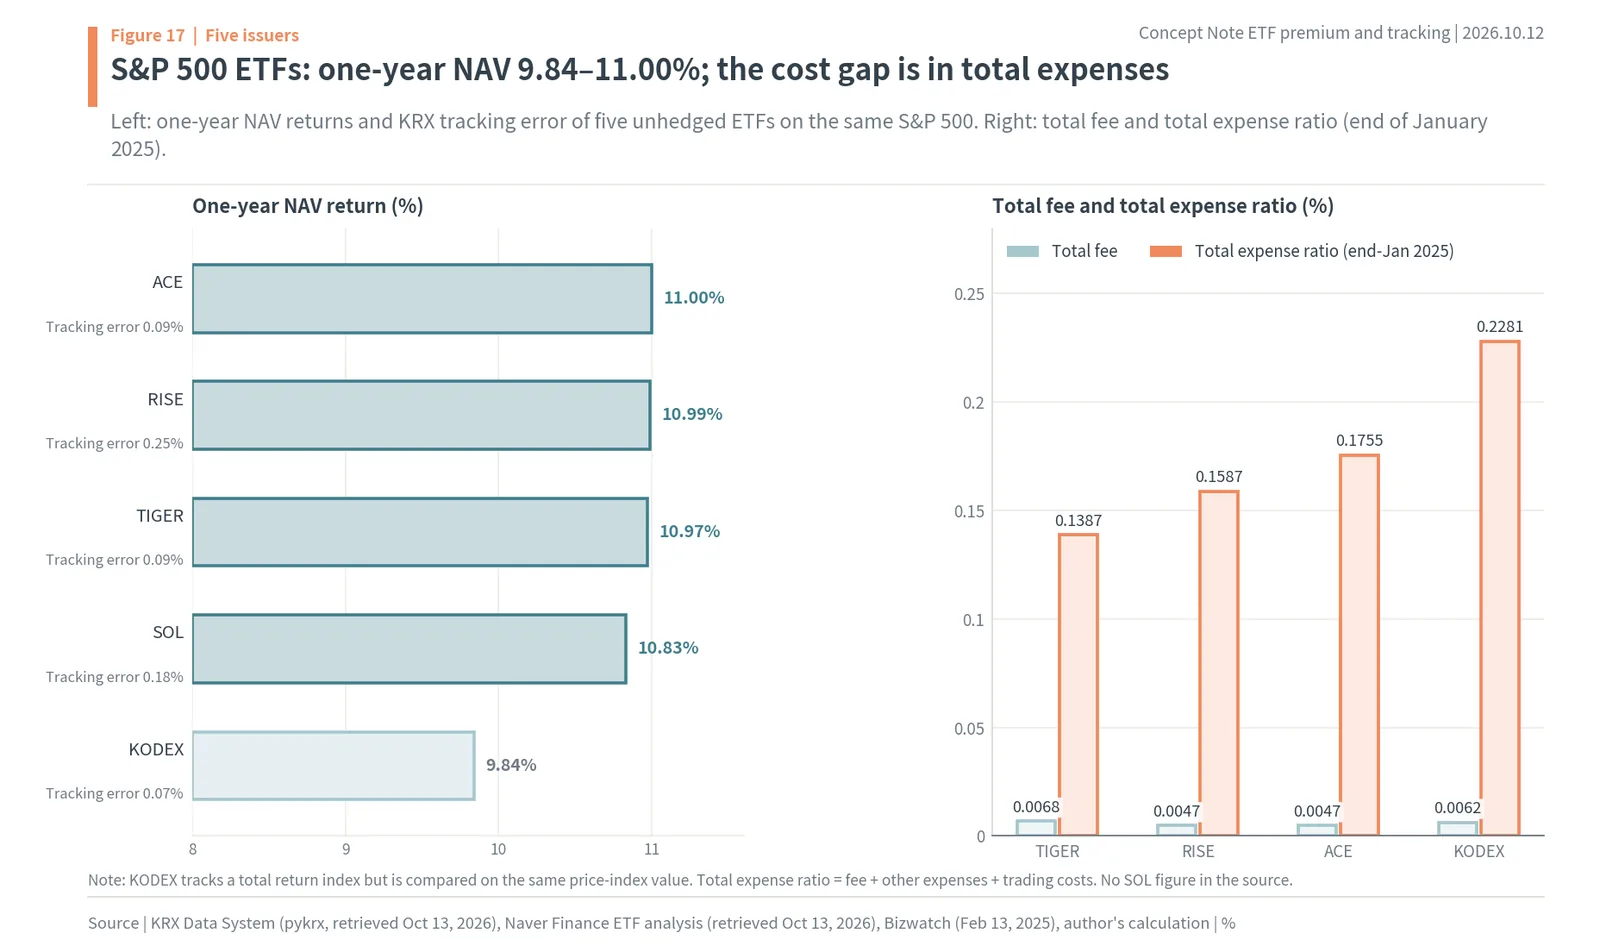
Total fees all fell below 0.01% in the 2025 fee-cutting race. TIGER cut from 0.07% to 0.0068% on February 6, 2025, KODEX from 0.0099% to 0.0062% on February 7, RISE from 0.01% to 0.0047% on February 11, and ACE from 0.07% to 0.0047% on July 17 (Bizwatch, Dailian). On Naver Finance, SOL US S&P500’s fee is 0.0047% and the hedged KODEX US S&P500 (H) is 0.0099%.
Yet what investors actually pay is more than the total fee. The total expense ratio adds other expenses and trading and brokerage costs to the total fee, and it is published in the “fund fee and expense comparison” on KOFIA’s disclosure site (KB Asset Management). At the end of January 2025, total expense ratios were 0.1387% for TIGER, 0.1587% for RISE, 0.1755% for ACE and 0.2281% for KODEX (Bizwatch). That is twenty times TIGER’s 0.0068% fee. Across these S&P 500 ETFs, one-year NAV returns ran from 9.84% to 11.00%, and the cost gap that matters is in total expenses. Choosing an ETF on a 0.002pp difference in fees means looking at only a small slice of the real cost.
ETF fees vs tracking error: correlation 0.48, but not among KOSPI 200 ETFs
Across the top 200 ETFs by market cap, those with higher total fees also have higher tracking error rates. The correlation between the two is 0.48 (author’s calculation). The median total fee by group was 0.05% for bonds/other, 0.27% for overseas equity/commodity, 0.30% for domestic equity and 0.49% for leveraged/inverse, and the median tracking error rates were 0.21%, 0.60%, 1.09% and 8.79%. The more complex a product is to run, the more it charges and the more it wobbles against its index.
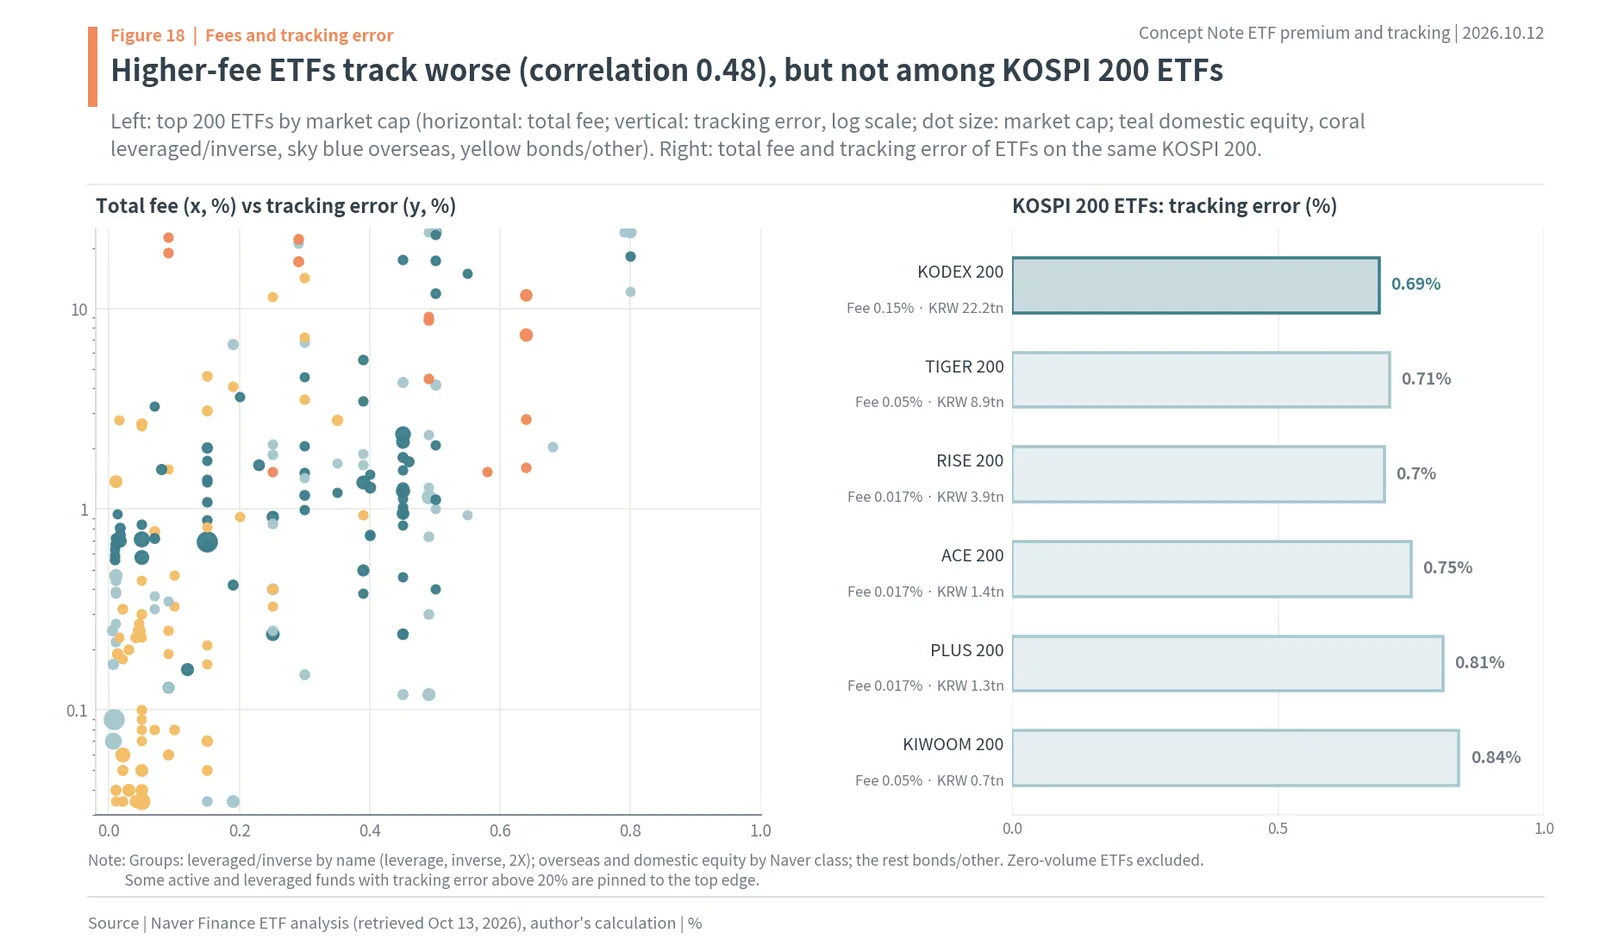
Among ETFs following the same KOSPI 200, the story changes. KODEX 200’s total fee is 0.15%, TIGER 200 and KIWOOM 200 charge 0.05%, and RISE 200, ACE 200 and PLUS 200 charge 0.017%. Yet tracking error rates are 0.69% for KODEX 200, 0.70% for RISE 200, 0.71% for TIGER 200, 0.75% for ACE 200, 0.81% for PLUS 200 and 0.84% for KIWOOM 200, almost unrelated to the fee ranking (Naver Finance). KODEX 200, the most expensive, wobbled the least. Within the same index, what decides tracking is not the fee but size and management. KODEX 200’s market cap is KRW 22.2tn; PLUS 200’s is KRW 1.3tn.
US dividend tax of 15% and distributions in Korean S&P 500 ETFs
The remaining -0.38pp after FX has a structure too. S&P 500 companies pay dividends, and US equity ETFs listed in Korea receive them and pass them on as distributions. Since January 1, 2025, issuers pay 15% US dividend tax first and distribute only the rest (Economist Korea). Compared with an index that reinvests dividends, that 15% accumulates as tracking difference every year. Even in accounts with a low tax rate, such as pension accounts, the 15% comes out first at the fund level.
Distributions themselves also make NAV returns look lower. NAV drops by the amount distributed on the payment date, so a NAV return that does not add back distributions looks lower than the index by that amount. Even among S&P 500 ETFs, differences in distribution frequency and method create differences in NAV returns. When comparing one-year tracking difference, compare funds with the same distribution method, or compare total returns that add the distributions back.
KRX tracking error rates also differ slightly by issuer. As of October 12, the one-year tracking error rate was 0.07% for KODEX US S&P500, 0.09% for TIGER and ACE, 0.18% for SOL, 0.22% for KODEX US S&P500 (H) and 0.25% for RISE. All are below 0.3%, so the daily wobble is very small. The five issuers track almost identically day to day; what split the one-year scorecard was the exchange rate and hedging, plus distributions and total expenses.
Premium/discount vs tracking error: KODEX 200 and TIGER US S&P500 point opposite ways
The premium/discount and the tracking error rate have similar names and are easily read as one number, but they often point in opposite directions. KODEX 200’s one-year average absolute premium/discount is 0.15%, half TIGER US S&P500’s (0.33%). Yet the tracking error rate is the other way round: 0.69% for KODEX 200 and 0.09% for TIGER US S&P500. An ETF that is good to trade is not necessarily one that tracks its index well.
The split arises because the two numbers come from different places. KODEX 200’s premium/discount is narrow because its basket trades on the Korean market at the same hours, so LPs can arbitrage immediately. Its tracking error rate is relatively large because the day cash dividends enter NAV and the day they are reflected in the index do not match, and rebalancing the index creates trading (Samsung Asset Management). TIGER US S&P500 is the reverse: its basket trades at night, so its premium/discount is wider, but it holds the index at the same weights, so it wobbles little.
So the two numbers serve different purposes. For someone putting KRW 10mn in and taking it out today, the premium/discount is the cost; for someone holding for 10 years, tracking difference is the cost. Frequent traders should first pick ETFs with narrow premiums/discounts, and long-term holders should first pick, within the same index, ETFs with small tracking difference and total expense ratios. That is why this report’s steps split into three for the premium/discount and two for tracking difference.
ETF cost comparison: one premium/discount equals 228 years of fees
Put the costs in won and the order is clear. Holding KRW 10mn in TIGER US S&P500 for a year costs 0.0068% in total fees, or KRW 680 (about $0.51). On March 9 this ETF closed 1.55% below NAV; selling KRW 10mn at that close would have meant receiving KRW 155,000 (about $115) less than NAV. One premium/discount equals 228 years of fees (author’s calculation). On KRW 10mn, a year of fees is KRW 680, and one premium/discount costs 228 times that. Last year’s FX share of -4.99pp is KRW 499,000 (about $372) on KRW 10mn, 734 times the fee.
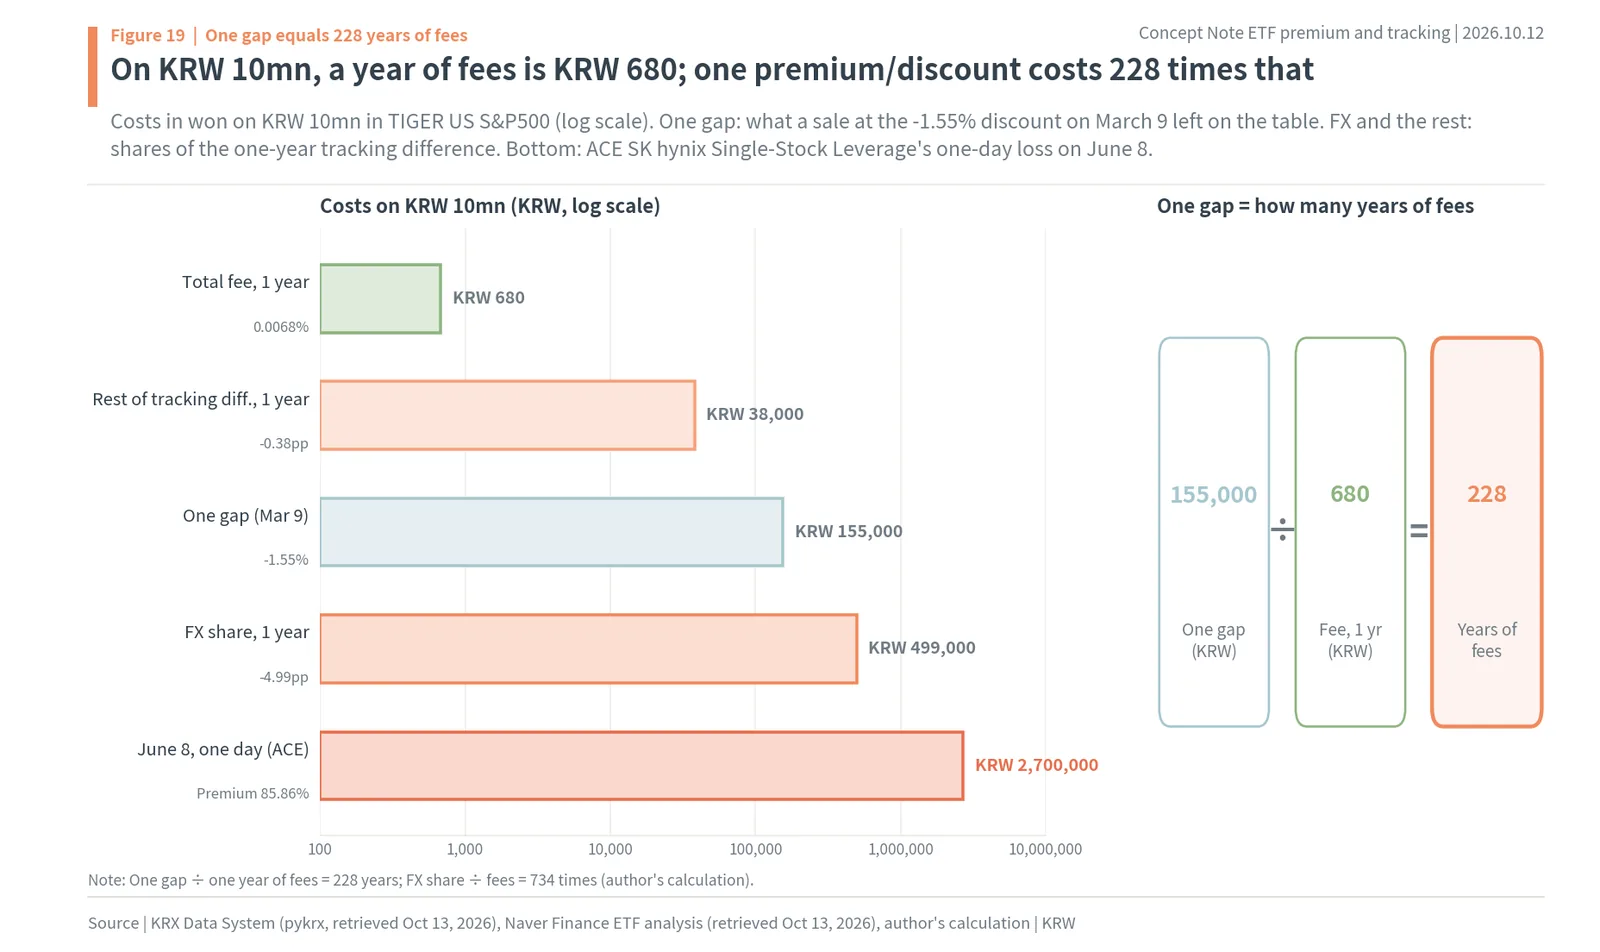
Figure 19 puts these costs on one log-scale axis, all on KRW 10mn. They grow in turn: KRW 680 in fees, KRW 38,000 for the rest of the tracking difference, KRW 155,000 for one premium/discount, KRW 499,000 for the FX share, and the KRW 2.7mn one-day loss on ACE SK hynix Single-Stock Leverage on June 8. If you habitually open the fee table first when choosing an ETF, reversing that order cuts costs far more. The next section turns that order into steps.
Five steps to check an ETF’s premium/discount and tracking difference
Here are the numbers above turned into five steps readers can apply directly to their own ETF. The first three deal with today’s price, the premium/discount; the last two deal with the one-year result, tracking difference. The example is TIGER US S&P500 (360750.KS), Korea’s largest overseas equity ETF (net assets of KRW 21.0546tn, about $15.7bn).
Step 1 is to compare the current price with the iNAV and calculate the premium/discount before you order. A brokerage app’s ETF screen shows the iNAV next to the current price, updated every 10 seconds. (Current price − iNAV) ÷ iNAV × 100 is the live premium/discount. TIGER US S&P500’s closing premium on October 12 was 0.23%, and its one-year average absolute premium/discount was 0.33%. Seeing how many times its usual width the current gap is tells you at once whether today is an ordinary day or a big one.
Step 2 is to remember the thresholds. A disclosure is filed when the gap exceeds 1% for a domestic ETF or 2% for an overseas ETF. The LP management standard has been 2% domestic and 5% overseas since August 19, 2026. Over the past year, TIGER US S&P500 exceeded 1% on 12 days and 2% on one day, April 8. A gap past these lines is a sign that LPs could not absorb all the market’s orders that day.
Step 3, for an overseas ETF, is to ask when the NAV was struck. An overseas ETF’s NAV is calculated from the previous night’s overseas close. If news that could move the overseas market broke during Korean hours, the premium/discount reflects that news, and the next day’s NAV is likely to follow. That is what happened on 10 of the 12 days TIGER US S&P500 was more than 1% away. In that case the gap is not a surcharge but a time lag.
Step 4 is to choose when and how to order. Avoid the pre-open and first five minutes (08:30 to 09:05) and the closing auction (15:20 to 15:30), when LPs have no duty to quote, and use limit orders instead of market orders. ACE SK hynix Single-Stock Leverage’s 85.86% premium on June 8 came from market buy orders in the closing auction, and KRW 10mn bought at that price lost KRW 2.7mn the next day. Single-stock leverage was more than 1% away on 23 of 92 trading days in its first four months, so for products like these, timing and order type decide the cost.
Step 5 is to line up ETFs that follow the same index by one-year tracking difference and total expense ratio, and to decide on hedging. TIGER US S&P500’s tracking error rate is a small 0.09%, but its one-year tracking difference was -5.36pp, of which -4.99pp was FX. The hedged version came in at -2.00pp over the same period. Its total expense ratio at the end of January 2025 was 0.1387%, far above its 0.0068% fee. If you expect the won to strengthen further, choose the hedged version; if you want to keep the dollar exposure, choose the unhedged one; and within that side, choose the lower total expense ratio.
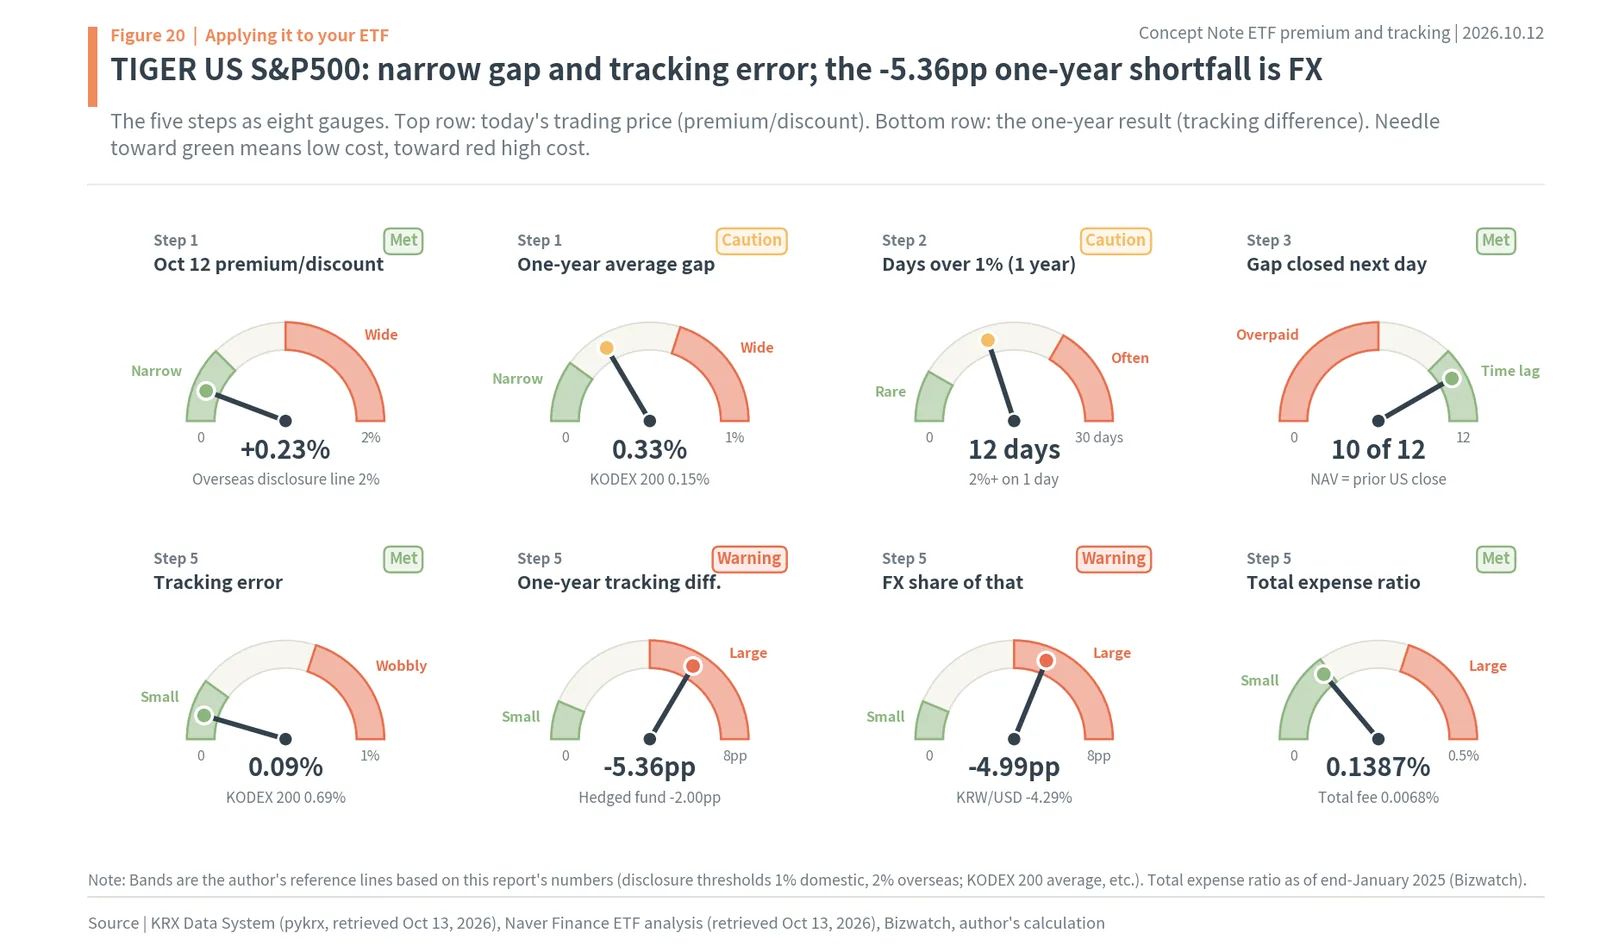
Figure 20 applies the five steps to TIGER US S&P500 as eight gauges. Its premium/discount and tracking error are narrow, and the -5.36pp one-year shortfall is FX. The gauges for steps 1 to 3 (premium/discount, one-year average gap, days over 1%, and the NAV timing) show that this ETF normally trades tightly and that most of its big-day gaps are time lag. The gauges for steps 4 and 5 (tracking error, one-year tracking difference, FX share and total expense ratio) show that the one-year result was decided by the exchange rate. Readers can put their own ETF’s numbers in the same boxes.
Where to check ETF premium/discount and total expense ratio: KRX, KIND and KOFIA
The numbers in this report come from places where investors can check them again themselves. Daily premium/discount and tracking error rates can be downloaded for any period from the ETF menu of the KRX Data System, and the all-ETF price screen lists closes and NAVs together. The live premium/discount is calculated from the current price and iNAV on a brokerage app.
Days when the premium/discount crossed the threshold can be checked in KIND disclosures. Issuers state the day’s close, NAV, premium/discount and cause in the “ETF premium/discount exceeded” filing. If the stated cause is the overseas close and futures hedging, as in the June 16 filing for KODEX US S&P500 Buffer June Active, the gap is a time lag; if it is a pile-up of orders in the closing auction, those who bought that day paid a surcharge.
Total expense ratios are in the “fund fee and expense comparison” under fund disclosures on KOFIA’s electronic disclosure site (KB Asset Management). Total fee, other expenses and trading and brokerage costs are listed separately, so the real costs of ETFs on the same index can be compared side by side. On total fees alone the difference is 0.0047% versus 0.0068%, but on total expense ratios at the end of January 2025 it was 0.1387% versus 0.2281%.
Applying the five steps to KODEX 200 and ACE SK hynix Single-Stock Leverage
Apply the same five steps to KODEX 200 (069500.KS), Korea’s flagship domestic ETF, and the result is different. Step 1: its closing premium/discount on October 12 was 0.00%, and its one-year average was 0.15%. Step 2: the only day in the year it crossed the 1% domestic line was July 31. Step 3: its underlying assets trade on the Korean market at the same hours, so its NAV is not late. This ETF sits at the low end of trading costs.
KODEX 200’s steps 4 and 5 are about tracking. Its tracking error rate of 0.69% was the lowest among the six ETFs following the same KOSPI 200 (0.69% to 0.84%). Its total fee of 0.15% is higher than RISE 200, ACE 200 and PLUS 200 (0.017%). Fee differences add up the longer you hold, so within the same index, if size and tracking error are similar, the lower fee and total expense ratio win. The comparison to use is the total expense ratio in KOFIA’s disclosures.
Apply them to ACE SK hynix Single-Stock Leverage (0194T0.KS) and steps 1 to 4 all weigh heavily. Step 1: its median absolute premium/discount over 92 trading days since listing was 0.56%, more than three times KODEX 200’s average. Step 2: it was more than 1% away on 23 days, about one day in four. Step 3: its underlying asset trades on the Korean market, but following twice the daily move makes LP risk heavy. Step 4: as on June 8, a market order in the closing auction can fill at up to 1.86 times NAV. For ETFs like this, ordering only with limit orders during regular hours is the first line of cost control.
Three common ETF calculation mistakes: the NAV denominator, tracking error and leverage
The first is the denominator of the premium/discount. It is divided by NAV, not by the price. If an ETF with a NAV of KRW 16,141 closes at KRW 30,000, the premium is (30,000 − 16,141) ÷ 16,141, or 85.86%, not the 46.2% you get by dividing by the price. Using the price as the denominator makes premiums look smaller and discounts larger. The premium/discount published by brokerage apps and KRX all use NAV as the denominator (KB Kookmin Bank).
The second is assuming a small tracking error rate means good performance. TIGER US S&P500’s tracking error rate is a tiny 0.09%, but its one-year tracking difference was -5.36pp. Because the tracking error rate measures day-to-day wobble, it cannot catch a gap that widens a little in the same direction every day, or a whole-period difference such as the exchange rate. To compare one-year performance, subtract the index return from the NAV return over the same period directly, rather than looking at the tracking error rate.
The third is doubling the period return for a leveraged ETF. Since KOSPI 200 rose 109.63% over the past year, it is tempting to calculate that KODEX Leverage should have risen 219.27%, but its NAV actually rose 204.02%. A leveraged ETF promises twice the daily return, and chaining those days together drifts further from double the period return the more the index swings. Read that gap as poor tracking and you blame the wrong ETF.
Wrap-up: avoid the LP-exempt hours for the premium, watch the dollar for tracking difference
Normally, LPs hold an ETF’s price close to NAV. KODEX 200’s one-year premium/discount averaged 0.15%, and 82.0% of the ETFs that traded on October 12 closed within 0.5% of NAV. On days the market moves a lot, overseas equity/commodity and leveraged/inverse ETFs come loose first. On March 4, when KOSPI 200 fell 11.94%, 61.3% of overseas equity/commodity ETFs and 50.0% of leveraged/inverse ETFs were more than 1% away.
Most gaps in overseas ETFs are a late NAV. The price runs ahead of a NAV calculated from the previous night’s overseas close, and the next day’s NAV catches up. That was the case on 10 of the 12 days TIGER US S&P500 was more than 1% away. A premium hardens into a loss in the hours when LPs step away. In the June 8 closing auction, ACE SK hynix Single-Stock Leverage closed at 1.86 times NAV, and the next day it came down 27.03%.
On the one-year scorecard, look at tracking difference rather than the tracking error rate, and tracking difference was decided by the exchange rate rather than the fee. TIGER US S&P500 followed the index without wobbling, with a tracking error rate of 0.09%, but with the dollar down 4.29% against the won it earned 5.36pp less than the index over the year. The total fee of 0.0068%, KRW 680 on KRW 10mn, is nothing next to one premium/discount (KRW 155,000) or the FX share (KRW 499,000). When trading, watch the clock first; when holding, watch the exchange rate first.
What investors need to do is reverse the order. Before ordering, check the premium/discount from the current price and iNAV; for an overseas ETF, remember that NAV is last night’s value; and order with limit orders, avoiding the minutes after the open and the closing auction, when LPs step away. When choosing, look at one-year tracking difference and total expense ratio before the fee table, and decide on hedging according to your own view of the exchange rate. Keep to this order alone and the big costs, the KRW 2.7mn of June 8 and the KRW 499,000 one-year FX share, come into view before the KRW 680 fee.
Maochaedung’s take. LPs normally hold an ETF’s price close to NAV, so KODEX 200’s one-year premium/discount averaged just 0.15%. On days the market moves a lot, overseas and leveraged ETFs come loose first, and an overseas ETF’s gap is often a late NAV that the next day’s NAV catches up with. In the closing auction, when LPs step away, the gap becomes a straight loss, like the 85.86% premium of June 8. Over a year, the exchange rate and hedging, not the fee, decided the result: ETF costs come far more from the premium/discount and the exchange rate than from the total fee.
Korean ETF premium/discount and tracking error FAQ
Q. What is an ETF premium/discount and how is it calculated?
It is how far an ETF’s market price is from its net asset value (NAV): (market price − NAV) ÷ NAV × 100. Buying an ETF with a NAV of KRW 10,000 at KRW 10,100 is a +1% premium. The denominator is NAV, so ACE SK hynix Single-Stock Leverage closing at KRW 30,000 against a NAV of KRW 16,141 on June 8, 2026 was an 85.86% premium, not 46.2%.
Q. What is the difference between tracking error and tracking difference?
Tracking error is the standard deviation of the daily return gap between NAV and the index, usually over one year; tracking difference is how much NAV earned more or less than the index over the whole period. TIGER US S&P500 had a tracking error of only 0.09% but a one-year tracking difference of -5.36pp.
Q. Why do overseas ETFs in Korea trade at a premium or discount?
Their NAV during Korean hours is based on the previous night’s overseas close, while the price reflects futures and expectations for that night. TIGER US S&P500 was more than 1% away from NAV on 12 days in the past year, and on 10 of them the next day’s NAV moved the same way. On April 8, 2026 it closed at a +2.72% premium, the S&P 500 rose 2.51% that night and NAV rose 3.34% the next day.
Q. When are Korean ETF liquidity providers not required to quote?
LPs are exempt from 08:30 to 09:00 (pre-open auction), 09:00 to 09:05 (the first five minutes) and 15:20 to 15:30 (the closing auction). The 85.86% premium on ACE SK hynix Single-Stock Leverage on June 8, 2026 came from market buy orders in the closing auction, and KRW 10mn bought at that close lost KRW 2.7mn the next day.
Q. How much did the exchange rate cost US S&P 500 ETFs in Korea over the past year?
From October 1, 2025 to October 12, 2026 the S&P 500 rose 16.33% in dollars, but with the dollar down 4.29% against the won (KRW 1,403.15 to 1,342.99), TIGER US S&P500’s NAV rose 10.97%. Of its -5.36pp tracking difference, -4.99pp was the exchange rate; the hedged KODEX US S&P500 (H) rose 14.33%.
Sources
- Korea Exchange (KRX), ETF premium/discount and tracking error history, all-ETF prices (via pykrx), retrieved Oct 13, 2026 (Oct 12 close; includes KODEX WTI Crude Oil Futures (H), March to June 2020)
- Naver Finance, ETF list and ETF analysis (total fee, tracking error, net assets), KOSPI and KOSPI 200 indices, retrieved Oct 13, 2026
- Yahoo Finance, KRW per USD (KRW=X) and S&P 500 (^GSPC), retrieved Oct 13, 2026
- KB Kookmin Bank kbthink, ETF NAV, premium/discount and tracking error (link), Aug 4, 2025
- Samsung Asset Management, KODEX guide: ETF NAV and ETF delisting (link)
- Samsung Asset Management blog, Tracking error (link), Sep 2, 2025
- Shinhan Asset Management SOL ETF, ETF concepts (link)
- Hanwha Asset Management PLUS ETF, ETF advanced guide (link)
- Mirae Asset Management TIGER ETF, investor notice (link)
- KIND, KODEX US S&P500 Buffer June Active premium/discount exceeded (link), Jun 17, 2026
- Newsis, ETF premium/discount disclosures and LP quoting exemptions (link), Jun 9, 2026
- Herald Economy, 18 single-stock leveraged and inverse products listed (link), May 27, 2026
- MTN, Investor protection measures for single-stock leveraged ETFs and ETNs (link), Jul 16, 2026
- Toyo Economy, 219 ETF premium/discount violations (link), Oct 8, 2026
- Newspim, Leveraged oil ETN premium and trading halt (link), Apr 23, 2020
- Dailian, Measures to stabilize the ETF and ETN market (link), May 17, 2020
- Bizwatch, US S&P 500 ETF fee cuts and total expense ratios (link), Feb 13, 2025
- Dailian, ACE US S&P500 total fee cut (link)
- KB Asset Management, Total fee vs total expense ratio (link)
Was this note useful?
Thanks. Your answer helps decide what to cover next.




.jpg)