Korea Stock Market Circuit Breakers and Sidecars: KOSPI Halted 10 Times in 2026. What Did the Halts Stop?
On the night of January 7, 2016, the China Securities Regulatory Commission (CSRC) announced that it would suspend, from the next day, the circuit breaker it had introduced only four days earlier. Beijing Daily and the People’s Daily Overseas Edition summarized on January 8 what CSRC spokesperson Deng Ge told reporters. “The circuit breaker was not the main cause of the plunge, but the two actual triggers show that it did not achieve the expected effect. As the index neared the threshold, some investors traded ahead of it, so the index reached the threshold even faster. This ‘magnet effect’ fed the decline. Weighing the gains and losses, the negative effects currently outweigh the positive ones.” China had launched the mechanism on January 4, 2016: a 15-minute halt if the CSI 300 index fell 5%, and a close for the rest of the day if it fell 7%. Of those four days, the market closed early on two, January 4 and January 7. On January 7, trading ended about 29 minutes after the open.
Chinese regulators were not the only ones to say that a device meant to stop the market can pull prices down. The US Securities and Exchange Commission (SEC), in its report on October 27, 1997, the first day the whole US market was halted, wrote that the 550-point threshold had a “strong magnet effect.” And in 2026, Korea’s KOSPI was halted by circuit breakers ten times. Something that had happened six times from its introduction in 1998 through 2025 happened ten times in a single year.
So, in a KOSPI that stopped ten times this year, did circuit breakers hold back the fall, or pull it in? This report starts with what circuit breakers and sidecars actually stop, then checks, with numbers, why they were triggered so often this year, how the market moved after each halt, and where individual investors’ costs came from.
This report is the full English edition of Maochaedung’s Korean note on circuit breakers and sidecars, with the data behind every number.
As of: October 19, 2026 (KOSPI and KOSDAQ index levels and net buying by investor type at the KRX close on October 19; forced-selling figures from the Korea Financial Investment Association (KOFIA) as of October 16). Dollar amounts use KRW 1,340.9 per dollar, the October 16, 2026 close (Yahoo Finance, KRW=X).
Concepts covered: circuit breakers (market-wide trading halts) at levels 1, 2 and 3; sidecars (temporary suspension of program trading orders); single-price auctions; volatility interruption (static and dynamic VI); daily price limits; the magnet effect; forced selling (margin calls)
Reference data: daily KOSPI and KOSDAQ closes, highs and lows are from the KRX Data System (January 2003 to October 19, 2026); net buying by investor type is from KRX trading by investor type; forced-selling amounts on unsettled purchases are from KOFIA’s statistics service; the market-cap weights of Samsung Electronics and SK hynix are from KRX market-cap data. Circuit breaker dates and times were checked against news reports, and the rules follow the market measures guide on the Korea Exchange’s English website. Numbers the author calculated are marked as the author’s calculations.
KOSPI circuit breaker rules: an 8% fall for one minute halts trading for 20 minutes; sidecars pause program orders for 5 minutes
The Korean stock market has three layers of devices that pause trading when prices move sharply all at once: the circuit breaker, which halts the whole market; the sidecar, which halts only program trading orders; and the volatility interruption (VI), which pauses a single stock. The conclusion of this chapter is simple. None of the three stops prices from falling. Each one buys time by pausing orders briefly, and they differ in what they pause and for how long.

A circuit breaker is triggered when the KOSPI falls more than 8% below the previous trading day’s close and stays there for one minute. That is level 1. Once triggered, all stock trading on the KOSPI market and all KOSPI-linked futures and options trading stop for 20 minutes (bonds are excluded). After 20 minutes, trading resumes with a 10-minute single-price auction, in which orders are collected and filled at one price. So when a level 1 circuit breaker hits, continuous trading is actually cut off for 30 minutes. Level 2 is triggered when the index falls more than 15% for one minute and is also more than 1% below the index level at which level 1 was triggered. Level 2 also halts trading for 20 minutes, like level 1. Level 3 is triggered when the index falls more than 20% for one minute and is 1% below the level 2 index, and trading ends for the day (Korea Exchange market measures).
There is not much investors can do during the halt. During the 20 minutes of a level 1 or level 2 halt, no new orders can be placed; only cancellations of existing orders are accepted. At level 3, even cancellations are not accepted. Each level can be triggered only once a day. Levels 1 and 2 cannot be triggered in the last 40 minutes of the session, that is, after 14:50. Only level 3 can still be triggered after that. The KOSDAQ market has its own circuit breaker with the same 8%, 15% and 20% thresholds. Nextrade, the alternative exchange that opened in March 2025, halts trading in the affected market’s stocks whenever the Korea Exchange triggers a circuit breaker (SBS Biz, March 7, 2025).
Sidecars use a different trigger and a different target. A sidecar is triggered when the price of the most actively traded KOSPI 200 futures contract (the front month) rises or falls more than 5% from its base price and stays there for one minute. Once triggered, program trading orders lose effect for 5 minutes. If futures fall, program sell orders are paused; if futures rise, program buy orders are paused. That is why the downside version is called a sell sidecar and the upside version a buy sidecar. A sidecar can be triggered only once a day, not after 14:50, and it lifts automatically after 5 minutes (Kyunghyang Shinmun, June 12, 2026; Newsis, July 27, 2026). The KOSDAQ sidecar is triggered when KOSDAQ 150 futures move 6% and the KOSDAQ 150 index moves 3%, both for one minute (eToday, March 12, 2020).
The difference between the two can be put in one line. Even when a sidecar is triggered, orders placed by people are still filled. Only basket orders that computers send all at once by preset rules are delayed by 5 minutes. When a circuit breaker is triggered, no investor can trade continuously for 30 minutes. The left side of the figure draws, as a staircase, which device kicks in as the fall deepens: a sidecar at a 5% futures move, level 1 at an 8% index fall, level 2 at 15% and level 3 at 20%. The right side shows how long each device pauses and what it pauses: 2 minutes for a VI, 5 minutes for a sidecar, 20 minutes plus a 10-minute single-price auction for circuit breaker levels 1 and 2, and the end of the day for level 3.
These devices were created long ago. The KOSPI circuit breaker started in December 1998 as a single 10% level, and the KOSDAQ one was introduced on October 15, 2001 (Ministry of Economy and Finance glossary). The current three levels of 8%, 15% and 20% date from June 2015, when the daily price limit was widened from ±15% to ±30% (Bizwatch, November 26, 2014; eToday, May 19, 2015). Sidecars came to KOSPI first, in November 1996, and to KOSDAQ in March 2001. The sidecar threshold was widened from ±3% in 1996 to ±4% in 1998 and ±5% in 2001 (Newsis, April 7, 2026). Levels 2 and 3 have never been triggered since they were introduced in 2015 (TokenPost, July 29, 2026).
A circuit breaker halts the whole market for 20 minutes after the index has been down 8% for one minute, then reopens with a 10-minute single-price auction. A sidecar pauses only program orders for 5 minutes after a 5% futures move. Neither props up prices; both buy time.
How it works in Korea
For readers outside Korea, a little background makes the rest of this report easier to follow. Korean stocks trade on two boards run by the Korea Exchange (KRX): KOSPI, the main board where Samsung Electronics and SK hynix are listed, and KOSDAQ, the growth board for smaller and younger companies. Each board has its own index and its own circuit breaker, so on a bad day the two markets can halt separately, as they did on October 15, when KOSDAQ stopped about 15 minutes before KOSPI.
KRX publishes daily net buying by investor type, which is why this report can say who sold and who bought on each halt day. The main groups are foreigners, individuals (retail investors), institutions (brokerages, insurers, asset managers, private funds, banks, other financial firms and pension funds) and other corporations. “Other corporations” means ordinary companies, so when a listed company buys back its own shares, the purchase shows up there.
Korean retail investors also borrow to buy stocks in two common ways. One is a margin loan from a broker, called “credit” in Korea. The other is an unsettled purchase, called “misu”: the investor buys shares but does not pay the full amount within the two-day settlement period. In both cases, if the value of the shares (the collateral) falls below the broker’s required level and the investor does not add money by the deadline, the broker sells the shares without the investor’s consent at the next morning’s opening auction, at the market price. This forced selling is called “bandaemaemae” in Korean, and KOFIA publishes the daily amount for unsettled purchases.
The halt thresholds are the same on both boards: 8% for level 1, 15% for level 2 and 20% for level 3, all measured from the previous day’s close. Since March 2025, some Korean stocks also trade on Nextrade, an alternative exchange. When KRX triggers a circuit breaker, Nextrade halts trading in that market’s stocks as well, so a halt on KRX is a halt for the whole market.
KOSPI and KOSDAQ halt separately at 8%, 15% and 20%, Nextrade halts with them, and the bill for borrowed money comes at the next morning’s opening auction, when brokers force-sell accounts that are short of collateral.
Terms used in this report: thresholds, single-price auctions, the magnet effect and forced selling form one chain
To read circuit breakers properly, a few terms need to be settled first. The conclusion of this chapter is simple. Thresholds are set as a ratio of the previous day’s close, so they are hit often whenever daily swings are large, whatever the index level, and the cost after a halt shows up not during the session but in the next morning’s forced selling.
The threshold is the index level at which a circuit breaker is triggered. Multiplying the previous day’s close by 0.92 gives the level 1 (8%) line, by 0.85 the 15% line, and by 0.80 the 20% line. For example, if KOSPI closed at 6,000 the day before, the 8% line is 5,520, the 15% line 5,100 and the 20% line 4,800. Because the threshold is a ratio, an 8% one-day fall triggers it in exactly the same way whether KOSPI is at 2,000 or 9,000. Circuit breakers do not hit more often because the index is higher; they hit more often only when the daily range widens.
The “lasts one minute” condition keeps a split-second plunge from triggering a halt. If the index dips below the 8% line and climbs back within a minute, nothing happens. On July 2 this year, KOSPI’s intraday low was 8.27% below the previous close, yet no circuit breaker was triggered (KRX index data, news coverage). It appears the index did not stay below the 8% line for a full minute.
A single-price auction collects the orders that come in over a set period and fills them all at one price. The pre-open auction and the closing auction are single-price auctions. When the 20-minute circuit breaker halt ends, orders are collected for 10 minutes in a single-price auction and filled at one price, and then continuous trading resumes. The sell and buy orders that piled up during the halt are reflected in that one price.
The magnet effect is what happens when, as the price approaches a halt threshold, investors rush to place orders because they “have to sell before it stops,” pulling the price toward the threshold even faster. The logic is that once the halt comes, they will not be able to sell for a while, so they sell early. This was the reason the CSRC gave for scrapping its circuit breaker in 2016, and research has found a similar effect near Korea’s daily price limits (upper and lower limits) (Du, Liu and Rhee, 2009, International Review of Finance).
Forced selling is when a broker sells an investor’s shares without consent to recover a loan because the account’s collateral has fallen short. If an investor has an unsettled purchase (money owed within two days of buying shares that was not paid) or a margin loan whose collateral ratio falls below the required level, the shares in accounts that do not add money by the deadline are sold at the market price in the next morning’s opening auction. On days when the market falls far enough to trigger a circuit breaker, the number of accounts short of collateral jumps, so forced selling rises the next day too. KOFIA publishes the daily amount of forced selling on unsettled purchases.
Thresholds are a ratio of the previous close, so the number of circuit breakers depends on daily swings, not on the index level. Orders that pile up during a halt are reflected in one single-price auction, and accounts short of collateral are cleared by forced selling the next morning.
On October 15, KOSPI hit the 8% line of 5,528.11 and halted at 12:38, then set its low after reopening and closed down 7.57%
The most recent circuit breaker was on October 15. Following that one day shows how the mechanism works in practice. The conclusion of this chapter is simple. The circuit breaker halted trading when the index touched the 8% line, but after trading resumed the index fell further below that line, then recovered part of the loss before the close. The halt broke the speed of the fall but did not change its direction.
KOSPI closed at 6,008.81 on October 14. That figure set the thresholds for October 15: the 8% line was 6,008.81 × 0.92 = 5,528.11, the 15% line 5,107.49 and the 20% line 4,807.05 (author’s calculation). KOSPI opened at 5,673.01 (-5.59%) that day (Asia Economy). US September consumer prices came in higher than expected, and selling spread, led by large chip stocks (Nocut News, YTN). About seven minutes after the open, around 9:07, a KOSPI sell sidecar was triggered, and at 9:12:23 a KOSDAQ sell sidecar. It was the 51st KOSPI sidecar of the year and the 33rd on KOSDAQ (Herald Economy). The sidecar paused program sell orders for 5 minutes, but the index kept sliding all morning.
At about 12:23:13, KOSDAQ hit its level 1 circuit breaker first, down 8.01% at 757.88, and 15 minutes later, around 12:38, KOSPI hit level 1, down 8.00% at 5,528.05 (Nocut News, Herald Economy). It was KOSPI’s tenth circuit breaker of the year and the sixteenth ever, and KOSDAQ’s fifth of the year and fifteenth ever. It was the first time both markets halted on the same day since July 29.

The left side of the figure above shows KOSPI closes from September 15 along with the three October 15 thresholds. KOSPI, above 7,000 in late September, began falling on October 8, reached 6,008.81 on October 14, and fell below the 8% line within a single day on October 15. The right side breaks that day’s move into steps. From the previous close of 6,008.81 to the trigger point of 5,528.05, the index lost 480.76 points. After trading resumed, it lost another 77.24 points to an intraday low of 5,450.81, then recovered 103.41 points to close at 5,554.22 (-7.57%) (KRX, author’s calculation). The low was 9.29% below the previous close. The level 2 line at 15% was still 5.71 percentage points away.
That day Samsung Electronics fell 9.48% and SK hynix 11.06% (Smart Today). Foreigners sold a net KRW 3.7582 trillion (about $2.8 billion) of KOSPI stocks, while individuals bought a net KRW 1.3948 trillion and institutions KRW 1.7121 trillion (KRX, author’s count). Before the close, at 14:30, Financial Services Commission Chairman Lee Eog-weon held an emergency meeting with related agencies, warned that “investing that relies on excessive debt and credit is risky,” and asked financial firms to refrain from reckless lending for stock purchases (Smart Today). On the next trading day, October 16, KOSPI rose 2.05% to close at 5,668.05, and a buy sidecar was triggered on KOSDAQ (News Tomato). On October 19, KOSPI stood at 5,768.01, 3.85% above the October 15 close.
This one day shows the character of a circuit breaker exactly. The sidecar was triggered in the morning but did not stop the fall. The circuit breaker hit precisely at the 8% line and cut off continuous trading for 30 minutes, but after reopening the index went below that line. The index closed back above the 8% line because buyers came in during the afternoon, not because the halt itself lifted prices.
On October 15, KOSPI halted at 12:38 near the 8% line of 5,528.11, fell further to 5,450.81 after reopening, and closed down 7.57%. The halt broke the speed of the fall but did not change its direction.
Even on March 4, the biggest fall on record, level 2 was still 2.35 percentage points away, and KOSPI rose 9.63% the next day
If October 15 was an average circuit breaker day, March 4 was the most extreme. The conclusion of this chapter is simple. Even on the day KOSPI fell a record 12.06%, the circuit breaker was triggered only once, at level 1, and the level 2 line at 15% was still 2.35 percentage points away. The panic of that day carried into the next day as both a 9.63% rebound and KRW 77.68 billion (about $57.9 million) of forced selling.
On March 3, KOSPI fell 7.24% to close at 5,791.91. It was the biggest point drop on record at the time, but no circuit breaker was triggered (Korea Economic Daily). That close set the thresholds for March 4: the 8% line was 5,328.56, the 15% line 4,923.12 and the 20% line 4,633.53 (author’s calculation). On March 4, KOSDAQ hit its level 1 circuit breaker at 11:16 and KOSPI at 11:19:12. At the trigger, KOSPI was at 5,322.16, down 8.11% (Kuki News). An exchange official explained that the circuit breaker was triggered as stocks plunged on fears that the conflict in the Middle East between the US and Israel on one side and Iran on the other would widen.
After reopening, KOSPI slid further, to an intraday low of 5,059.45, 12.65% below the previous close. The level 2 line at 4,923.12 was still 136 points, or 2.35 percentage points, away. The close of 5,093.54 (-12.06%) beat the 12.02% of September 12, 2001, making it the largest one-day percentage fall in KOSPI history (Korea Economic Daily). KOSDAQ fell 14.00% that day. Over the two days, KOSPI lost more than 18.4%.
Trading flows that day looked different from other circuit breaker days. Net buying was small for all three groups: foreigners +KRW 0.23 trillion, individuals +0.08 trillion and institutions -0.60 trillion (KRX, author’s count). Trading value was KRW 62.9 trillion (about $46.9 billion), 1.87 times the average of the previous 20 trading days. A lot of stock changed hands, but the flow did not tilt heavily to one side. The next day, March 5, KOSPI rose 9.63% and a buy sidecar was triggered (Yonhap). Forced selling that same day was KRW 77.68 billion, nearly six times the previous 20-day average of KRW 12.84 billion (KOFIA, author’s calculation). The index jumped, but accounts short of collateral had already been cleared at the morning auction before the rebound began.
In the 60 trading days after March 4, KOSPI rose 72.54%, all the way to its June peak (author’s calculation). The day of the biggest fall on record turned out to be a correction in the middle of a bull market. But that was known only afterward; the circuit breaker on that day did not say so. The 60 trading days after June 23, which was also a level 1 circuit breaker, returned -18.14%.
Even on March 4, the biggest fall on record, the circuit breaker was triggered once at level 1, with level 2 still 2.35 percentage points away. KOSPI rose 9.63% the next day, but forced selling that morning was nearly six times normal.
KOSPI has had 16 circuit breakers in its history, and 10 of them came in 2026
The circuit breaker used to be a device you might see once in several years. The conclusion of this chapter is simple. In the 27 years from its introduction in 1998 through 2025, KOSPI had six circuit breakers; in 2026 alone it had ten, so ten of the sixteen in history fell in this year.
The six KOSPI circuit breakers before 2026 were as follows. The first was on April 17, 2000. It hit five minutes after the open, and KOSPI closed down 11.63% at 707.72 (Esquire Korea). The second was at 13:02 on September 18, 2000 (Maeil Shinmun). The third was on September 12, 2001, the day after the 9/11 attacks in the US; the market, which opened at noon, halted two minutes later, and KOSPI fell 12.02%. After that, KOSPI went 18 years and 6 months without a circuit breaker (Newsis, March 13, 2020). The fourth and fifth came during the spread of COVID-19, at 10:43 on March 13, 2020 and around 12:05 on March 19, 2020. The sixth was at 14:14:30 on August 5, 2024, a day when fears of a US slowdown coincided with the unwinding of the yen carry trade (Kuki News). During the financial crisis on October 23 and 24, 2008, only KOSDAQ hit circuit breakers; KOSPI did not (Money Today, August 8, 2011). It also has to be kept in mind that before June 2015 the rule was a single 10% level.
KOSDAQ had ten circuit breakers before 2026: January 23, 2006; August 16, 2007; October 23 and 24, 2008; August 8 and 9, 2011; February 12, 2016; March 13 and 19, 2020; and August 5, 2024 (Seoul Shinmun, February 12, 2016; Newsis; Kuki News). This year KOSDAQ halted five times, on March 4, June 8, July 28, July 29 and October 15, bringing its total to fifteen.
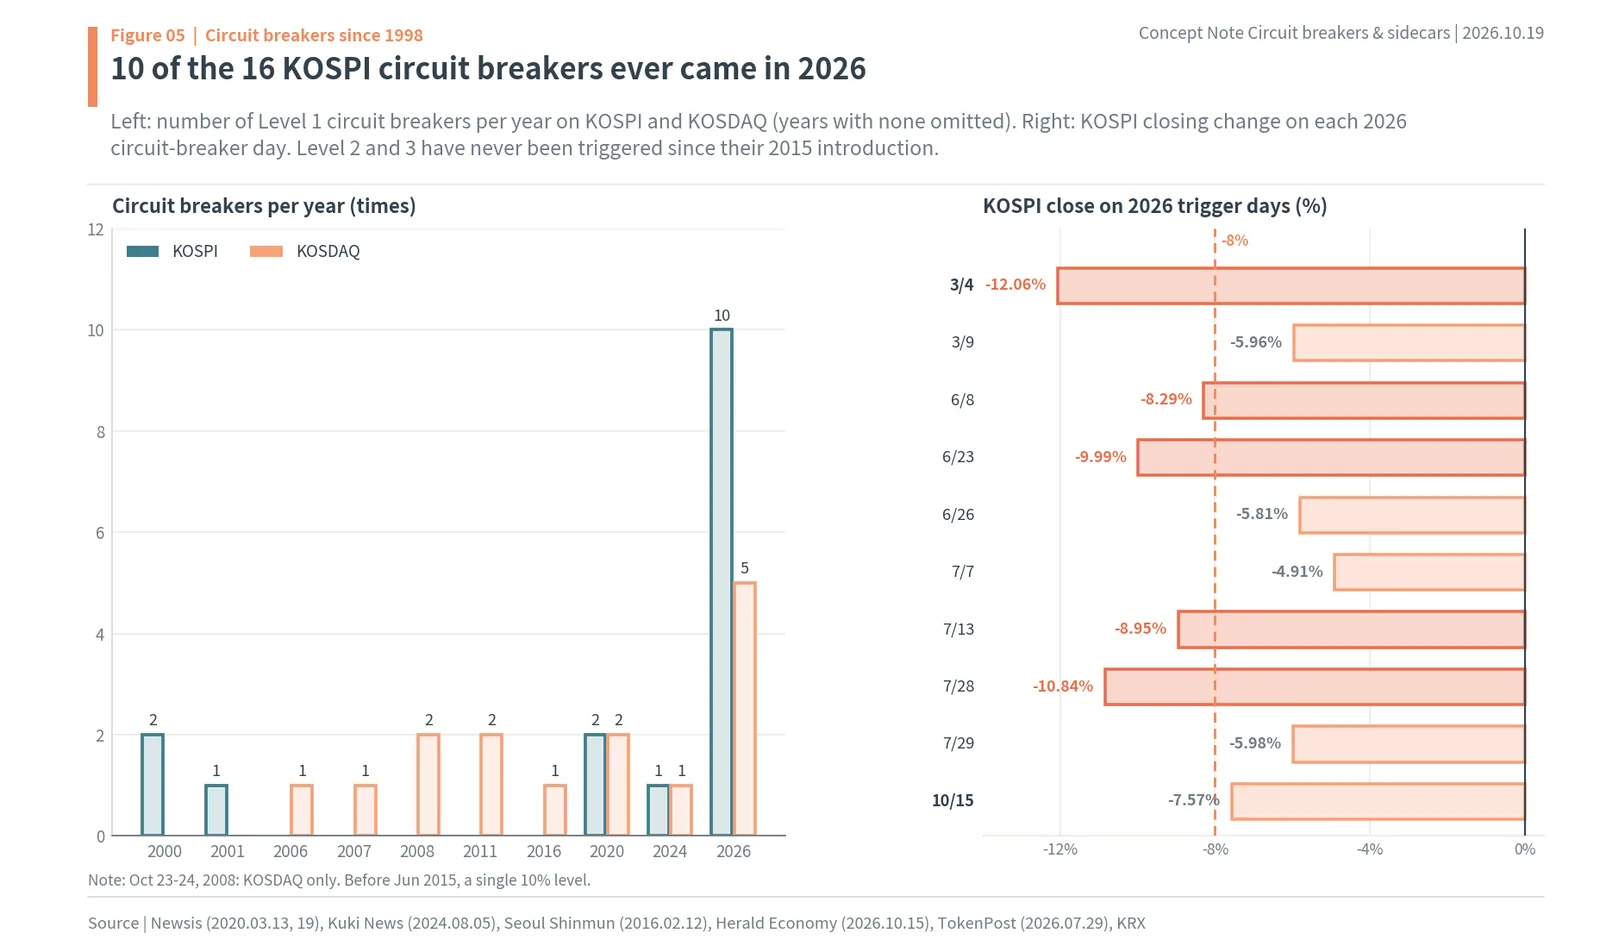
The left side of the figure above shows circuit breakers by year. KOSPI went from two in 2000, one in 2001, two in 2020 and one in 2024 to ten in 2026. For KOSDAQ, the most had been two, in 2008 and 2011; this year it had five. The right side shows the closing change on each 2026 KOSPI circuit breaker day. March 4 closed down 12.06% at 5,093.54, beating the 12.02% of September 12, 2001 for the largest percentage fall on record (Korea Economic Daily). That day KOSPI halted at 11:19 at 5,322.16 (-8.11%) (Kuki News). Next come July 28 at -10.84%, June 23 at -9.99%, July 13 at -8.95% and June 8 at -8.29%, while March 9 at -5.96%, June 26 at -5.81%, July 7 at -4.91%, July 29 at -5.98% and October 15 at -7.57% closed above the 8% line (KRX).
This year’s circuit breakers fell into three clusters. The first was in early March, on fears of a wider Middle East conflict: March 4 and March 9. On March 3, KOSPI also fell 7.24% without a circuit breaker. The second was around June 22, when KOSPI hit a record high of 9,114.55: seven halts crowded into two months, on June 8, June 23, June 26, July 7, July 13, July 28 and July 29. June 23 and 26 were the first time a circuit breaker hit twice in one week, and July 28 and 29 were the first time both markets halted together two days in a row (Herald Economy; Segye Ilbo and Yonhap). The third was October 15.
KOSPI had six circuit breakers from 1998 through 2025 and ten in 2026 alone. Levels 2 and 3 have never been triggered, and all ten this year were level 1.
Why KOSPI circuit breakers came so often in 2026: 37 days with moves of more than ±5%
The circuit breaker threshold is a ratio of the previous close. So frequent circuit breakers do not mean the device became more sensitive; they mean the market started moving more each day. The conclusion of this chapter is simple. In 2026, KOSPI rose or fell more than 5% in a day on 37 days, more than the 33 days for all 22 years from 2004 to 2025 combined. The ten circuit breakers are the result of that volatility.
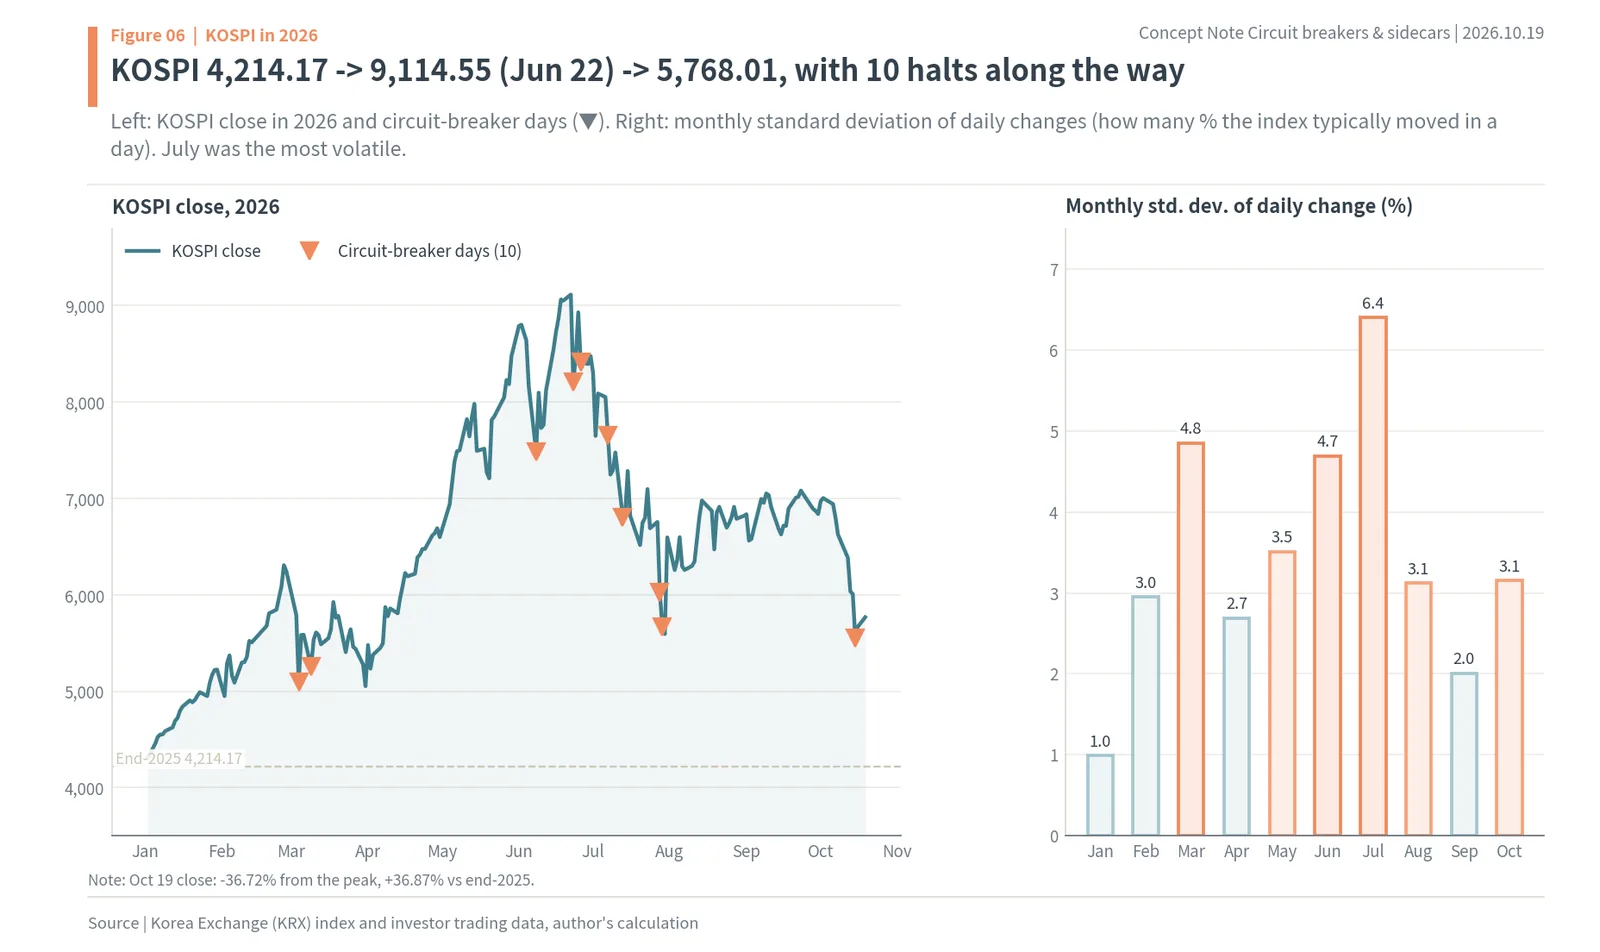
The left side of the figure above shows KOSPI closes in 2026 and the circuit breaker days (▼). KOSPI started from 4,214.17 at the end of 2025, rose to 9,114.55 on June 22, and stood at 5,768.01 on October 19. That is 36.72% below the peak but 36.87% above the end of 2025 (KRX, author’s calculation). The market halted ten times on a path that more than doubled within a year and then gave back more than a third from the peak. The circuit breaker markers sit on the correction during the rise (March), around the peak (June and July), and in October.
The right side shows the standard deviation of daily returns each month, in other words how much KOSPI typically moved in a day that month. January was 0.99%, a normal level. It rose to 4.85% in March, 4.69% in June and 6.40% in July, and those are exactly the months when circuit breakers clustered. It eased to 3.12% in August and 2.01% in September, then went back to 3.12% in October (author’s calculation).

The left side of the figure above counts, for each year, the days on which KOSPI’s close moved more than ±5%. There were 14 such days during the 2008 financial crisis and 6 in 2020 during COVID-19; most other years had between 0 and 3. In 2026 there were 37 through October 19: 21 down and 16 up. One year has more than the 33 days of the 22 years from 2004 to 2025 combined (author’s calculation). The right side shows the standard deviation of daily returns each year. The median from 2004 to 2025 is 1.04%, and the largest, in 2008, was 2.45%. In 2026 it is 3.83%, more than 1.5 times 2008.
When swings get this large, simple arithmetic says the days that reach the 8% line will multiply. In a market whose daily standard deviation is 1%, an 8% fall is eight standard deviations, something that happens once in decades. In a market with a standard deviation of 3.83%, it is a little more than two, which can happen several times a year. The circuit breaker rule did not change; the market’s daily swing more than tripled. And with 21 big down days but also 16 big up days, this year’s market did not just collapse in one direction; it swung hard both ways.
Comparing this year with earlier periods of turmoil makes the difference clearer. In the 2008 financial crisis, the 14 days of ±5% moves were 8 down and 6 up, and there were 6 days when the intraday low was more than 8% below the previous close. Back then the rule was a single 10% level, so KOSPI never hit a circuit breaker; only KOSDAQ did, on October 23 and 24. In 2020, the 6 days of ±5% moves were 2 down and 4 up, and the standard deviation of daily returns was 1.78%. In 2026, the number of ±5% days is more than two and a half times 2008, and the days with intraday falls of more than 8% number 11, more than the 6 in 2008 (author’s calculation).
KOSPI moved more than ±5% in a day on 37 days in 2026, more than the 33 days of the 22 years from 2004 to 2025 combined. The daily standard deviation of 3.83% was more than three times the usual 1.04%, and the ten circuit breakers followed from that.
One reason for the bigger swings is concentration: the weight of Samsung Electronics and SK hynix rose from 34.03% to 55.67% on June 22
For the index to move a lot in a day, the big stocks in it have to move a lot. This year, two stocks made up nearly half of KOSPI. The conclusion of this chapter is simple. The combined KOSPI market-cap weight of Samsung Electronics and SK hynix common shares rose from 34.03% at the end of 2025 to 55.67% on June 22, and was still 46.92% on October 15. With that structure, a 10% move in the two stocks moves the index 4 to 5%, so news about a single industry, chips, turned straight into index circuit breakers.

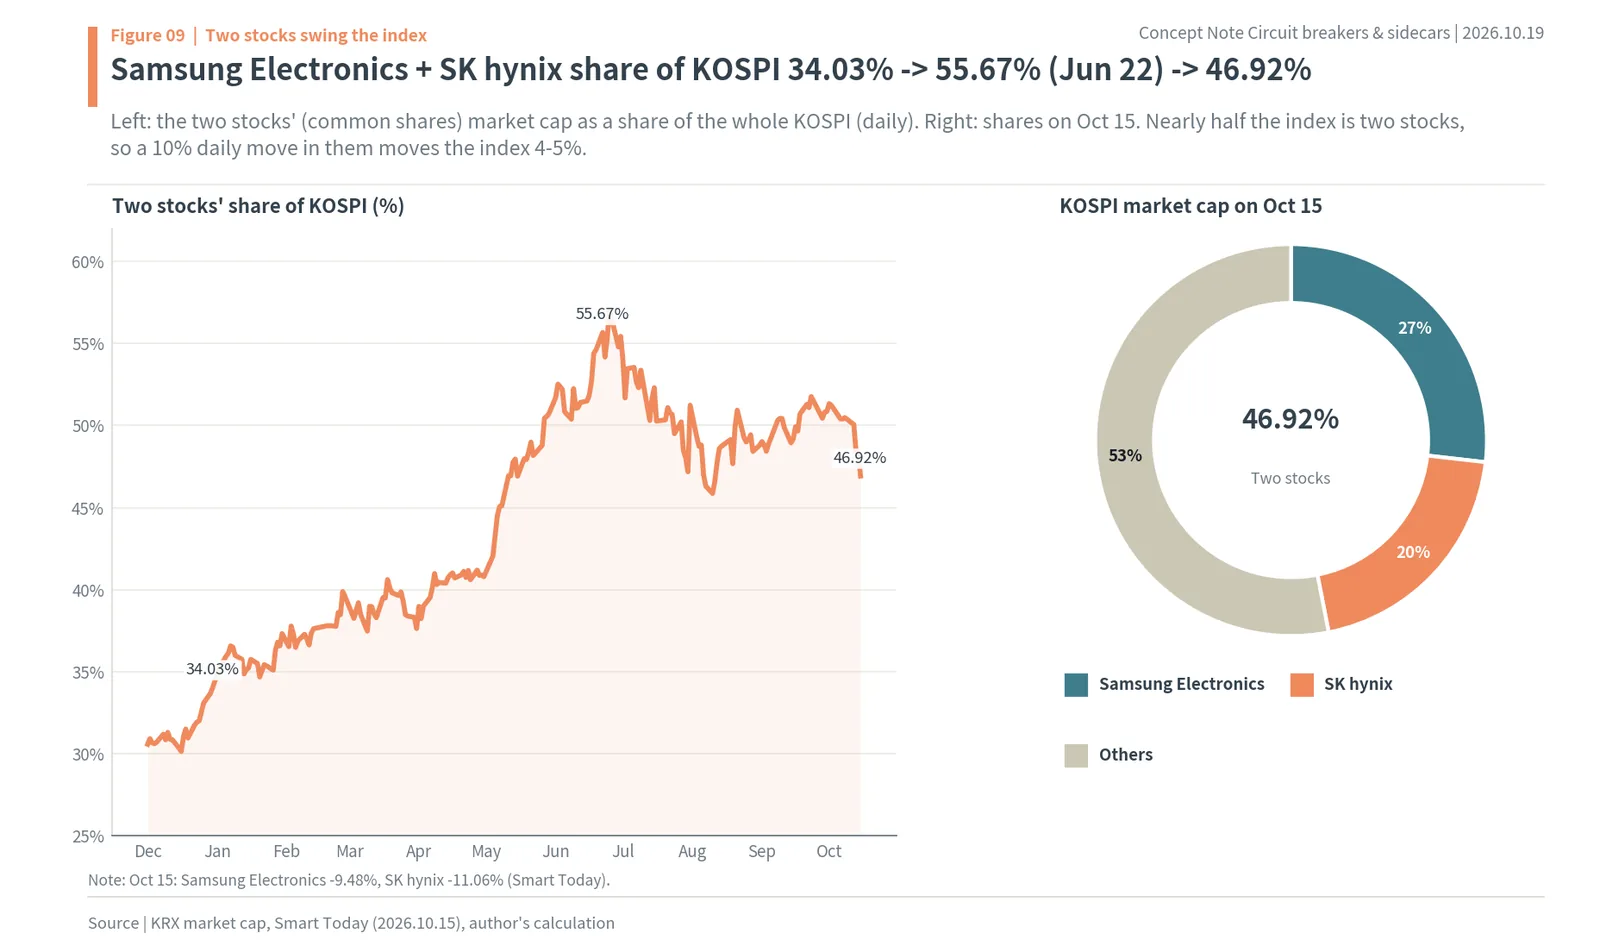
The left side of the figure above shows the daily share of the two stocks in total KOSPI market cap (KRX, author’s calculation). The weight, 34.03% at the end of 2025, rose throughout the first half to 55.67% on June 22, the day KOSPI hit its record high. It came down afterward as the two stocks fell more than the index, but was still 46.92% on October 15. The right side shows the makeup of KOSPI market cap on October 15: Samsung Electronics 26.80%, SK hynix 20.12% and every other stock combined 53.08%.
October 15 shows this structure plainly. That day Samsung Electronics fell 9.48% and SK hynix 11.06% (Smart Today). With a combined weight of 46.92%, those two stocks alone took about 4.77 percentage points off the index (author’s calculation). If the remaining stocks fall a little over 6% on average, the index reaches the 8% line. That is why the whole index swings hard on days when expectations for the chip cycle shift, or when foreigners sell chip stocks.
Concentration works the same way on the way up. In 2026 there were 16 days when KOSPI rose more than 5%, and of the 41 KOSPI sidecars through July 24, 20 were buy sidecars (The Fact). In the end, circuit breakers hit often this year not only because the whole market fell into panic at once, but because the index came to follow the moves of a handful of stocks closely.
The combined weight of Samsung Electronics and SK hynix went from 34.03% at the end of 2025 to 55.67% on June 22 and 46.92% on October 15. With nearly half the index in two stocks, the index reaches circuit breaker lines on days when chips move sharply.
After the halt, 5 of the 10 halts in 2026 closed back above the 8% line, and 5 fell further
If circuit breakers prevented falls, the index should usually climb back above the 8% line after a halt. The conclusion of this chapter is simple. Of the ten halts in 2026, five closed above the 8% line and five below it, an exact split. The 20-minute halt did not tilt the day’s outcome one way or the other.
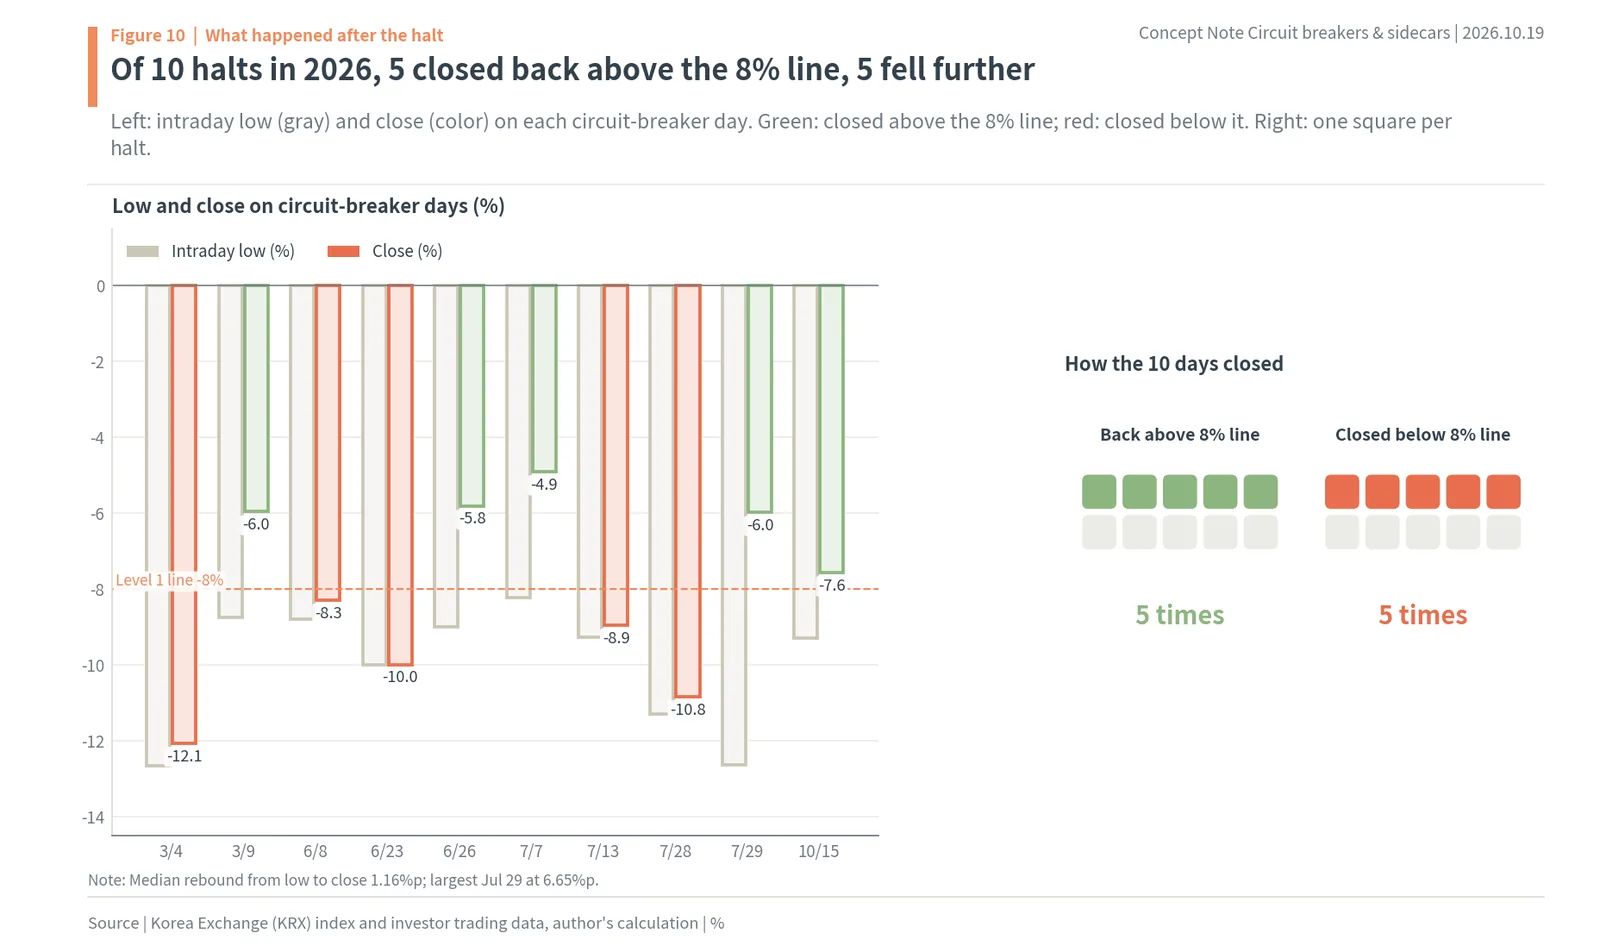
The left side of the figure above shows, for each 2026 circuit breaker day, the intraday low (gray) and the close (color) against the previous close. Green bars are days that closed above the 8% line and red bars days that closed below it. March 9 (-5.96%), June 26 (-5.81%), July 7 (-4.91%), July 29 (-5.98%) and October 15 (-7.57%) came back above the 8% line. March 4 (-12.06%), June 8 (-8.29%), June 23 (-9.99%), July 13 (-8.95%) and July 28 (-10.84%) ended below it (KRX, author’s calculation). The right side is a chart in which each cell is one halt: five and five.
The gap between the intraday low and the close was not large either. The median recovery from low to close was 1.16 percentage points. On March 4 it went from a low of -12.65% to a close of -12.06%, 0.59 percentage point. On June 23 the low and the close were both -9.99%, so it closed at the low. The biggest recovery was on July 29, which fell as far as -12.63% intraday and closed at -5.98%, recovering 6.65 percentage points. That was the second day in a row with a circuit breaker, and institutions bought a net KRW 3.18 trillion (about $2.4 billion) (KRX, author’s count).
What these numbers say is that a circuit breaker does not change the balance of buying and selling that day. During the 30-minute halt, investors get time to reassess and adjust their orders. Once the market reopens after that time, the index climbs back above the 8% line if buyers dominate and falls further if sellers dominate. There are days like October 15, when the low is set below the 8% line and the index comes back in the afternoon, and days like March 4, when it slides below -12% after the halt. The halt itself did not lean either way.
KOSDAQ shows the same picture. Of KOSDAQ’s five circuit breakers in 2026, three, July 28 (close -7.72%), July 29 (-6.12%) and October 15 (-7.65%), closed back above the 8% line, while March 4 (-14.00%) and June 8 (-9.08%) ended below it. On July 29, KOSDAQ fell as far as -10.61% intraday and recovered 4.49 percentage points; on March 4, it recovered only 0.17 percentage point from an intraday -14.17%, closing almost at the low (KRX, author’s calculation). Even with the same level 1 circuit breaker, what happened after the halt differed by market and by day. What the circuit breaker gave investors was not an outcome but 30 minutes of time.
Of the ten circuit breakers in 2026, five closed back above the 8% line and five ended below it. The median recovery from low to close was 1.16 percentage points; the halt did not decide how the day ended.
There was no clear sign that the 8% line pulled prices down: 73.3% of days past -7% went on to -8%, close to the 70.0% that went from -5% to -6%
If the magnet effect the CSRC described existed in Korea, days on which the index came right up to the 8% line should show an unusually high rate of crossing it, because investors would rush to “sell before it stops.” The conclusion of this chapter is simple. Looking at KOSPI’s intraday lows in 2026, 73.3% of the days that went past -7% went on to -8%. That is similar to the 70.0% that went from -5% to -6% and the 71.4% that went from -6% to -7%, levels with no halt threshold. This data shows no sign that the fall sped up only in front of the 8% line.

The left side of the figure above counts, by range, how far KOSPI’s intraday low was below the previous close over the 193 trading days of 2026. The 0 to -2% range is the most common at 62 days, and the counts shrink further down. There were 4 days that stopped in the -7 to -8% range (March 3, May 15, July 16 and October 13) and 11 days that went past -8%. Of those 11, July 2 had a low of -8.27% but did not last a full minute, so no circuit breaker was triggered; the other 10 are the circuit breaker days (KRX, author’s calculation).
The right side turns this distribution into “continuation rates.” There were 39 days when the low went past -4%, and 30 of them (76.9%) reached -5%. Of the 30 days past -5%, 21 (70.0%) reached -6%; of the 21 past -6%, 15 (71.4%) reached -7%. And of the 15 days past -7%, 11 (73.3%) reached -8%. If the magnet effect were strong, only the last cell should stand out above the others, but the four cells sit evenly between 70% and 77%.
This check has clear limits. The day counts are small, 15 or 21, so a few days going differently would move the rates by several percentage points. And because only daily lows were used, it cannot capture intraday moves, such as whether orders crowded in during the few minutes before the 8% line. Academic studies using intraday data have found that volatility rises near thresholds. The US SEC wrote that the 550-point threshold on October 27, 1997 had a strong magnet effect, and a study of China’s 2016 circuit breaker reported that prices fell further as they approached the threshold (Xiang and Lu, 2023). “The Dark Side of Circuit Breakers,” published in the Journal of Finance in 2024, also examined the effect with a model and data (Chen, Petukhov, Wang and Xing).
Still, this is what Korea’s 2026 daily data does show. The days that reached the 8% line were mostly days that had already passed -5% and -6% in a continuing slide, and the rate of going from -7% to -8% was not especially higher than at the earlier steps. The circuit breaker did not prevent the fall, but at a daily level it did not visibly pull the fall in either.
In KOSPI in 2026, 73.3% of days past -7% went on to -8%, similar to 70.0% from -5% to -6% and 71.4% from -6% to -7%. Daily data shows no clear sign that the 8% line pulled prices down.
The day after a circuit breaker, KOSPI’s median return was +2.05%, and it rose 8 times out of 13
What happens once the halt day is over? The conclusion of this chapter is simple. For the 13 KOSPI circuit breakers since the 2015 three-level overhaul (2020 to 2026), the median next-day return was +2.05%, and the index rose 8 times out of 13. That is higher than the +0.79% median the day after falls of more than 5% without a circuit breaker. But five times the index fell again the next day, and results 20 trading days later varied widely from case to case.

The left side of the figure above shows the median next-day and 20-trading-day returns for two groups. The 13 circuit breaker days returned +2.05% the next day and +6.30% after 20 trading days. The 14 days in the same period when the close fell more than 5% without a circuit breaker returned +0.79% the next day and +3.81% after 20 trading days (KRX, author’s calculation). The rebound after a big fall was somewhat larger on circuit breaker days. After 20 trading days, 8 of the 12 circuit breaker days were up (October 15 is excluded because 20 trading days have not yet passed).
The right side shows the next-day return for each 2026 circuit breaker. Some rebounded strongly: +9.63% the day after March 4, +8.18% the day after June 8 and +5.35% the day after March 9. A buy sidecar was also triggered on March 5 (Yonhap). On the other hand, the day after July 28 was -5.98%, with circuit breakers on two days in a row; the day after July 7 was -5.35%, after July 29 -1.23% and after June 26 -0.20%. Of the ten in 2026, six were followed by a rise the next day, with a median of +1.39%. The day after October 15 was +2.05%.
The gap is bigger 20 trading days out. In the 20 trading days after the June 26 circuit breaker, KOSPI fell another 19.68%; after June 23 it fell 17.14%, and after July 7 13.82%. By contrast, the 20 trading days after July 29 returned +22.06%, and those after March 19, 2020 +31.34% (author’s calculation). Circuit breakers near the peak marked the start of a decline, and circuit breakers at the end of a decline came near the bottom. The fact that a circuit breaker was triggered does not tell you which kind of day it is.
Older tallies point the same way. According to an AlphaSquare summary citing Kiwoom Securities and FnGuide data, the eight KOSPI circuit breakers before June 23 had an average return of 4.0% the next day and 6.8% after 20 trading days. The Korea Economic Daily wrote that it took about 30 days on average to recover the pre-halt index level after past circuit breakers: 42 days in 2001, one day after the first in 2020, five days after the second, and 11 days in 2024. With so few cases, the averages swing heavily on a few big rebounds.
Looking at five trading days later, in between, the split between rebounds and further falls is sharper. For the nine circuit breakers of 2026 (excluding October 15), the median five-day return was +5.57%, and six of the nine were up. The best were +16.51% after July 29 and +14.18% after June 8; the worst were -10.44% after July 7 and -3.84% after June 26 (author’s calculation). The five trading days after July 7 include the July 13 circuit breaker. When the next circuit breaker arrives within a week of the last one, buying for a rebound turns into a loss again.
The median return the day after KOSPI’s 13 circuit breakers was +2.05%, with 8 of 13 up. But the 20 trading days after the June 23 and 26 halts near the 2026 peak returned -17% to -20%; a circuit breaker by itself was not a bottom signal.
Once one hits, another follows: 6 of the 9 later circuit breakers in 2026 came within 10 trading days of the previous one
Circuit breakers did not arrive one at a time. The conclusion of this chapter is simple. Of the nine circuit breakers from the second to the tenth in 2026, six came within 10 trading days of the previous one, and four within 5 trading days. Big swings tend to persist for weeks, so after one circuit breaker, investors had to keep the next one in mind.

The left side of the figure above shows how many trading days after the previous circuit breaker each 2026 circuit breaker came. March 9 came 3 trading days after March 4, June 8 after 61, June 23 after 11, June 26 after 3, July 7 after 7, July 13 after 4, July 28 after 10, July 29 after 1, and October 15 after 51 (KRX, author’s calculation). The right side is a chart with one cell per halt: six within 10 trading days and three later.
These numbers fit a general property of volatility: a day with a big swing tends to be followed by more days with big swings. That is why circuit breakers clustered in March and in June and July, when the daily standard deviation was high, and none were triggered in August and September, when swings eased. There were also back-to-back days like July 28 and 29. In March 2020, too, there were two circuit breakers four trading days apart, on the 13th and 19th.
For investors, the meaning is clear. A big rebound the day after a circuit breaker does not mean the risk is over. KOSPI rose 3.26% the day after the June 23 circuit breaker, but three trading days later, on June 26, another circuit breaker hit. After the July 7 circuit breaker, too, the July 13 one came four trading days later. An account that bought with borrowed money can run short of collateral again at the next circuit breaker.
Of the nine later circuit breakers in 2026, six came within 10 trading days of the previous one and four within 5. Even when a rebound followed, the high-volatility stretch lasted for weeks.
Foreigners sold and individuals bought on halt days: on the 10 circuit breaker days of 2026, foreigners sold KRW 25.79 trillion and individuals bought KRW 34.01 trillion
Looking at who sold and who bought on circuit breaker days shows where the risk after the halt piled up. The conclusion of this chapter is simple. Over the ten circuit breaker days of 2026, foreigners sold a net KRW 25.79 trillion (about $19.2 billion) of KOSPI stocks, institutions also sold a net KRW 9.93 trillion (about $7.4 billion), and individuals bought a net KRW 34.01 trillion (about $25.4 billion). Individuals took the shares on the down days, so the losses from further falls and the burden of debt also piled up in individual accounts.
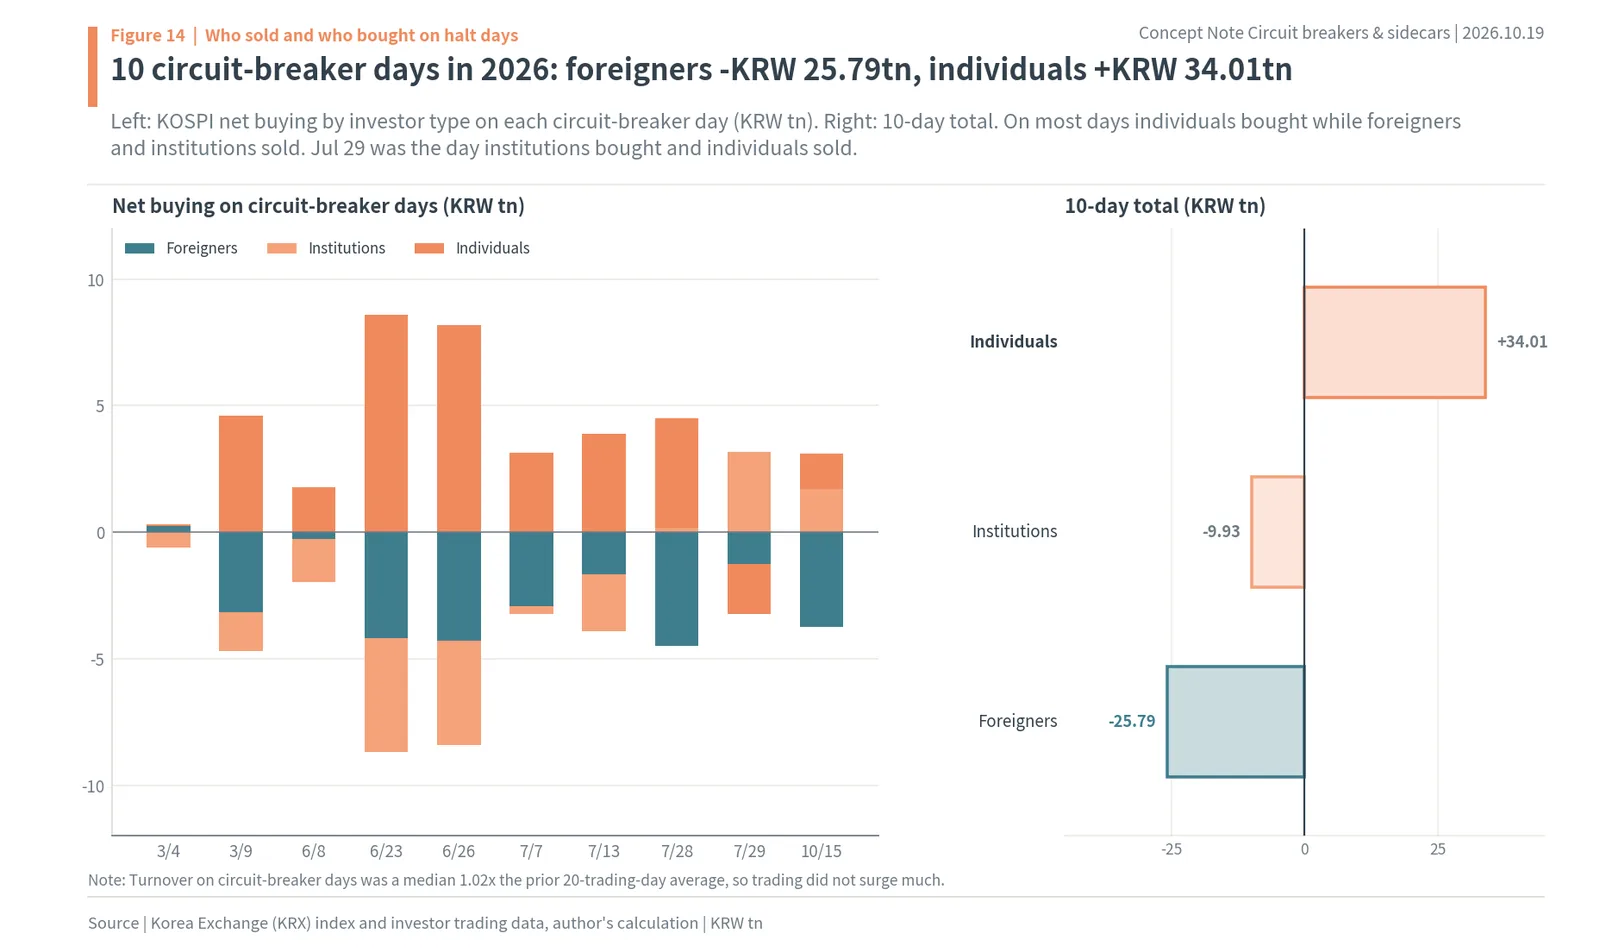
The left side of the figure above shows KOSPI net buying by investor type on each circuit breaker day (KRX, author’s count). June 23 and June 26 were the largest. On June 23 foreigners sold KRW 4.20 trillion, institutions sold 4.48 trillion and individuals bought 8.59 trillion; on June 26 foreigners sold 4.29 trillion, institutions sold 4.12 trillion and individuals bought 8.19 trillion. On July 28 foreigners sold KRW 4.50 trillion and individuals bought 4.32 trillion. The exception was July 29, when institutions bought KRW 3.18 trillion while individuals sold 1.97 trillion and foreigners 1.25 trillion. That day KOSPI recovered sharply, from -12.63% intraday to -5.98%. On March 4, net buying and selling were small for all three groups.
The right side shows the ten-day totals: individuals +KRW 34.01 trillion, institutions -9.93 trillion, foreigners -25.79 trillion. Individuals were net buyers on nearly every circuit breaker day. That means many individuals saw the falls as a chance to buy low, and it also means individuals took on the most of the further falls that followed. Trading value on circuit breaker days had a median of 1.02 times the previous 20-day average, so trading did not surge much above normal (author’s calculation). It was not that volume exploded; prices moved a lot on the same amount of trading.
This structure links to the next chapter on forced selling. Some of the shares individuals bought on circuit breaker days were bought with margin loans or unsettled purchases. If the index falls further after that, some accounts run short of collateral, and their shares are sold off the next morning. The bigger individuals’ net buying on a circuit breaker day, the bigger the volume that can come back as forced selling the next day.
The share of companies buying their own stock also shows up. In the KRX investor classification, “other corporations” are ordinary companies, and when a company buys back its own shares, the purchase is counted there. On the 2026 circuit breaker days, other corporations’ net buying was mostly around KRW 0.1 trillion, but on October 15 it was 0.65 trillion, the largest of the ten, followed by 0.29 trillion on March 4 and 0.22 trillion on June 8 and June 26 (KRX, author’s count). Trading value on circuit breaker days was largest on March 4, at KRW 62.9 trillion (1.87 times the previous 20-day average), and June 23, at 61.4 trillion (1.21 times), while July 7 at 40.7 trillion (0.87 times) and July 13 at 40.1 trillion (0.89 times) were actually below normal. Even on days with less trading, the index reached the 8% line.
Over the ten circuit breaker days of 2026, foreigners sold a net KRW 25.79 trillion, institutions 9.93 trillion, and individuals bought 34.01 trillion. The shares from the halt days, and the risk that came after, went into individual accounts.
The cost of the halt came the next morning as forced selling: an average of KRW 72.49 billion the next day, 2.03 times normal
Losses on a circuit breaker day do not end with that day’s close. For accounts that bought stock with borrowed money, forced selling waits the next morning. The conclusion of this chapter is simple. For each 2026 circuit breaker, forced selling on unsettled purchases the next trading day averaged KRW 72.49 billion (about $54.1 million), 2.03 times the average of KRW 35.74 billion (about $26.7 million) over the 20 trading days before each circuit breaker. On October 16, the day after October 15, forced selling was KRW 57.25 billion (about $42.7 million), 2.92 times the previous 20-day average of KRW 19.58 billion.

The left side of the figure above shows, for each 2026 circuit breaker, forced selling the next trading day (red) and the previous 20-day average (gray) (KOFIA, author’s calculation). Forced selling the day after the June 8 circuit breaker was KRW 169.8 billion (about $126.6 million), the largest after any circuit breaker this year. Next come KRW 110.79 billion the day after June 23, 103.79 billion the day after July 29 and 77.68 billion the day after March 4. Because the 20-day average before March 4 was KRW 12.84 billion, forced selling the next day was nearly six times normal. By contrast, the days after July 7 (KRW 28.85 billion) and July 13 (KRW 21.56 billion) were below normal.
The right side shows the average of the ten: KRW 35.74 billion for the previous 20-day average and 72.49 billion for the next trading day. These figures count only forced selling on unsettled purchases. Forced selling due to margin-loan collateral shortfalls is handled separately by each broker and is not fully captured in this data. The amount of stock actually force-sold may be larger.
The reason forced selling crowds into the next morning lies in the procedure. After the close on a day of big falls, brokers calculate the collateral ratio of each account and notify accounts that are short to post more collateral. If the money is not added by the deadline, the shares are sold at the market price in the next day’s opening auction. So the morning after a circuit breaker brings a wave of sell orders that do not care about price. Even on days when the index rose sharply after a circuit breaker, some individual accounts were cleared out in the morning without sharing in the rebound.
In October, forced selling was already rising before the circuit breaker. It grew from KRW 27.08 billion on October 12 to 59.35 billion on the 13th and 89.34 billion on the 14th, then was 80.50 billion on the 15th and 57.25 billion on the 16th (KOFIA). Accounts short of collateral began piling up on October 13, the day KOSPI fell 5.46%. The FSC chairman’s October 15 warning that “investing that relies on excessive debt and credit is risky” came on top of this trend.
A hypothetical account shows why forced selling feels bigger than the fall itself. Assume an account that buys KRW 100 million (about $74,600) of stock with KRW 50 million of its own money plus KRW 50 million of margin loans (author’s assumption). The collateral ratio is the value of the shares divided by the loan, so it starts at 200%. If the shares fall 8%, as on a circuit breaker day, they are worth KRW 92 million, the collateral ratio becomes 184%, and the investor’s own money shrinks from KRW 50 million to 42 million, down 16%. The stock fell 8%, but the investor’s money fell twice as much, 16%. If the broker’s maintenance ratio is, say, 140%, the collateral ratio reaches 140% once the shares fall 30% (author’s calculation). When circuit breakers hit two or three times within a few trading days, that distance is covered quickly. The 15 trading days from June 23 to July 13, 2026, with four circuit breakers, were exactly such a stretch.
Forced selling the day after a 2026 circuit breaker averaged KRW 72.49 billion, 2.03 times the normal KRW 35.74 billion. On October 16 it was KRW 57.25 billion, 2.92 times normal. The cost of the halt came not that day but the next morning, in accounts that had borrowed.
KOSPI sidecars in 2026: 51 through October 15, breaking the 2008 record of 26
Sidecars are triggered far more often than circuit breakers, because the threshold is lower, a 5% futures move, and because they also trigger on the way up. The conclusion of this chapter is simple. KOSPI sidecars in 2026 reached 51 by October 15, nearly double the previous record of 26 in 2008, and of the 41 through July 24, 20 were buy sidecars and 21 sell sidecars, almost an even split. The sidecar count measures the size of swings in both directions, not the fear of falling.

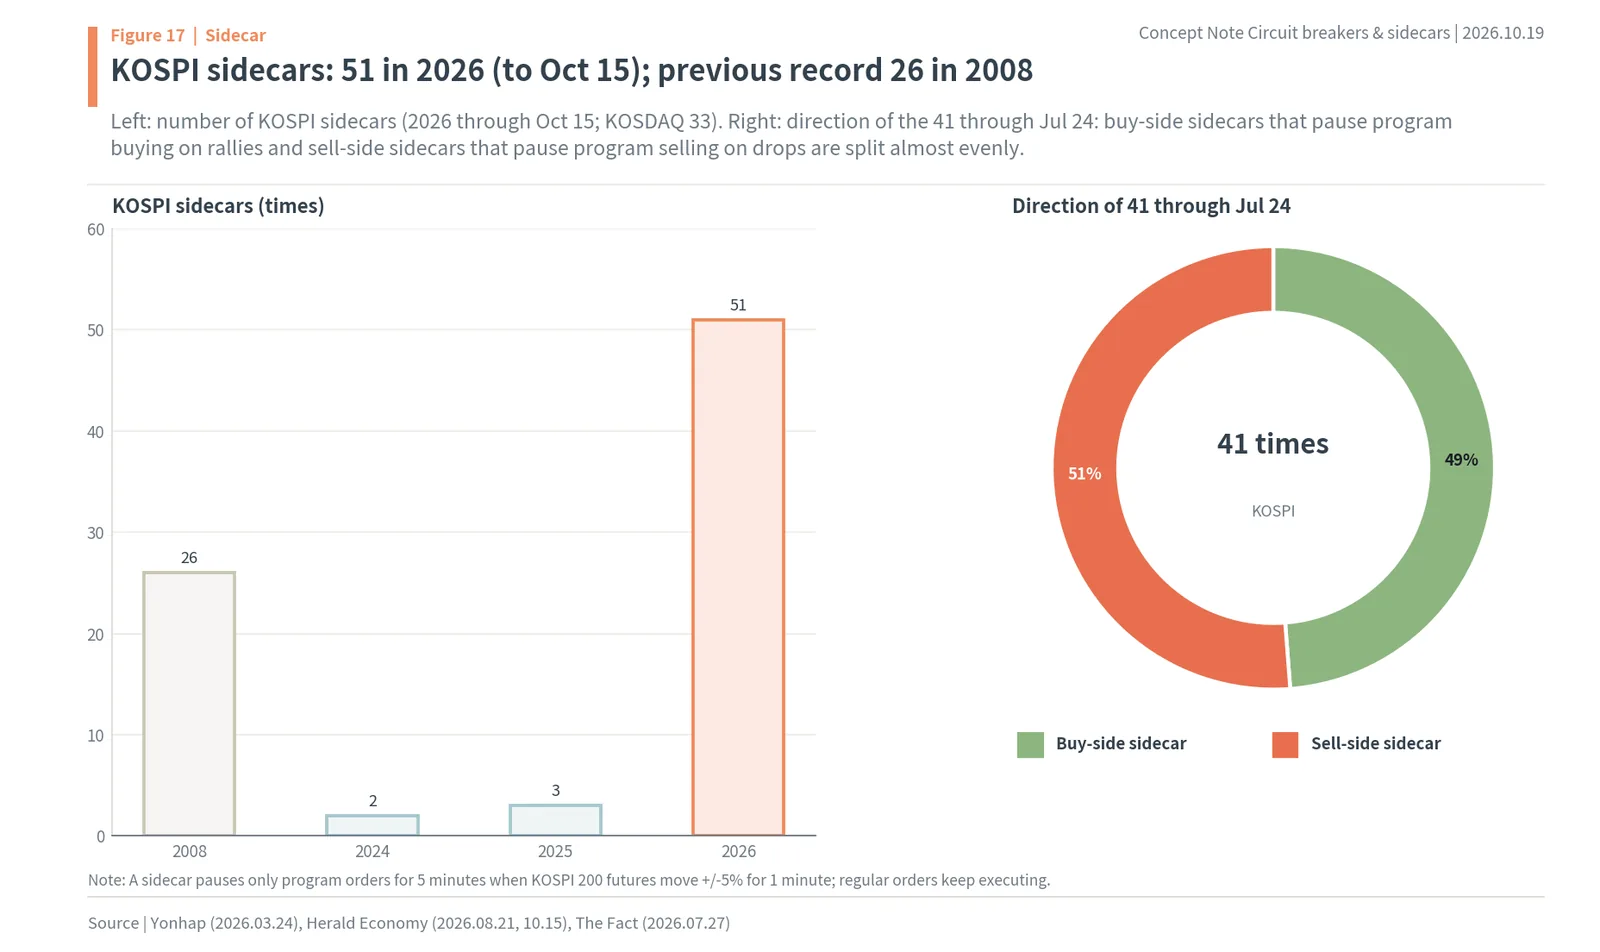
The left side of the figure above shows the number of KOSPI sidecars. The previous record was 26 during the 2008 financial crisis; there were 2 in 2024 and 3 in 2025 (Yonhap, March 24, 2026; Herald Economy, August 21, 2026). Yonhap noted that many years had none at all, such as 2005 to 2006, 2010, 2012 to 2019 and 2021 to 2023, and that the other years had 2 to 7. In 2026 there were 10 by March 23, the 26th on June 15, 41 by July 24, 49 by August 21 and the 51st on October 15 (Yonhap, Kyunghyang Shinmun, The Fact, Herald Economy). On KOSDAQ, too, October 15 brought the 33rd sidecar of the year.
The right side shows the direction of the 41 KOSPI sidecars through July 24 (The Fact, July 27, 2026): 20 buy sidecars and 21 sell sidecars. The 26 in 2008 were also 14 buy and 12 sell, with buys in the majority. A buy sidecar is triggered when a big rebound follows a big fall. March 5, the day after the March 4 circuit breaker; July 3, the day after the July 2 plunge; July 31; and October 16 on KOSDAQ were such days (Yonhap, MTN, Kyunghyang Shinmun, News Tomato).
It is also worth being clear about what a sidecar stops. A sidecar pauses program trading for 5 minutes: arbitrage that targets the price gap between index futures and the underlying basket of stocks, and orders that buy or sell many stocks at once by rules a computer follows. Orders that individuals and institutions place directly are still filled. That is why the index keeps moving after a sidecar. On October 15, the KOSPI sell sidecar was triggered around 9:07, but the index kept falling for three and a half hours afterward until the circuit breaker hit at 12:38.
Some have argued that sidecars are out of date. Herald Economy reported in an August 2026 article that Professor Kim Dae-jong of Sejong University called the sidecar an outdated system and that the US abolished sidecars in 1999. In the same article, the exchange said it was not considering specific changes to the system. The Fact wrote that the number of sidecar triggers may be an indicator of market volatility, but that it is hard to see sidecars themselves as a cause of sharp swings.
KOSPI sidecars numbered 51 by October 15, 2026, beating the 2008 record of 26. Of the 41 through July 24, 20 were buys and 21 sells, so the sidecar count shows the size of swings in both directions, not just falls.
A single stock is paused separately, by the VI (a 2-minute single-price auction) and the ±30% daily price limit
If circuit breakers and sidecars deal with the whole market, sharp moves in a single stock are handled by the volatility interruption (VI) and the daily price limit. The conclusion of this chapter is simple. The pause individual investors meet most often is not the circuit breaker but the VI. A VI can be triggered any number of times a day, and when it is, only that stock trades by single-price auction for 2 minutes.
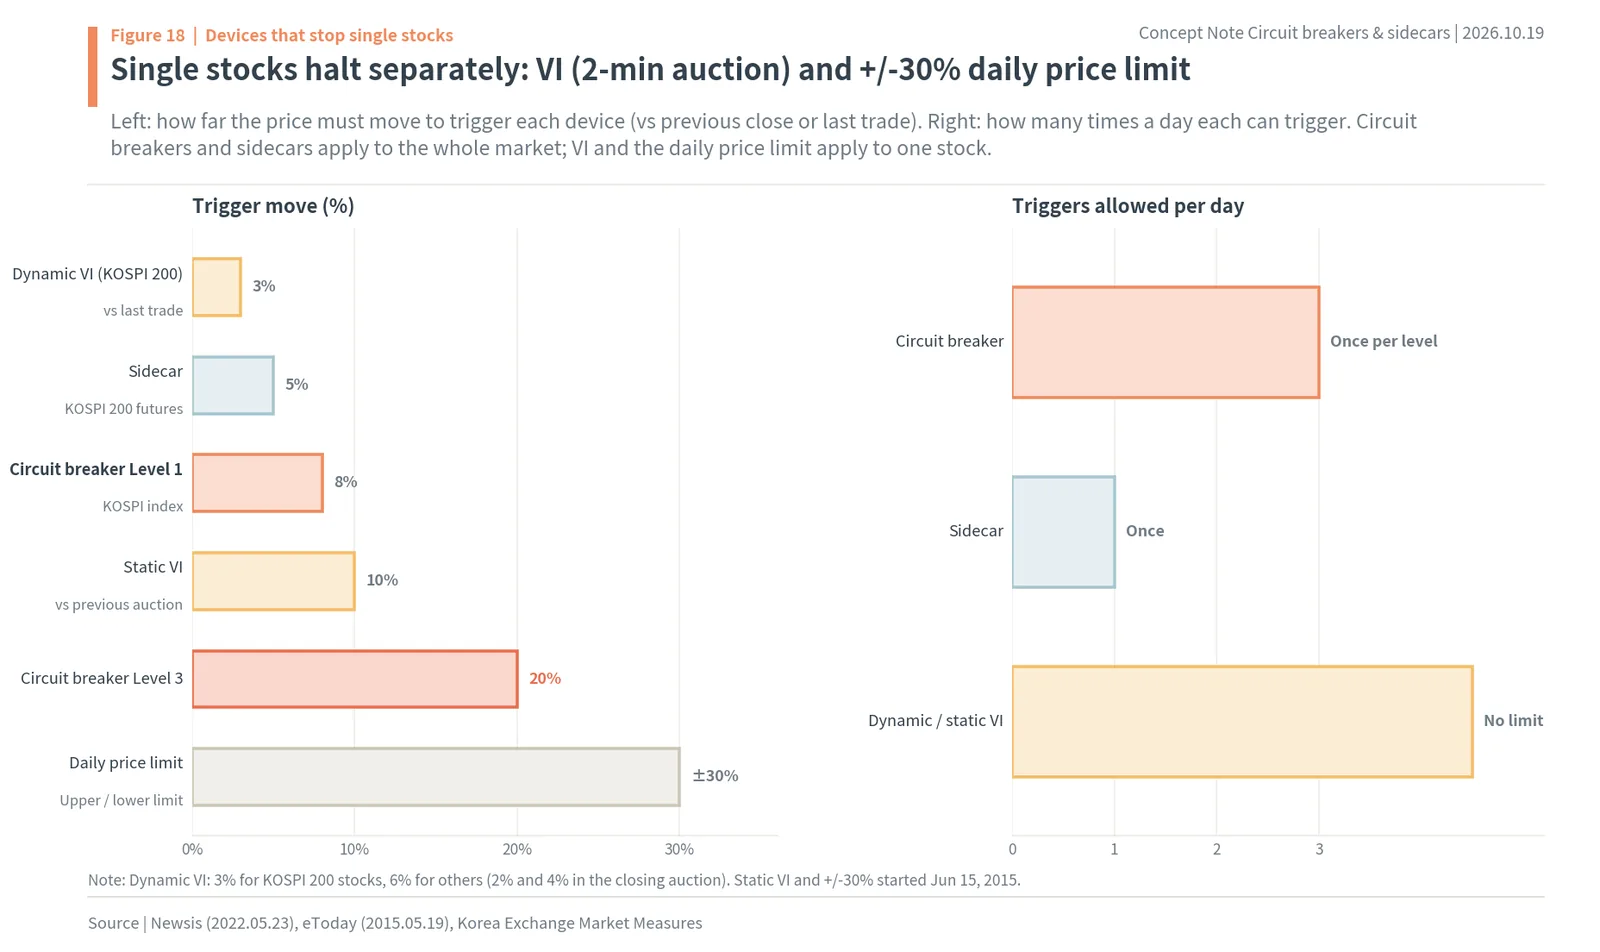
The left side of the figure above shows how far a price has to move to trigger each device. A dynamic VI is triggered when an order would move the price more than 3% from the last trade for KOSPI 200 stocks, or 6% for other stocks (2% and 4% during the closing auction). A static VI is triggered when the price moves more than 10% from the previous single-price auction price (such as the opening price). Either way, only that stock switches to single-price auction trading for 2 minutes (Newsis, May 23, 2022). The daily price limit is ±30% from the previous close, and no orders can be placed beyond it. Those are the upper and lower limits. The static VI and the ±30% price limit both started on June 15, 2015 (eToday, May 19, 2015).
The right side shows how many times a day each device can be triggered. A circuit breaker can hit once per level and a sidecar once, while the VI has no limit. That is why a stock swinging wildly can hit VIs several times in one day. When a VI is triggered, the order book in the broker’s app shows “VI triggered,” and orders placed during the 2 minutes pile up unfilled, then are filled at one price after 2 minutes.
The three devices line up by size. A 3 to 10% move in a single stock triggers a VI, a 5% futures move a sidecar, and an 8% index fall a circuit breaker. On a day when the index falls 8%, VIs have already been triggered many times in many stocks. Nextrade, which opened in March 2025, also introduced a static VI with a 2-minute single-price auction on September 14, 2026 (MTN, August 31, 2026).
A single stock is paused by the dynamic VI (3% or 6%) and static VI (10%), each a 2-minute single-price auction, and capped by the ±30% price limit. The VI can be triggered any number of times a day, making it the pause individual investors meet most often.
History of circuit breakers: born of the 1987 Black Monday, scrapped by China after four days in 2016
Korea did not invent the circuit breaker. The conclusion of this chapter is simple. Circuit breakers began in the US after Black Monday, October 19, 1987, when the Dow fell 22.6% in a day. Today the US uses 7%, 13% and 20% (15 minutes) and Korea 8%, 15% and 20% (20 minutes). In 2016, China set narrow thresholds of 5% and 7% and scrapped the system four days later. China’s lesson is that when the thresholds are too close together, the halt itself pulls prices down.

On October 19, 1987, the Dow Jones Industrial Average fell 508 points to close at 1,738 (Chicago Fed, July 1998). The one-day fall of 22.6% is still the largest in US stock market history. The Brady Commission, set up by the Reagan administration, issued its report in January 1988, and a working group made up of the heads of the Treasury, the Federal Reserve, the SEC and the Commodity Futures Trading Commission recommended halting trading for one hour if the Dow fell 250 points and for two hours if it fell 400 points. The New York Stock Exchange adopted this as Rule 80B in October 1988. A device called a “sidecar” was introduced at the same time on the Chicago Mercantile Exchange futures market, and the Korean name “sidecar” appears to come from there.
The first time the whole US market halted was October 27, 1997. When the Dow fell 350 points at 14:36, trading stopped for 30 minutes; after reopening, a 550-point fall at 15:30 closed the market early for the day. The Dow fell 7.18% that day. In its report the following year, the SEC wrote that the 550-point threshold had a strong magnet effect that made the second trigger practically inevitable, and that the early close that day appears to have been unnecessary (SEC, September 1998). The US later switched from points to percentages, and since 2013 trading halts for 15 minutes if the S&P 500 falls 7% (level 1) or 13% (level 2) before 15:25, and closes for the day at 20% (level 3) (SEC investor bulletin). During COVID-19 in March 2020, level 1 was triggered four times, on March 9, 12, 16 and 18 (Brady and Glauber, NYSE).

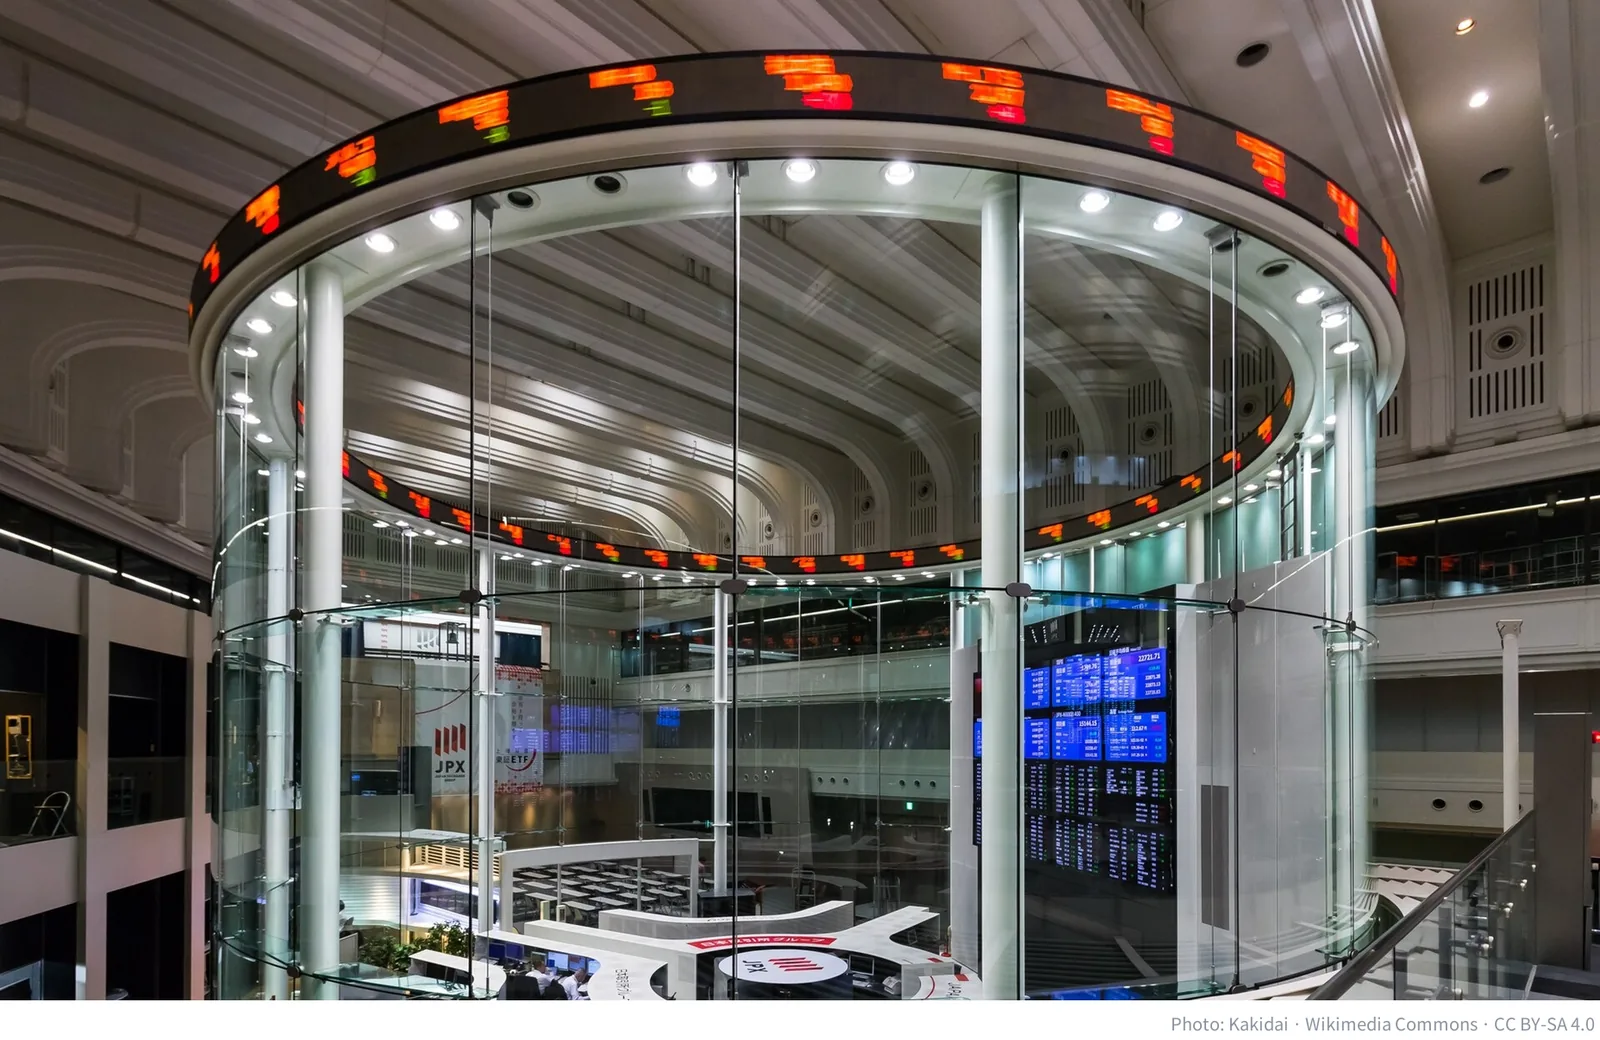
The left side of the figure above shows each country’s thresholds by level: 8%, 15% and 20% for Korea; 7%, 13% and 20% for the US; and 5% and 7% for China in 2016. The right side shows the level 1 halt time: 20 minutes plus a 10-minute single-price auction in Korea, and 15 minutes in the US and in China in 2016. Korea’s level 1 threshold is 1 percentage point wider than in the US, and its halt is 5 minutes longer. Japan’s cash market has no circuit breaker that halts the whole market, only price limits for individual stocks, while index futures on the Osaka Exchange pause for more than 10 minutes when they reach their price limit (JPX). Taiwan widened its daily price limit from 7% to 10% on June 1, 2015.
China in 2016 shows what happens when the thresholds are set too close. The rule of a 15-minute halt at a 5% fall in the CSI 300 and a close for the day at 7% started on January 4. On the first day the market halted at 5% around 13:12, reopened around 13:27, and hit 7% a few minutes later, around 13:33 to 13:34, ending the day (The TRADE, notice republished by Hong Kong Exchanges). On January 7, the market halted at 5% about 12 minutes after the open, hit 7% soon after reopening, and closed around 9:59. Excluding the 15-minute halt, actual trading time was about 14 minutes (Jiemian). That night the CSRC announced it would suspend the circuit breaker from January 8. With only 2 percentage points between 5% and 7%, investors rushed to sell before level 2 as soon as the market reopened after the level 1 halt.

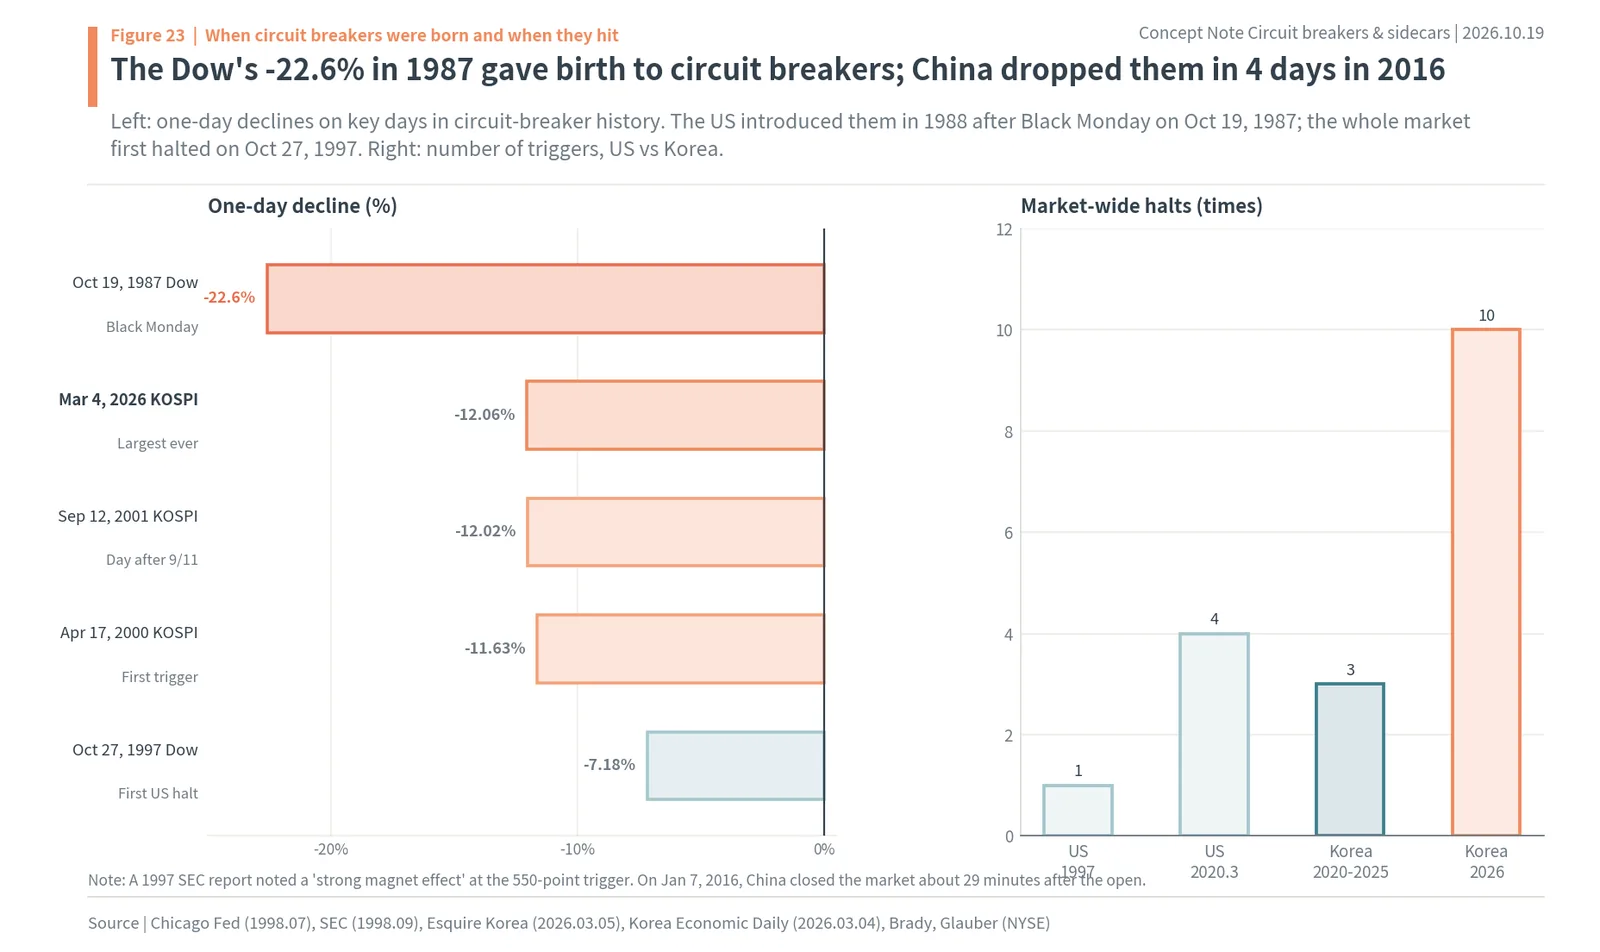
The left side of the figure above shows the one-day falls on the big days in circuit breaker history: the Dow -22.6% on October 19, 1987; KOSPI -12.06% on March 4, 2026; KOSPI -12.02% on September 12, 2001; KOSPI -11.63% on April 17, 2000; and the Dow -7.18% on October 27, 1997. The right side compares the number of market-wide halts: the US had one in 1997 and four in March 2020, while Korea’s KOSPI had three from 2020 to 2025 and ten in 2026.
Korea’s gap between levels is wider than China’s. There are 7 percentage points between level 1 at 8% and level 2 at 15%, and level 2 also requires the index to be 1% below the level 1 trigger. This year’s deepest intraday lows were -12.65% on March 4 and -12.63% on July 29, and even then level 2 at 15% was still 2.35 and 2.37 percentage points away (author’s calculation). The Chinese pattern of level 2 following right after level 1 did not happen in Korea.
Circuit breakers began in the US after the Dow’s -22.6% in 1987. Today the US uses 7%, 13% and 20% and Korea 8%, 15% and 20%. China in 2016 set a narrow gap of 5% and 7%, saw level 2 follow right after level 1, and scrapped the system after four days.
How the numbers in this report were made: calculated from daily index data, with intraday times checked against news reports
This chapter explains where the numbers in this report came from and what they could not capture. The conclusion of this chapter is simple. Circuit breaker dates and times were checked against news reports; percentage changes, lows, flows and forced selling were calculated from KRX and KOFIA daily data; and minute-by-minute intraday moves are not included in this report.
Circuit breaker dates were checked against news reports. The six KOSPI circuit breakers before 2026 (April 17, 2000; September 18, 2000; September 12, 2001; March 13, 2020; March 19, 2020; August 5, 2024) and the ten on KOSDAQ were matched by checking that the count phrases in Newsis, Kuki News, Seoul Shinmun and Money Today (“the fifth ever,” “the tenth”) were consistent with each other. October 24, 2008 was a day when only KOSDAQ halted, not KOSPI, so it was left out of the KOSPI list. The ten in 2026 were confirmed by the “Nth this year” phrases in Herald Economy, Dailian, YTN and Segye Ilbo and by whether the intraday low in KRX index data went past -8%.
Percentage changes, intraday lows and next-day returns were calculated from KOSPI daily closes, highs and lows in the KRX Data System (January 2003 to October 19, 2026). The intraday low change is that day’s low divided by the previous close. So daily data alone cannot tell whether the day’s low came before or after the circuit breaker. When the low is below the trigger level, as on October 15 (5,528.05), it is taken to have come after reopening. Next-day and 20-trading-day returns are close to close. The days with falls of more than 5% without a circuit breaker are the 14 days since June 15, 2015 with a close of -5% or worse, excluding circuit breaker days.
Flows are KRX trading by investor type (KOSPI; foreigners are foreigners plus other foreigners, and institutions are financial investment, insurance, investment trusts, private funds, banks, other financial institutions and pension funds combined). Forced selling is KOFIA’s figure for forced selling on unsettled purchases and does not include forced selling on margin loans. The normal level against which next-day forced selling is compared is the average of the 20 trading days before each circuit breaker day. The count of ±5% days and the standard deviations were calculated from KOSPI close-to-close changes, and 2026 runs through October 19.
Sidecar counts were checked only against news reports, because KRX does not publish annual statistics directly. The 51st KOSPI and 33rd KOSDAQ sidecars on October 15, 2026 are from Herald Economy; the buy/sell split of the 41 through July 24 is from The Fact; and the 26 in 2008 and the counts for 2024 and 2025 are from Yonhap and Herald Economy. The buy/sell split as of October and whether a sidecar hit on October 19 could not be confirmed, so they are not used. The Samsung Electronics and SK hynix weights are common-share market cap divided by KOSPI market cap.
Circuit breaker dates come from the counts in news reports, and percentage changes, flows and forced selling were calculated from KRX and KOFIA daily data. Minute-by-minute intraday moves and margin-loan forced selling are not included in this report.
Six steps to apply to your own account: check the level and the time, sort out your orders, and prepare for the next morning
On a circuit breaker day, the individual investor’s job is not to guess the index but to check whether their account can hold up over the days that follow. The conclusion of this chapter is simple. Check the level and the time, sort out the orders you can place during the 20-minute halt (cancellations), look at your collateral ratio and the chance of forced selling the next day, and factor in that another circuit breaker may come within 10 trading days. Applied to October 15: level 1, 12:38, cancellations only, 5.71 percentage points to level 2, next-day forced selling at 2.92 times normal, and another halt within 10 trading days in 6 of 9 cases.
Step 1 is to check which level it is. If it is a sidecar, only program orders are paused for 5 minutes and your own orders are still filled. If it is a level 1 or level 2 circuit breaker, the market halts for 20 minutes and reopens with a 10-minute single-price auction. If it is level 3, the day is over. October 15 was level 1.
Step 2 is the time. Levels 1 and 2 cannot be triggered after 14:50, so if the index falls sharply late in the afternoon, prices move all the way to the close without a halt. Conversely, if the halt comes in the morning or around lunchtime, a long stretch of trading remains after reopening. On October 15 the halt came at 12:38, and trading continued for more than two hours after reopening.
Step 3 is your orders during the halt. During a 20-minute level 1 or level 2 halt, you cannot place new orders; you can only cancel existing ones. If you placed limit buy orders before the plunge, they may be filled at an unwanted price in the single-price auction after reopening, so decide within those 20 minutes whether to keep or cancel them. In the 10-minute single-price auction at reopening, the orders that piled up during the halt are filled at one price.
Step 4 is the distance to the next level. The level 2 line at 15% is the previous close multiplied by 0.85. On October 15, there were 5.71 percentage points between the intraday low of -9.29% and 15%. Even on March 4, the deepest day this year, 2.35 percentage points remained, and levels 2 and 3 have not been triggered once since 2015.
Step 5 is your account’s collateral ratio and the next morning. If you hold shares bought with margin loans or unsettled purchases, check the collateral ratio at that day’s close in your broker’s app, and check the deadline for posting extra collateral. Forced selling the day after a 2026 circuit breaker averaged 2.03 times normal, and on October 16 it was 2.92 times. If collateral is short, the shares are sold at the next morning’s opening auction regardless of price.
Step 6 is the next circuit breaker. Of the nine later circuit breakers in 2026, six came within 10 trading days of the previous one. If you increase your borrowing again after a big rebound the next day, the same thing can happen to you at the next circuit breaker. Check whether the high-volatility stretch has ended by watching whether the daily range is shrinking.
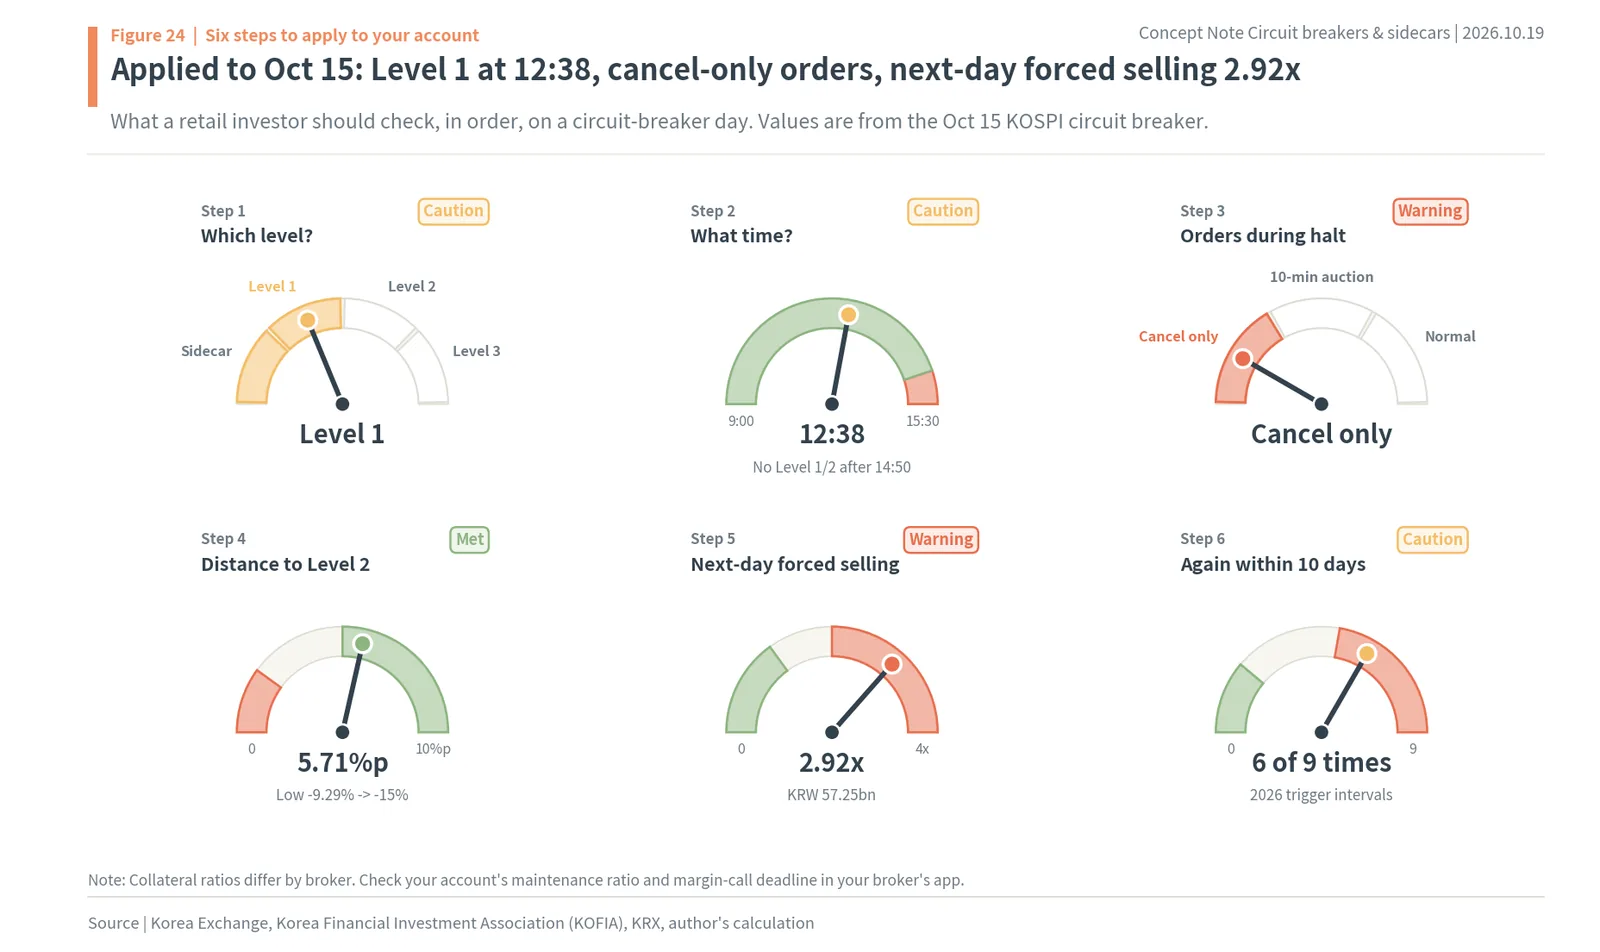
The figure above applies these six steps to the October 15 KOSPI circuit breaker: step 1 “level 1,” step 2 “12:38,” step 3 “cancel only,” step 4 “5.71 percentage points to level 2,” step 5 “next-day forced selling 2.92 times normal (KRW 57.25 billion),” and step 6 “another halt within 10 trading days in 6 of 9.” The needles sit in the red zone for steps 3 and 5: the only thing you can do during the halt is cancel, and next-day forced selling was nearly three times normal.
On a circuit breaker day, check the level and the time, sort out your standing orders during the 20-minute halt, and check your collateral ratio and the next morning’s forced selling. And build into the size of your debt the chance that, as in 2026, another halt comes within 10 trading days.
마오채둥 정리. A circuit breaker halts the whole market for 20 minutes when KOSPI has been down 8% for one minute and reopens it with a 10-minute single-price auction; a sidecar pauses only program orders for 5 minutes when futures move 5%. Neither props up prices; both buy time. In 2026, KOSPI moved more than ±5% in a day on 37 days, more than the previous 22 years combined, and as a result circuit breakers were triggered ten times. After the halt, five closes came back above the 8% line and five fell further, and six of nine later halts came within 10 trading days of the previous one. Seen in daily data, the 8% line’s magnet effect was not clear. The cost of the halt showed up the next morning as forced selling, at 2.03 times normal. So what to watch on a circuit breaker day is not the index but the debt in your own account and the next morning.
Korea stock market circuit breaker FAQ
Q. When does the KOSPI circuit breaker trigger?
When the KOSPI falls 8% (Level 1), 15% (Level 2) or 20% (Level 3) from the previous close and stays there for one minute. Level 2 and 3 also need a further 1% drop from the previous level’s trigger. Levels 1 and 2 halt all KOSPI stocks and linked futures and options for 20 minutes, followed by a 10-minute single-price auction; Level 3 ends trading for the day. Levels 1 and 2 are not triggered after 14:50.
Q. What is a sidecar in the Korean stock market?
A sidecar pauses program trading orders for 5 minutes when the front-month KOSPI 200 futures contract moves 5% from its reference price for one minute. Orders entered by people keep trading. A sell-side sidecar fires on drops and a buy-side sidecar on rallies. On KOSDAQ it needs a 6% move in KOSDAQ 150 futures and a 3% move in the KOSDAQ 150 index.
Q. How many times did KOSPI trigger a circuit breaker in 2026?
Ten times through Oct 19, 2026 (Mar 4, Mar 9, Jun 8, Jun 23, Jun 26, Jul 7, Jul 13, Jul 28, Jul 29 and Oct 15), all at Level 1. From its 1998 introduction to 2025 there were six. KOSDAQ halted five times in 2026.
Q. Do circuit breakers stop a market crash?
Not in the 2026 KOSPI data. Of the 10 halts, 5 days closed back above the 8% line and 5 closed below it, and 6 of 9 later halts came within 10 trading days of the previous one. Daily data did not show a clear magnet effect either: 73.3% of days that passed -7% reached -8%, close to the 70.0% that went from -5% to -6%.
Q. What happens to margin accounts after a circuit breaker day?
Accounts whose collateral falls short are force-sold at the next morning’s opening auction. In 2026, forced selling of unpaid margin purchases on the day after a circuit breaker averaged KRW 72.49 billion (about $54.1 million), 2.03 times the prior 20-day average (author’s calculation from KOFIA data).
Sources
- Korea Exchange, Market Measures (circuit breaker rules) (link)
- KRX Data System, daily KOSPI and KOSDAQ indexes, trading by investor type, market caps (via pykrx), as of Oct 19, 2026
- Korea Financial Investment Association statistics, forced selling on unsettled purchases (link), as of Oct 16, 2026
- Herald Economy, KOSPI, once at 9,000, halts again on an 8% plunge (link), Oct 15, 2026
- Nocut News, KOSPI and KOSDAQ circuit breakers (link), Oct 15, 2026
- Newsis, “Black Thursday” 8% plunge (link), Oct 15, 2026
- Smart Today, KOSPI close and FSC emergency meeting (link), Oct 15, 2026
- News Tomato, KOSDAQ buy sidecar (link), Oct 16, 2026
- SBS Biz, Circuit breaker reopening procedure (link), Oct 15, 2026 / Nextrade halts with KRX (link), Mar 7, 2025
- Korea Economic Daily, KOSPI’s largest percentage fall on record (link), Mar 4, 2026
- Kuki News, March 4 circuit breaker (link), Mar 4, 2026 / August 5, 2024 (link)
- Segye Ilbo and Yonhap, Circuit breakers two days in a row (link), Jul 29, 2026
- Yonhap, 10 sidecars this year (link), Mar 24, 2026
- The Fact, 66 sidecars (link), Jul 27, 2026
- Herald Economy, Debate over the sidecar system (link), Aug 21, 2026
- Newsis, Changes in sidecar thresholds (link), Apr 7, 2026 / March 13, 2020 (link)
- Newsis, VI rules (link), May 23, 2022
- eToday, ±30% price limit and static VI (link), May 19, 2015
- Bizwatch, Three-level circuit breaker overhaul (link), Nov 26, 2014
- Ministry of Economy and Finance glossary, Circuit breaker (link)
- Seoul Shinmun, KOSDAQ’s seventh circuit breaker (link), Feb 12, 2016
- Money Today, KOSDAQ circuit breaker (link), Aug 8, 2011
- Esquire Korea, Table of past circuit breakers (link), Mar 5, 2026
- Maeil Shinmun, September 18, 2000 circuit breaker (link), Sep 18, 2000
- TokenPost, Levels 2 and 3 never triggered (link), Jul 29, 2026
- AlphaSquare, Returns after circuit breakers (Kiwoom Securities, FnGuide) (link), Jun 24, 2026
- MTN, Nextrade static VI, Aug 31, 2026
- Beijing Daily (republished by China News Service), CSRC spokesperson on suspending the circuit breaker (link), Jan 8, 2016
- People’s Daily Overseas Edition, Circuit breaker suspended (link), Jan 8, 2016
- Jiemian, January 7 circuit breaker (link), Jan 7, 2016
- The TRADE, Circuit breakers halt Chinese trading on first day (link), Jan 4, 2016
- Federal Reserve Bank of Chicago, Chicago Fed Letter No. 131 (link), Jul 1998
- SEC, Trading Analysis of October 27 and 28, 1997 (link), Sep 1998
- SEC, Investor Bulletin: Measures to Address Market Volatility (link)
- Nicholas Brady and Robert Glauber, Circuit Breakers Are Doing Their Job (link), Mar 2020
- Xiang and Lu (2023), International Journal of Finance & Economics / Chen, Petukhov, Wang and Xing (2024), The Dark Side of Circuit Breakers, Journal of Finance / Du, Liu and Rhee (2009), International Review of Finance / Subrahmanyam (1994), Journal of Finance
- Photos: Larry Qian, “Shanghai Lujiazui night skyline 2017”, CC0; hyolee2, “Korea exchange”, CC BY-SA 3.0; 4300streetcar, “SK Hynix DDR5 Tall MRDIMM”, CC BY 4.0; Joe Ravi, “Chicago Board Of Trade Building”, CC BY-SA 3.0; Carol M. Highsmith, “Trading Floor, New York Stock Exchange”, public domain; Kakidai, “The Tokyo Stock Exchange – main room 2”, CC BY-SA 4.0; Luoding (螺钉), “Shanghai Stock Exchange Building at Pudong”, CC BY-SA 3.0 (all Wikimedia Commons)
Was this note useful?
Thanks. Your answer helps decide what to cover next.
Korea market snapshot · Oct 23, 2026
New to Korean stocks? Start here for the basics.
Most read
1France Protests 2026: Why Students Are Blocking Schools and Which Stocks Benefit (Munich Re, SCOR)
Get the Saturday note on Korean stocks
One email every Saturday with the week’s new research on Korean listed companies and links to the updated data pages. Built from DART filings and KRX data. Free; unsubscribe in one click. See past issues