Sebang Global Battery (004490.KS) and US ESS Stocks: The US-China Summit Left the Battery Wall Standing, and Sebang’s New US Sales Equal 0.95x Its Market Cap
The summit changed nothing for batteries, so the money goes to plants on US soil. The September 24, 2026 US-China summit extended the trade truce and cut tariffs on $30bn of consumer goods, but left batteries out. This report measures the tariff, tax credit and executive-order walls around US energy storage, follows the money to the US cell plants of LG Energy Solution and Samsung SDI and the pack assemblers next to them, and ranks Korean US ESS stocks by revenue against market cap. Numbers as of October 13, 2026.
- The September 24 US-China summit extended the trade truce to January 10, 2027 and cut tariffs on $30bn of consumer goods; batteries were left out, so Chinese ESS batteries still pay 40.9% (Korean 12.5%, US-made 0%).
- Cells are 52% of a grid-scale ESS’s cost, so an ESS with Chinese cells has a 48% non-Chinese share, short of the 55% needed for the 2026 investment tax credit; the gap widens 5pp a year to 27pp in 2030 (author’s calculation).
- US ESS installs grow from 59GWh to 71GWh in 2026; US-soil ESS cells are LG Energy Solution’s 47GWh and Samsung SDI’s 20GWh, and the 45X credit of KRW 60.2bn per GWh was 55.1% of LG Energy Solution’s Q3 operating profit.
- The bottleneck moved from cells to packs: Sebang Global Battery assembles LG Energy Solution ESS packs in Ohio for KRW 800bn a year, 0.95x its market cap, vs 0.18x for LG Energy Solution and 0.14x to 0.18x for Samsung SDI.
- Sebang trades at 4.6x 2027 PER (EPS KRW 13,131) vs Samsung SDI 31.5x and LG Energy Solution 50.3x; at its 6.4x average PER the price is KRW 84,000 (+38.4%). Next checks: Oct 29, Nov 3, Nov 16, Dec 24 and Jan 10.
Key takeaways
- The September 24 US-China summit in Washington produced a two-month extension of the trade truce and tariff cuts on $30bn of non-sensitive goods, and batteries were left off that list. The 40.9% US tariff on Chinese ESS batteries (12.5% on Korean ones) and the FEOC rule that strips the investment tax credit from projects using Chinese cells both stay in place.
- So US energy storage is moving to non-Chinese cells made on US soil. Making cells and modules in the US earns a production tax credit of about KRW 60.2bn (about $45mn) per GWh, and that credit was 55.1% of LG Energy Solution’s KRW 756.0bn (about $565mn) third-quarter operating profit.
- As cell output grew, the bottleneck moved to packs. Sebang Global Battery, which assembles LG Energy Solution’s ESS modules and packs in Ohio, ranks first with annual US ESS revenue equal to 0.95x its market cap, and trades at 4.6x PER on 2027 EPS of KRW 13,131 (about $9.8).
As of: October 13, 2026
Ticker: Sebang Global Battery (004490.KS), Samsung SDI (006400.KS), LG Energy Solution (373220.KS), SK Innovation (096770.KS), Seojin System (178320.KQ), Shinheung SEC (243840.KQ), Sangsin EDP (091580.KQ), Shinsung ST (416180.KQ), Hanjung NCS (107640.KQ), L&F (066970.KS), DI Dongil (001530.KS), Sam-A Aluminium (006110.KS) and others
Reference close: KRX close on October 13, 2026 (LG Energy Solution, Samsung SDI, SK Innovation and Sebang Global Battery from the KRX Data System; the rest from Yahoo Finance KRX regular-session closes). KRW 1,337.7 per dollar on October 13 (Yahoo Finance).
This is the author’s personal analysis and view. The author’s calculations and estimates are not confirmed facts.
Summary: US ESS stocks after the US-China summit, and why Sebang Global Battery ranks first
This report asks one question. The US and China met with great fanfare, but if nothing changed for batteries, where does the money for supplying energy storage systems (ESS) to the US go? And where is that money largest relative to the size of the company, that is, its market capitalization?
Some Korea-specific background first. The KOSPI is the main board of the Korea Exchange (KRX) and its benchmark index; the KOSDAQ is the exchange’s growth-company board. Yahoo-style tickers end in .KS for KOSPI stocks and .KQ for KOSDAQ stocks. DART is Korea’s electronic disclosure system, where listed companies file their reports. Korea counts large sums in units of 100 million won (eok, so KRW 100mn) and one trillion won (jo); this report shows them as KRW bn and KRW tn. Dollar figures use KRW 1,337.7 per dollar, the October 13, 2026 rate (Yahoo Finance).
The first answer is US soil. The White House summit on September 23 and 24 ended with a two-month extension of the trade truce, from November 10, 2026 to January 10, 2027, and mutual tariff cuts on about $30bn of non-sensitive goods. Semiconductors, electric vehicles and batteries were left off the list the White House released. As a result, a Chinese-made lithium-ion battery for ESS pays 40.9% when it enters the US: a 3.4% base tariff, a 25% Section 301 tariff and a 12.5% forced-labor Section 301 tariff. A Korean-made battery pays 12.5%, and a cell made on US soil pays 0%. The higher wall is the tax credit. An ESS project starting construction in 2026 must have at least 55% of its cost unrelated to “prohibited foreign entities” (PFE) to claim the investment tax credit, and because cells are 52% of the cost of a grid-scale ESS, using Chinese cells drops the non-Chinese share to 48%, short of the bar (author’s calculation). The moment a US developer uses Chinese cells, it loses a tax credit that covers a large share of project cost.
The second answer is next to the cell plants. US ESS installations grow from 59GWh in 2025 to 71GWh in 2026, and China’s share of US lithium-ion battery imports fell from 84.8% in the first quarter of 2025 to 66.5% in the second quarter of 2026. More than 80% of the US ESS cells that qualify for the tax credit belong to Korean companies, and the Korean companies running ESS cell plants at scale on US soil are LG Energy Solution (four US plants, 47GWh) and Samsung SDI (20GWh in Indiana, 30 to 35GWh by end-2027). Making cells and modules in the US earns a production tax credit (45X) of $45 per kWh, about KRW 60.2bn per GWh. LG Energy Solution’s credit rose from KRW 189.8bn in the first quarter to KRW 416.9bn in the third, 2.2 times as much. As cell plants grew quickly, the bottleneck moved from cells to the step that bundles cells into modules, packs and containers. The money flows to the companies doing that work next to the cell plants.
The third answer is this report’s conclusion. Dividing annual revenue tied to US ESS by market cap, Sebang Global Battery comes out highest at 0.95x. Sebang Global Battery is a lead-acid car battery maker known for its Rocket brand, and its subsidiary Sebang Lithium Battery assembles LG Energy Solution’s US ESS modules and packs in Jeffersonville, Ohio. The company’s IR materials give annual revenue of KRW 800bn (about $598mn), cumulative revenue of KRW 1.8tn (about $1.35bn) through 2028, and first shipments in the fourth quarter of 2026. A company with a market cap of KRW 841.3bn (about $629mn) is building new revenue on US soil almost equal to its market cap. Even at a 4% operating margin (iM Securities’ estimate), the profit is 3.8% of market cap, more than the 2027 ESS operating profit estimates for Samsung SDI (3.0% to 3.3%) and LG Energy Solution (2.7%) divided by their market caps.
Yet the share price has priced in almost none of this gain. Sebang Global Battery is down 3.5% over one year, 71.9 percentage points behind the KOSPI (+68.4%), and in the three weeks after the summit it rose 2.4% while LG Energy Solution rose 16.6%. On EPS of KRW 13,131, iM Securities’ 2027 net profit to owners of KRW 182.0bn divided by 13.86mn shares, the PER is 4.6x. On the same 2027 forward EPS basis, Samsung SDI trades at 31.5x on KRW 17,797 and LG Energy Solution at 50.3x on KRW 8,159. The author ranks them by the biggest gain against market cap and the cheapest price: Sebang Global Battery, then Samsung SDI, then LG Energy Solution.
This report follows that chain in order. It first defines terms, uses a timeline to show what the summit changed and what it left alone, and measures the three walls of tariffs, tax credits and an executive order in numbers. It then looks in turn at US ESS demand and US cell plants, the money earned by making in the US, and the bottleneck that moved from cells to packs, takes apart the business and earnings of Sebang Global Battery, which handles that bottleneck, and ends with the ranking against market cap and valuation.
Key terms: ESS cells, Section 301, 45X AMPC and FEOC explained ($45 per kWh, 52% of cost)
An ESS stores electricity in batteries and releases it when needed. It shifts power that only comes during the day, such as solar, into the night, or holds up a data center when it suddenly draws a lot of power instead of the grid. There are two reasons this equipment is growing fast in the US. As renewables grow, the grid needs equipment to smooth out its ups and downs, and AI data centers want power they can use right away without waiting for a grid connection. The ESS in this report is mostly grid-scale ESS attached to the power grid and to data centers.
A grid-scale ESS is built in four steps. The smallest unit is the cell; US ESS mainly uses lithium iron phosphate (LFP) cells. Bundling several cells and adding a battery management system (BMS) and cooling makes a module, and bundling modules makes a pack (rack). Putting packs into a container and adding power conversion and thermal management equipment makes the finished ESS installed on site. In the cost table the IRS published for tax credit calculations (Notice 2025-08), cells are 52.0% of the cost of a grid-scale ESS. The remaining 48% is items outside the cell, such as the container enclosure (14.8%), pack production (8.0%), BMS (7.4%), pack packaging (5.6%) and thermal management (5.6%).
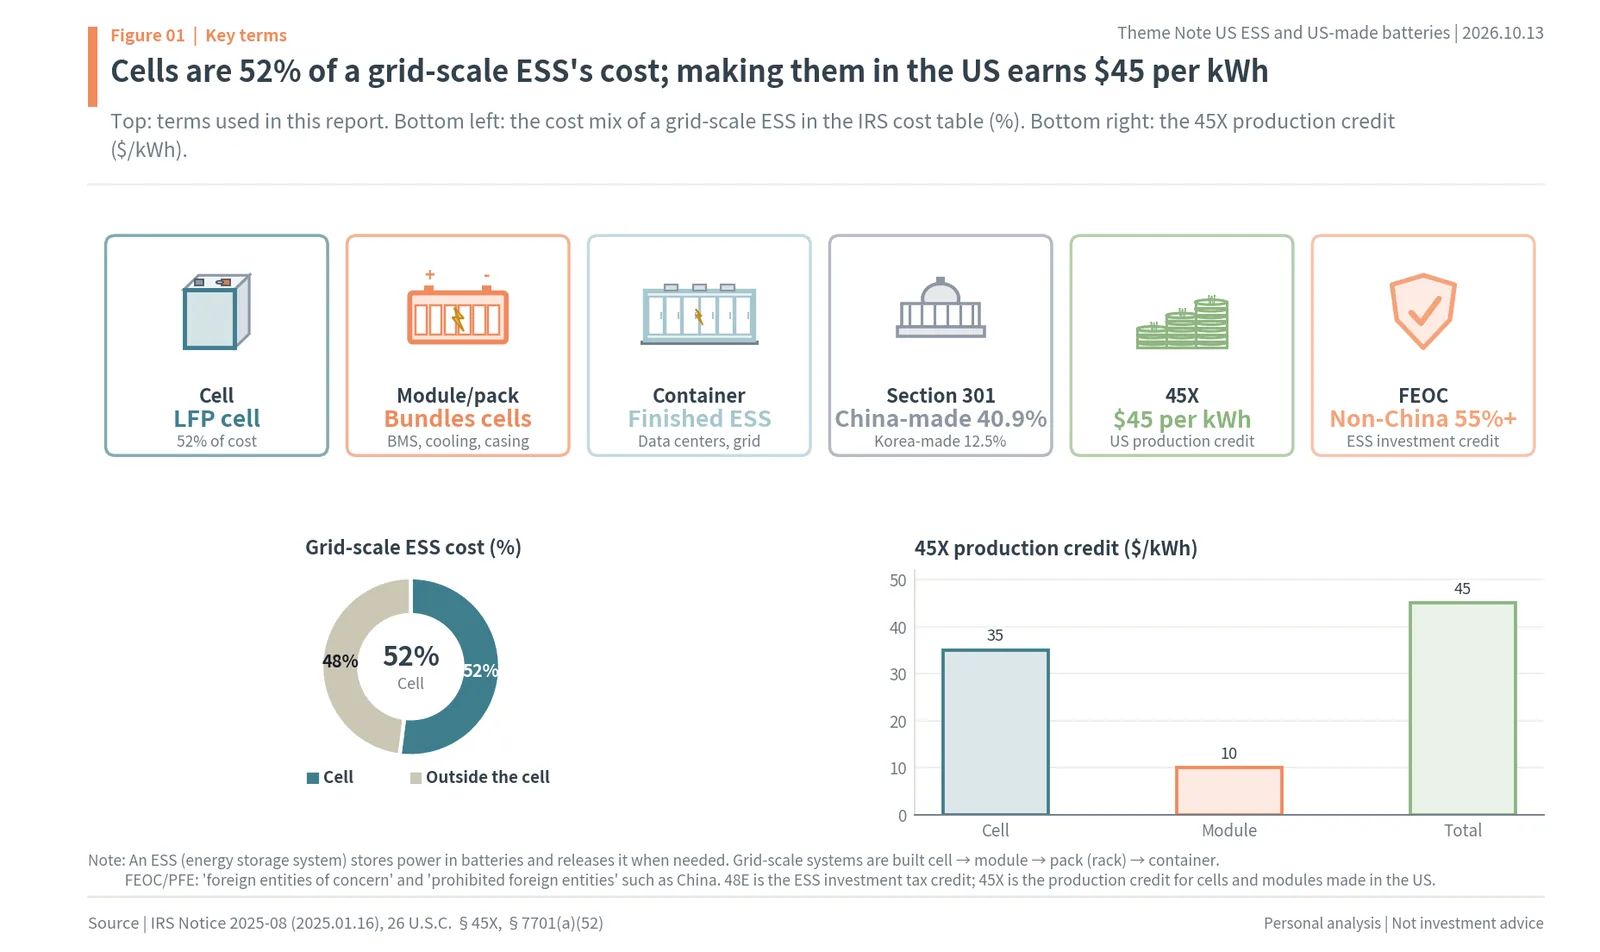
The top row of Figure 01 gathers the terms used throughout this report as pictures. Cells, modules and packs, and containers are the products; Section 301 tariffs, 45X and FEOC are the rules attached to those products when they enter the US or are made in the US. The donut at bottom left shows the 52% share of cells in the IRS cost table, and the bars at bottom right show the size of the 45X production tax credit.
Section 301 tariffs are tariffs the Office of the US Trade Representative imposes under Section 301 of the Trade Act to counter China’s unfair trade practices. Lithium-ion batteries for ESS have carried 25% since January 1, 2026. From July 24, 2026 a separate Section 301 tariff over forced labor was added for several trading partners: for Chinese goods, 12.5% is added on top of the existing Section 301 tariff, and Korean goods pay 12.5% including the base tariff.
45X is the production tax credit for battery components made in the US. Cells earn $35 per kWh and modules $10 per kWh, so making both cells and modules in the US earns $45 per kWh. The credit is paid in full on sales through 2029, then falls to 75% in 2030, 50% in 2031 and 25% in 2032, and ends in 2033. The “AMPC” (Advanced Manufacturing Production Credit) that Korean battery makers talk about in their earnings releases is this credit.
FEOC and PFE refer to “foreign entities of concern” and “prohibited foreign entities” such as China. The tax law signed on July 4, 2025 (the One Big Beautiful Bill Act, OBBBA) attached a condition called the “material assistance cost ratio” (MACR) to the ESS investment tax credit (48E) and to 45X. The credit is granted only if the share of a project’s or component’s cost unrelated to prohibited foreign entities exceeds a threshold. For the ESS investment credit, the threshold rises from 55% for projects starting construction in 2026 by 5 percentage points a year to 75% in 2030; for 45X battery components, it rises from 60% for 2026 sales to 85% in 2030. What this report calls the “non-Chinese share” is this ratio.
US-China summit: a two-month truce extension, and batteries left off the $30bn tariff-cut list
The September summit in Washington looked grand but changed nothing for batteries. President Xi Jinping arrived at Joint Base Andrews on the evening of September 23, the summit was held at the White House on the morning of September 24, and the three-day state visit ended that day. Two results remain. One is the extension of the trade truce. Treasury Secretary Scott Bessent said the truce deadline was extended by two months, from November 10, 2026 to January 10, 2027, and China’s Ministry of Commerce extended its suspension period to the same date. The other is a mutual tariff cut on about $30bn of non-sensitive goods. The US cuts the White House announced covered consumer goods such as small appliances, toys, holiday decorations and child car seats.
Batteries were not on that list. After the list was released, ABC News4 reported that semiconductors, electric vehicles and batteries were not included. Rare earths were not resolved either. The US government said China was not fully honoring its rare-earth supply agreement, and tariffs, purchases, rare earths and technology controls were pushed to the next meeting. The two leaders meet again at APEC in Shenzhen in mid-November and at the G20 in Miami in mid-December. Korean media summed up the summit as a full-course state dinner with a two-month deal (Dailian). Put simply, the US and China had one big bout in the ring, but the decision was postponed and the fence around batteries stayed in place.
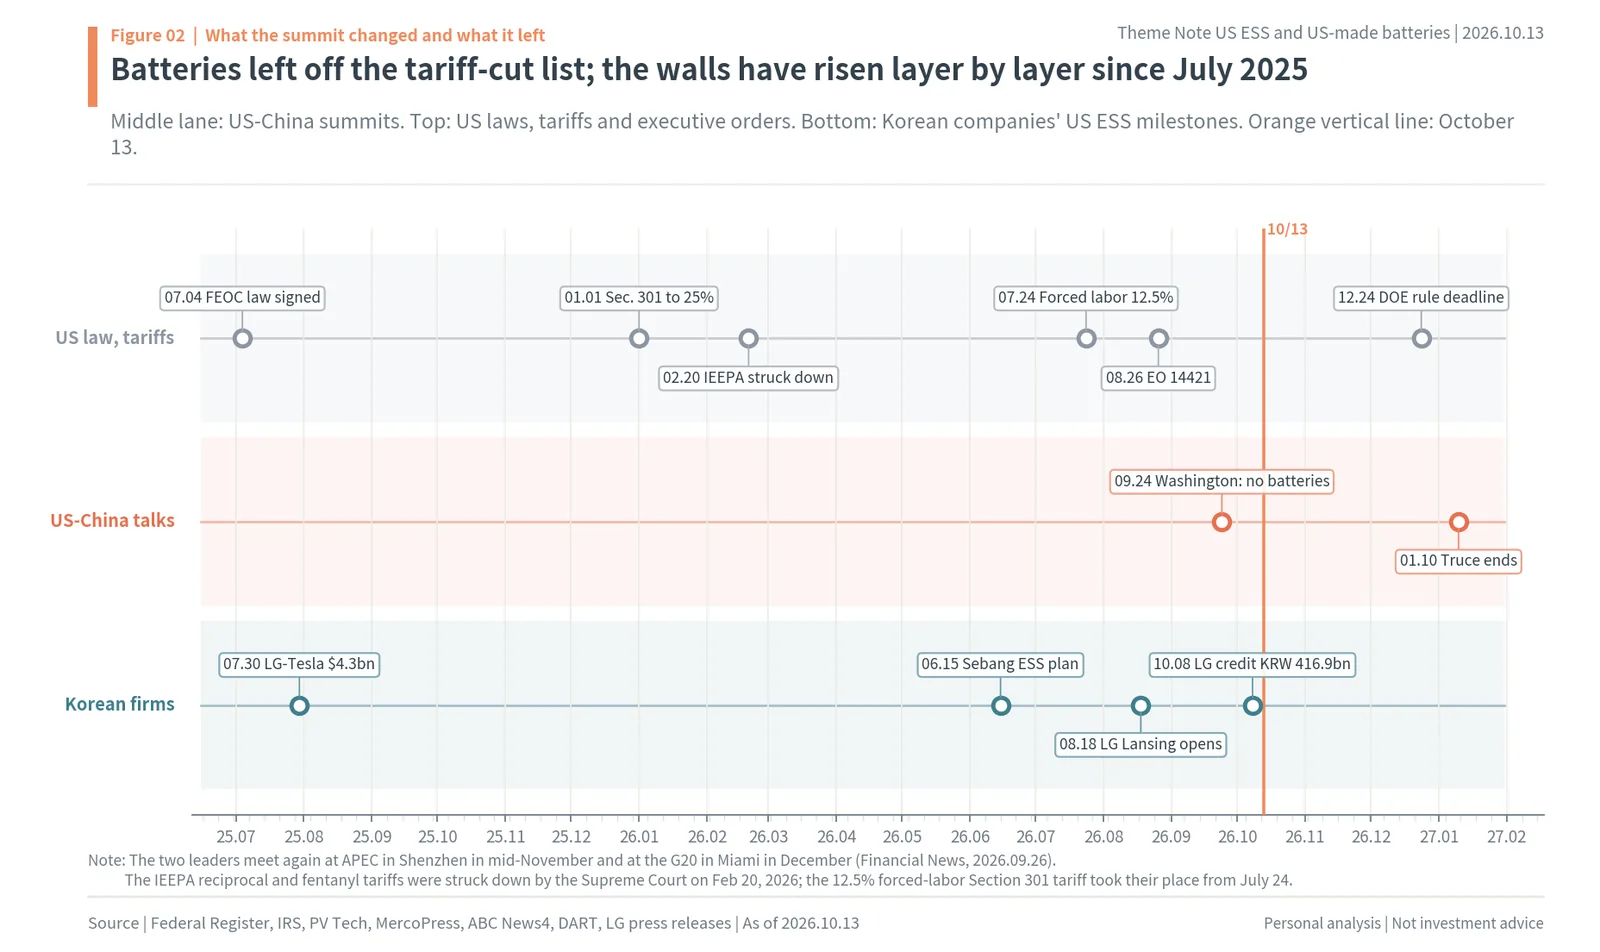
Figure 02 draws the order in which this fence was built, in three lanes. The top lane is US laws, tariffs and executive orders. The FEOC condition was created when the tax law was signed on July 4, 2025, and on January 1, 2026 the Section 301 tariff on Chinese ESS batteries rose from 7.5% to 25%. On February 20 the Supreme Court struck down the reciprocal and fentanyl tariffs based on the International Emergency Economic Powers Act (IEEPA), but their place was filled by a 10% temporary tariff under Section 122 of the Trade Act from February 24 to July 23, and by the 12.5% forced-labor Section 301 tariff from July 24. On August 26 came Executive Order 14421, which can block BESS, inverter and transformer transactions linked to China and others in bulk-power-system equipment, and the Department of Energy must issue implementing rules by December 24.
The middle lane is the US-China summits. The September 24 Washington summit ended without batteries, and the next deadline is the end of the truce on January 10, 2027. The bottom lane is Korean companies’ US ESS milestones. LG Energy Solution disclosed a $4.309bn (KRW 5.9442tn) LFP battery supply contract on July 30, 2025 (US government documents confirmed in March 2026 that the counterparty is Tesla), opened its plant in Lansing, Michigan on August 18, 2026, and reported a North American production tax credit of KRW 416.9bn in its preliminary third-quarter results on October 8. Sebang Global Battery announced its Ohio ESS business on a conference call on June 15.
This timeline says one thing. The wall has risen layer by layer since July 2025, and the September summit lowered none of those layers. One tariff layer disappeared with the Supreme Court ruling, but a temporary tariff filled its place four days later and the forced-labor tariff from July, and the tax credit conditions and the executive order tighten as the dates pass. So the next chapters measure the three walls one by one in numbers.
US ESS battery tariffs: 40.9% on China, 12.5% on Korea, 0% on US-made, and FEOC shuts out Chinese cells
The first wall is the tariff. As of October 2026, a Chinese-made lithium-ion battery for ESS (US tariff line HTS 8507.60.0020) pays three layers of tariffs. At the bottom is the 3.4% base (MFN) tariff that applies to every country. On top of that is the Section 301 tariff applied only to Chinese goods since 2018; following the Biden administration’s four-year review, it rose from 7.5% to 25% for non-EV lithium-ion batteries on January 1, 2026. US power company AES wrote in its quarterly report (10-Q) that the Section 301 tariff on Chinese lithium-ion batteries and related components used in energy storage is 25% from January 1, 2026 (previously 7.5%). At the top is the 12.5% forced-labor Section 301 tariff applied from July 24, 2026. The Federal Register (91 FR 47318) states that this tariff applies in addition to the existing Section 301 tariff. The three layers add up to 40.9%.
Korean goods are different. Korean batteries were duty-free under the Korea-US free trade agreement, and the same forced-labor Section 301 tariff applies to them as 12.5% including the base tariff. Cells made on US soil pay no import tariff. The Korea Institute for Industrial Economics and Trade (KIET) summed it up in an August 27 report: adding up all tariffs, the tariff rate on Chinese ESS is 40.9%, 28.4 percentage points higher than the 12.5% on Korean ESS. The same report said that when tariffs, the production tax credit and the prohibited-foreign-entity rules work together, the price gap between Chinese imports and Korean companies’ US-made products can narrow sharply or even reverse.
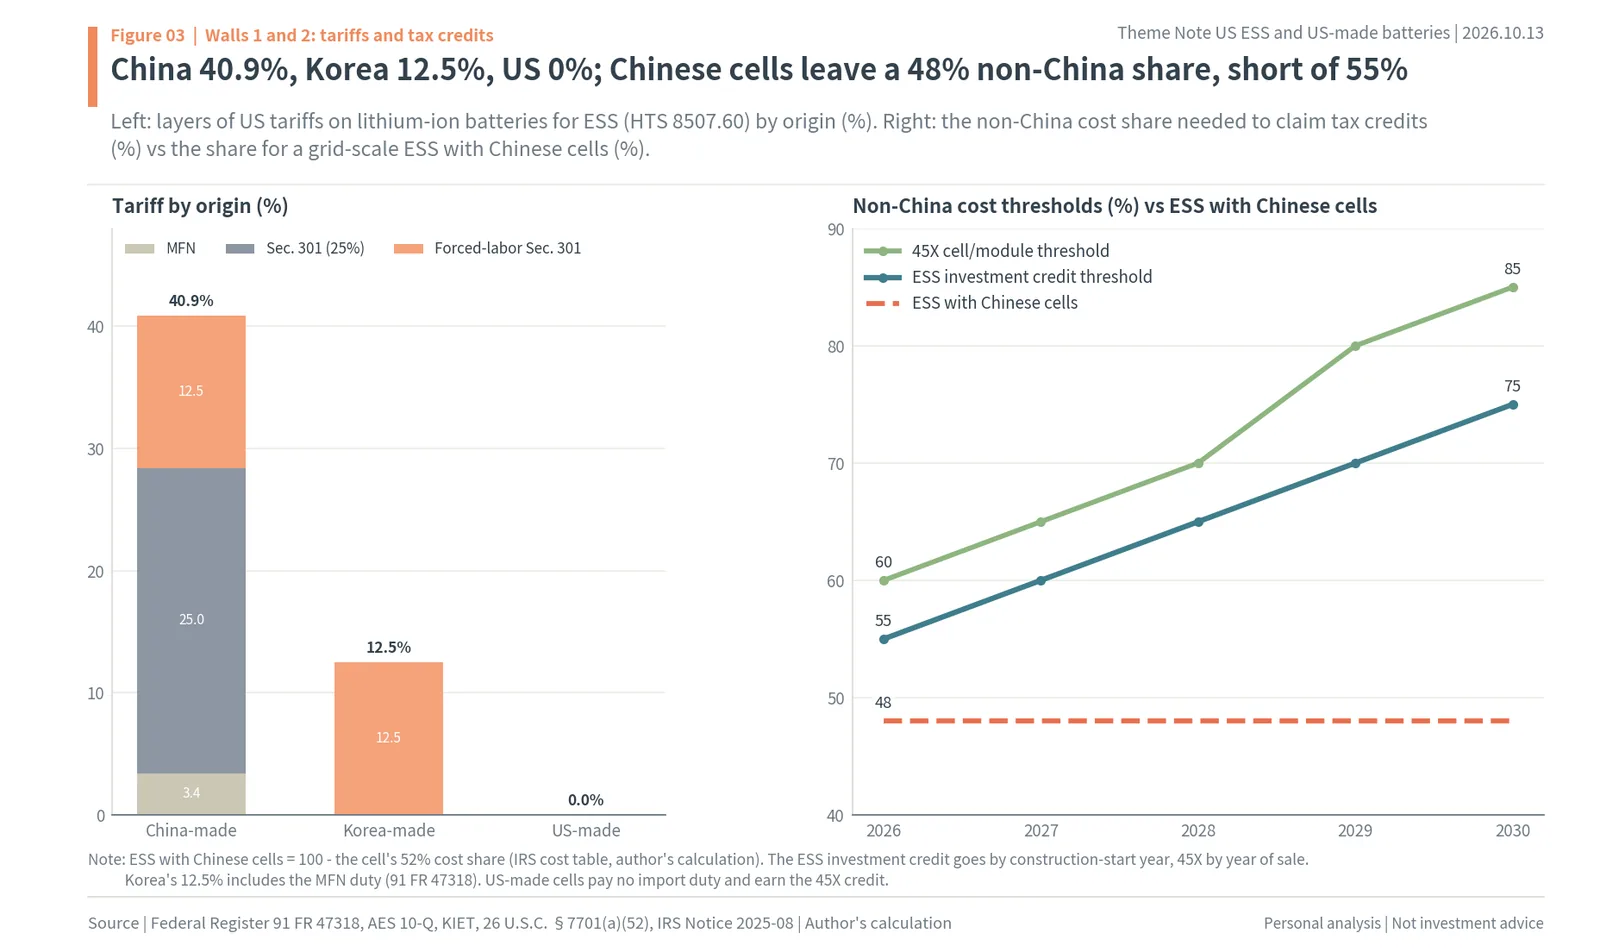
The left side of Figure 03 stacks the tariffs by origin as layers. The Chinese bar stacks the 3.4% base tariff, the 25% Section 301 tariff and the 12.5% forced-labor Section 301 tariff to reach 40.9%; the Korean bar is a single 12.5% layer, and US-made is zero. The right side draws the second wall, the tax credit condition, year by year. The green line is the non-Chinese cost share that cells and modules must pass to claim the 45X production credit (60% in 2026 → 85% in 2030), and the teal line is the share a project must pass to claim the ESS investment credit (55% in 2026 → 75% in 2030). The red dashed line is the 48% non-Chinese share of a grid-scale ESS using Chinese cells.
This 48% comes from the IRS cost table. Cells are 52.0% of the cost of a grid-scale ESS, so even if only the cells are Chinese and everything else is non-Chinese, the non-Chinese share is 100 minus 52, or 48% (author’s calculation). That is 7 percentage points short of the 55% bar for projects starting construction in 2026, 12 points short in 2027 and 27 points short in 2030. In Notice 2026-15 on February 12, 2026, the IRS let developers use this cost table directly in MACR calculations. So from 2026, for a US ESS developer a Chinese cell is no longer “a cell you bring in after paying a 40.9% tariff” but “a cell you can only use by giving up the investment tax credit”. The ESS investment credit stays in full for projects starting construction through 2033, so this condition serves as the entry ticket to the US ESS market for the next seven years.
If the tariff is a wall that raises prices, the tax credit condition is a wall that closes the door. The 40.9% tariff means that however cheap a Chinese cell is, its price rises by more than 40% when it arrives in the US; the tax credit condition means that even after paying that price, the whole project loses the credit. Both walls point the same way, so US ESS developers’ choices narrow to non-Chinese cells made on US soil.
FEOC thresholds rise every year, and Executive Order 14421 shuts the grid to Chinese BESS
The tax credit conditions tighten over time. The left side of Figure 04 shows how much of the 45X production credit remains by year of sale. It is paid in full from 2026 to 2029, falls to 75% in 2030, 50% in 2031 and 25% in 2032, and disappears in 2033. The right side shows how far a grid-scale ESS using Chinese cells falls short of the investment credit threshold. The gap widens by 5 percentage points a year, from 7 points in 2026 to 12 in 2027, 17 in 2028, 22 in 2029 and 27 in 2030.
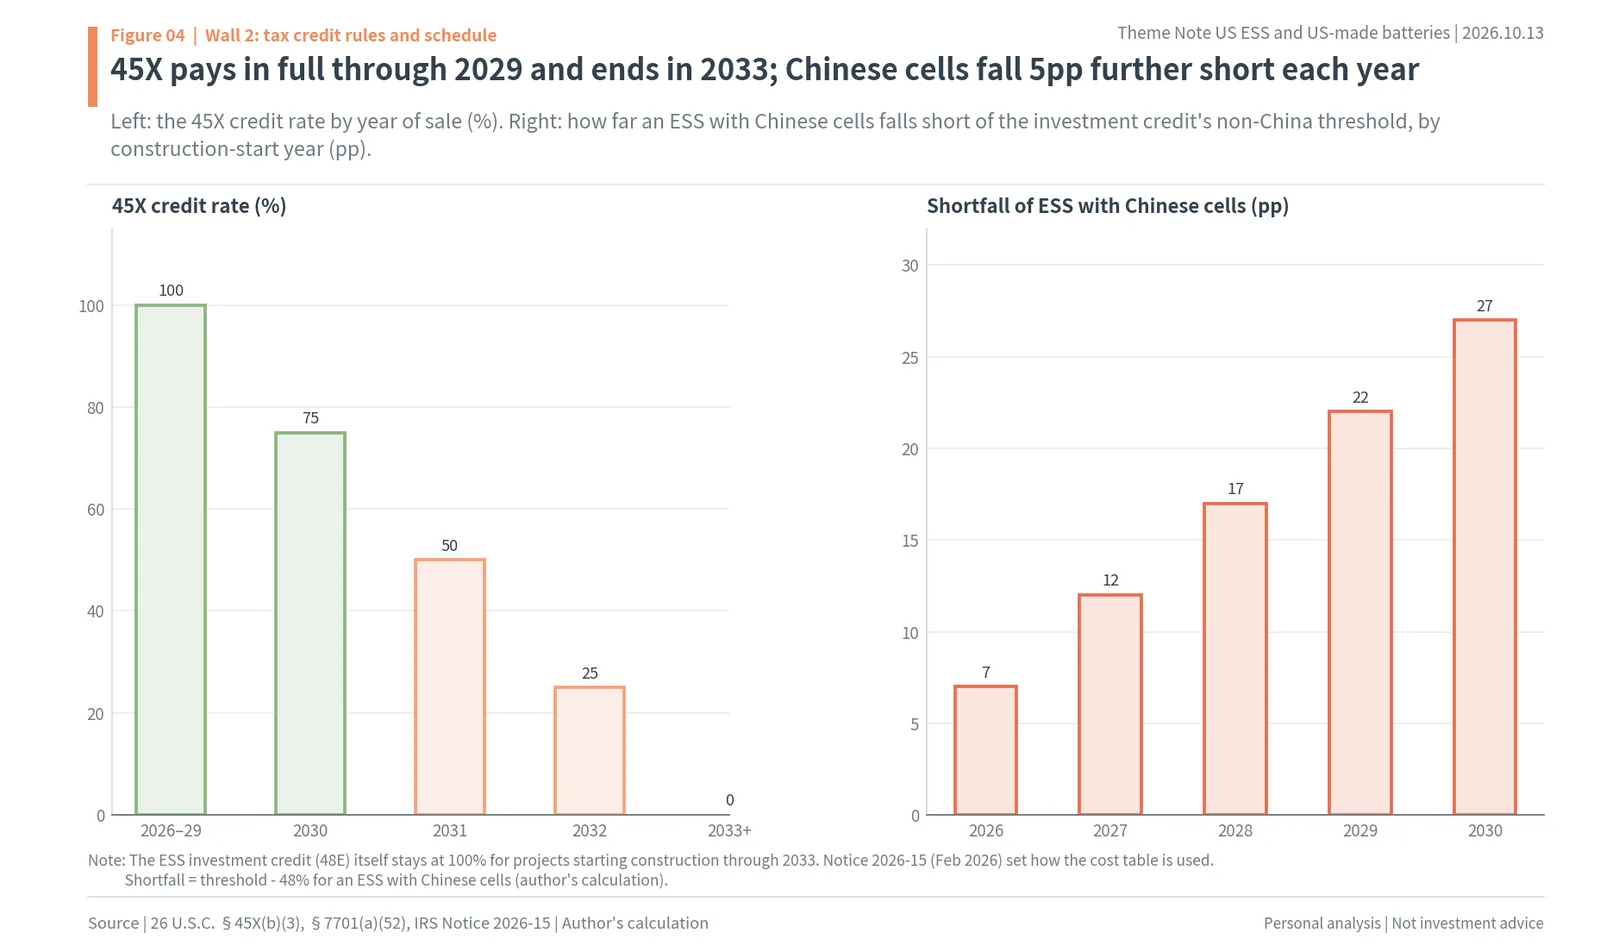
Putting the two charts together shows when the gain from a US plant is largest. The production credit is paid in full through 2029, and meanwhile the threshold Chinese cells must pass rises every year. A company making cells in the US collects the full $45 per kWh through 2029 while selling cells into a market Chinese competitors cannot enter. By the time the production credit shrinks after 2030, the non-Chinese threshold will have risen to 75% to 85%, so not only cells but materials outside the cell, such as cathodes, electrolyte and enclosures, must be non-Chinese. At that point the share of companies supplying non-Chinese parts next to the cell plants grows further.
The third wall is an executive order. On August 26, 2026 President Trump signed the executive order “Declaring a National Emergency to Protect the US Bulk Power System” (EO 14421, 91 FR 55995). It covers grid-connected inverters, transformers and battery energy storage systems (BESS) connected to transmission at 69kV and above. The Department of Energy can rule transactions after August 26 in equipment linked to the 24 countries on US arms embargo and sanctions lists, China above all, an “unacceptable risk” and block them. Equipment already installed is not automatically exempt and can face conditions to disconnect, remove or replace it. The Department of Energy must issue implementing rules within 120 days, by December 24, 2026.
If tariffs and tax credits push out Chinese cells through “price” and “subsidy”, the executive order is the basis for keeping Chinese equipment out of grid-scale ESS on the transmission grid altogether. All three walls remain after the September summit. So US ESS demand has no choice but to go to plants on US soil.
US ESS demand: installations rise from 59GWh to 71GWh as China’s import share falls to 66.5%
The market inside the wall is growing fast. In their third-quarter market outlook on September 1, the Solar Energy Industries Association (SEIA) and Benchmark Mineral Intelligence raised their forecast for 2026 US ESS installations to 71GWh, 20.3% more than 2025’s 59GWh. In the second quarter of 2026, 20.2GWh was installed, a quarterly record, bringing the first half to 30.8GWh. They raised their forecast for cumulative installations through 2030 to 683GWh. The two organizations cited the rapid growth of ESS attached to data centers as the reason commercial and industrial installations rose. Wood Mackenzie, which separately counted the same second quarter at 18.9GWh, said slowing EV demand had in fact become a tailwind for ESS.
While demand grew, China’s share shrank. In US lithium-ion battery imports (by weight) compiled by S&P Global from US Census Bureau customs data, China’s share went from 80.2% in the fourth quarter of 2024 and 84.8% in the first quarter of 2025 to 77.0% in the second quarter of 2025, 60.3% in the first quarter of 2026 and 66.5% in the second. In 2026, when the Section 301 tariff rose to 25%, China’s share dropped to the 60% range. Korea’s share in the same second quarter was 9.9%, and S&P wrote that the companies shipping the most to the US in the second quarter were Korean battery makers.
Where the demand comes from also shows up in numbers. By state, second-quarter 2026 installations were led by Arizona at 6.2GWh, Texas at 3.8GWh and California at 3.6GWh (SEIA and Benchmark). On February 20 the US Energy Information Administration (EIA) counted about 24GW of new utility-scale batteries for 2026, more than the 2025 record of 15GW, with Texas at 53%, California at 14% and Arizona at 13%. Over the longer run, KIET, citing SNE Research, sees US ESS demand growing 16% a year from 55GWh in 2023 to 320GWh in 2035. Demand driven by both AI data centers and renewables keeps growing inside the wall every year.
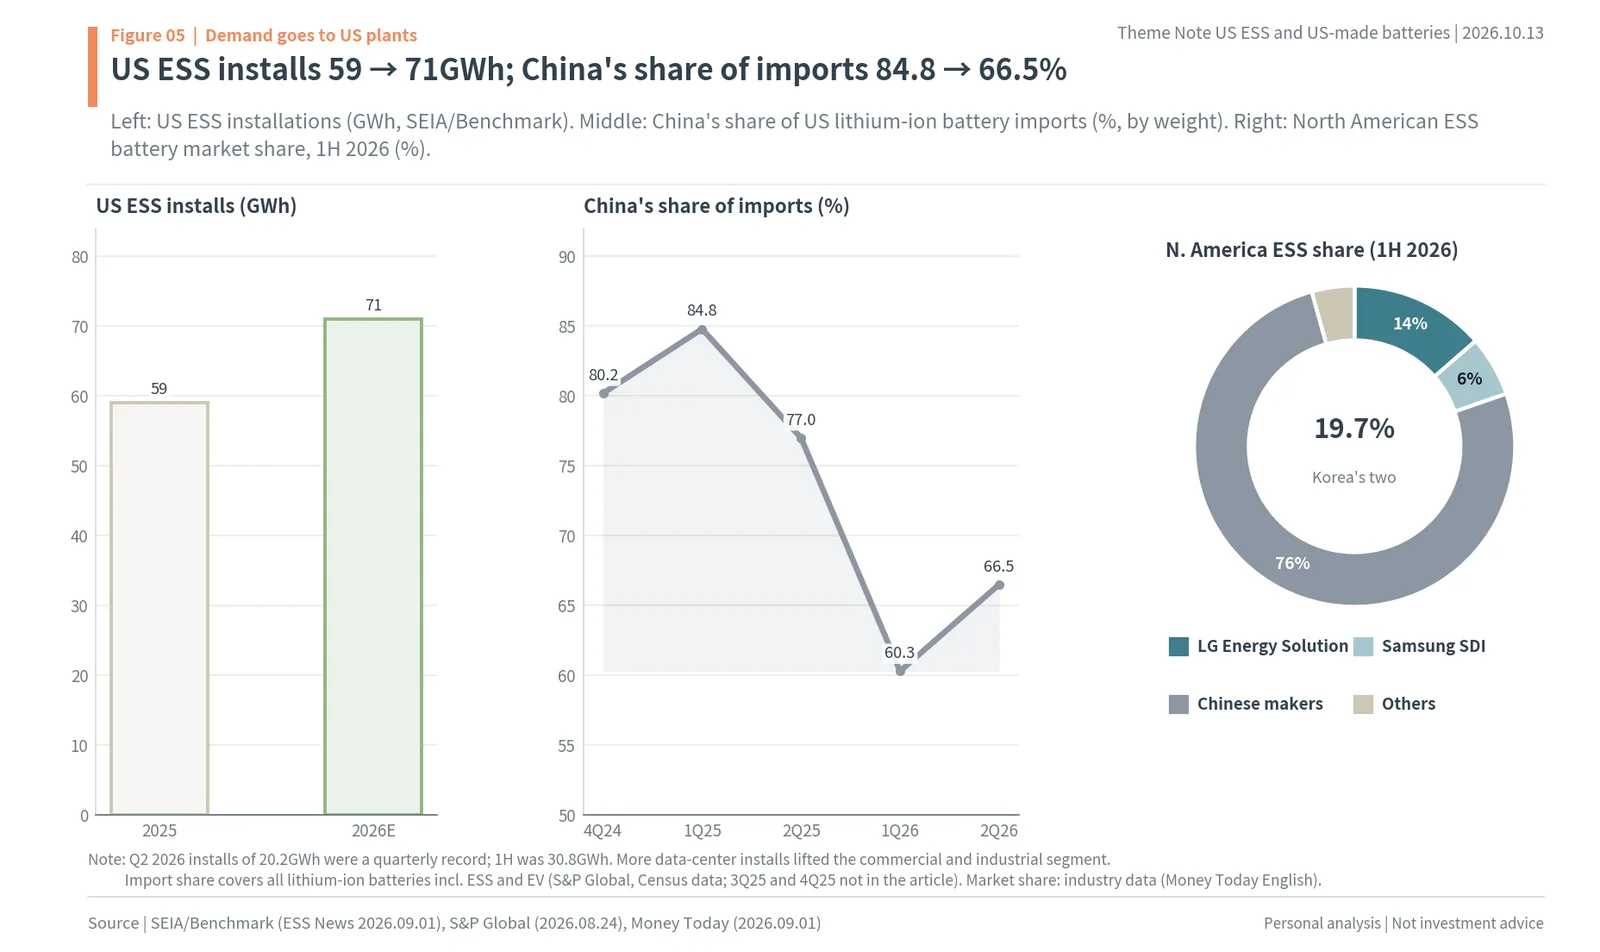
In Figure 05, the left panel shows US ESS installations (GWh), the middle China’s share of imports, and the right North American ESS battery market share in the first half of 2026. According to the English edition of Money Today, citing industry data, first-half North American ESS share was 13.6% for LG Energy Solution and 6.1% for Samsung SDI, 19.7% for the two Korean companies, and 76% for Chinese makers. In the import share chart, the third- and fourth-quarter 2025 points are left out because the article gives no numbers, and the line connects across them.
What a 76% share and a 66.5% import share say is not that Chinese cells still fill most of US ESS, but that this share is being pushed toward the side that cannot claim tax credits. “Safe harbor” projects that started construction by the end of 2025 follow the old rules, but projects starting construction from 2026 need non-Chinese cells to claim the credit. Intertek CEA estimated that more than 80% of the US ESS cell capacity meeting the 2026 FEOC condition belongs to Korean companies. Of the growing demand, the part that claims the tax credit goes to Korean companies’ US plants.
US ESS cell plants: LG Energy Solution 47GWh and Samsung SDI 20GWh on US soil
Cells that qualify for the tax credit come from US soil. Right now the Korean companies making ESS cells at scale on US soil are two: LG Energy Solution and Samsung SDI. LG Energy Solution started North America’s first large-scale ESS battery production at its Holland, Michigan plant in June 2025, converted some EV lines at its second GM joint-venture plant (Spring Hill, Tennessee, UC2) and its Honda joint-venture plant (Jeffersonville, Ohio) to ESS in May and June 2026, and opened its wholly owned plant in Lansing, Michigan on August 18. IBK Investment & Securities (July 31) split 57GWh of US ESS capacity into Holland 17GWh, STL 10GWh, Honda 10GWh, Lansing 10GWh and UC2 10GWh. Of these, STL is NextStar in Windsor, Canada, built with Stellantis, so counting only US soil gives 47GWh (author’s calculation). This distinction matters because cells made in Canada cannot claim the US 45X credit.
On its second-quarter earnings call, LG Energy Solution said it would secure more than 50GWh of North American production capacity by year-end. iM Securities sees North American ESS capacity of more than 70GWh by end-2027. Eugene Investment & Securities expects more than 10GWh of prismatic LFP lines to be added in Lansing in 2027; adding this to the 47GWh on US soil gives about 57GWh by end-2027 (author’s calculation). The cells for the $4.309bn LFP contract with Tesla (August 2027 to July 2030) are also made in Lansing and go into the “Megapack 3” in Houston.
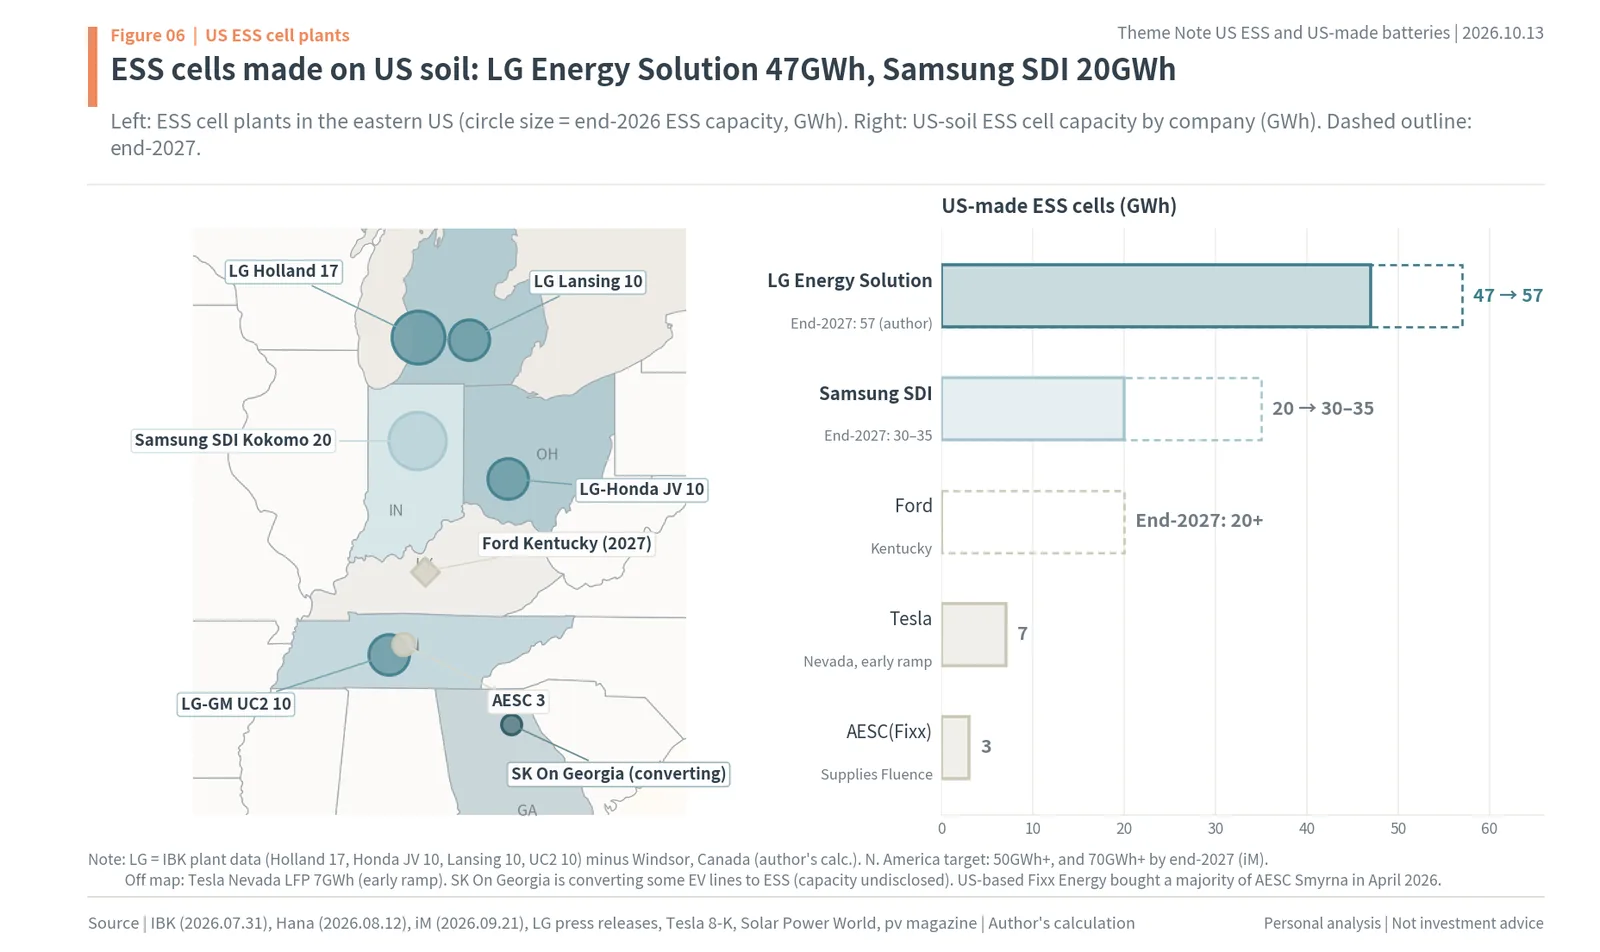
The map on the left of Figure 06 draws ESS cell plants in the eastern US as circles sized by capacity. Michigan (Holland and Lansing), Ohio (the Honda joint venture) and Tennessee (the GM joint venture) are LG Energy Solution; Kokomo, Indiana is Samsung SDI. Samsung SDI is converting lines at StarPlus Energy (SPE), its Indiana joint venture with Stellantis, to ESS. It has run nickel-cobalt-aluminum (NCA) ESS lines since the fourth quarter of 2025, and mass production of prismatic LFP cells starts in October 2026. Hana Securities (August 12) sees North American ESS capacity of 20GWh at end-2026 (NCA 8GWh, LFP 12GWh) and 30GWh at end-2027 (NCA 8GWh, LFP 22GWh); iM Securities (September 21) sees about 35GWh at end-2027. Samsung SDI decided to buy GM’s 49.99% stake and turn their joint-venture plant in New Carlisle, Indiana into a wholly owned unit (August 11 filing). On its second-quarter call, the company said orders already secured fill a large part of its capacity through 2029.
The bars on the right show US-soil ESS cell capacity by company. Outside the two Korean companies, Ford is building an LFP ESS cell and container plant of more than 20GWh in Kentucky by end-2027, and Tesla is in early operation of a 7GWh LFP line in Nevada. AESC’s Smyrna, Tennessee plant (about 3GWh) was originally owned by China’s Envision, but in April 2026 US startup Fixx Energy bought a majority stake to meet the FEOC condition. SK On, the battery unit of SK Innovation, is converting some EV lines at its Georgia plant to pouch LFP for ESS and has not disclosed the capacity. Its contracts came first instead. In September 2025 it signed a 1GWh supply deal with Flatiron Energy that came with a right of first negotiation on a 6.2GWh project, leaving up to 7.2GWh open, and in August 2026 it agreed to make and supply 9GWh of LFP pouch cells from Georgia to NeoVolta Power over five years from 2027 to 2031 (about KRW 1.5tn by industry estimates). According to iM Securities, SK On’s 2026 ESS order target is 20GWh, and the NeoVolta deal filled 45% of it. Refining and chemicals make up most of SK Innovation’s market cap, so even spread over the years this contract is just over 1% of its market cap.
Most US-soil ESS cells come from the plants of the two Korean companies. At end-2026, LG Energy Solution’s 47GWh plus Samsung SDI’s 20GWh is 67GWh, about equal to the 71GWh forecast for 2026 US ESS installations. So the next question is how much these plants earn by making in the US.
45X AMPC: KRW 60.2bn per GWh, and 55.1% of LG Energy Solution’s Q3 operating profit
The first gain from a US plant is the production tax credit. Adding $35 per kWh for cells and $10 per kWh for modules gives $45 per kWh, so making 1GWh (1 million kWh) in the US earns $45mn. At KRW 1,337.7 per dollar on October 13, that is about KRW 60.2bn (author’s calculation). The credit is deducted from corporate tax, but it can also be received in cash, so battery makers include it in operating profit when they report. Since the first quarter of 2026 LG Energy Solution has shown this credit as other revenue within sales.
LG Energy Solution’s North American production tax credit was KRW 189.8bn in the first quarter, KRW 241.0bn in the second and KRW 416.9bn (about $312mn) in the third (the third quarter from its October 8 preliminary filing), 2.2 times the first quarter. The company explained that the second-quarter credit rose “due to higher ESS shipments”, and Hana Securities (October 12) estimated that the third-quarter credit converts into 10.2GWh of batteries, 9.8GWh of it ESS and 0.4GWh EV. In other words, almost all of the third-quarter credit came from ESS cells made on US soil.
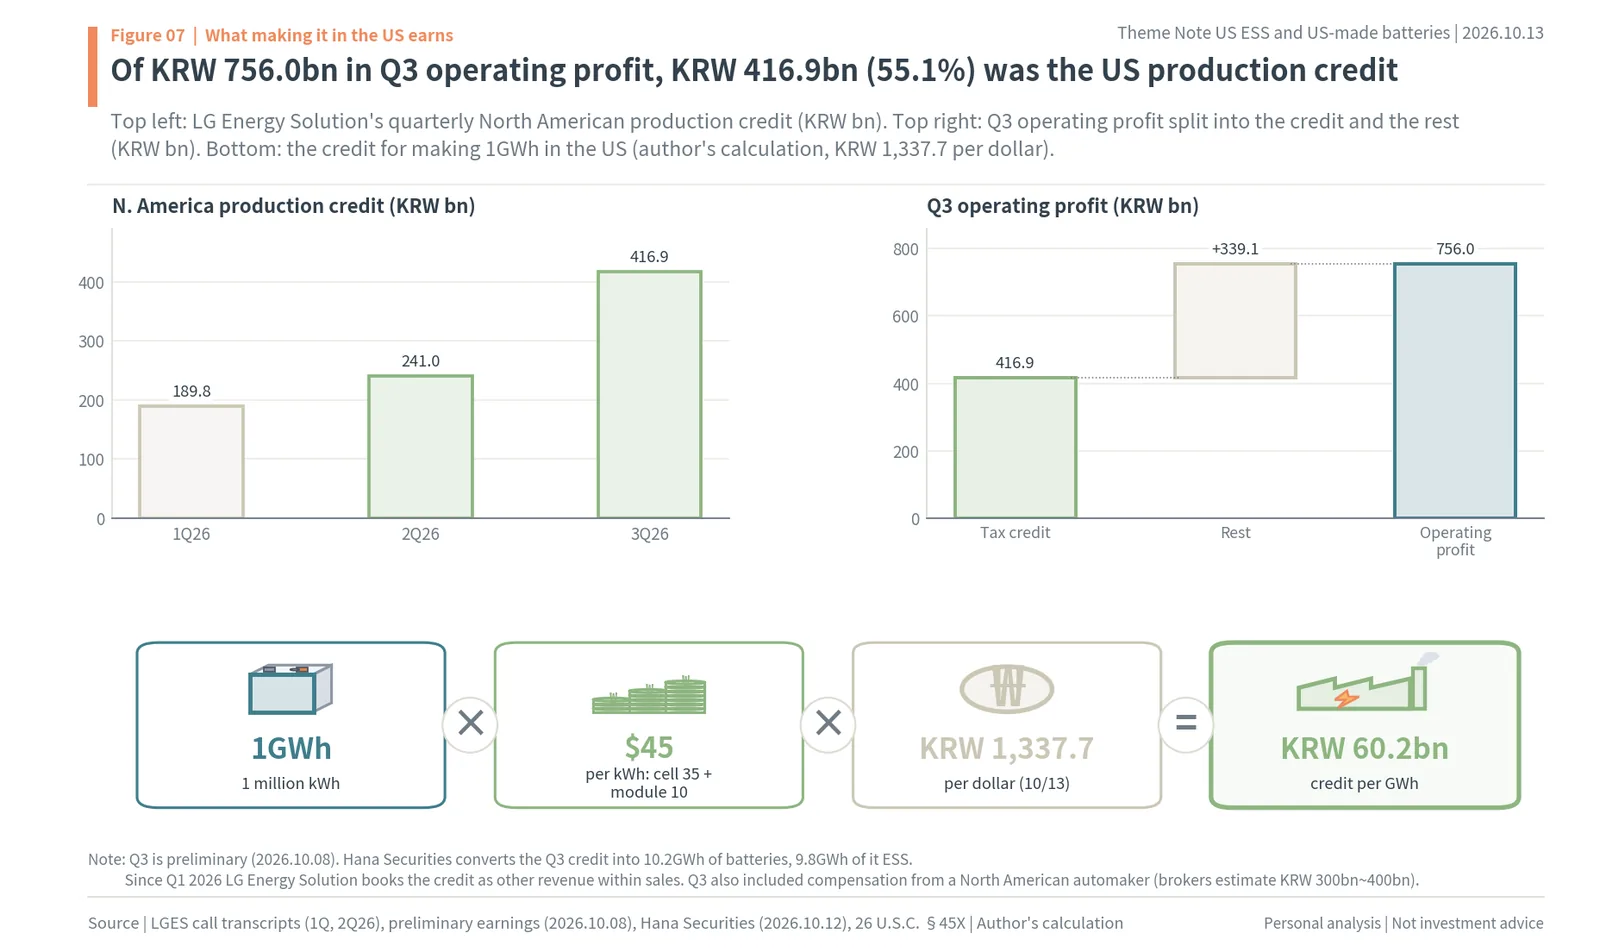
In Figure 07, the top left shows LG Energy Solution’s quarterly credit, and the top right is a bridge splitting third-quarter operating profit of KRW 756.0bn (about $565mn) into the KRW 416.9bn credit and the remaining KRW 339.1bn. The credit is 55.1% of operating profit. The bottom row turns the calculation 1GWh × $45 × KRW 1,337.7 = KRW 60.2bn into a picture. Third-quarter revenue was KRW 9.64tn, a quarterly record, and even without the credit the company made an operating profit of KRW 339.1bn. In the second quarter, without the credit, it had an operating loss of KRW 127.7bn. Brokers estimate that the third-quarter profit includes KRW 300bn to 400bn of compensation from a North American automaker customer, but the company did not disclose the amount and will give the breakdown at its November 3 earnings call.
Brokers see this flow growing in 2027. IBK Investment & Securities (July 31) estimated LG Energy Solution’s ESS production credit at KRW 1.349tn in 2026 and KRW 1.796tn in 2027, and expected ESS operating profit excluding the credit to turn positive at KRW 788.0bn in 2027. Adding the two gives 2027 ESS operating profit of KRW 2.584tn (author’s sum). For Samsung SDI, Hana Securities estimates the 2027 ESS credit at KRW 1.297tn and ESS operating profit including the credit at KRW 1.498tn, and iM Securities estimates ESS operating profit at KRW 1.34tn. The single fact of making in the US adds $45 to every kWh, and that money becomes a large share of the two cell makers’ profits.
The credit is not the only gain. Compared with Chinese cells paying a 40.9% tariff, US-soil cells pay no tariff, and unlike Chinese cells, which forfeit the tax credit, they hand developers the investment tax credit. In July 2025 Benchmark forecast that US-made LFP cells would cost 56% more than Chinese ones, and these two reasons are why US developers pay that premium. US-soil cells collect both the subsidy and the price.
LG Energy Solution’s 140GWh North American ESS backlog and the Tesla and DTE contracts
The order book shows how long the US cell plants will stay busy. On its first-quarter 2026 earnings call, LG Energy Solution said it had “an order backlog of about 140GWh as of the end of last year, centered on North America”. New orders in 2025 were a record 90GWh, and the 2026 target is more than that. In the first half, it secured more than KRW 3tn of new orders, including AI data-center projects whose end customer is a hyperscaler. Divided by 47GWh of US-soil cell capacity, the end-2025 backlog alone is about three years of volume (author’s calculation).
Most disclosed contracts require production on US soil. The LFP battery supply contract disclosed on July 30, 2025 is worth KRW 5.9442tn ($4.309bn) and runs from August 2027 to July 2030; US government documents confirmed that the counterparty is Tesla and that the cells are made in Lansing, Michigan for the Megapack 3 in Houston. In May 2026 its system-integration subsidiary Vertech signed a 6GWh, $1.6bn (about KRW 2.4tn) ESS supply contract with Michigan utility DTE Energy, with production at the Holland plant. In 2024 it signed contracts with Terra-Gen (up to 8GWh, 2026 to 2029, all made in North America) and Excelsior Energy Capital (7.5GWh from 2026, made and sold in North America), and in February 2026 a 5GWh contract with Hanwha Qcells’ US unit (2028 to 2030, made in Michigan).
None of these contracts sells cells alone; they include bundling cells into modules, packs and containers before delivery. Dividing the DTE contract by its GWh gives about $267 per kWh, a system price rather than a cell price (author’s calculation). To turn its backlog into revenue, LG Energy Solution has to fill pack and container capacity before cell capacity, and July’s pack bottleneck arose exactly there. The more orders the cell maker wins, the more volume goes to the assemblers next to its cell plants.
ESS pack bottleneck: why the money moves to assemblers next to the cell plants
As cell plants grew quickly, the choke point changed. Writing on LG Energy Solution’s second-quarter results on July 31, IBK Investment & Securities said “cell production was smooth, but pack and container capacity acted as a bottleneck”. On October 12, Hana Securities wrote of the third quarter that “in ESS, shipments rose more than expected as the pack production bottleneck partly eased”. However many cells a company makes, they do not become revenue until they are bundled into modules and packs and placed in containers. So the next money goes to the companies that bundle cells into modules and packs right next to the cell plants and supply cooling plates, cans and enclosures.
These steps outside the cell are not small in cost either. In the IRS cost table cells are 52%, so the remaining 48% sits outside the cell: container enclosure 14.8%, pack production 8.0%, BMS 7.4%, pack packaging 5.6% and thermal management 5.6%. As the investment credit threshold rises to 60% from 2027 and 75% in 2030, non-Chinese cells alone are not enough, and these parts outside the cell must be non-Chinese too. The reasons for the steps outside the cell to happen on US soil or in Korea grow every year.
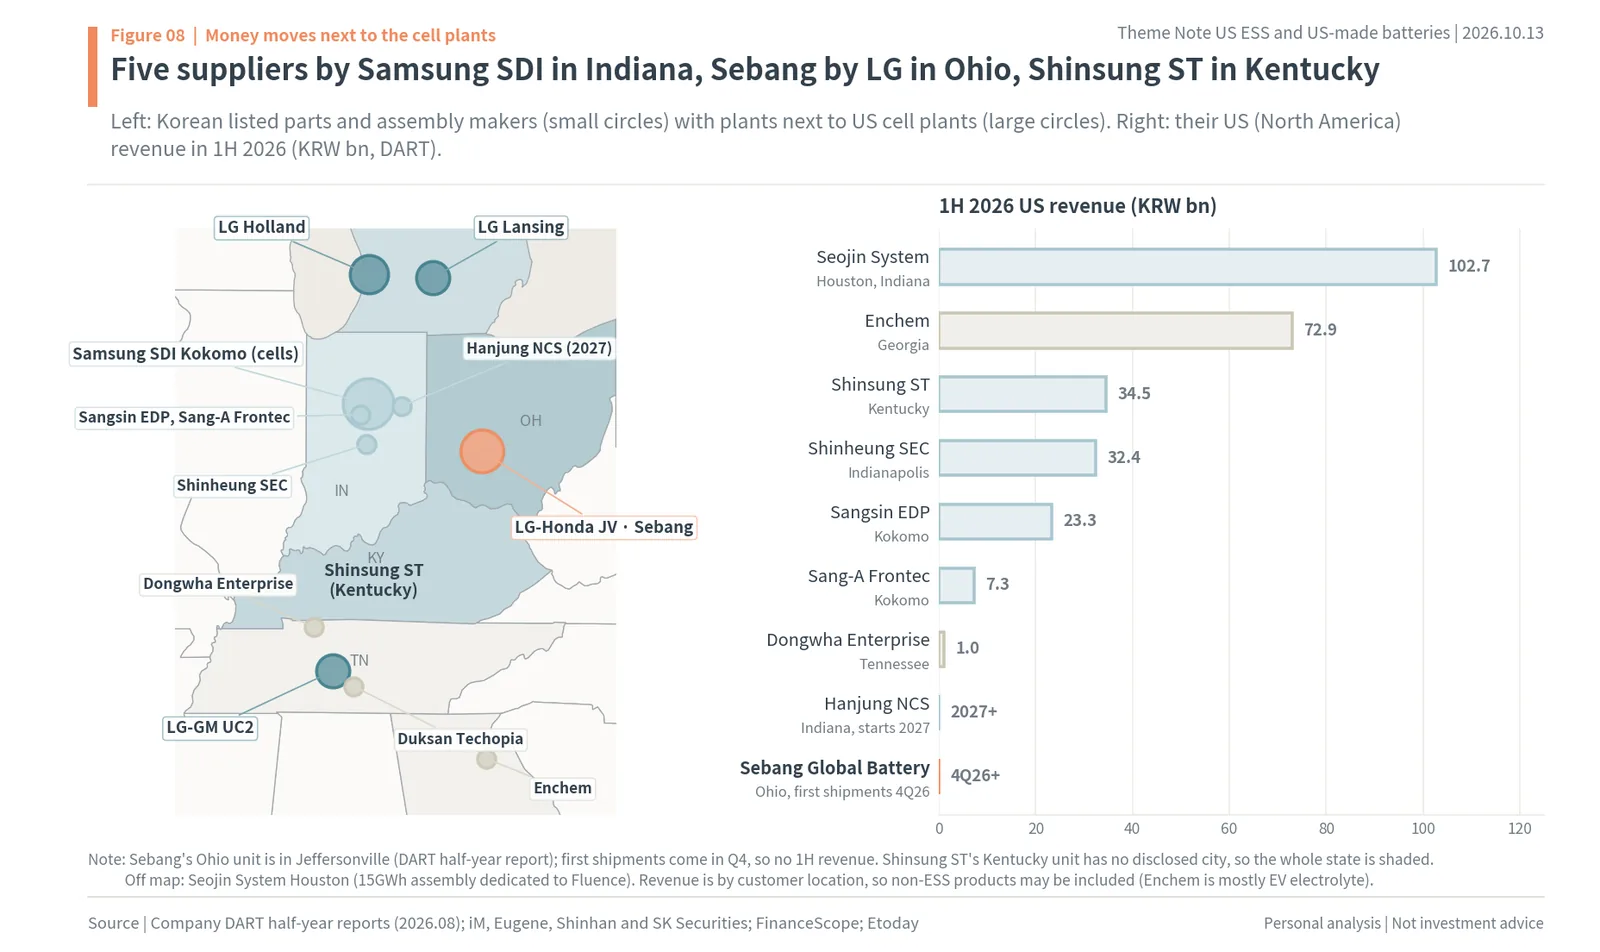
The map in Figure 08 marks the Korean listed parts makers and assemblers with plants next to US cell plants. The biggest cluster is next to Samsung SDI in Kokomo, Indiana. Sangsin EDP and Sang-A Frontec make prismatic cans and cap assemblies in the same Kokomo, Shinheung SEC makes prismatic cap assemblies in Indianapolis, and Seojin System assembles Samsung SDI ESS enclosures in Indiana. Hanjung NCS is building an ESS liquid-cooling parts plant in Hartford City that starts up in early 2027. On the LG Energy Solution side, Sebang Global Battery’s ESS module and pack unit is in Jeffersonville, Ohio, and Shinsung ST’s ESS liquid-cooled heat sink plant is in Kentucky. In Tennessee and Georgia there are electrolyte plants of Enchem, Duksan Techopia and Dongwha Enterprise.
The bars on the right show the US (North American) revenue these companies reported in their first-half 2026 reports: Seojin System KRW 102.7bn, Enchem KRW 72.9bn, Shinsung ST KRW 34.5bn, Shinheung SEC KRW 32.4bn, Sangsin EDP KRW 23.3bn, Sang-A Frontec KRW 7.3bn and Dongwha Enterprise KRW 1.0bn. Shinsung ST’s North American EV and ESS revenue jumped from KRW 160mn in the first half of 2025 to KRW 34.5bn in the first half of 2026. Sebang Global Battery’s first shipments come in the fourth quarter, so it has no first-half revenue, and Hanjung NCS’s US unit has no revenue yet either. These bars are revenue already booked; the ranking in a later chapter compares the next year’s revenue with market cap.
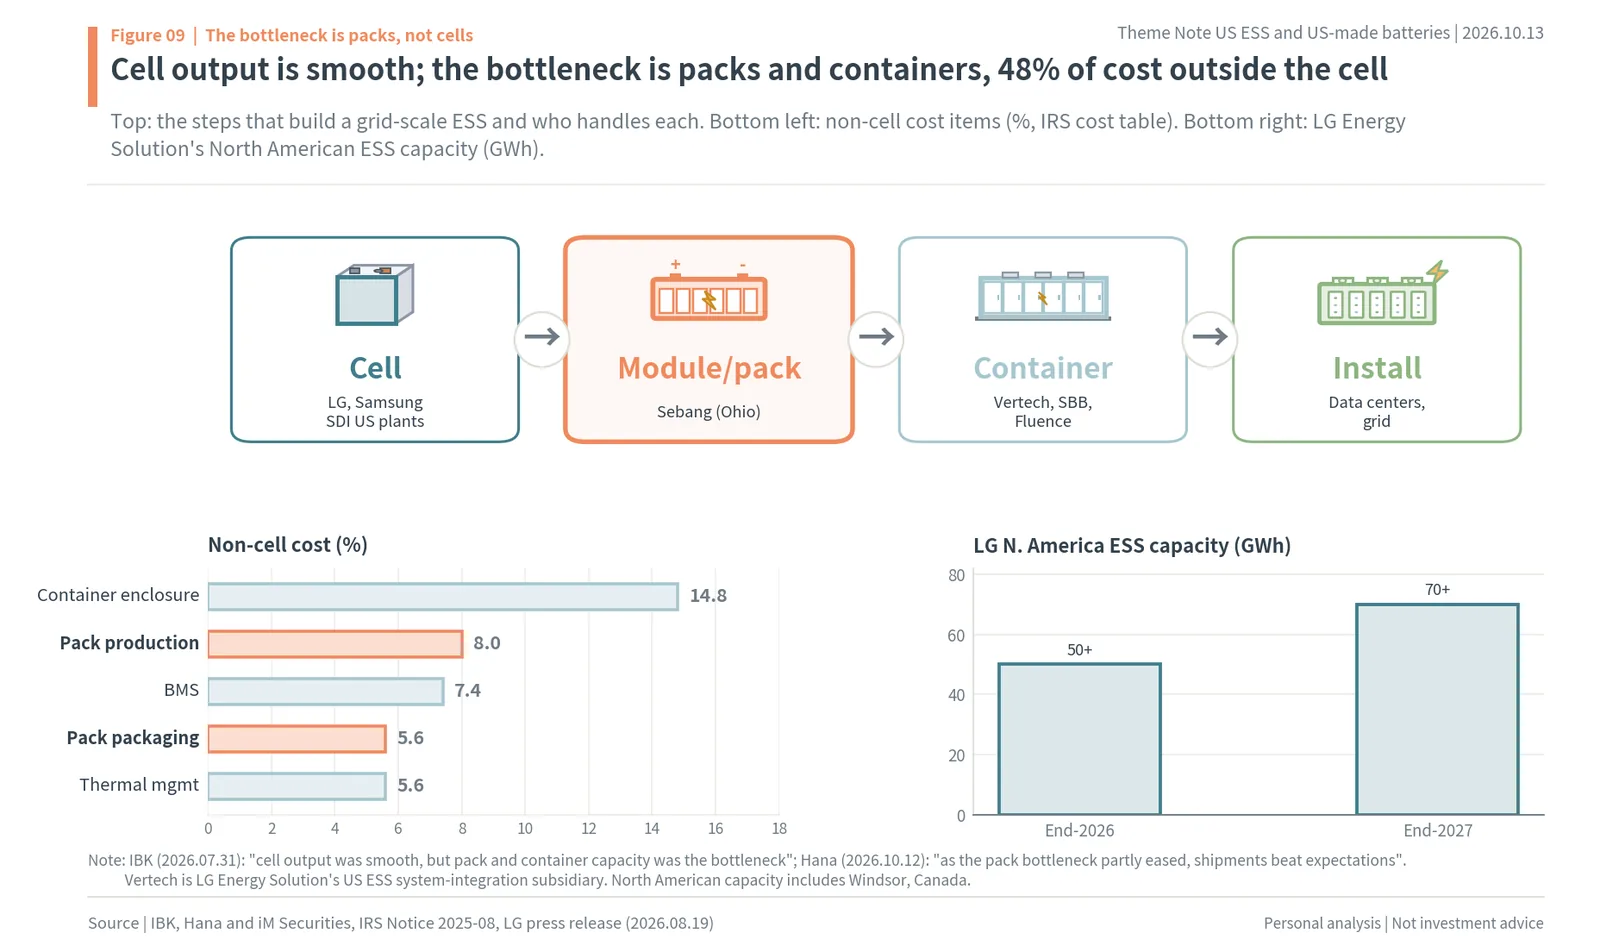
Figure 09 draws the order in which a grid-scale ESS is made. Cells come from LG Energy Solution’s and Samsung SDI’s US plants, modules and packs are bundled by assemblers such as Sebang Global Battery, and containers are completed by LG Energy Solution’s system-integration subsidiary Vertech, Samsung SDI’s SBB and Fluence, then installed at data centers and on the grid. The bottom left shows the cost items outside the cell, and the bottom right shows LG Energy Solution’s North American ESS capacity growing from more than 50GWh at end-2026 to more than 70GWh at end-2027. If cells grow by 20GWh, that many more cells need somewhere to be bundled into modules and packs. As long as the bottleneck is in packs, assembly capacity next to the cell plants is the first thing a cell maker buys.
Korean ESS suppliers in Indiana and Kentucky: Seojin System, Shinheung SEC, Sangsin EDP, Shinsung ST
Besides Sebang Global Battery, several Korean listed companies have set up next to US cell plants. The biggest cluster is next to Samsung SDI’s plant in Kokomo, Indiana. Dealsite (February 26) reported that the first Samsung SDI-Stellantis joint-venture plant has four lines of 8GWh each and that three of them are being converted to LFP for ESS. Can, cap, enclosure and cooling-parts makers built plants in Indiana to match this line conversion.
Sangsin EDP set up Sangsin Indiana in Kokomo to make Samsung SDI’s prismatic cans. According to its half-year report, US revenue in the first half of 2026 was KRW 23.3bn, up from KRW 13.3bn a year earlier, and Eugene Investment & Securities expects prismatic can revenue for US BESS to grow from KRW 24.4bn in 2025 to about KRW 80bn in 2026, with four lines added to the current six by the first half of 2027. Shinheung SEC makes prismatic cap assemblies at SH America in Indianapolis. First-half US revenue was KRW 32.4bn, and Shinhan Securities sees its US unit’s 2026 revenue at about KRW 70bn. One line for NCA ESS is running, and one line each for LFP ESS is added in the fourth quarter of 2026 and in 2027. Sang-A Frontec also makes cap assemblies in Kokomo, with first-half US revenue of KRW 7.3bn.
Seojin System runs two ESS assembly plants in the US. The Houston plant, dedicated to Fluence, has 15GWh of capacity, and the Indiana plant has assembled Samsung SDI ESS enclosures since July (under a five-year contract with Samsung SDI). First-half US revenue was KRW 102.7bn, the largest in this cluster, and SK Securities and Eugene Investment & Securities see 2027 ESS revenue at KRW 877.3bn to KRW 1.1249tn. At Hanjung NCS, 97% of revenue is ESS cooling parts (KRW 94.3bn in the first half), and its main customer is “Company S”. It is building a North American plant in Hartford City that starts up in early 2027.
On the LG Energy Solution side there is Shinsung ST. Shinsung ST set up its Kentucky unit in January 2025, installed a mass-production line for liquid-cooled ESS heat sinks at the end of that year, and began supplying in August 2026. Its main customer is LG Energy Solution, and the Kentucky unit’s annual capacity is about KRW 230bn (Etoday, August 6). In its half-year report, North American EV and ESS revenue jumped from KRW 160mn in the first half of 2025 to KRW 34.5bn in the first half of 2026.
These companies’ ratios (0.24x to 0.47x) are lower than Sebang Global Battery’s (0.95x), but they come from the same cause. When cell plants went up on US soil, parts plants followed next to them, and as the non-Chinese threshold for the investment credit rises each year, their parts fill the non-Chinese share of the cost outside the cell. Among them, Sebang Global Battery handles pack assembly, the cell makers’ narrowest bottleneck, and takes the revenue for the whole process of bundling thousands of cells rather than for one part. That is why its revenue ratio is the largest.
Sebang Global Battery (004490.KS): KRW 800bn a year of LG Energy Solution ESS packs in Ohio
Sebang Global Battery is the company that handles the pack bottleneck in the US ESS chain. Its core business is lead-acid car batteries known by the “Rocket” brand. According to a table from iM Securities (August 19), of 2025 consolidated revenue of KRW 2,142.1bn (about $1.6bn), lead-acid batteries were KRW 1,814.0bn, or 85%, and the remaining KRW 328.0bn was EV module and pack assembly by its subsidiary Sebang Lithium Battery (92.07% owned). Sebang Lithium Battery buys cells from cell makers, bundles them with busbars, BMS and cooling to make modules and packs, and has supplied automakers and battery makers. This business moves that EV module and pack assembly experience directly into grid ESS for the US.
The company laid out its plan in a June 15 conference call presentation, “Sebang Lithium Battery: new North American utility ESS business”. The business is in Ohio, and the local unit has been set up. Total investment in the new business is about KRW 150bn (about $112mn), and the company wrote that it is “an order-based investment, not a pre-emptive investment made only on market growth”. The schedule is equipment orders, hiring and certification in June to August 2026; pilot production and customer testing in the third quarter; first shipments and revenue in the fourth quarter; stable mass production and full revenue in 2027; and capacity expansion and a review of a rack and container systems business from 2028. The medium-term revenue target is “expected annual revenue of KRW 800bn, expected total revenue (through 2028) of KRW 1.8tn”, profitability is “low to mid single digit”, and the payback period is about four years. The company wrote that this single order raises consolidated revenue by 37% against the end of 2025.
The customer is LG Energy Solution. iM Securities wrote that Sebang Global Battery “won US ESS module and pack assembly volume for LG Energy Solution”, and that “cumulative revenue over the contract period is estimated at about KRW 1.8tn, equal to an average of about KRW 200bn a quarter, or about KRW 800bn annualized. The expected operating margin is about 4%”. Sebang Global Battery’s half-year report (August 14) states that “subsidiary Sebang Lithium Battery Ohio LLC signed a manufacturing and supply contract for North American ESS battery modules in June 2026”, and the Ohio unit’s address is in Jeffersonville. LG Energy Solution and Honda’s joint-venture plant is in the same Jeffersonville, and LG Energy Solution said on its second-quarter call that it started up this plant’s ESS line in June.
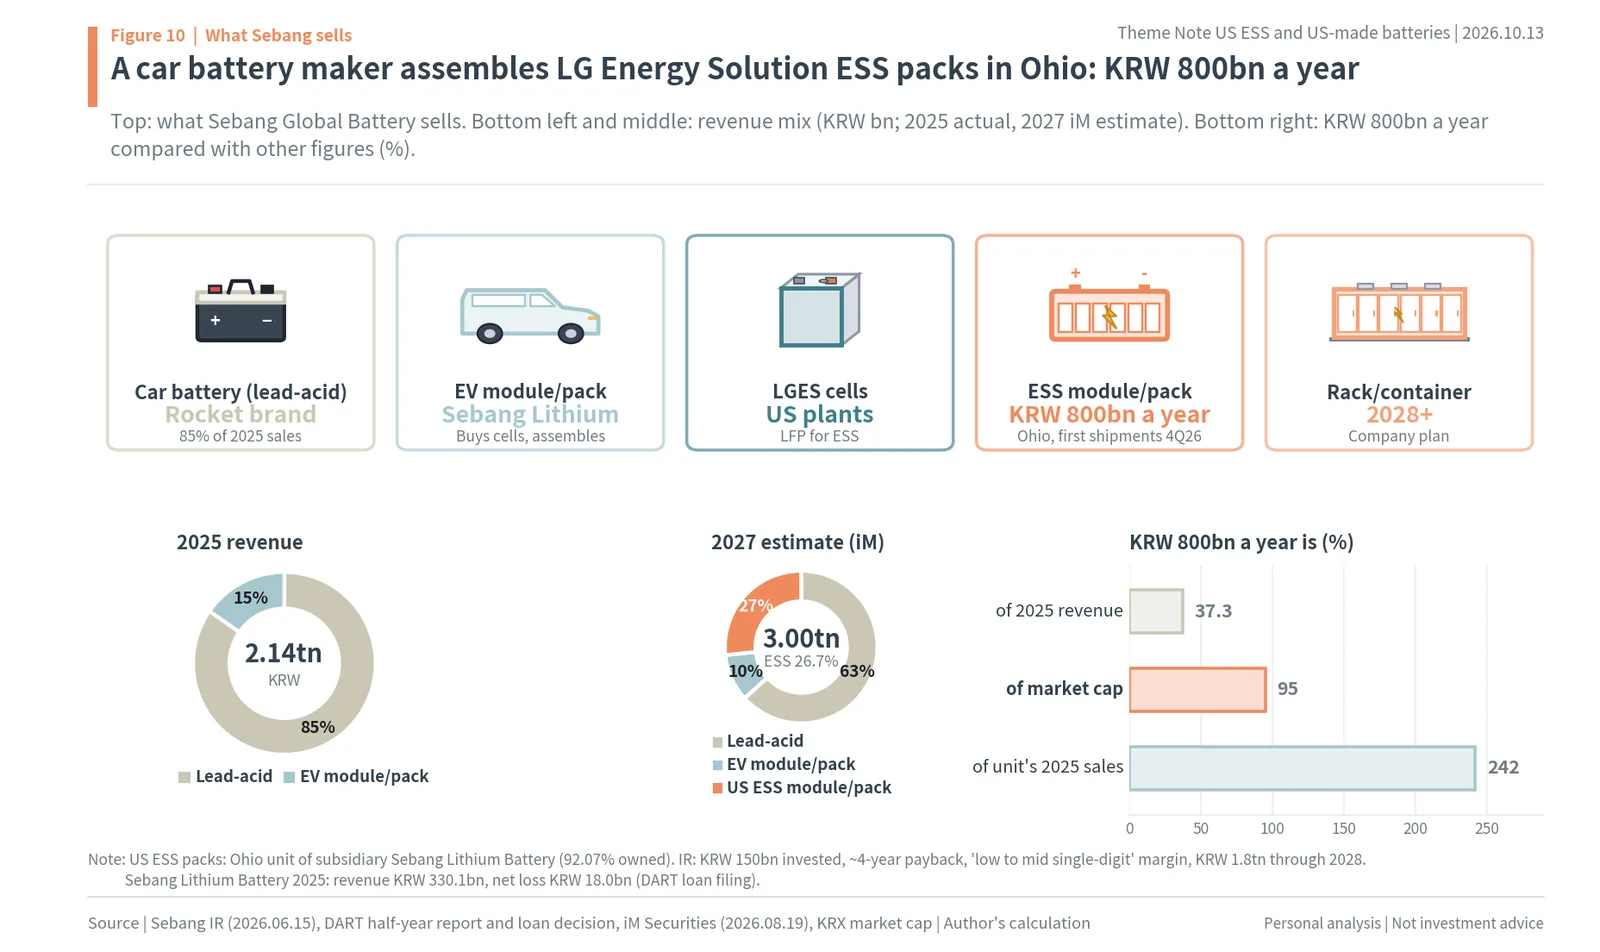
The top row of Figure 10 shows what Sebang Global Battery sells. From left: lead-acid car batteries, EV modules and packs, LG Energy Solution’s US ESS cells (the material Sebang receives and bundles), US ESS modules and packs (KRW 800bn a year), and the racks and containers the company is reviewing after 2028. The two donuts below show the revenue mix. In 2025, lead-acid batteries were 85% and EV modules and packs 15%. In iM Securities’ 2027 revenue estimate of KRW 2,998.0bn, US ESS modules and packs of KRW 800bn are 26.7%. The bars at bottom right compare KRW 800bn a year with other figures: 37.3% of 2025 consolidated revenue, 95% of the KRW 841.3bn market cap, and 242% of the subsidiary Sebang Lithium Battery’s 2025 revenue of KRW 330.1bn.
Sebang Global Battery is putting cash into this business. In June it put KRW 92.1bn, in proportion to its stake, into Sebang Lithium Battery’s KRW 100bn rights issue, and on September 14 it agreed to lend Sebang Lithium Battery KRW 60bn at 6.25% a year until September 2030. The purpose stated in the filing is “capex and working capital related to the North American ESS business of the US local unit”. Sebang Lithium Battery posted revenue of KRW 330.1bn and a net loss of KRW 18.0bn in 2025 as EV volume fell, and the cash earned by the parent’s lead-acid business backs this investment. Hana Securities (June 16) put the parent’s cash and equivalents at KRW 281.5bn at the end of the first quarter of 2026.
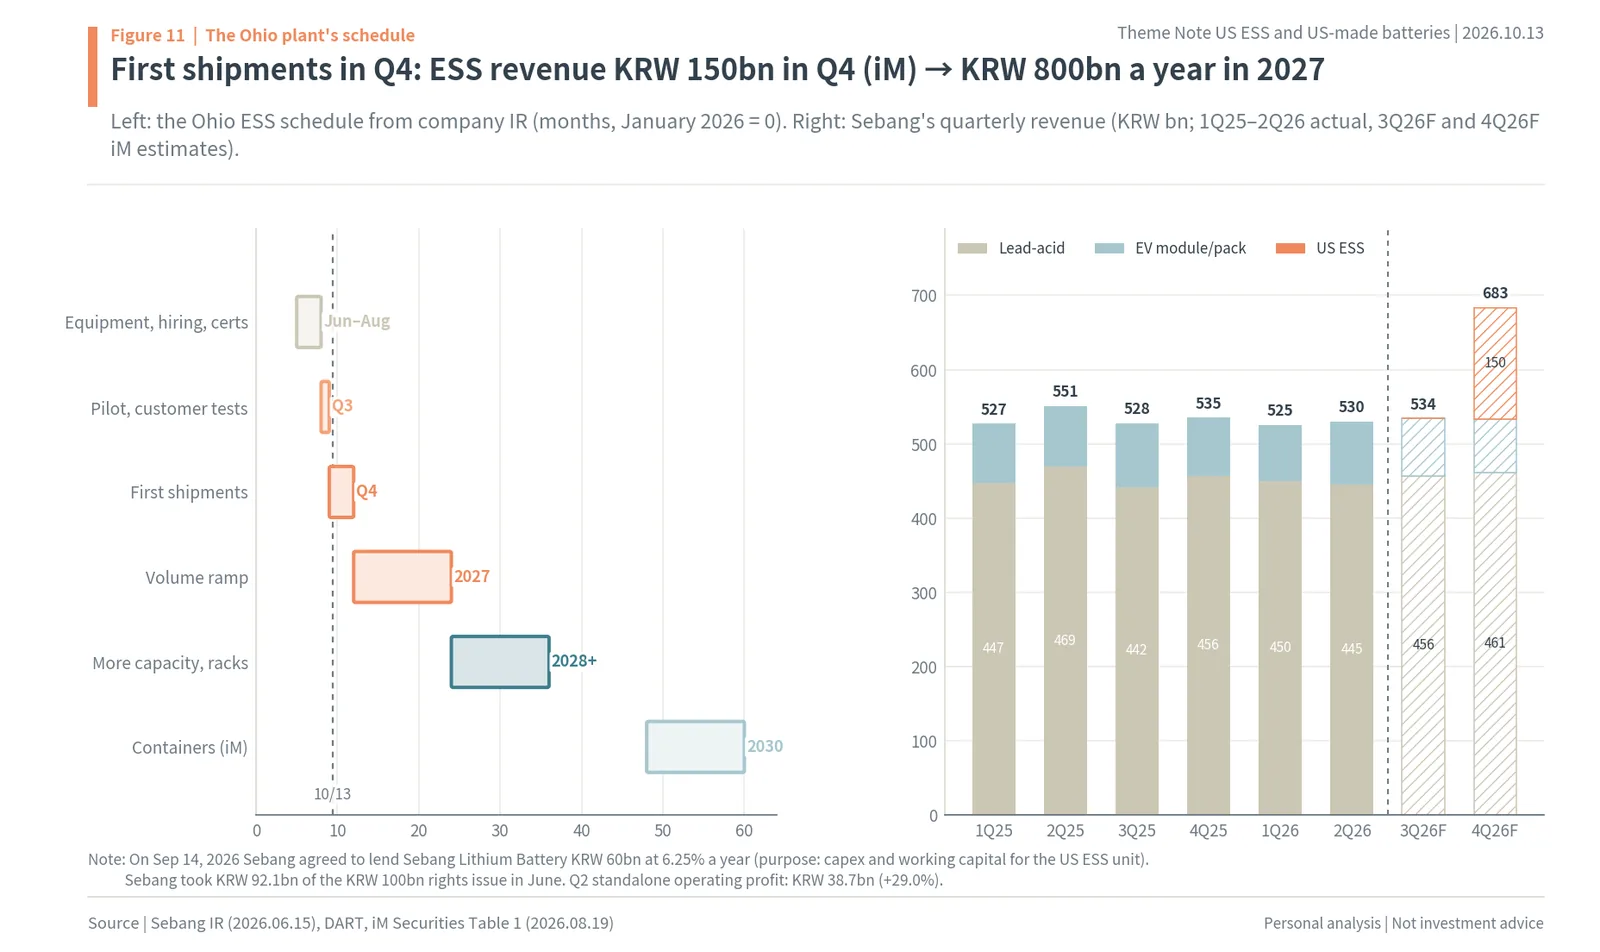
The left side of Figure 11 draws the Ohio schedule from the company’s IR in months from January 2026. As of October 13 it is between pilot production and first shipments. The right side is Sebang Global Battery’s quarterly revenue. From the first quarter of 2025 to the second quarter of 2026, quarterly revenue moved between KRW 525.0bn and KRW 551.0bn, with lead-acid batteries at KRW 442.0bn to KRW 469.0bn and EV modules and packs at KRW 75.0bn to KRW 86.0bn. iM Securities estimates that KRW 150bn of US ESS revenue comes in for the first time in the fourth quarter, taking quarterly revenue to KRW 683.0bn. In 2027, ESS revenue averaging KRW 200bn a quarter continues. Quarterly revenue that stayed in the KRW 500bn range for the last six quarters steps up a level on US pack assembly alone.
How this business meshes with the cell maker’s bottleneck shows why the volume went to Sebang. LG Energy Solution hit a pack and container bottleneck while raising its North American ESS cell capacity to more than 50GWh within 2026. Building all of its pack lines itself would take a cell maker time, and Sebang Lithium Battery is an assembler that has already mass-produced EV modules and packs. Building the assembly plant in the same town as the cell plant means cells need not travel far, and modules must also be bundled on US soil to collect the full $45 per kWh, $35 for the cell plus $10 for the module. The company’s IR stresses an “order-based investment” because the customer and volume were fixed before the plant was built.
US ESS stocks ranked by revenue to market cap: Sebang Global Battery 0.95x, LG Energy Solution 0.18x
Against market cap, the company earning the most from US ESS is Sebang Global Battery. For each company the author divided “annual revenue tied to US ESS” by market cap. Sebang Global Battery’s ratio is 0.95x, the company IR’s KRW 800bn a year divided by a market cap of KRW 841.3bn. LG Energy Solution’s is 0.18x, IBK’s and iM’s 2027 ESS revenue estimates of KRW 17.239tn to KRW 17.722tn divided by a market cap of KRW 95.94tn (about $71.7bn), and Samsung SDI’s is 0.14x to 0.18x, Hana’s and iM’s 2027 ESS revenue of KRW 6.268tn to KRW 7.955tn divided by KRW 45.13tn (about $33.7bn). Sebang Global Battery’s ratio is 5.3 times LG Energy Solution’s and 5.3 to 6.8 times Samsung SDI’s (author’s calculation).
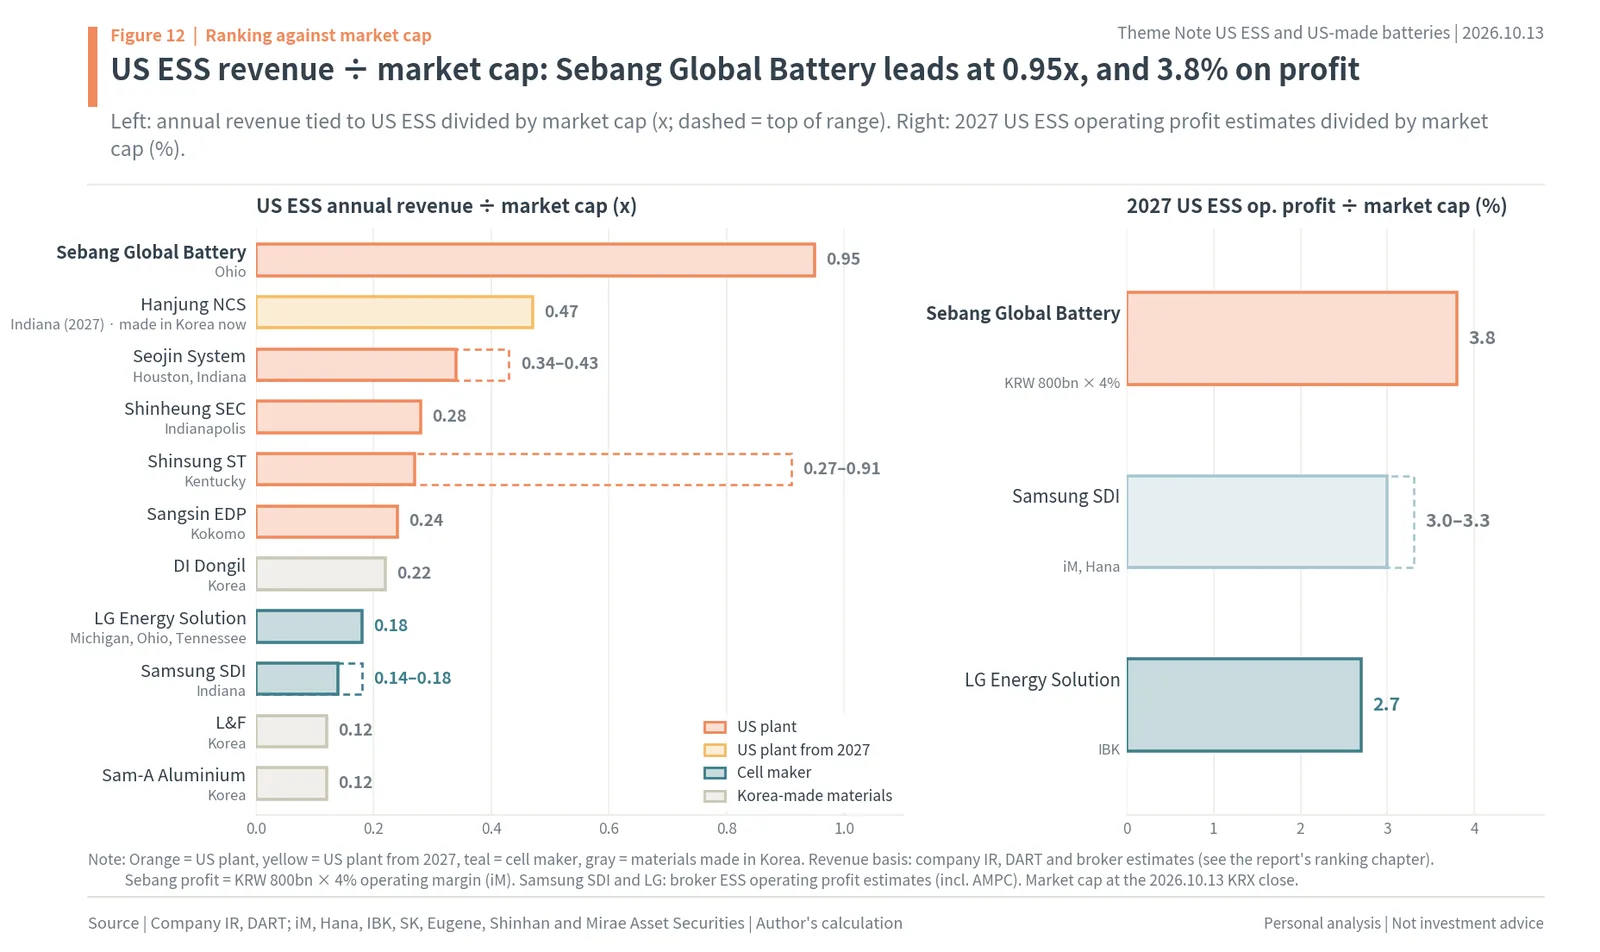
The left side of Figure 12 lines up these ratios. Orange is companies with plants on US soil, yellow is companies whose US plant starts in 2027, teal is the cell makers, and gray is materials makers that produce in Korea and ship to US ESS lines. Dashed outlines are the top of a range. After Sebang Global Battery come Hanjung NCS at 0.47x (first-half ESS parts revenue of KRW 94.3bn × 2, made in Korea for now), Seojin System at 0.34x to 0.43x (SK and Eugene’s 2027 ESS revenue of KRW 877.3bn to KRW 1.1249tn), Shinheung SEC at 0.28x (Shinhan Securities’ 2026 US unit revenue of KRW 70bn), Shinsung ST at 0.27x to 0.91x (from first-half North American revenue of KRW 34.5bn × 2 up to Kentucky capacity of KRW 230bn), Sangsin EDP at 0.24x (Eugene’s 2026 US BESS can revenue of KRW 80bn) and DI Dongil at 0.22x (aluminum foil revenue of KRW 252.7bn × 50% ESS). They are followed by LG Energy Solution at 0.18x, Samsung SDI at 0.14x to 0.18x, L&F at 0.12x (KRW 1.6067tn of LFP cathode for Samsung SDI’s US ESS over three years) and Sam-A Aluminium at 0.12x. SK Innovation was left out of the chart because SK On’s 9GWh NeoVolta contract (about KRW 1.5tn by industry estimates, over five years) is just 0.01x even spread by year.
Because the ratio is based on revenue, companies with different margins should also be compared on profit. The bars on the right are 2027 US ESS operating profit estimates divided by market cap. For Sebang Global Battery, KRW 800bn a year times iM Securities’ expected 4% operating margin is KRW 32.0bn, 3.8% of market cap. Samsung SDI is 3.0% to 3.3% on iM’s and Hana’s ESS operating profit (including the credit) of KRW 1.34tn to KRW 1.498tn, and LG Energy Solution is 2.7% on KRW 2.584tn from adding up IBK’s estimates. Even multiplied by an assembler’s thin margin, Sebang Global Battery’s profit against market cap is larger than the two cell makers’.
The reason for this ranking is size. Cell makers carry EV, small battery, European and Chinese businesses in their market caps besides US ESS, so even if US ESS profit runs to trillions of won, its share of market cap stays in single digits. Sebang Global Battery has a market cap of KRW 841.3bn and creates KRW 800bn a year of new revenue from US ESS. When the same US ESS volume goes into a small bowl, it looms large against the bowl. So the answer to “which US-soil manufacturer gains the most against its market cap” is not a cell maker but the assembler handling the cell makers’ bottleneck: Sebang Global Battery.
Non-Chinese LFP cathode and aluminum foil: L&F, POSCO Future M, DI Dongil, Sam-A Aluminium
For US-soil cells to claim the tax credit, the materials inside the cell must be non-Chinese too. The non-Chinese threshold for 45X battery components rises from 60% for 2026 sales to 85% in 2030. If a cell maker uses Chinese cathodes or graphite, the ratio drops by that cost. So contracts for non-Chinese cathodes and aluminum foil for US ESS LFP cells followed one after another in 2026.
On March 24, L&F disclosed a medium- to long-term LFP cathode supply agreement with Samsung SDI worth KRW 1.6067tn ($1.0748bn). The supply region is “the US, etc.”, and Mirae Asset Securities saw this volume as being for Samsung SDI’s North American ESS. On September 17 it signed a KRW 161.7bn LFP cathode contract with SK On. POSCO Future M (003670.KS) disclosed on September 22 an LFP cathode contract with SK On worth KRW 1.0742tn for 2027 to 2029 (supply region “the US, etc.”). Kyobo Securities put the North American ESS lines of Korea’s three cell makers at about 100GWh and calculated the non-Chinese LFP cathode needed at more than 200,000 tons.
Aluminum foil is on the same path. LFP cells use carbon-coated aluminum foil as the cathode current collector. At DI Dongil, coated foil sales for Korean cell makers’ US LFP ESS rose sharply, lifting ESS from 20% of battery aluminum foil revenue in the fourth quarter of 2025 to 50% in the first quarter of 2026 (Eugene Investment & Securities), and Sam-A Aluminium signed a long-term supply contract with LG Energy Solution running to 2030, with its ESS revenue share rising from 17% in 2025 to 31% in 2026 (SK Securities). These companies’ ratios to market cap are 0.12x for L&F, 0.22x for DI Dongil and 0.12x for Sam-A Aluminium.
These materials makers produce in Korea and ship to US cell plants. The 45X credit from US-soil production goes to the cell makers, and the materials makers receive the demand for “non-Chinese materials” created by FEOC. That is why, in this report’s ranking of gains for companies making directly on US soil, the materials makers are colored gray separately. In that the demand comes from the same wall, they sit on the same chain as Sebang Global Battery and the cell makers.
Sebang Global Battery earnings forecast: KRW 206.0bn operating profit in 2027, 61% of the gain from US ESS
US ESS makes most of Sebang Global Battery’s profit growth. iM Securities estimated Sebang Global Battery’s 2027 consolidated results at revenue of KRW 2,998.0bn (about $2.24bn), operating profit of KRW 206.0bn and net profit to owners of KRW 182.0bn. Compared with 2025 (revenue KRW 2,142.1bn, operating profit KRW 153.8bn, net profit to owners KRW 141.1bn), revenue is 40.0% higher, operating profit 33.9% and net profit 29.0%. iM Securities called these record results that come out “even after conservatively reflecting the early ramp-up process”.
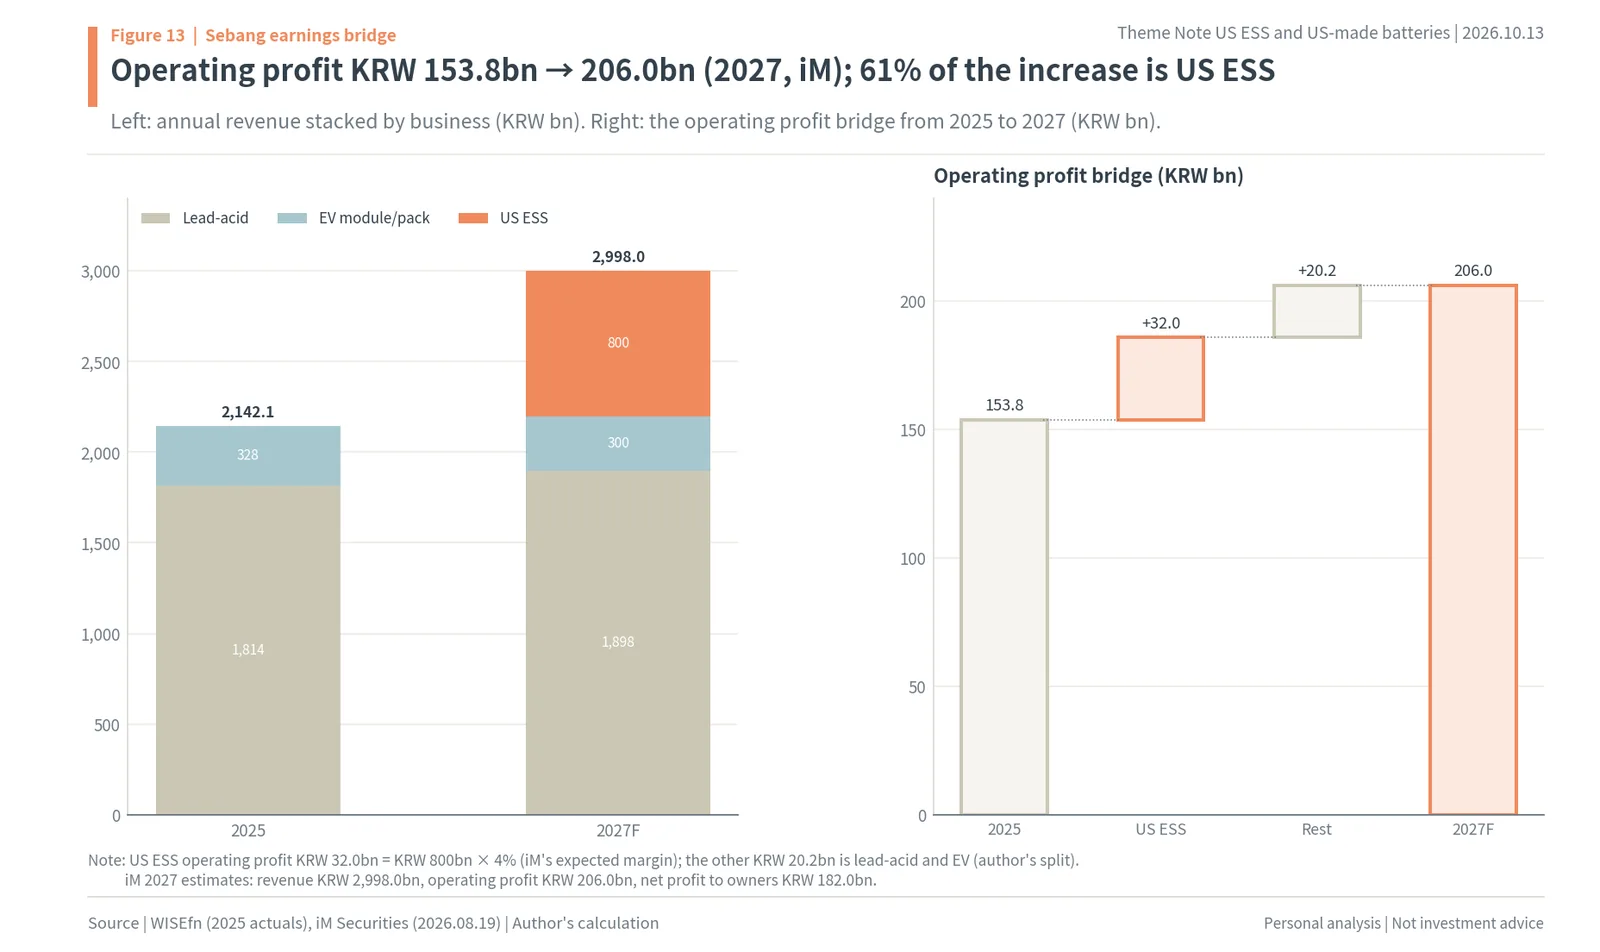
The left side of Figure 13 stacks annual revenue by business. Lead-acid batteries rise slightly from KRW 1,814.0bn to KRW 1,898.0bn, EV modules and packs fall from KRW 328.0bn to KRW 300.0bn, and US ESS modules and packs of KRW 800bn are newly added on top. The right side is the operating profit bridge. To 2025’s KRW 153.8bn are added KRW 32.0bn from US ESS (KRW 800bn × 4%) and KRW 20.2bn from the rest (lead-acid and EV, author’s split), reaching KRW 206.0bn in 2027. Of the KRW 52.2bn increase, 61% is US ESS.
The core business also supports this bridge. The parent company’s standalone operating profit in the second quarter of 2026 was KRW 38.7bn, up 29.0% from a year earlier. The company’s IR explained that while Middle East sales fell because of the war in the Middle East, it raised the share of high-margin products (AGM) and lifted prices, taking the operating margin to 9.56%. Cash earned by lead-acid batteries funds the KRW 150bn Ohio plant investment, and the Ohio plant lifts revenue and profit a level from 2027. Sebang Lithium Battery posted a net loss of KRW 18.0bn in 2025, and iM Securities expects the subsidiary’s profitability to turn as US ESS mass-production revenue comes in from the fourth quarter.
Sebang’s lead-acid core business: AGM 27%, a 9.56% margin and a 4.4% dividend yield
Sebang Global Battery can put KRW 150bn into the Ohio plant because its core business earns cash. About 85% of the parent’s lead-acid revenue is automotive, split between batteries fitted to new cars and replacement demand a few years later (iM Securities). Replacement demand moves with the number of cars already on the road, so it does not swing much from year to year. Within it, the share of AGM batteries, used in idle stop-and-go (ISG) cars and cars with heavy electrical loads, rose from 23.1% in 2023 to 24.4% in 2024 and 27% in 2025. AGM batteries carry higher prices and margins than ordinary lead-acid batteries.
The company’s second-quarter IR materials released in August show parent standalone revenue of KRW 405.2bn, down 4.75% from a year earlier, but operating profit of KRW 38.7bn, up 29.05%, for an operating margin of 9.56%. The company explained that as the Middle East war dragged on, unit sales to the Middle East and Africa fell, but it raised profit by increasing the share of high-margin products and passing higher material costs on to prices. Overseas automotive replacement-market revenue in the second quarter was KRW 95.8bn in Europe, KRW 60.5bn in Asia-Pacific, KRW 60.3bn in the Americas and KRW 36.0bn in the Middle East and Africa.
The cash earned by the core business goes to both investment and dividends. Hana Securities (June 16) put the parent’s cash and equivalents at KRW 281.5bn at the end of the first quarter of 2026, and Sebang Global Battery used that cash for the KRW 92.1bn Sebang Lithium Battery rights issue and the KRW 60bn loan in September. Under a shareholder return policy that raised the payout ratio to 25%, the 2025 dividend per share was KRW 2,650 (about $2.0), a 4.4% yield at the current share price. The Ohio plant sits on top of this core business, so if 2027 US ESS revenue arrives as planned, consolidated revenue steps up a level and that profit flows back into dividends and the next stage of investment (racks and containers).
Samsung SDI vs LG Energy Solution: US ESS cells per KRW 1tn of market cap
Comparing the cell makers, Samsung SDI has more US ESS exposure against market cap than LG Energy Solution. At end-2027, US-soil ESS cell capacity is about 57GWh for LG Energy Solution (author’s calculation) and 30 to 35GWh for Samsung SDI, so LG Energy Solution is bigger. But market caps differ by more than double: KRW 95.94tn for LG Energy Solution and KRW 45.13tn for Samsung SDI. Per KRW 1tn of market cap, end-2027 US ESS cells are 0.66 to 0.78GWh for Samsung SDI and 0.59GWh for LG Energy Solution.
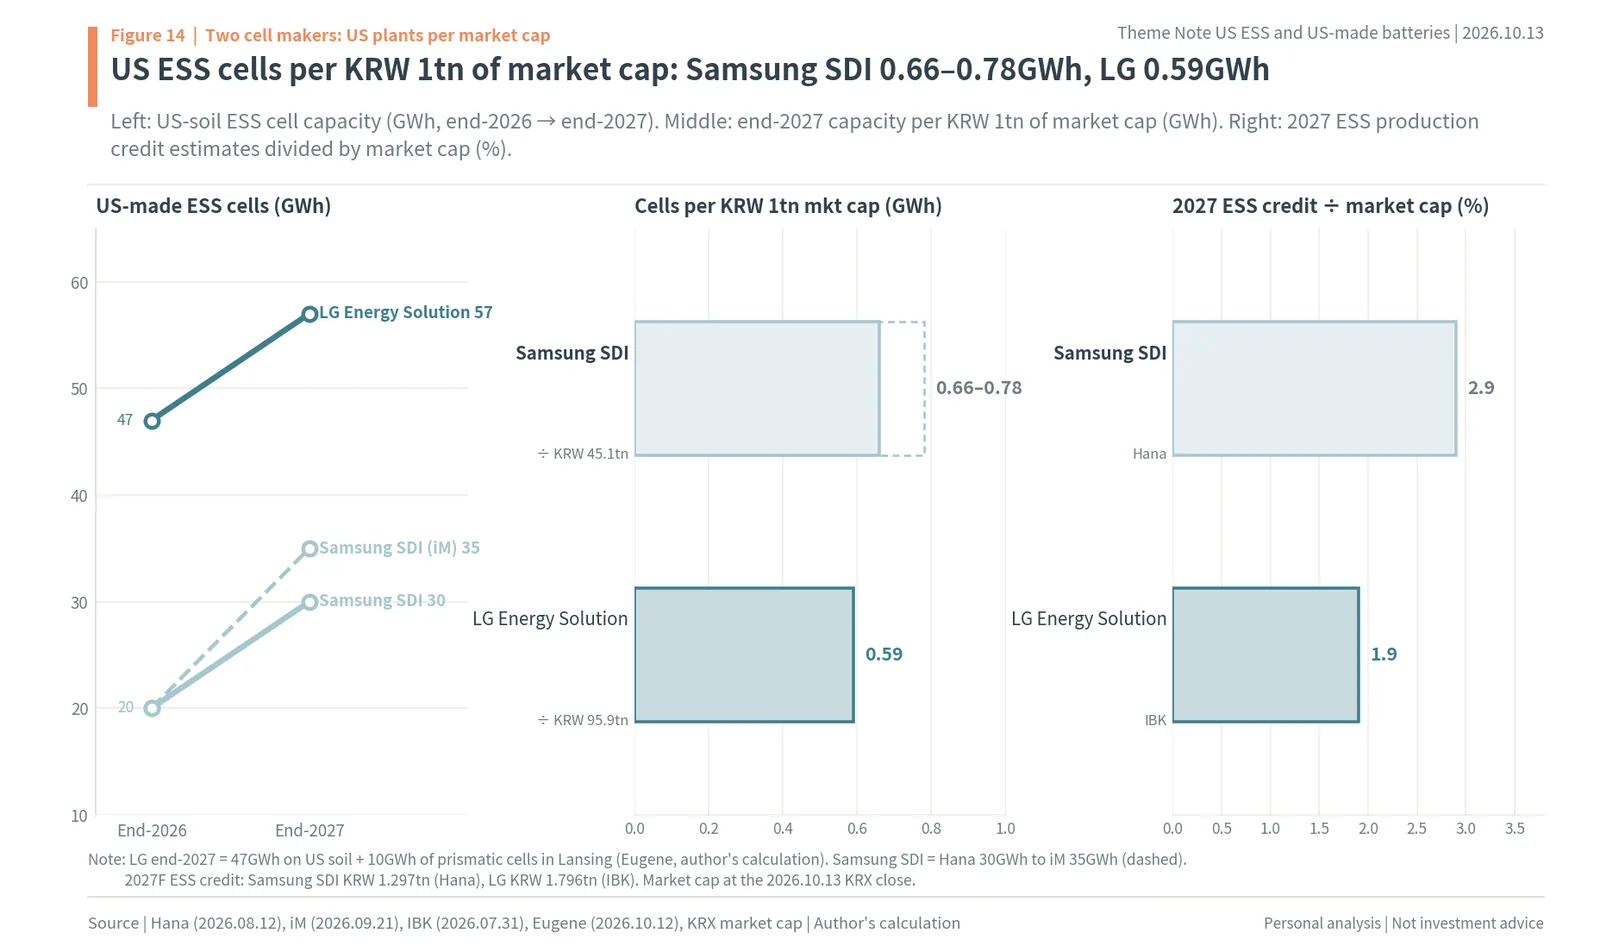
The left side of Figure 14 shows the two companies’ US-soil ESS cell capacity growing from end-2026 to end-2027. LG Energy Solution grows from 47GWh to 57GWh, and Samsung SDI from 20GWh to 30GWh (Hana Securities) to 35GWh (iM Securities, dashed). Samsung SDI climbs more steeply because the LFP lines at StarPlus Energy in Indiana only began mass production in October 2026. The middle shows cells per KRW 1tn of market cap, and the right shows 2027 ESS production credit estimates divided by market cap: 2.9% for Samsung SDI on Hana’s estimate of KRW 1.297tn, and 1.9% for LG Energy Solution on IBK’s estimate of KRW 1.796tn.
Samsung SDI’s orders are also ahead of its plants. In December 2025 it signed an LFP ESS supply contract of more than KRW 2tn (about three years from 2027) with a US energy infrastructure company; in January 2026 its US unit signed a battery supply contract whose counterparty and amount stay undisclosed until 2030; and in March it signed a contract of about KRW 1.5tn (2026 to 2029, NCA and LFP) with a US energy company. On its second-quarter call, the company said that “including projects with a high chance of orders in the second half of this year, demand will exceed existing capacity from 2028”. With plants unable to keep up with demand, it plans to turn the New Carlisle joint venture into a wholly owned unit to secure more ESS lines.
So among the cell makers, the author puts Samsung SDI ahead of LG Energy Solution. LG Energy Solution has the largest absolute US ESS scale and backlog (about 140GWh at end-2025, centered on North America), but that gain is spread over a KRW 95tn body. Samsung SDI runs more US plant for its size inside the same wall.
Sebang Global Battery valuation: 4.6x PER, KRW 84,000 at 6.4x and KRW 131,300 at 10x
The share price has priced in almost none of Sebang Global Battery’s US ESS. Sebang Global Battery closed at KRW 60,700 (about $45.4) on October 13, a PER of 4.6x on EPS of KRW 13,131, iM Securities’ 2027 net profit to owners of KRW 182.0bn divided by 13.86mn listed shares. Even on 2025 EPS of KRW 10,076 it is 6.0x. On the same 2027 forward EPS basis, Seojin System trades at 14.2x on KRW 2,872, Samsung SDI at 31.5x on KRW 17,797 and LG Energy Solution at 50.3x on KRW 8,159 (WISEfn consensus; WISEfn is the Korean data provider behind WiseReport). The PBR is 0.48x, and the 2025 dividend per share of KRW 2,650 is 4.4% of the current share price.
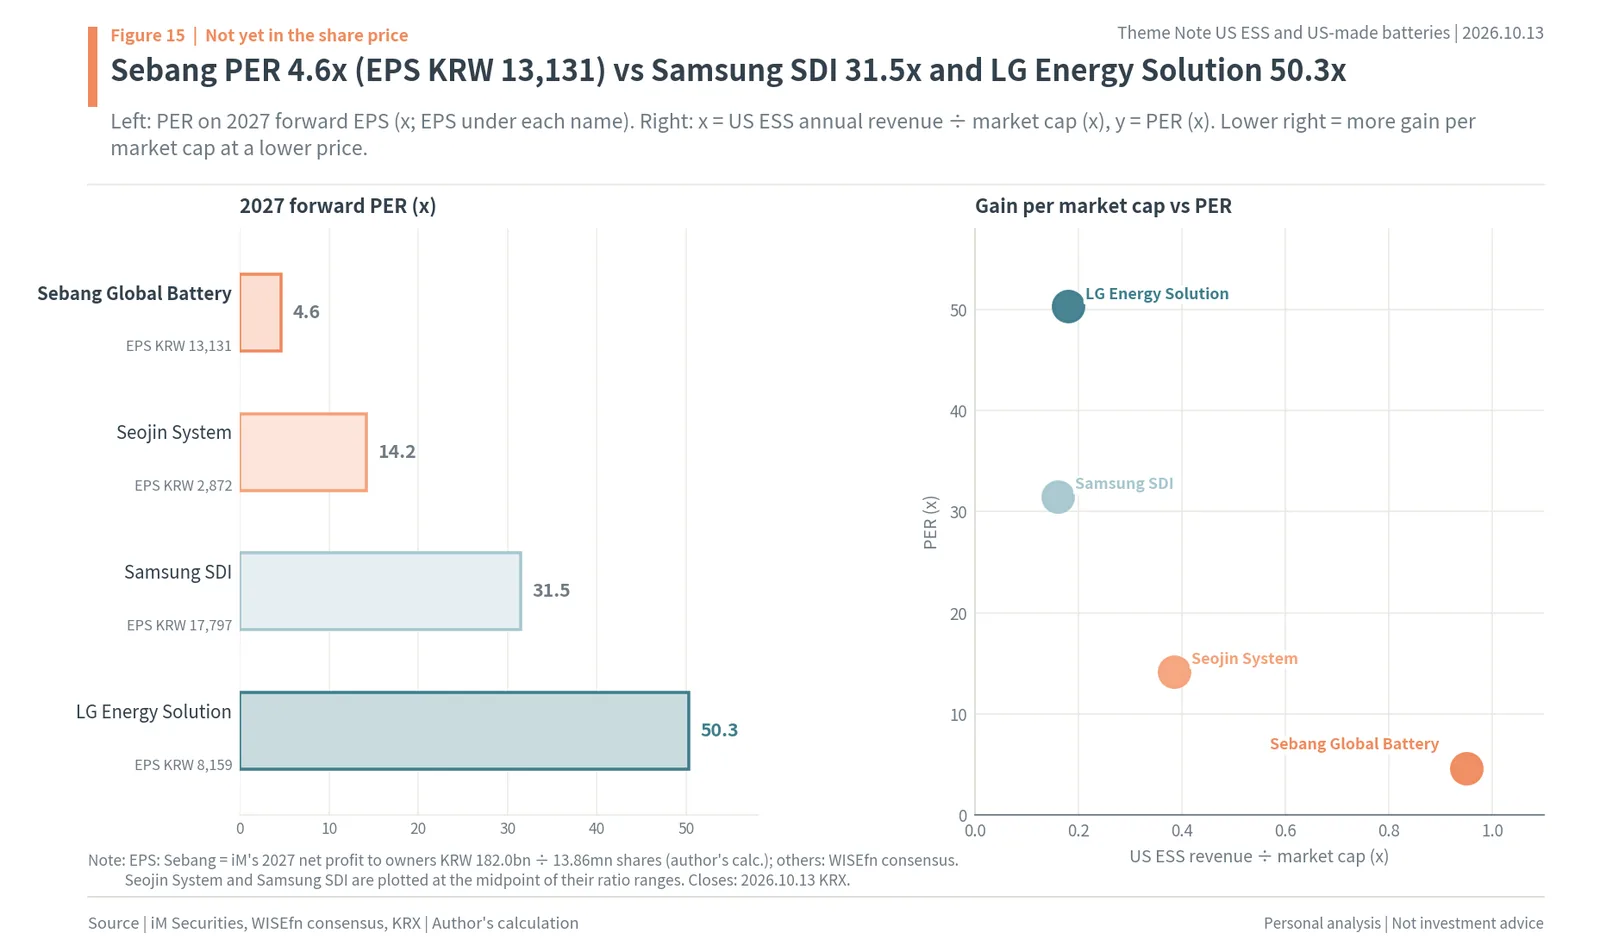
The left side of Figure 15 lines up 2027 forward PER with forward EPS. The right side is a scatter with US ESS annual revenue ÷ market cap on the horizontal axis and PER on the vertical. The further toward the lower right, the bigger the gain against market cap and the cheaper the price. Sebang Global Battery sits alone at the far lower right, and LG Energy Solution at the far upper left. The market has put US ESS into the cell makers’ share prices but not yet into the assembler on the same chain.
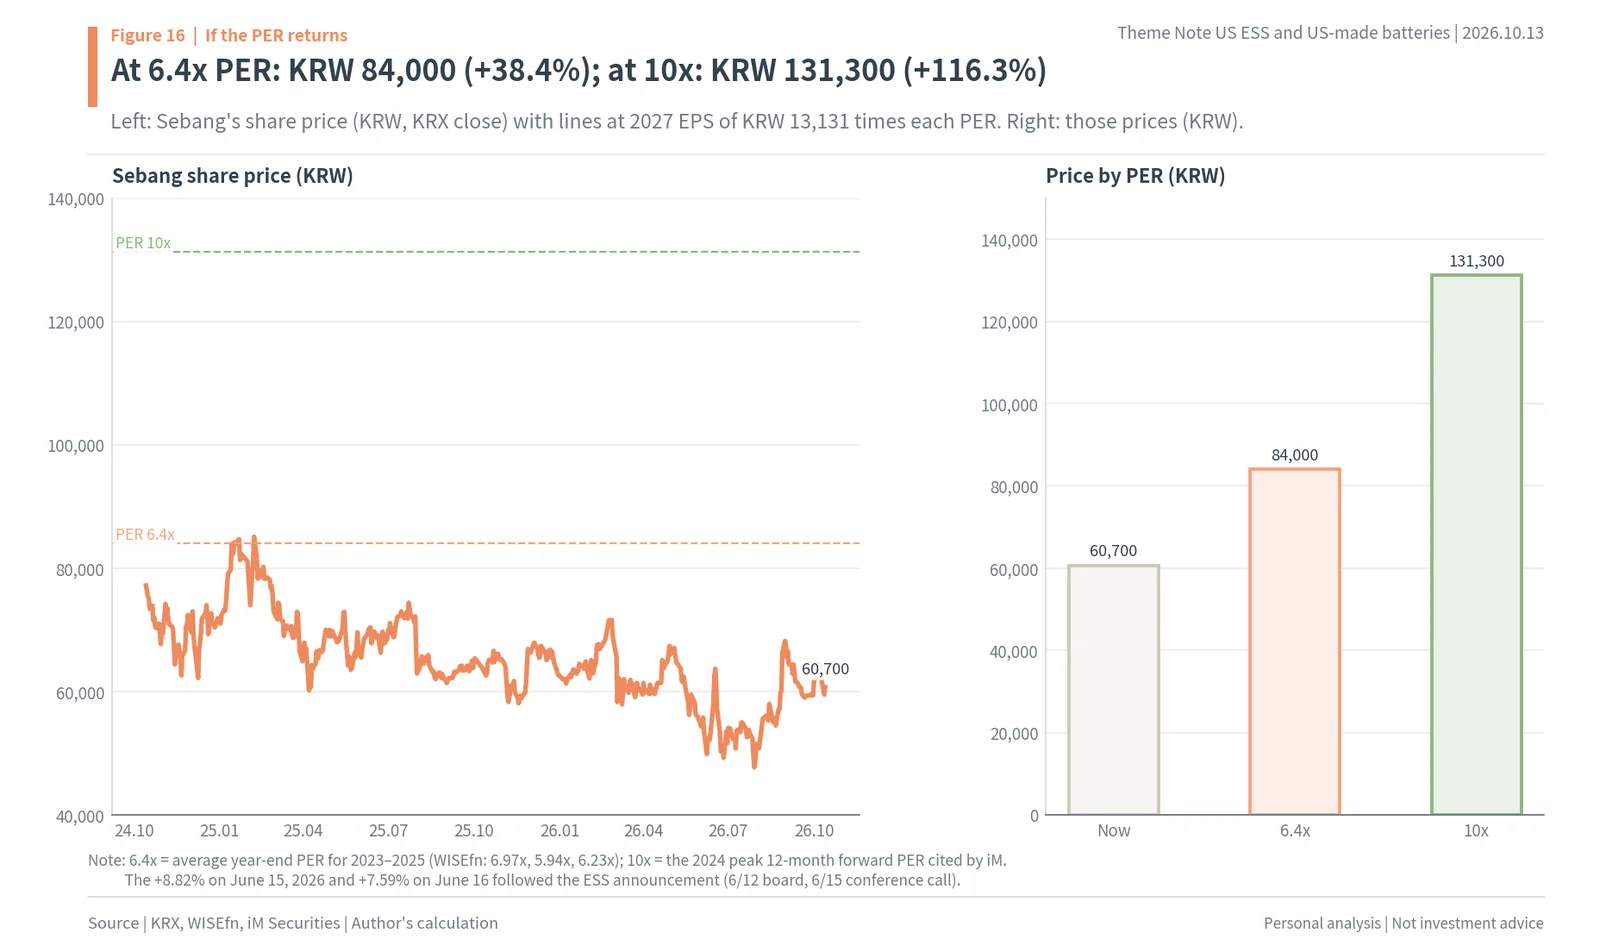
Figure 16 shows the share price if the PER returns to past levels. WISEfn’s year-end PER for Sebang Global Battery was 6.97x in 2023, 5.94x in 2024 and 6.23x in 2025, an average of 6.4x. Multiplying 2027 EPS of KRW 13,131 by 6.4x gives KRW 84,000 (about $62.8), 38.4% above the current price. iM Securities wrote that Sebang Global Battery’s 12-month forward PER rose to about 10x in 2024, when supply to Samsung SDI and the lead-acid mix were improving. Multiplying by 10x gives KRW 131,300 (about $98.2), 116.3% higher (author’s calculation). The line chart on the left shows that Sebang Global Battery’s share price rose to KRW 85,100 on February 7, 2025, fell to KRW 47,700 in July 2026, rose 8.82% and 7.59% on the two days after the June 15 ESS announcement, and then returned to around KRW 60,000.
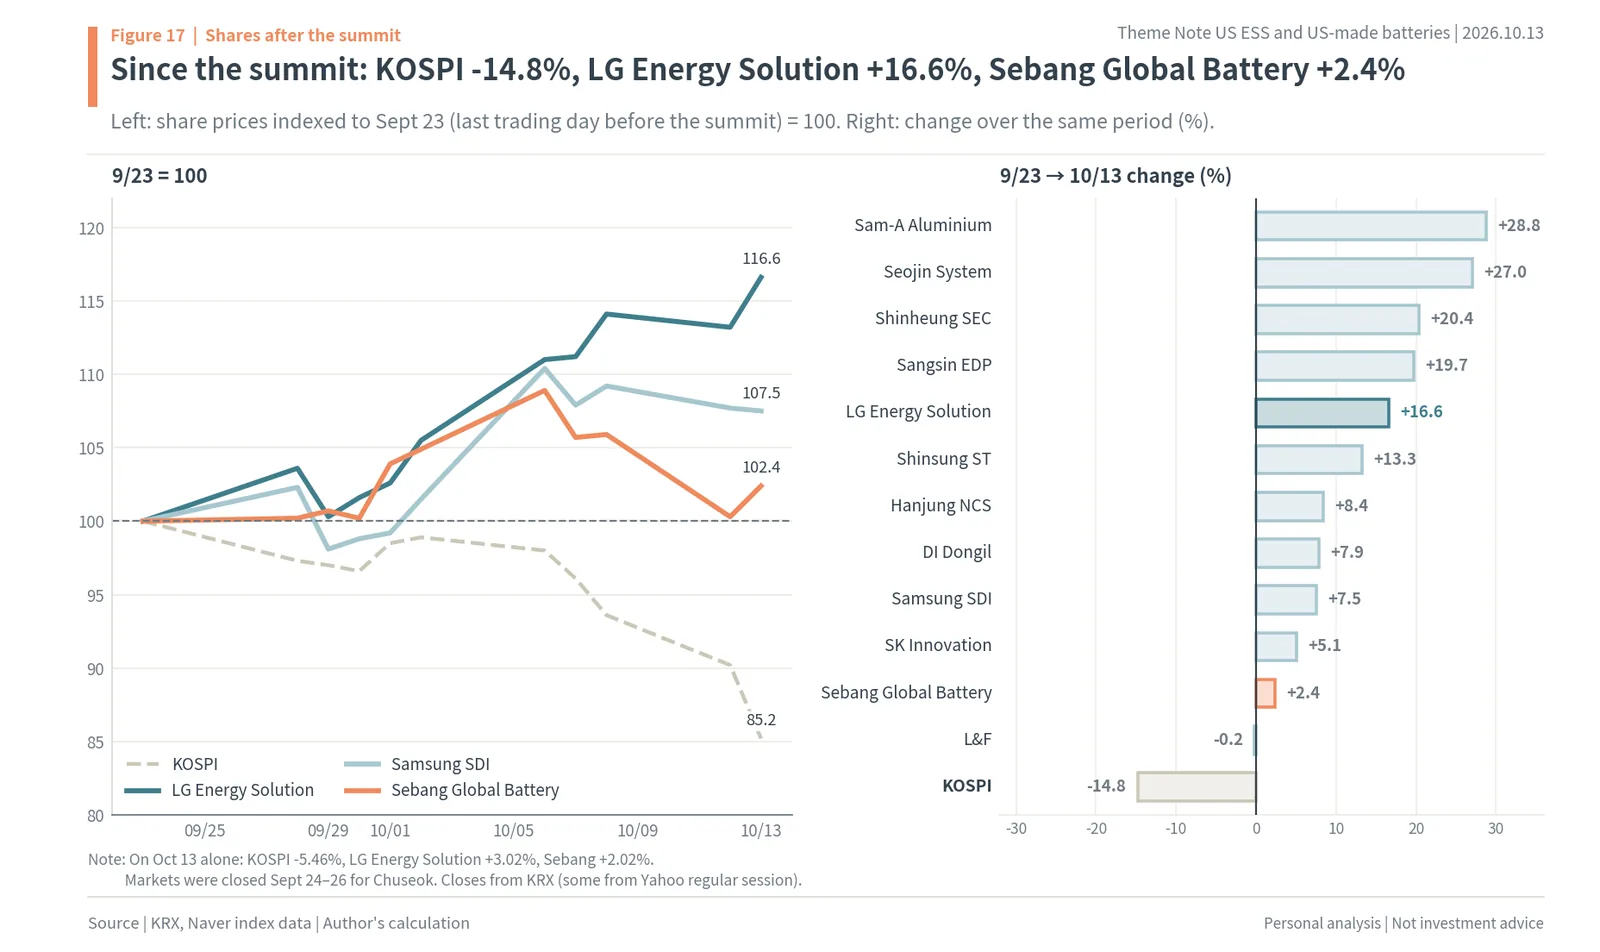
Figure 17 shows share prices in the three weeks after the summit. With September 23, the last trading day before the summit, set at 100, on October 13 the KOSPI is at 85.2 (-14.8%) while LG Energy Solution is at 116.6 (+16.6%), Samsung SDI at 107.5 (+7.5%) and Sebang Global Battery at 102.4 (+2.4%). As the bars on the right show, over the same period Sam-A Aluminium rose 28.8%, Seojin System 27.0%, Shinheung SEC 20.4%, Sangsin EDP 19.7% and Shinsung ST 13.3%. Even on October 13, when the KOSPI fell 5.46% in a single day, LG Energy Solution rose 3.02% and Sebang Global Battery 2.02%. The market bought the US ESS chain after the summit, but among the companies with plants on US soil, Sebang Global Battery rose the least. Over one year, Sebang Global Battery is down 3.5%, 71.9 percentage points behind the KOSPI’s +68.4%.
The company with the biggest gain against market cap, the lowest PER and the smallest rise since the summit among US-soil plant owners is the same company. That is why the author puts Sebang Global Battery first.
Dates to watch: Samsung SDI Oct 29, LG Energy Solution Nov 3, DOE rule Dec 24, truce end Jan 10
The days when this chain is confirmed in numbers are set. At 10 a.m. on October 29, Samsung SDI holds its third-quarter earnings briefing (DART filing, October 12). This is where we learn whether the prismatic LFP cells at StarPlus Energy in Indiana started mass production in October, and how much fourth-quarter US ESS shipments and the production credit will grow. At 10 a.m. on November 3, LG Energy Solution holds its third-quarter earnings conference call (DART filing, October 8). It will show how much of the KRW 756.0bn third-quarter operating profit was automaker compensation, and how far North American ESS capacity of more than 50GWh and the pack bottleneck have come.
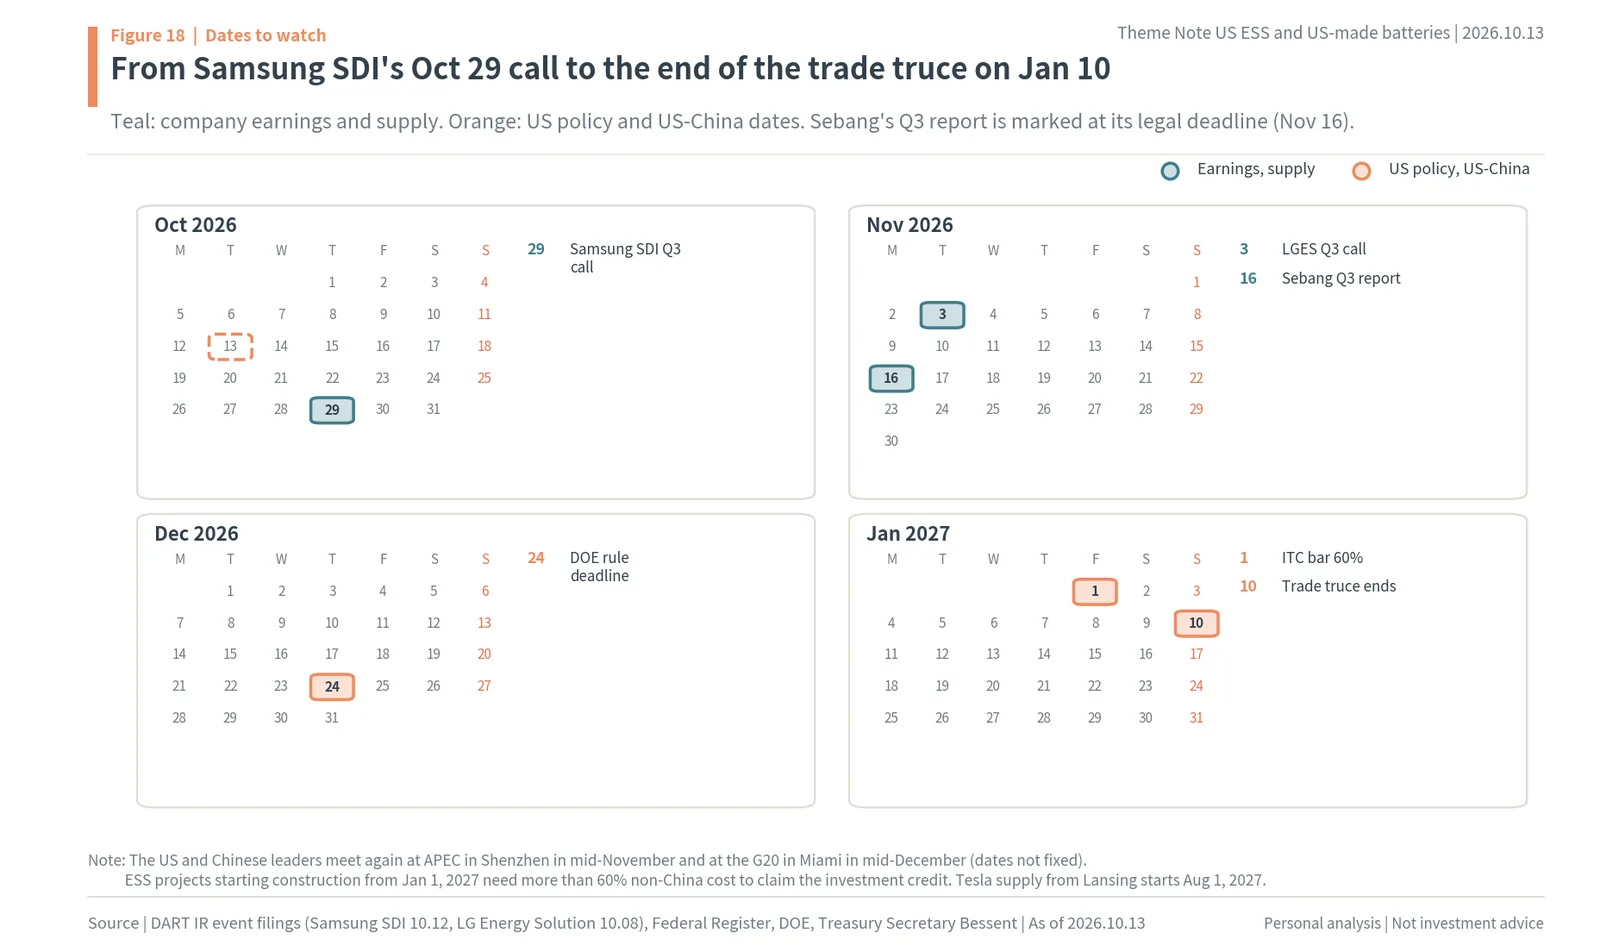
Figure 18 marks these dates on a calendar. Sebang Global Battery’s third-quarter report is marked on its legal deadline of November 16. This report confirms whether the Ohio plant finished pilot production and customer testing in the third quarter and whether the fourth-quarter first-shipment schedule holds. December 24 is the deadline for the Department of Energy to issue implementing rules on bulk-power-system equipment under Executive Order 14421. From January 1, 2027, ESS projects starting construction need non-Chinese cost above 60% to claim the investment tax credit, and on January 10 the US-China trade truce ends. In between, the US and Chinese leaders meet again at APEC in Shenzhen in mid-November and the G20 in Miami in mid-December (dates not fixed).
Of these dates, the closest to Sebang Global Battery’s gain are LG Energy Solution’s November 3 call and Sebang Global Battery’s third-quarter report. If LG Energy Solution says it will raise 2027 North American ESS shipments, the pack assembly volume to bundle those cells grows with them. If Sebang Global Battery confirms its fourth-quarter first shipments, the KRW 800bn a year moves from a company target to actual revenue. On August 1, 2027, Tesla LFP supply from LG Energy Solution’s Lansing plant begins.
Data and methods: tariffs, tax credit thresholds, US plant capacity and market-cap ratios
The numbers in this report come only from company filings and IR, original US government texts, broker reports and market data, and values the author divided or added are marked “author’s calculation”. Where the same item differs by source, the choice of value is gathered here.
The tariff layers were added up from the original text of the forced-labor Section 301 notice in the Federal Register (91 FR 47318, published July 28, 2026) and AES’s quarterly report (Section 301 at 25%). Their sum of 40.9% matches KIET’s August 27 report. The 58.4% or 82.4% often seen in 2025 articles are old numbers that include IEEPA tariff layers struck down by the Supreme Court ruling on February 20, 2026, so they are not used. Korea’s 12.5% follows the Federal Register wording “12.5% including the base tariff”.
The tax credit thresholds (55% to 75%, 60% to 85%), the 45X amounts ($35 for cells, $10 for modules) and the phase-down schedule are from the original text of 26 U.S.C. §7701(a)(52) and §45X. The 52.0% cell cost and the items outside the cell are from the grid-scale BESS cost table in IRS Notice 2025-08, and the 48% non-Chinese share of an ESS with Chinese cells is the author’s calculation of 100 minus 52. KRW 60.2bn per GWh is $45 × 1 million kWh × KRW 1,337.7 (Yahoo Finance KRW per dollar on October 13).
US ESS installations use the SEIA and Benchmark counts (59GWh in 2025, 71GWh in 2026), and Wood Mackenzie’s separate count (18.9GWh in the second quarter) is not mixed in. The import share is S&P Global’s count of all lithium-ion batteries (by weight) from Census Bureau data, not a figure for ESS alone.
Because company announcements are not split by plant, plant capacities use IBK Investment & Securities (LG Energy Solution GWh by plant) and Hana and iM Securities (Samsung SDI at end-2026 and end-2027). LG Energy Solution’s 47GWh on US soil is IBK’s 57GWh minus 10GWh at NextStar in Canada, and the 57GWh at end-2027 adds the 10GWh of prismatic capacity in Lansing cited by Eugene Investment & Securities (author’s calculation). The production credits (LG Energy Solution KRW 189.8bn, KRW 241.0bn and KRW 416.9bn) are company figures.
The numerator of the ratio to market cap has a different basis for each company. Sebang Global Battery uses the company IR’s “expected annual revenue of KRW 800bn” (the same as iM Securities’ estimate); the two cell makers use brokers’ 2027 ESS revenue estimates; Seojin System uses SK and Eugene’s 2027 ESS revenue; Shinheung SEC and Sangsin EDP use Shinhan’s and Eugene’s 2026 US revenue estimates; Shinsung ST uses twice its half-year North American revenue and its Kentucky capacity; Hanjung NCS uses twice its half-year ESS parts revenue; L&F uses the DART-disclosed contract amount divided by three years; and DI Dongil and Sam-A Aluminium use brokers’ aluminum foil revenue times the ESS share. The denominator is always market cap at the October 13 KRX close.
The profit ratio uses KRW 800bn × iM Securities’ expected 4% operating margin for Sebang Global Battery; iM’s (KRW 1.34tn) and Hana’s (KRW 1.498tn, including a KRW 1.297tn credit) ESS operating profit for Samsung SDI; and IBK’s ESS operating profit (KRW 788.0bn excluding the credit) plus its ESS credit (KRW 1.796tn) for LG Energy Solution. Sebang Global Battery’s 2027 EPS of KRW 13,131 is iM Securities’ net profit to owners of KRW 182.0bn divided by 13.86mn listed shares, and the other companies’ 2027 EPS is WISEfn consensus. The 6.4x PER is the average of WISEfn year-end PERs for 2023 to 2025, and 10x is the 2024 12-month forward PER cited by iM Securities. Dollar conversions use KRW 1,337.7 per dollar (Yahoo Finance, October 13, 2026).
Wrap-up: US ESS stocks ranked Sebang Global Battery, Samsung SDI, LG Energy Solution
Maochaedung’s take. The September US-China summit extended the truce by two months and cut tariffs on $30bn of consumer goods, but it did not touch batteries. Chinese ESS batteries still carry a 40.9% tariff, an ESS project starting construction in 2026 with Chinese cells drops to a 48% non-Chinese share and loses the investment tax credit, and Executive Order 14421 created grounds to keep Chinese equipment out of grid-connected ESS. So the 71GWh of US ESS goes to non-Chinese cells made on US soil, and most of those cells come from the US plants of LG Energy Solution (47GWh) and Samsung SDI (20GWh → 30 to 35GWh). Making in the US earns a production tax credit of about KRW 60.2bn per GWh, and that credit was 55.1% of LG Energy Solution’s third-quarter operating profit. As cells grew, the bottleneck moved to packs, and Sebang Global Battery, which bundles LG Energy Solution’s ESS modules and packs in Ohio, books US ESS revenue equal to 0.95x its market cap. On profit, too, that is 3.8% of market cap, more than the two cell makers. Yet its PER is 4.6x on 2027 EPS of KRW 13,131, and its share price trailed the KOSPI by 71.9 percentage points over the past year. The author ranks them Sebang Global Battery, then Samsung SDI, then LG Energy Solution.
US ESS stocks and Sebang Global Battery FAQ
Q. Did the US-China summit cut tariffs on batteries?
No. The September 24, 2026 summit extended the trade truce from November 10, 2026 to January 10, 2027 and cut tariffs on about $30bn of non-sensitive goods, but semiconductors, EVs and batteries were left off the list. Chinese ESS lithium-ion batteries still pay 40.9% (3.4% base, 25% Section 301 and 12.5% forced-labor Section 301), Korean ones 12.5% and US-made cells 0%.
Q. Why can’t US ESS developers use Chinese cells and keep the tax credit?
Under the FEOC rule, an ESS project starting construction in 2026 needs at least 55% non-Chinese cost to claim the investment tax credit. Cells are 52% of a grid-scale ESS’s cost in IRS Notice 2025-08, so an ESS with Chinese cells has a 48% non-Chinese share and loses the credit (author’s calculation). The bar rises 5 percentage points a year to 75% in 2030.
Q. Which Korean companies make ESS cells in the US?
LG Energy Solution has 47GWh of ESS cell capacity on US soil (Holland, Lansing, the Honda joint venture in Ohio and the GM joint venture in Tennessee; author’s calculation), and Samsung SDI has 20GWh in Kokomo, Indiana, rising to 30 to 35GWh by end-2027. Making cells and modules in the US earns $45 per kWh under 45X, about KRW 60.2bn per GWh.
Q. Why is Sebang Global Battery a US ESS stock?
Its subsidiary Sebang Lithium Battery assembles LG Energy Solution’s US ESS modules and packs in Jeffersonville, Ohio, with first shipments in Q4 2026. Company IR targets KRW 800bn of annual revenue, 0.95x its KRW 841.3bn market cap, the highest ratio among the Korean stocks compared, vs 0.18x for LG Energy Solution and 0.14x to 0.18x for Samsung SDI.
Q. How is Sebang Global Battery valued?
At the October 13, 2026 close of KRW 60,700 (about $45.4), the PER is 4.6x on 2027 EPS of KRW 13,131 (iM Securities’ net profit to owners of KRW 182.0bn ÷ 13.86mn shares), vs 31.5x for Samsung SDI and 50.3x for LG Energy Solution. At its 2023-2025 average PER of 6.4x the price would be KRW 84,000 (+38.4%), and at 10x KRW 131,300 (+116.3%).
Sources
- MercoPress, US-China summit extends truce with no substantive deals (link), 2026.09.25
- Global Economic, Trump-Xi White House summit extends trade truce by two months (link), 2026.09.25
- ABC News4 (Sinclair), batteries left off the $30bn tariff-cut list (link), 2026.09.28
- US Federal Register 91 FR 47318, Section 301 forced-labor tariff (link), 2026.07.28
- AES Corp 10-Q, 25% Section 301 tariff on Chinese ESS batteries (link), 2026.05
- Edaily, KIET: 40.9% tariff on Chinese ESS vs 12.5% on Korean (link), 2026.08.27
- US Code 26 U.S.C. §7701(a)(52) and §45X (https://www.law.cornell.edu/uscode/text/26/7701, https://www.law.cornell.edu/uscode/text/26/45X)
- IRS Notice 2025-08 and 2026-15 (https://www.irs.gov/pub/irs-drop/n-25-08.pdf, https://www.irs.gov/pub/irs-drop/n-26-15.pdf)
- PV Tech, Executive Order 14421 on bulk-power-system equipment (link), 2026.08.27
- ESS News, SEIA and Benchmark: record 20.2GWh in Q2, 71GWh in 2026 (link), 2026.09.01
- S&P Global, US lithium-ion battery imports by country (link), 2026.08.24
- Solar Power World, Intertek CEA: 80% of FEOC-compliant cells are Korean (link), 2026.01.05
- LG Energy Solution, Q1 and Q2 2026 earnings call transcripts (link), 2026.04.30 and 07.30
- Financial News, LG Energy Solution preliminary Q3 results and KRW 416.9bn AMPC (link), 2026.10.08
- IBK Investment & Securities, LG Energy Solution (link), 2026.07.31
- Hana Securities, LG Energy Solution (link), 2026.10.12 / Samsung SDI (link), 2026.08.12
- iM Securities, Samsung SDI (link), 2026.09.21 / LG Energy Solution (link), 2026.10.12
- Sebang Global Battery IR, Sebang Lithium Battery North American utility ESS business conference call materials (link), 2026.06.15
- DART, Sebang Global Battery half-year report (link), 2026.08.14 / loan decision, 2026.09.14
- iM Securities, Sebang Global Battery, “Moving up a weight class with the ESS business” (link), 2026.08.19
- Hana Securities, Sebang Global Battery, “Entering the US grid ESS battery module/pack business” (link), 2026.06.16
- SK Securities, Seojin System (link), 2026.09.28 / Eugene Investment & Securities, Seojin System (link), 2026.08.18
- Shinhan Securities, Shinheung SEC (link), 2026.05.18 / Eugene Investment & Securities, Sangsin EDP (link), 2026.05.18
- KRX Data System and WISEfn (WiseReport) consensus (2026.10.13 close), Yahoo Finance KRW per dollar (2026.10.13)
Disclaimer
This post records the author’s personal analysis and views based on publicly available information and does not recommend any particular product or company. It does not recommend buying or selling any financial investment product and is not an investment advisory service.
Figures are as published at the time of writing. The ratios to market cap, the profit ratios, the PER-based prices, the cell capacity on US soil and the dollar conversions were calculated by the author from public data and market prices and are not confirmed forecasts. “Author’s calculation” marks the author’s own calculations and assumptions, not confirmed facts.
Author’s interests: not disclosed
Responsibility for decisions and their outcomes lies with the reader.
As of: October 13, 2026
Was this note useful?
Thanks. Your answer helps decide what to cover next.