Korea IPO Lock-Up Expiry: Stocks Fell 3.6% vs KOSDAQ on Day 15 as Lock-Ups Got Shorter (IPO Subscription, Allocation and Lock-Up Ratios Explained)
A Korean IPO lock-up is a promise by an institution not to sell its allocated shares for 15 days, 1, 3 or 6 months, so it does not remove selling; it moves it to the lock-up expiry date. Across 110 Korean IPOs from January 2025 to October 1, 2026, lock-up priority allocation lifted the median lock-up ratio from 5.77% to 23.83% and pushed opening prices up, but 36.5% of the post-reform lock-ups were 15-day, and on the 15-day expiry day stocks fell 3.60% more than KOSDAQ. 27 of the 34 companies listed in 2026 were below their IPO price at the October 12, 2026 close.
- A lock-up is an institution’s promise not to sell its IPO shares for 15 days, 1, 3 or 6 months; the lock-up ratio is the locked-up share of book-building demand.
- Retail investors get 25% of the offered shares; at least half goes by equal allocation per account and the rest by deposit size. One proportional share of Brils needed a KRW 32.69 million deposit.
- After lock-up priority allocation in July 2025, the median lock-up ratio rose from 5.77% to 23.83%; IPOs with lock-ups of 30%+ opened at 3.38x the IPO price vs 1.35x under 5%.
- The 15-day share of lock-ups grew from 13.2% to 36.5%, and stocks fell 3.60% more than KOSDAQ on the 15-day expiry day (8.64% over five trading days).
- 27 of 34 companies listed in 2026 were below their IPO price on October 12, 2026; the 15-day lock-ups of the five October listings expire October 30 to November 7.
Key takeaways
- After lock-up priority allocation began in July 2025, the median book-building lock-up ratio rose from 5.77% to 23.83%, and IPOs with lock-ups of 30% or more opened at 3.38 times the IPO price, more than double the 1.35x of those under 5%.
- Within the larger lock-ups, the 15-day share grew from 13.2% to 36.5%, and on the expiry day 15 days after listing, shares fell 3.60% more than KOSDAQ (median of 103 companies).
- As a result, 27 of the 34 companies listed in 2026 were below their IPO price at the October 12 close, so an IPO should be read with its lock-up ratio, the mix of lock-up periods and the expiry calendar side by side.
Written: October 12, 2026 (prices are October 12 closes; IPO data retrieved the same day)
Concepts covered: retail IPO subscription, equal allocation, proportional allocation, subscription deposit, book-building, mandatory holding (lock-up) commitments, lock-up priority allocation, lock-up expiry date
Dollar figures are converted at KRW 1,332 per dollar, the USD/KRW close on October 12, 2026.
1. What is an IPO lock-up? It moves day-one selling to the expiry date
This guide explains how Korean IPO subscription and institutional lock-up commitments work, using data on 110 Korean IPOs. It asks one question: when you subscribe to an IPO or buy one after listing, which numbers tell you in advance how many shares will come to market on the first day and in the weeks after? The answer is that you need three things together: the book-building lock-up ratio, where those lock-ups are concentrated among 15 days, 1 month, 3 months and 6 months, and the calendar of expiry dates when those periods end. A lock-up is a promise by an institution not to sell the shares it received for a set period, so it is not a device that removes selling; it is a device that moves the day the selling arrives.
An IPO hands out, at a fixed IPO price, shares that the company newly issues or that existing shareholders sell before listing. These shares are split among the employee stock ownership association, institutional investors and retail subscribers. The retail tranche is 25% of the shares offered; at least half of it is split evenly by number of accounts (equal allocation), and the rest is split by the size of the deposit put in (proportional allocation). The institutional tranche is allocated by the lead underwriter after a process called book-building, based on the price and quantity each institution bids and whether it commits to a lock-up. Since July 2025, institutions that commit to a lock-up must receive a set share of the institutional tranche first.
That rule change moved the numbers. Among the 110 companies listed from January 2025 to October 1, 2026 (excluding SPACs, REITs and infrastructure funds), the 45 whose book-building took place before July 9, 2025 had a median lock-up ratio of 5.77%, and the 65 after it had 23.83%. More lock-ups mean fewer institutional shares can be sold on the first day, so the opening price is set higher. The 27 companies with lock-ups of 30% or more opened at a median 3.38 times the IPO price, while the 29 under 5% opened at 1.35x (author’s calculation).
But the extra lock-ups got shorter. Among companies that disclose bid quantity by period, the 15-day share of lock-ups grew from 13.2% before the reform to 36.5% after it, while the combined share of 3 and 6 months shrank from 65.0% to 40.9%. A 15-day lock-up can be sold 15 days after listing. On the first trading day 15 days after listing, the 15-day expiry day, the median share fell 3.60% more than KOSDAQ across 103 companies, and 8.64% more over the following five trading days. The 39 companies whose 15-day lock-ups were 5% or more of book-building demand fell 8.07% more on the expiry day.
The order is as follows. The first part covers how the IPO shares are split, what it costs to receive one share through equal and proportional allocation, and book-building and the IPO price. The middle looks at how the July 2025 lock-up priority allocation changed the amount and length of lock-ups, and how share prices on the first day and on expiry days changed as a result. The last part covers how many companies now trade below their IPO price, large IPOs and subscription ratios, then ends with the expiry calendar of the five companies listing in October and six steps applied to Elice Group.
2. How Korean IPOs work: KOSPI, KOSDAQ, DART, 38 Communication and equal vs proportional allocation
Korean IPOs list on the Korea Exchange (KRX), which runs two main boards: KOSPI for large, established companies and KOSDAQ for smaller and growth companies. Of the 110 companies in this report, 8 listed on KOSPI and the rest on KOSDAQ. Korean amounts are often quoted in man won (10,000 won), eok won (100 million won) and jo won (1 trillion won); this report writes them as KRW million, KRW bn and KRW tn.
Every Korean IPO follows the same public sequence. The company files a registration statement on DART, Korea’s electronic disclosure system run by the Financial Supervisory Service, with an indicative price range (the “band”). Institutions then bid in book-building, and the lead underwriter sets the final price and publishes the results before retail subscription opens: the institutional demand ratio, the price distribution of bids, and the lock-up ratio broken down by 15 days, 1 month, 3 months and 6 months. Retail subscription runs for two days through the underwriting brokers, and listing usually follows about a week later.
Retail allocation in Korea is split in two. At least half of the retail tranche goes by equal allocation: every account that subscribes for the minimum (usually 10 shares) gets the same number of shares, and if there are more accounts than shares, a lottery decides who gets one. The rest goes by proportional allocation, in proportion to the deposit, which is 50% of the subscription amount. A person can subscribe through only one broker per IPO, and no interest is currently paid on the deposit while it is tied up.
The data in this report come from 38 Communication (38.co.kr), a long-running Korean IPO information site that compiles book-building results, retail subscription ratios, listing-day prices and each company’s lock-up breakdown from the filings. Daily prices come from Naver Finance, Korea’s most-used stock portal. Final allocation figures, including how many shares locked-up institutions actually received, appear in the amended registration statement and the post-listing securities issuance report on DART.
3. How the numbers were counted: 110 Korean IPOs, January 2025 to October 2026
Which companies, which figures
The sample is the 110 companies newly listed on KOSPI and KOSDAQ from January 1, 2025 to October 1, 2026. Eight of them are on KOSPI. Special purpose acquisition companies (SPACs) were excluded because their IPO price is fixed at KRW 2,000 and they have no business, and REITs and infrastructure funds were excluded because they are dividend products. Relistings and transfers between boards were also left out because their offering process differs. The figures were collected on October 12 from 38 Communication’s book-building results, new listings, IPO subscription calendar and company detail pages. Of the 110, 106 disclose a lock-up ratio.
The lock-up ratio is the share of the total quantity institutions bid in book-building that was committed to a mandatory holding period. Some sources calculate a number with the same name by dividing by the shares institutions were actually allocated, which can give a very different value. For example, Sky Labs’ lock-up ratio is 0.17% based on book-building bids and 10.93% based on institutional allocation (AlphaSquare). The 41% lock-up share for 2025 published by the Financial Supervisory Service is also on an allocation basis. All lock-up ratios in this report are on a bid-quantity basis and are used to compare companies and periods with each other.
The lock-up period mix was built by adding up the bid quantities by period (6 months, 3 months, 1 month, 15 days) shown on each company’s detail page. Because the mix was calculated by summing quantities across companies before dividing, companies with large bid quantities carry more weight. Companies that disclose quantity by period number 17 before the reform, 59 after it, and 34 among 2026 listings, by book-building date. Before and after the reform were split at a book-building date of July 9, 2025, when lock-up priority allocation took effect.
Prices, expiry dates and excess returns
The multiple of the IPO price is the opening price, the first-day close or the October 12 close divided by the final IPO price. Opening prices and first-day closes come from 38 Communication’s new-listings table; October 12 closes and daily paths come from Naver Finance daily prices. Naver prices are the last trade including Nextrade after-market sessions, so they can differ slightly from the exchange’s official close. The post-listing path runs from the listing-day close to trading day 60 and includes only companies past 60 trading days.
The expiry date is the listing date plus 15 days, 1 month, 3 months or 6 months, or the first trading day after it. The expiry-day excess return is the stock’s return that day minus the KOSDAQ index return. Companies less than five trading days past expiry were excluded, which leaves 103 companies for the 15-day expiry, 102 for 1 month, 94 for 3 months and 85 for 6 months. The “ordinary day” used for comparison takes each company’s median daily excess return over trading days 2-30 after listing and then the median across companies: -1.55%. This means newly listed stocks are weaker than KOSDAQ even on ordinary days, after their big first-day rise.
Medians are used because IPO numbers are heavily skewed. When several stocks rise to four times the IPO price on day one, the average is pulled by a few names. So every multiple and return in this report is a median, and the numbers differ from averages reported in the press (for example, a 92% average opening-price return in 2025). The hypothetical example and the gauge boundaries were set by the author and are marked as such.
4. Key IPO terms and the timeline from book-building to lock-up expiry
Reading an IPO takes about ten terms. The point is that they all sit on one timeline, and the last box on that timeline is not the listing date but the lock-up expiry date. After defining the terms, this section walks through the actual schedule of Brils to show the order in which an IPO unfolds.
The IPO price is the price per share paid for the offered shares. The indicative price range (band) is the price range the company and lead underwriter first write in the registration statement, and the final IPO price is the price set after book-building, within or outside that range. Book-building is the process in which institutions submit the prices and quantities they want to buy, and the institutional demand ratio is the number of shares institutions bid divided by the institutional tranche. The retail subscription ratio is the number of shares individuals subscribed for divided by the retail tranche.
A mandatory holding commitment (lock-up) is a promise by an institution that took part in book-building not to sell its allocated shares for a set period (15 days, 1 month, 3 months or 6 months). The lock-up ratio is the share of book-building bid quantity committed to a lock-up. Protective deposit (mandatory holding registration) is a separate legal rule that bars shareholders who held shares before listing, such as the largest shareholder, from selling for a set period; it is a different system from institutional lock-ups. The expiry date is the first day the lock-up or protective deposit period has ended and those shares can be sold.
The opening price is the first price set at 9 a.m. on the listing day. Since June 26, 2023, the first-day base price has been the IPO price, and the price can move within 60-400% of it (Financial News). So the highest possible first-day price is four times the IPO price. The tradable float is the share of all listed shares that can be sold on the first day. The exchange recommends keeping the tradable float right after listing below 30% (IB Tomato, October 10, 2025).
How an IPO timeline runs
Brils’ schedule shows the order. Book-building ran from September 9 to 15, and the IPO price was set at KRW 19,500 (about $14.6), the top of the KRW 16,500-19,500 indicative range. Retail subscription ran for two days on September 17-18, and the allocation notice, payment and refund all took place on September 22. The listing date was October 1. From the first day of book-building to listing took just over three weeks, and retail deposits were tied up for four days, from subscription to refund.
The timeline does not end on the listing date. The 15-day lock-up expires on October 16, 15 days after listing, and the 1-month lock-up on November 1, one month after listing (a Sunday, so from November 2). The 3-month lock-up expires on January 1, 2027, and the 6-month lock-up and the largest shareholder’s protective deposit around April 1, 2027. Of Brils’ 21.75% lock-up, 72.7% was 15-day, so most of the institutional lock-up shares are released two weeks after listing.
On this timeline, an individual decides two things: whether to subscribe, and when to sell the shares received. Whether to subscribe is decided from the book-building results (institutional demand ratio, where the price landed, lock-up ratio), and when to sell from the lock-up period mix and the expiry dates. Book-building results are published before subscription, so a subscriber can draw the whole expiry calendar before pressing the subscribe button. That is why this report is built around the order in which to read one page of book-building results.
5. How IPO shares are allocated: employee association, retail and institutions
Retail IPO subscription is the process of handing out the portion of the offered shares set aside for individuals. In short, individuals get a quarter of the offered shares; half of that is split by number of accounts and the other half by deposit size. So for a popular IPO, an account that subscribes for only the minimum still has a chance at one share, while an account that puts in a lot receives few shares for the money. This structure has to be understood first for the subscription ratios and deposit figures later in the report to make sense.
The offered shares are split three ways. The employee stock ownership association, a pool formed by the company’s employees, can take up to 20% of the offered shares first. The retail tranche is 25%, and it can grow to as much as 30% if shares the employee association does not take are passed over (Newsis, announced November 2020). Under the cornerstone investor system passed by the National Assembly in April 2026, the 25% retail allocation stays the same, and the new pre-allocation comes out of the institutional tranche (Financial Services Commission). The rest is the institutional tranche, taken by asset managers, brokers, insurers, pension funds and other institutions that took part in book-building.
The retail tranche is split again in two. Under the IPO reform announced in November 2020, at least 50% of the retail tranche is split by equal allocation. Equal allocation divides shares evenly among accounts that subscribed for at least the minimum quantity (usually 10 shares). The remaining portion is proportional allocation, where a larger deposit gets more shares. The deposit rate is 50%, so subscribing for 1,000 shares of a KRW 10,000 IPO requires KRW 5 million. If a person subscribes through several brokers, only the first subscription counts and the rest are cancelled (Shinhan Securities IPO guide).
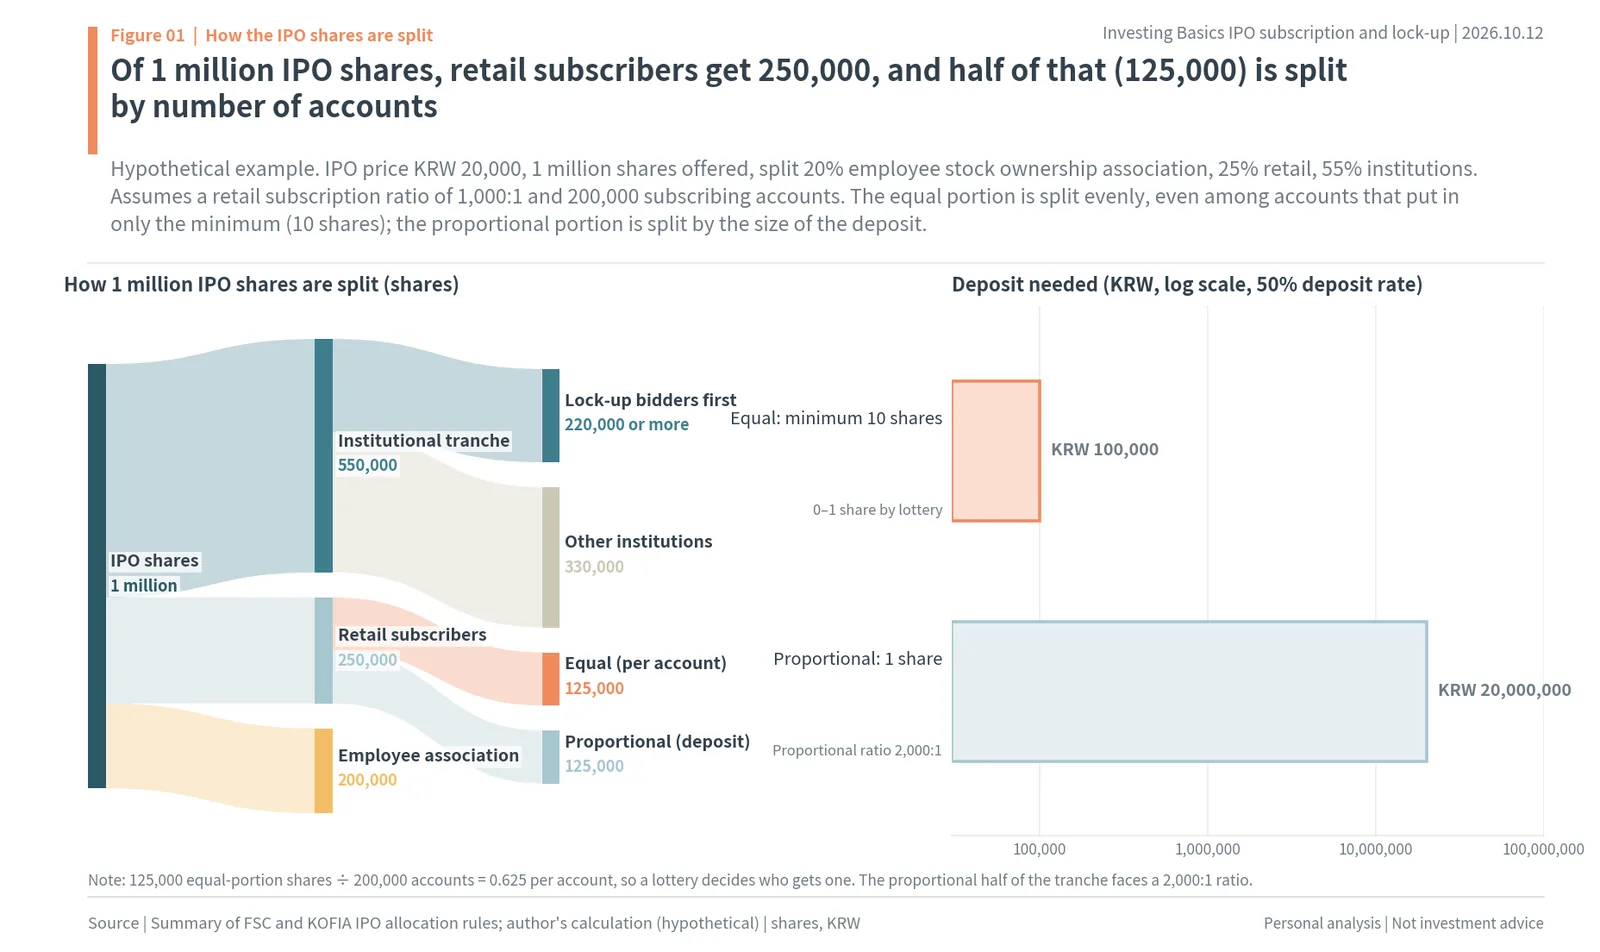
Figure 01 is a hypothetical example. Suppose a company offers 1 million shares at an IPO price of KRW 20,000 and splits them 20% to the employee association, 25% to retail and 55% to institutions. The retail tranche is 250,000 shares; half of it, 125,000 shares, goes by equal allocation and the other 125,000 by proportional allocation. Of the 550,000-share institutional tranche, 220,000 or more go first to institutions that committed to a lock-up, because from 2026 the lock-up priority allocation ratio is 40% of the institutional allocation excluding policy funds (MTN, Korea Economic Daily). In this example, the policy fund portion is not carved out, and 40% is applied to the whole institutional tranche.
Assume a retail subscription ratio of 1,000:1 and 200,000 subscribing accounts, and the numbers come out like this. Dividing the 125,000-share equal portion among 200,000 accounts gives 0.625 shares per account, so some accounts get none, and a lottery decides who gets one. In proportional allocation, the whole subscribed quantity crowds into half the retail tranche, so the proportional ratio becomes 2,000:1. To get one share by proportional allocation you must subscribe for 2,000 shares, and at the 50% deposit rate that means putting in KRW 20,000,000 (about $15,000). The minimum 10 shares for equal allocation need only KRW 100,000.
Put in words, equal allocation favors those who put in little, while proportional allocation belongs to those who can tie up large sums. The higher the subscription ratio, the larger the deposit needed for one proportional share, in direct proportion to the ratio, and the more accounts there are, the fewer equal shares each account receives. The number of shares an individual receives is ultimately set by the size of the offering, the 25% retail tranche and the number of subscribing accounts. So when measuring IPO returns, look first at profit relative to the deposit, not profit per share.
6. Proportional allocation: the KRW 32.69 million deposit for one Brils share
Running the same calculation on a real IPO makes the cost of proportional allocation clearer. The point is that getting one share of a popular IPO through proportional allocation requires tying up tens of millions of won for two days, and selling that one share at the first-day close earns only around KRW 10,000. Brils (468670.KQ), which listed on KOSDAQ on October 1, is an example. The robot automation equipment maker offered 1,200,000 shares at KRW 19,500; its retail subscription ratio was 1,676.26:1 and its proportional ratio 3,353:1 (38 Communication).
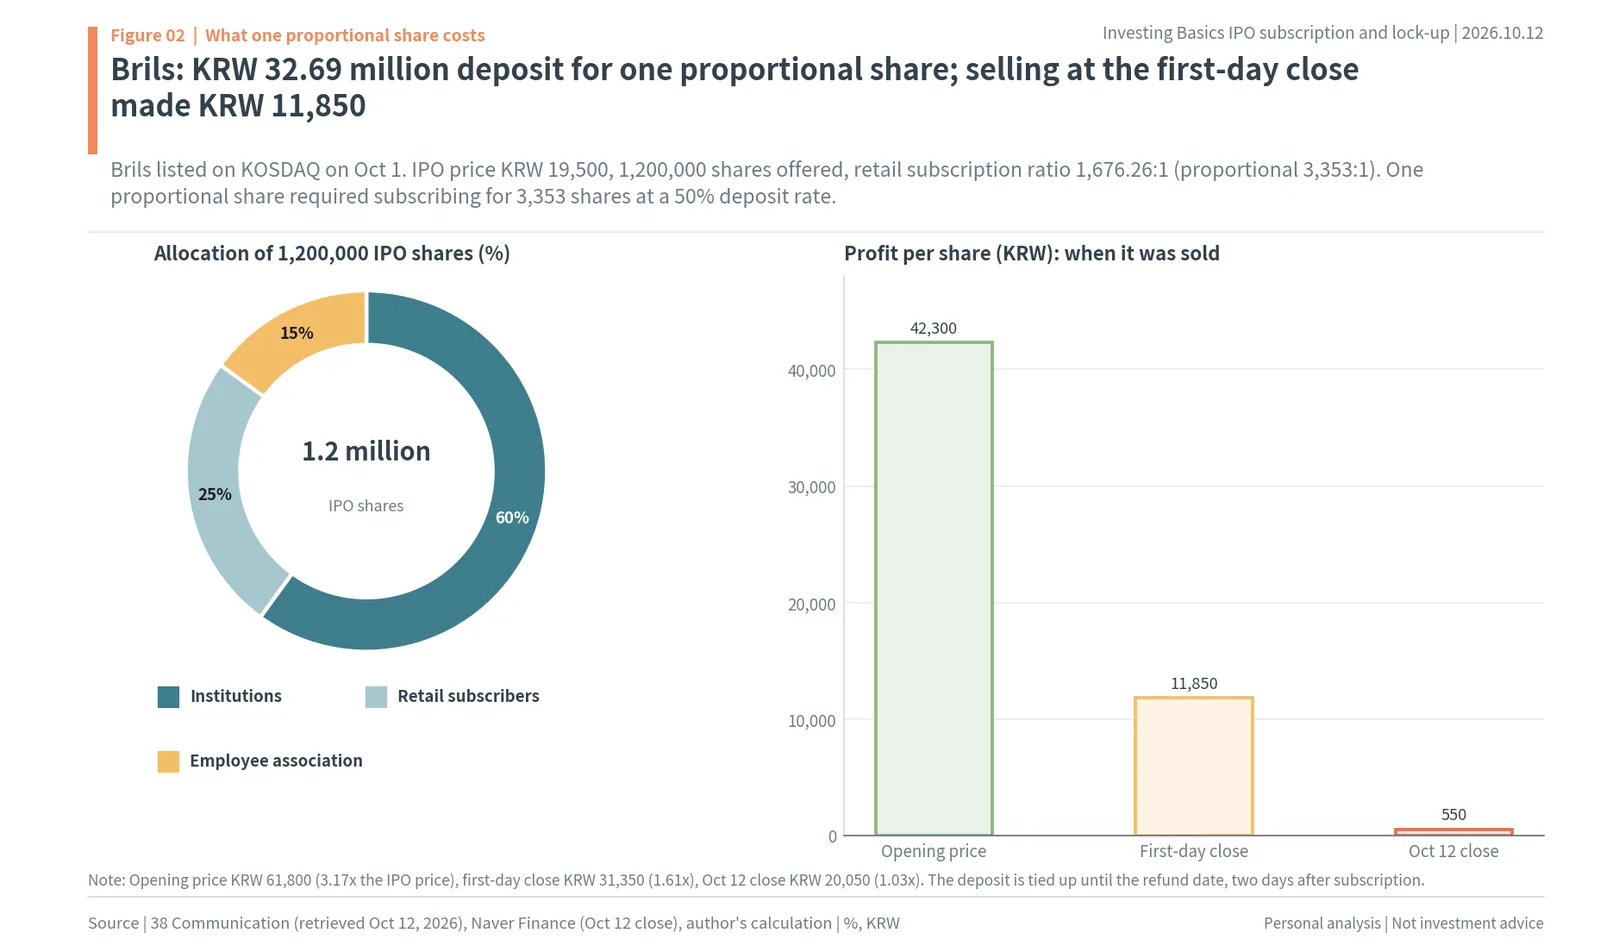
Brils’ offered shares were split 60% to institutions, 25% to retail subscribers and 15% to the employee association. Of the 300,000-share retail tranche, 150,000 went by equal allocation and 150,000 by proportional allocation. A proportional ratio of 3,353:1 means you had to subscribe for 3,353 shares to get one share proportionally. Multiplying 3,353 shares by the KRW 19,500 IPO price and the 50% deposit rate gives a required deposit of KRW 32,691,750, or about KRW 32.69 million (about $24,500). The minimum 10 shares for equal allocation cost KRW 97,500.
What that one share earned depended on when it was sold. Brils opened at KRW 61,800, 3.17 times the IPO price, so selling one share at the opening price made KRW 42,300. The first-day close was KRW 31,350 (1.61 times the IPO price), so selling at the close made a smaller KRW 11,850. The October 12 close was KRW 20,050, 1.03 times the IPO price, so holding until now leaves a profit of KRW 550 per share. Had you put in KRW 32.69 million, received one share and sold it at the first-day close, the profit relative to the deposit would be under 0.04%.
The deposit is tied up from the subscription date until the refund date, when unallocated money is returned. Brils took subscriptions on September 17-18 and refunded on September 22. In July 2026 the government said it would push to pay interest on subscription deposits, but no start date or rate has been set (MTN). For now, no interest is paid while the money is tied up, so the value of one proportional share has to be weighed against both the first-day profit and the opportunity cost of the tied-up money. That is why most retail subscribers in practice end up with one or two equal-allocation shares, and when they sell those one or two shares decides their return.
What decides that “when to sell” is the institutional lock-up covered next. The shares that can come to market on the first day are the retail allocation, institutional shares without a lock-up, and existing shareholders’ shares not under protective deposit. Shares held by institutions with a lock-up come to market from the day the lock-up ends. So the same one share is worth very different amounts sold at the opening price, at the first-day close or after the lock-up expires.
7. Book-building: why 92 of 110 IPOs priced at the top of the range
The IPO price and the institutional allocation are set in book-building, which takes place before retail subscription. The point is that most Korean IPOs now set their price at the very top of the indicative range, so the IPO price alone shows no difference between IPOs. The difference comes from the lock-ups institutions commit to. In book-building, the lead underwriter presents an indicative price range and institutions bid the prices and quantities they want to buy. Since July 2023, book-building has lasted at least five business days.
The underwriter sets the IPO price by looking at the distribution of bid prices, then allocates shares by scoring each institution’s bid price, quantity, timing and lock-up commitment. After the 2025 reform, the lock-up bonus points are 7 for 6 months, 5 for 3 months, 3 for 1 month and 2 for 15 days (MTN). The longer the lock-up, the higher the score and the more shares received. In exchange, the shares cannot be sold during that period.
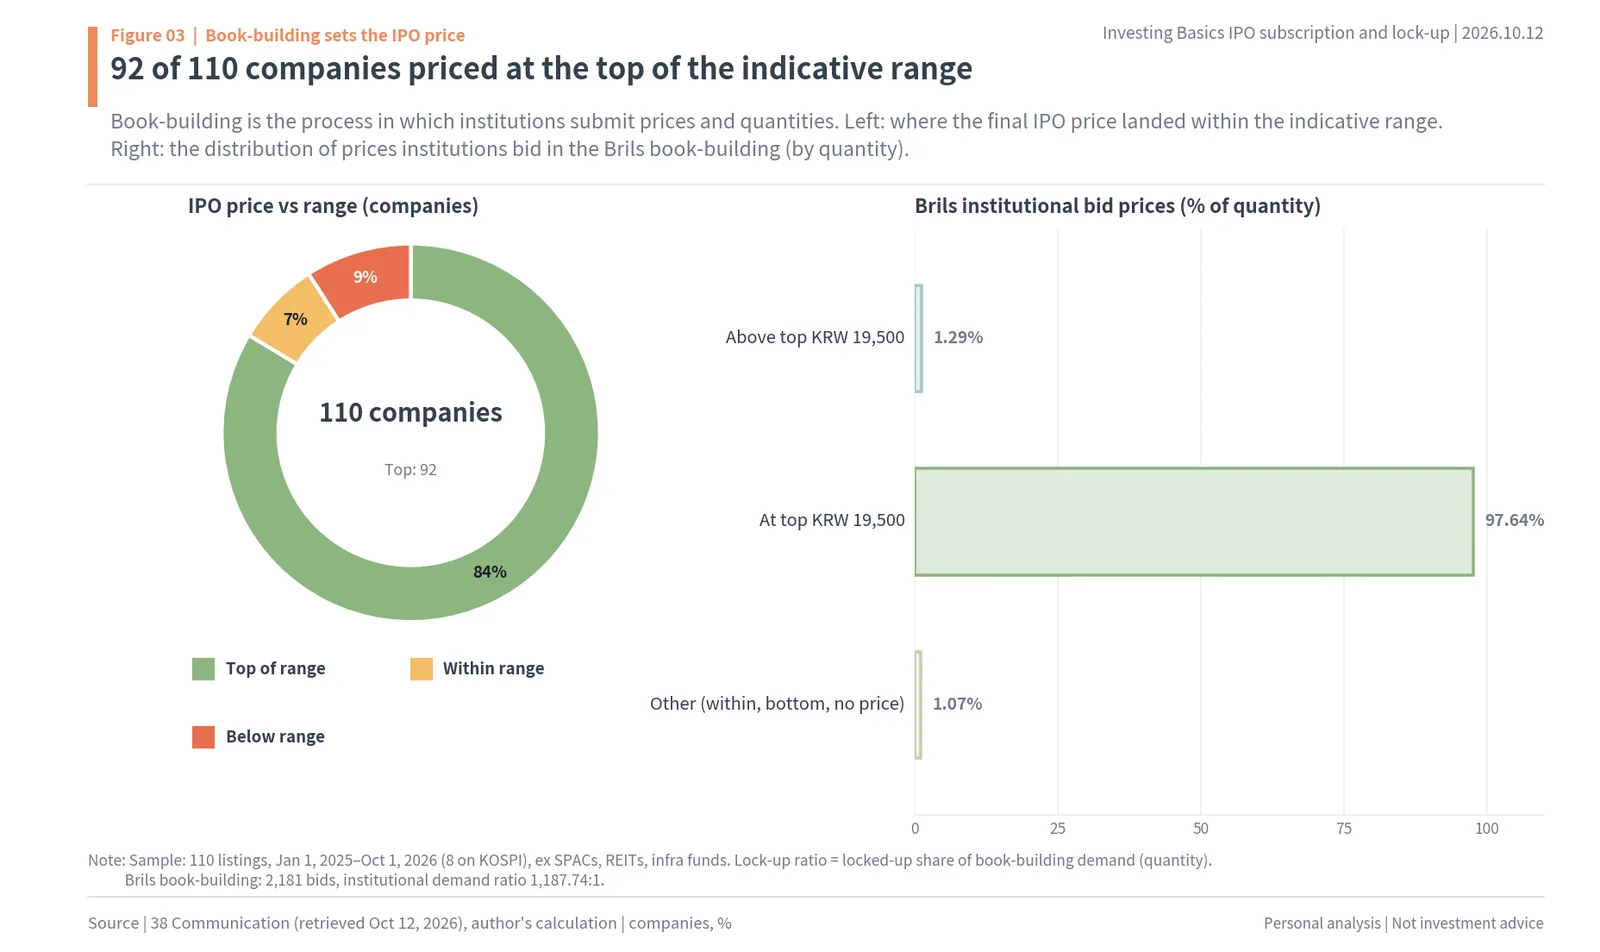
The left side of Figure 03 shows that 92 of the 110 companies set their IPO price at the top of the indicative range. Eight set it within the range, 10 below the bottom of the range, and none above the top. The Financial Supervisory Service also said that of 76 companies listed in 2025, none set their price above the indicative range. In 2024, 66% priced above the range (Money Today, March 4, 2026). Since the reform, the top of the range has in effect become a ceiling.
The right side shows the distribution of prices institutions bid in the Brils book-building. There were 2,181 bids, the institutional demand ratio was 1,187.74:1, and 97.64% of bid quantity was at KRW 19,500, the top of the range. Prices above KRW 19,500 accounted for 1.29%, and all other prices (within the range, at the bottom, or no price given) for 1.07% combined. With almost every institution bidding the same price, the IPO price could only land at the top of the range.
So in book-building results, the number that shows differences between companies is not where the price landed but the lock-up ratio. Even when every IPO is priced at the top of the range, the share of institutions bidding that price that said they would hold their shares varies widely from company to company. Just among 2026 book-buildings there were MakinaRocks at 78.17%, Poled at 67.24% and Justek at 47.20%, and also StradVision at 2.77% and Delicious at 0.10% (38 Communication).
8. Lock-up priority allocation: lock-up ratio 5.77% to 23.83%
In January 2025 the Financial Services Commission published an IPO system reform and launched lock-up priority allocation in July. The point is that this rule raised the lock-up ratio more than fourfold. At its core, a set share of the institutional allocation, excluding policy funds, must go first to institutions that commit to a lock-up. That share is 30% from July 2025 to year-end and 40% from 2026, and if lock-up quantity falls short of that ratio, the lead underwriter must itself buy 1% of the offered shares (up to KRW 3bn) and hold them for six months (MTN, Aju Business Daily, January 21, 2025).
The background to the reform also came in numbers. Of 77 companies listed in 2024, institutions were net sellers on the listing day at 74 (about 96%), and the average lock-up share was 19% (MTN). In other words, institutions mostly took IPO shares and sold out on the first day. So the government changed the rules to give lock-ups first claim on shares and to bar institutions that break lock-ups from book-building.
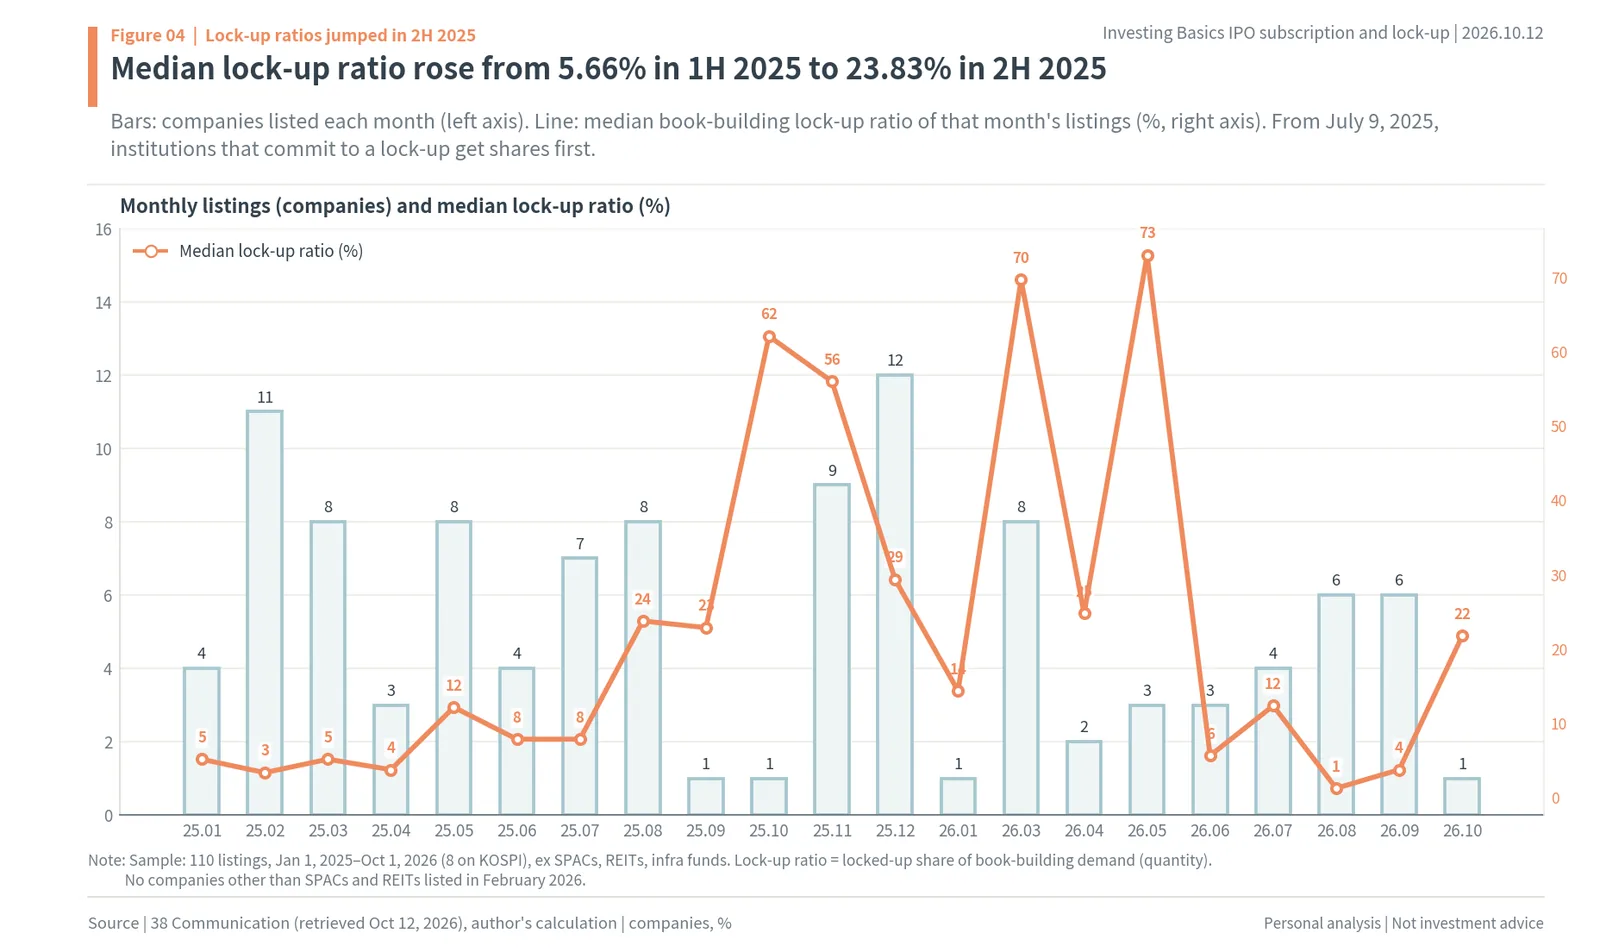
Figure 04 shows the number of companies listed each month and the median lock-up ratio of that month’s listings. The 38 companies listed in the first half of 2025 had a median lock-up ratio of 5.66%, and the 38 listed in the second half had 23.83%. By month, it stayed in single digits through July 2025 listings, rose into the 20s with August listings, and reached 56% for November listings and 70% for March 2026 listings. In February 2026, no companies other than SPACs and REITs listed.
Listings in the second half of 2026 fell back. The six companies listed in August 2026 had a median lock-up ratio of 1.3%, and the six listed in September 3.8%. The Korea Economic Daily also reported that the lock-up ratio on an institutional allocation basis fell from 41.98% in the first half of 2026 to 3.56% in the second half (August 23, 2026). When IPOs that institutions had locked up in the first half fell below their IPO price after listing, institutions went back to avoiding lock-ups. The lock-up ratio goes up because of the rule, but it comes back down after institutions lose money on lock-ups.
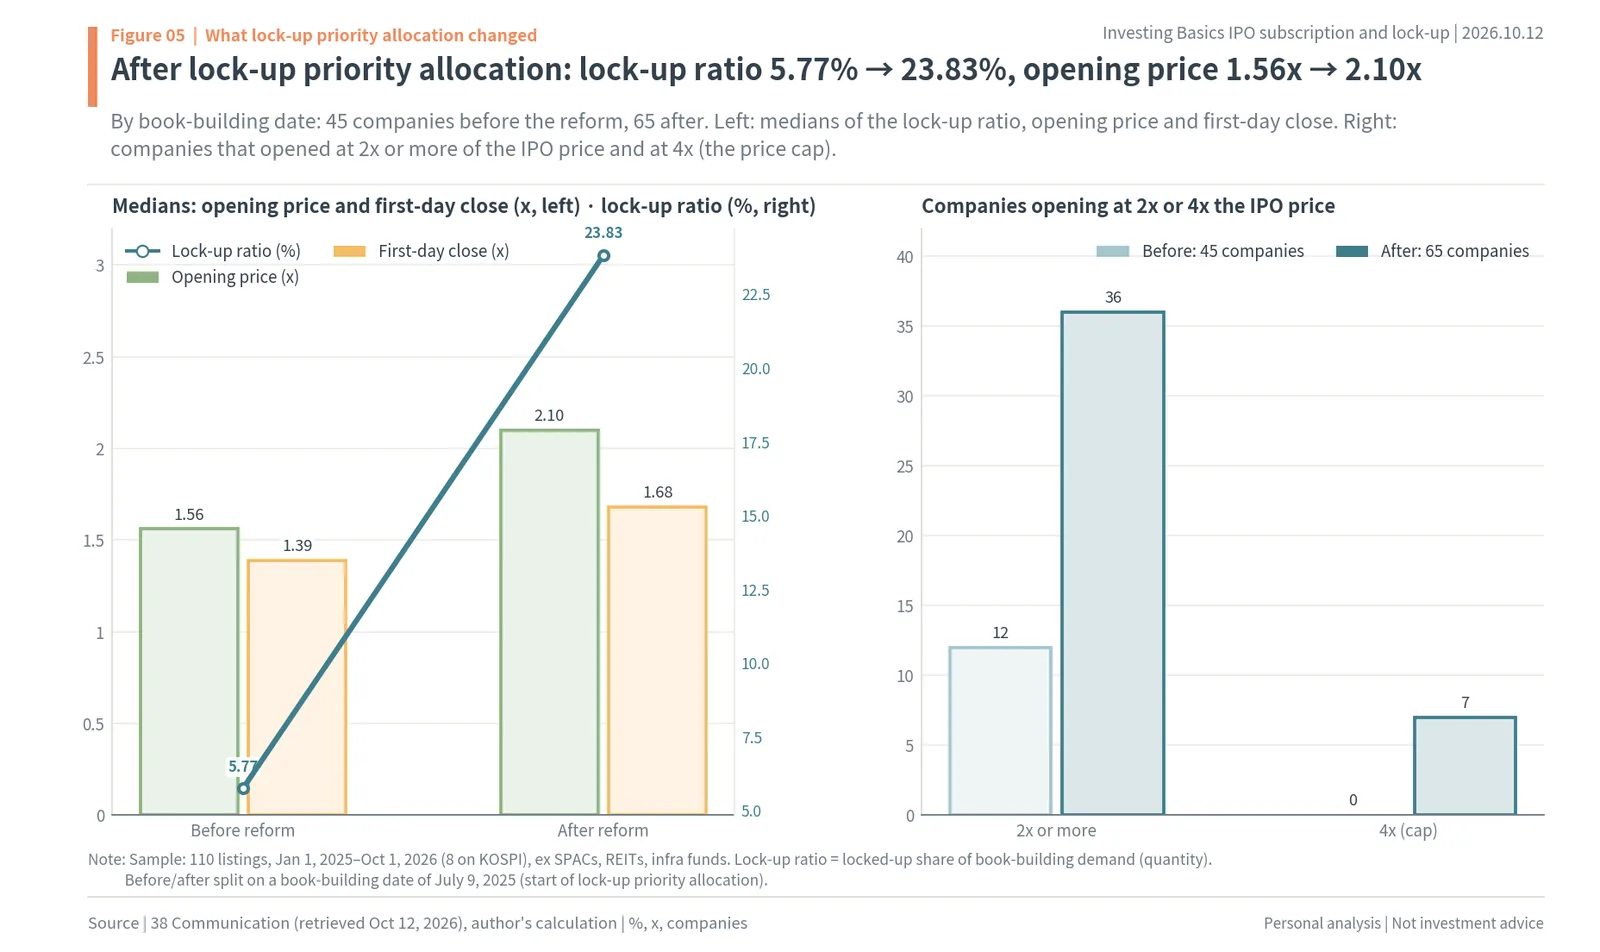
Splitting by book-building date makes the difference clearer. In Figure 05, the 45 companies before the reform had a median lock-up ratio of 5.77%, and the 65 after it 23.83%. Over the same split, the median opening price rose from 1.56 to 2.10 times the IPO price, and the first-day close from 1.39x to 1.68x. Companies that opened at 2x or more of the IPO price rose from 12 before the reform to 36 after it, and companies whose opening price was set at the first-day cap of 4x went from 0 to 7.
Since June 26, 2023, the first-day price cap has been 400% of the IPO price, or 4x. Before that, the opening price was set within 90-200% of the IPO price and could then move ±30% that day, so the highest first-day price was 2.6 times the IPO price (Financial News). Now the price can reach 4x on day one, so the fewer shares that can be sold on the first day, the further the opening price jumps. Lock-up priority allocation reduced first-day selling, and the wider price range let that push the opening price up.
Applying the priority rule to the hypothetical example gives these numbers. The institutional tranche of the company in Figure 01 was 550,000 shares. Multiplying by the 2026 rate of 40%, 220,000 or more go first to locked-up institutions. A 15-day lock-up is still a lock-up, so the rule is met even if all 220,000 institutional shares carry 15-day lock-ups. Those 220,000 shares cannot be sold on the first day, but 15 days after listing they all become shares that can be sold at once. The priority rule sets the amount of lock-ups; the institutions choose their length.
9. Lock-up period mix: the 15-day share rose from 13.2% to 36.5%
As the amount of lock-ups grew, their length changed too. The point is that much of the increase came from the shortest, 15-day lock-ups. A 15-day lock-up counts as a lock-up and earns 2 bonus points, and policy funds such as high-yield funds and KOSDAQ venture funds must commit to at least 15 days to receive their separate allocation (Aju Business Daily, MTN). For an institution, a 15-day hold is enough to get both the lock-up priority share and the bonus points.
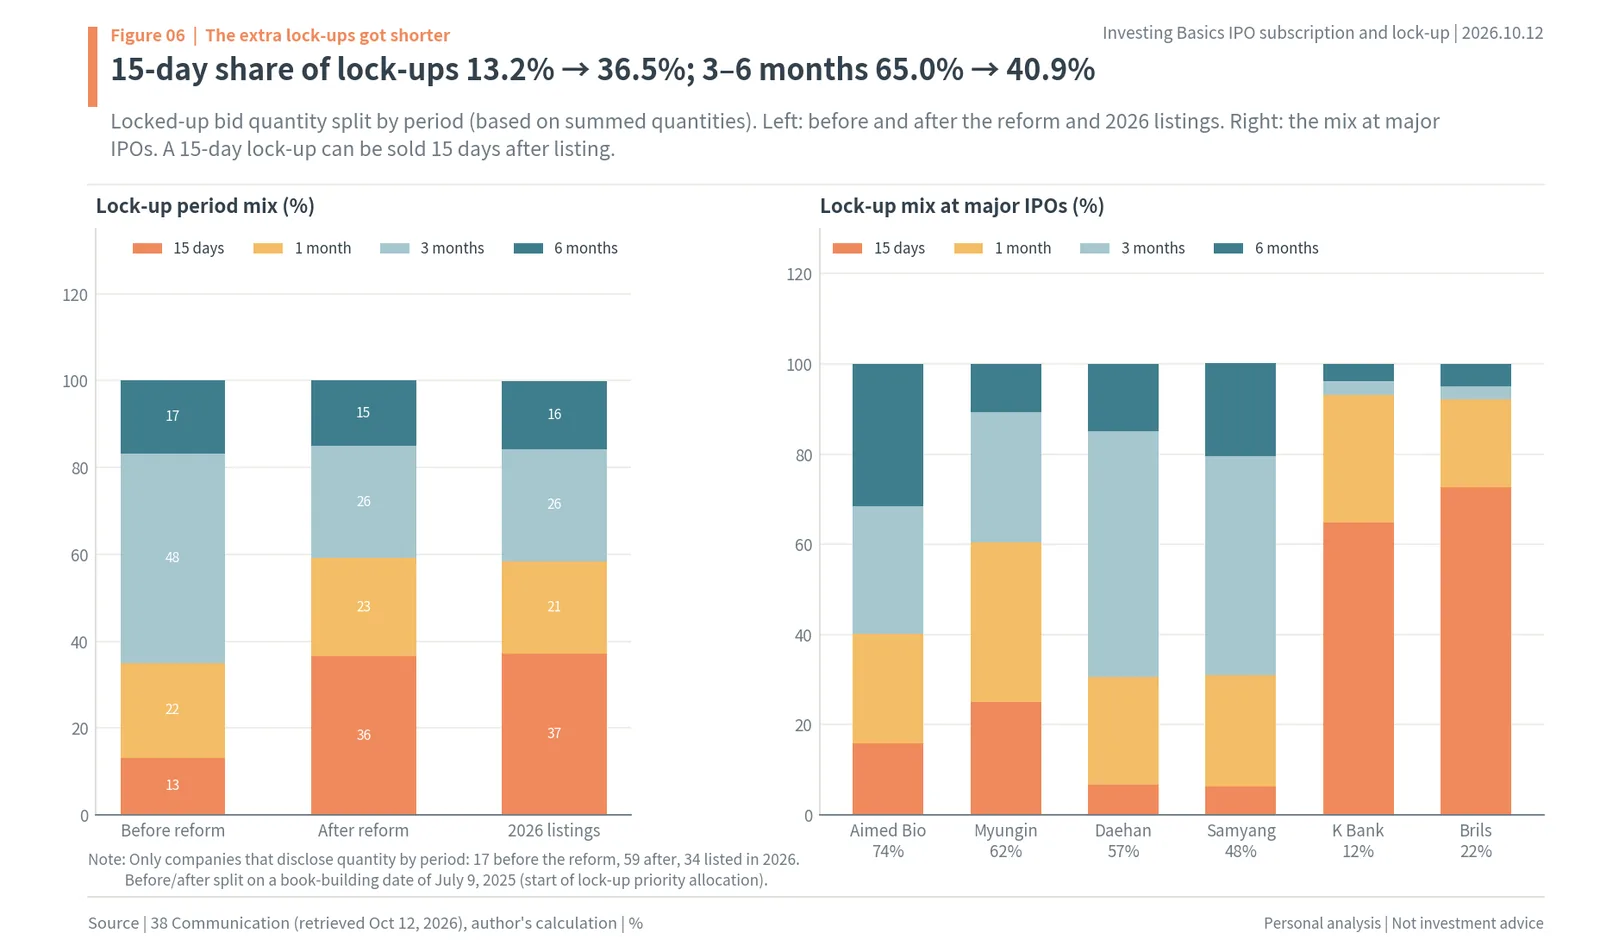
The left side of Figure 06 shows locked-up bid quantity split by period. The 17 companies before the reform were 13.2% 15-day, 21.8% 1-month, 48.1% 3-month and 16.9% 6-month. The 59 after the reform are 36.5% 15-day, 22.6% 1-month, 25.8% 3-month and 15.1% 6-month. The 15-day share grew from 13.2% to 36.5%, and the combined 3- and 6-month share shrank from 65.0% to 40.9%. Among the 34 companies listed in 2026 alone, the 15-day share is a little larger at 37.1%.
The right side shows the mix at major IPOs. Aimed Bio, with a 74.22% lock-up ratio, had many long lock-ups: 15.9% 15-day, 24.3% 1-month, 28.3% 3-month and 31.5% 6-month. Daehan Shipbuilding (439260.KS; lock-up 56.86%) and Samyang Comtech (48.37%) also had large 3-month shares of 54.4% and 48.5%. By contrast, 64.8% of K Bank’s 12.39% lock-up was 15-day, and 72.7% of Brils’ 21.75% lock-up was 15-day. Even with the same lock-up ratio, the shares released on each expiry date differ with the period mix.
The Financial Supervisory Service’s 2025 count (allocation basis) also put lock-up periods at 41% 3-month, 25% 6-month, 17% 15-day and 17% 1-month (Money Today). Because the denominator differs from this report’s bid-quantity basis, the sizes differ, but both show that 15-day lock-ups make up a meaningful share of all lock-ups. Lock-up priority allocation increased the amount of lock-ups, and more than a third of those lock-ups are short ones that end after 15 days. So much of the selling that did not come on the first day moved to 15 days after listing.
10. Lock-up ratio and first-day IPO returns: 3.38x vs 1.35x
How the lock-up ratio changes first-day prices shows up when companies are grouped into lock-up brackets. The point is that the more lock-ups, the higher the opening price and first-day close, and the fewer companies slide within the first day. Locked-up institutional shares cannot be sold on the first day, so that many fewer shares come to market. If the number of buyers is the same, the side with fewer shares for sale sets a higher price.
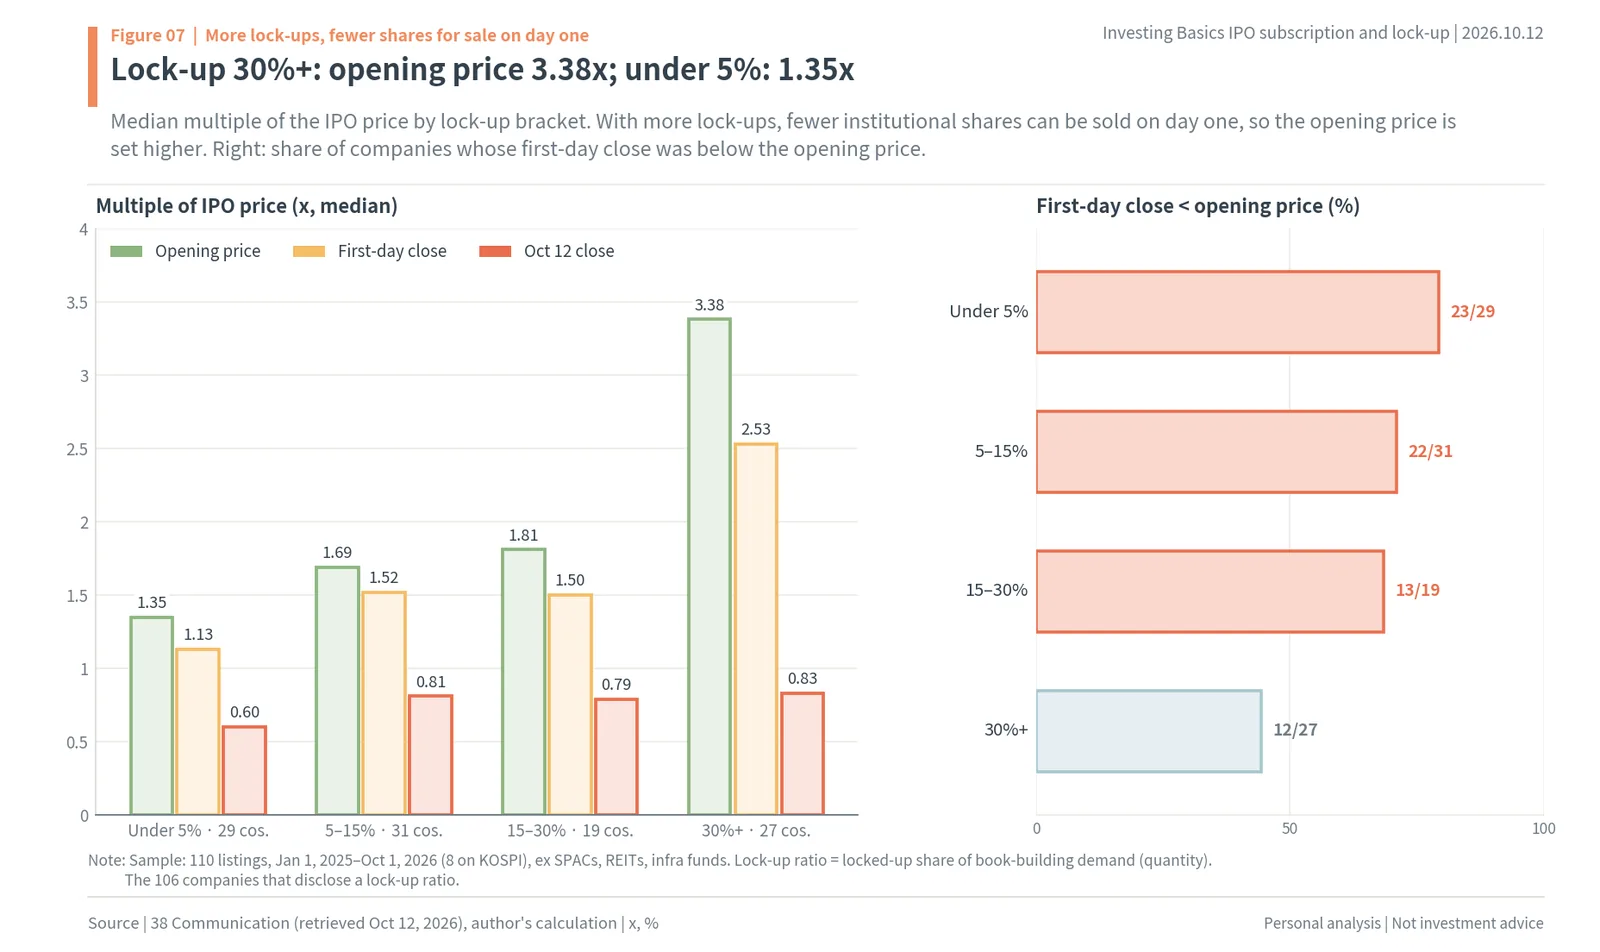
Figure 07 splits the 106 companies that disclose a lock-up ratio into four brackets. The 29 companies under 5% opened at a median 1.35 times the IPO price and closed the first day at 1.13x. The 31 at 5-15% opened at 1.69x and closed at 1.52x, and the 19 at 15-30% at 1.81x and 1.50x. The 27 companies with lock-ups of 30% or more opened at 3.38x and closed at 2.53x, far ahead of the other brackets. Seven of those 27 had their opening price set at the 4x cap.
The right side shows the share of companies whose first-day close was below the opening price. In the under-5% bracket, 23 of 29 closed below the opening price; at 5-15%, 22 of 31; at 15-30%, 13 of 19. At 30% or more, only 12 of 27 closed below the opening price. IPOs with few lock-ups keep receiving institutional selling after the open, so the price slides within the first day. IPOs with many lock-ups have little selling left on the first day and hold near the opening price. The median first-day close ÷ opening price in the 30%-or-more bracket is 1.00, above the 0.775 of the under-5% bracket.
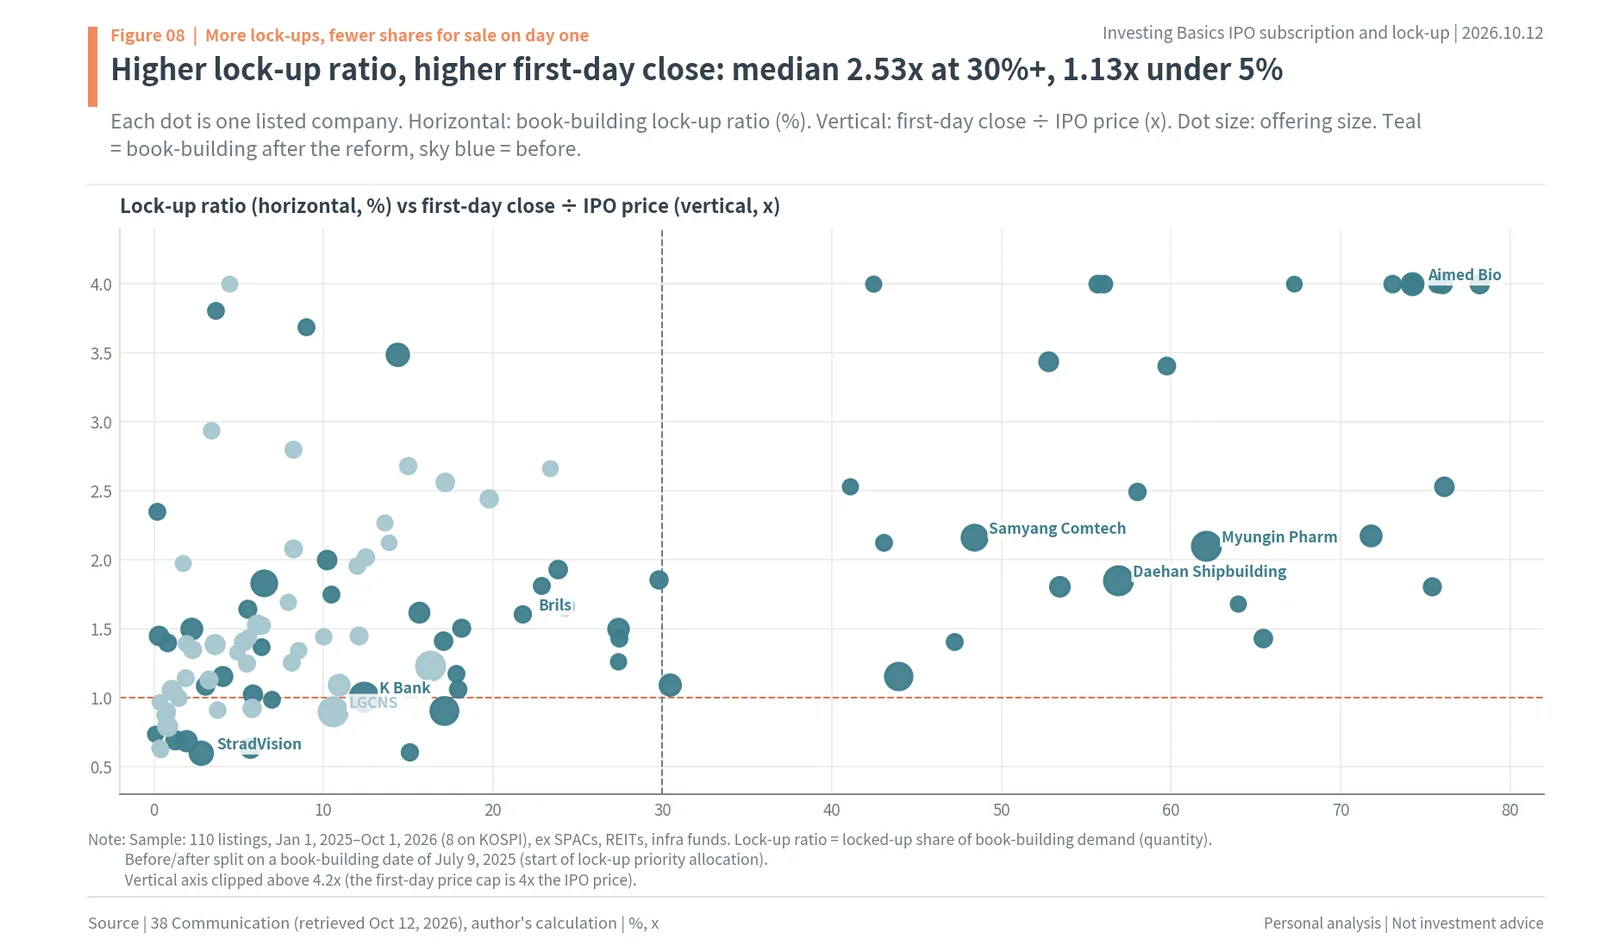
Figure 08 plots each company as a dot. The horizontal axis is the lock-up ratio and the vertical axis first-day close ÷ IPO price. Most dots on the right with lock-ups above 30% sit above 1.4 times the IPO price, and several reach the 4x cap. The higher the lock-up ratio, the higher the first-day close: the median is 2.53x at 30% or more and 1.13x under 5%. At the lower left, with lock-ups under 10%, dots whose first-day close was below the IPO price cluster. StradVision, with a 2.77% lock-up, closed the first day at 0.60 times the IPO price.
Large dots are companies with large offerings. LG CNS (064400.KS), the largest offering, had a 10.57% lock-up and closed the first day at 0.90 times the IPO price, while Daehan Shipbuilding, with a 56.86% lock-up, closed at 1.85x, and Myungin Pharm, with 62.08%, at 2.10x. Even for large offerings, many lock-ups meant the first day ended above the IPO price. The first-day price reacts more to the shares that can come out on that day than to the size of the offering.
11. Who sells on IPO day one? 74 of 110 closed below the opening price
Three kinds of shares can be sold on the first day. The point is that even with more lock-ups, first-day selling still centers on institutional shares without lock-ups and the retail allocation, which is why most IPOs close the first day below their opening price. The first kind is the shares retail subscribers received, 25% of the offering. The second is institutional shares without a lock-up. The third is the portion of pre-listing shareholders’ holdings not under protective deposit.
The largest shareholder and related parties cannot sell for six months from the listing date. If the largest shareholder is a private equity fund or the company is a KOSDAQ technology-growth listing, it is one year (Financial Services Commission, February 2022). Financial investors that invested before listing, such as venture capital funds, carry shorter mandatory holding periods, such as one month, depending on how long they have held the investment. Brils locked part of the largest shareholder’s stake for two years and six months. The Korea Securities Depository tallies the release of such existing-shareholder protective deposits every month, but the lock-ups institutions commit to in the IPO are not included in that count (Asia Economy, September 30, 2026). Investors have to find institutional lock-up expiries in the book-building results and work them out themselves.
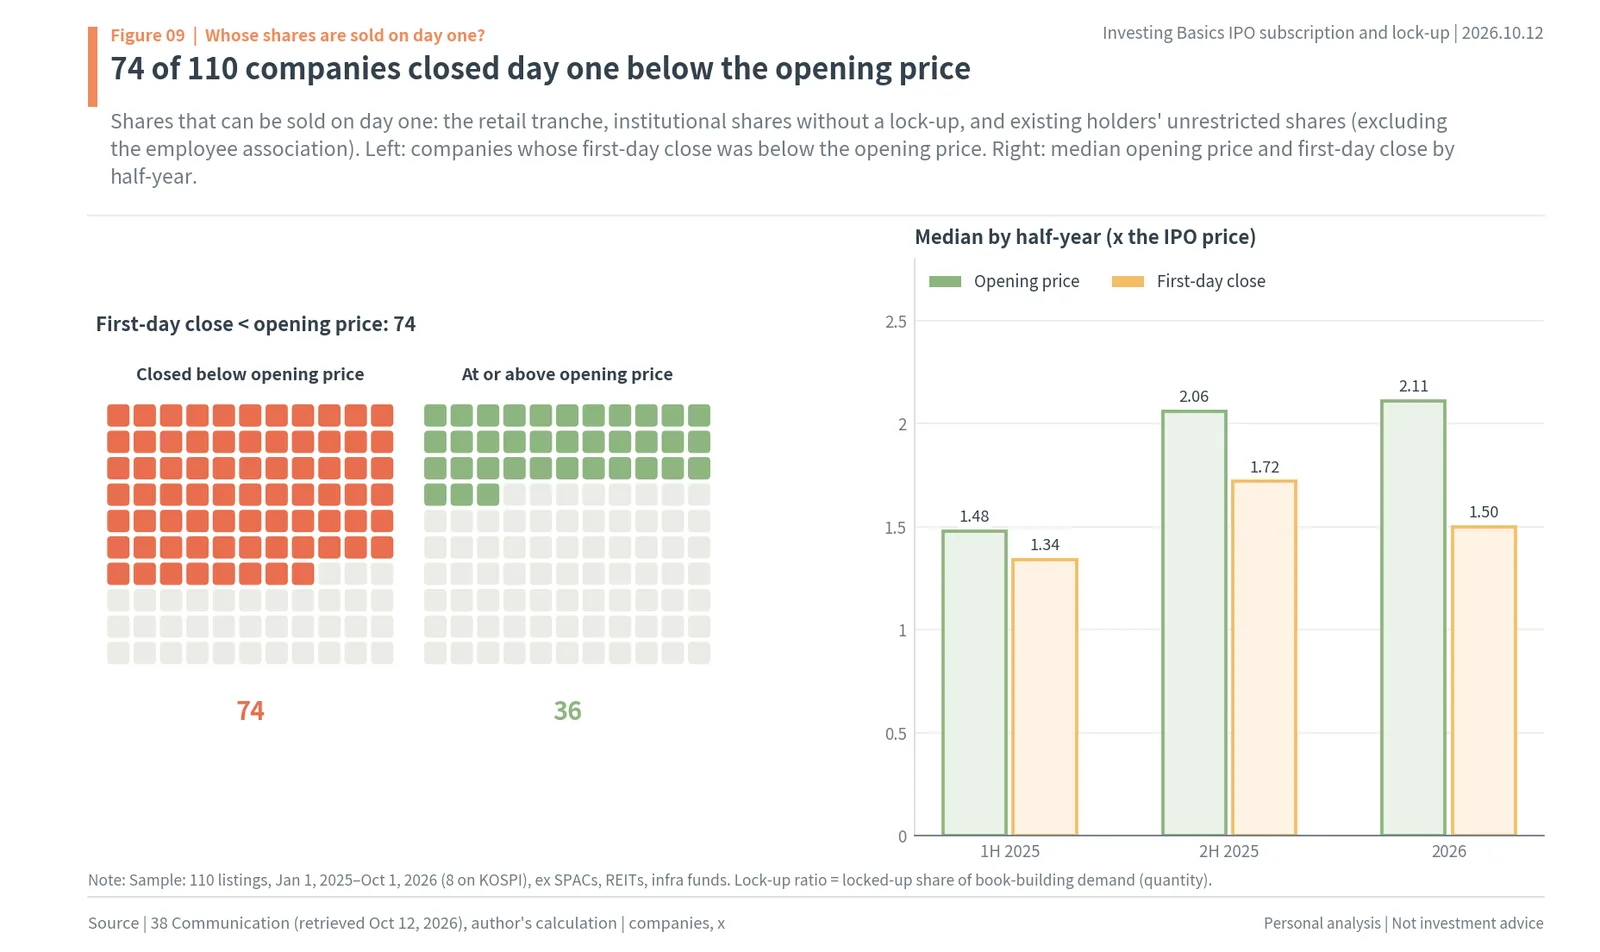
The left side of Figure 09 shows that 74 of the 110 companies closed the first day below the opening price. Thirty-six closed at or above it. As soon as the market opens, institutions without lock-ups and retail subscribers put shares up at the same time. Chaevi, listed in 2026, saw institutions net sell KRW 48.317bn (about $36 million) on its first day (IB Tomato, July 27, 2026). This selling pulls the price down within the first day.
The right side shows median opening prices and first-day closes by half-year. The 38 companies listed in the first half of 2025 opened at 1.48x and closed at 1.34x. The 38 in the second half of 2025 were at 2.06x and 1.72x, and the 34 in 2026 at 2.11x and 1.50x. Opening prices rose from the second half of 2025, when lock-ups increased, and the gap between the opening price and the first-day close was widest in 2026. In 2026, opening prices were set high and a large part of that gain disappeared within the first day.
In sum, as lock-ups increased, first-day selling fell and opening prices rose. But the locked-up shares that could not be sold on the first day do not disappear. On the day the lock-up ends, those shares become sellable again. The next sections look at what happens on that day, the lock-up expiry date.
12. Protective deposit, stock options and other shares released after listing
Institutional lock-ups are not the only shares released on expiry dates. The point is that institutional lock-ups, existing shareholders’ protective deposits and employee association shares are released on different dates, and an IPO’s float grows like a staircase along those dates. To draw an IPO’s selling calendar, you have to write down existing shareholders’ protective-deposit expiry dates along with institutional lock-up expiries.
The largest shareholder and related parties cannot sell for six months from listing. If the largest shareholder is a private equity fund, or the company is a KOSDAQ technology-growth or fast-track transfer listing, it is one year (Financial Services Commission, February 22, 2022). Since a 2022 revision, the remaining mandatory holding period also applies to shares received by exercising stock options after listing, and the exchange encourages splitting holders into periods from six months to two years and six months. Venture capital and professional investors that invested before listing carry a one-month mandatory holding period if they have held for less than two years.
These existing-shareholder shares are released in turn after listing and increase the float. The Pinkfong Company’s tradable float was scheduled to grow from 34.17% right after listing to 43.67% after one month, 52.37% after three months and 68.36% after six months (IB Tomato). At Sky Labs, 5,115,178 shares were tradable on the listing day, 27.26% of its 18,761,977 listed shares, and 89.07% of the institutional allocation could be sold on the listing day without a lock-up (AlphaSquare). Even if the listing-day float does not exceed 30%, first-day selling is heavy when the unlocked institutional portion within it is large.
The Korea Securities Depository announces each month the shares released from mandatory holding registration. In July 2026, 205.14 million shares of 41 companies were released, 94% of them on KOSDAQ (Metro Seoul). In October, 99.32 million shares of 34 companies are released (Asia Economy). These statistics count protective deposits of the largest and other existing shareholders, and do not include lock-ups committed by institutions in the IPO. So institutional lock-up expiries cannot be seen in the depository’s statistics; they have to be calculated directly by adding the period-by-period lock-up quantities in the book-building results notice to the listing date.
MakinaRocks, listed in 2026, is an example where the two releases overlapped. The company, with an IPO price of KRW 15,000, closed its first day at four times the IPO price, and its first protective-deposit release was 83,150 shares (0.47% of all shares) on June 4. Its institutional lock-up shares were split into 151,465 for one month, 520,076 for three months and 842,820 for six months (Newsis, June 3, 2026). Even on days with small releases, if lock-ups, protective deposits and stock-option shares overlap in the same week, that week’s selling grows.
13. Korea IPO rule changes: sanctions, put-back options and cornerstone investors
Besides lock-up priority allocation, the 2025 reform added measures that narrow the path for institutions to take IPO shares and sell them immediately. The point is the direction: the more you lock up, the more you receive, and if you break the commitment, you are shut out of book-building, which raises the value of lock-ups. From April 2025, sanctions for breaking lock-ups, failing to pay after subscribing and bidding in book-building but not subscribing were mostly changed to restrictions on book-building participation. In 2024, only 5 of 45 lock-up violations led to participation restrictions (Aju Business Daily, MTN).
From July 2025, the requirements to take part in book-building also rose. When private fund managers and discretionary investment managers bid in book-building with fund or discretionary assets, they must meet the same requirements as with their own assets (two years since registration and a minimum size of assets under management). Shares the lead underwriter bought before listing cannot be sold for six months if the IPO price is 30% or more above the purchase price. If the lock-up ratio falls short of the priority standard, the underwriter must buy 1% of the offered shares (up to KRW 3bn) and hold them for six months; LivsMed and Chaevi were such cases (Korea Economic Daily, June 24, 2026).
In 2026, protections for retail subscribers also increased. A put-back option is a right for retail subscribers to sell their shares back to the underwriter at 90% of the IPO price if the price falls sharply within a set period after listing. In 2026, Cosmo Robotics and Recens Medical attached three-month put-back options, and Inventera a six-month one (Bizwatch, March 11, 2026). In KOSDAQ offerings, the priority allocation to KOSDAQ venture funds was raised from 25% to 30% or more for registration statements filed from January 2026 (Financial News).
The cornerstone investor system gives shares in advance to institutions that commit to the longest lock-ups. The Financial Investment Services and Capital Markets Act amendment passed by the National Assembly on April 23, 2026 allows pre-allocation, before the registration statement is filed, to institutions that promise protective deposit of six months or more. The shares come from the institutional tranche, the 25% retail tranche stays the same, and it takes effect six months after promulgation (Financial Services Commission). The rules are moving toward more and longer lock-ups at the same time, so the lock-up period mix will become an even more important number when reading book-building results.
14. IPO stock prices over the first 60 trading days by lock-up ratio
After listing, share prices fall along the schedule on which lock-ups expire. The point is that even IPOs with many lock-ups see their multiple of the IPO price shrink sharply over the first 10-20 trading days, and IPOs with few lock-ups come down close to the IPO price during that time. The 15-day lock-up expires around trading day 10 after listing and the 1-month lock-up around trading day 20. These two points coincide with the sharpest bends in the post-listing price path.
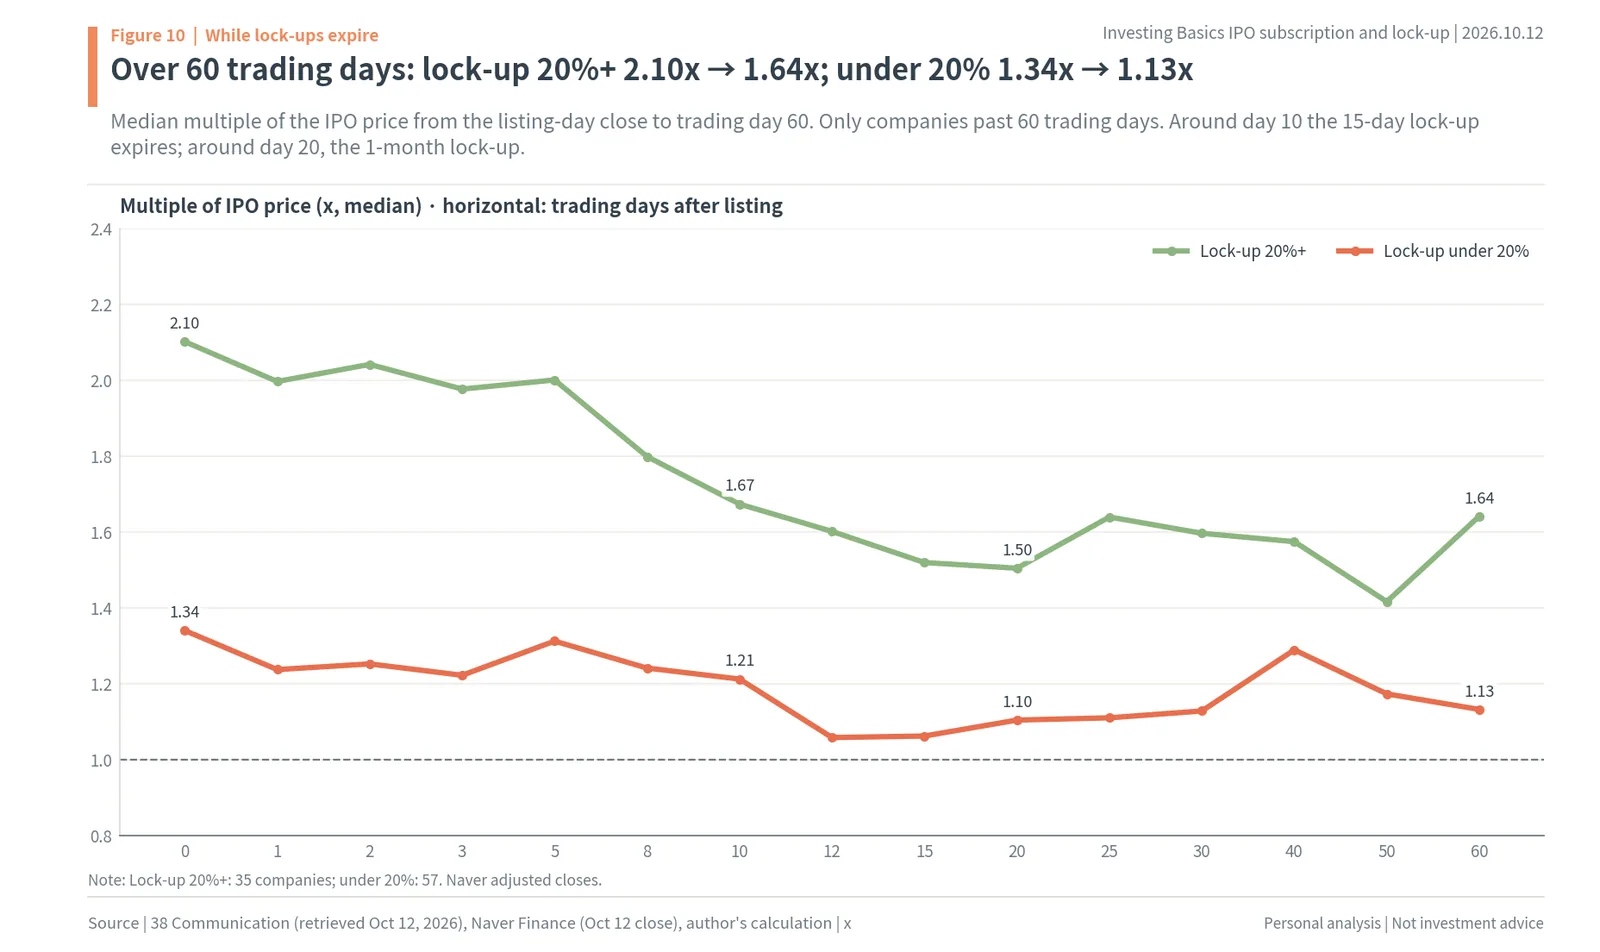
Figure 10 takes companies past 60 trading days and splits them into 35 with lock-ups of 20% or more and 57 under 20%, then connects the median multiple of the IPO price for each trading day. For lock-ups of 20% or more, the listing-day close was 2.10 times the IPO price; it fell to 1.67x by trading day 10 and 1.50x by day 20, then stood at 1.64x on day 60. Over 60 trading days, the 20%-or-more group came down from 2.10x to 1.64x, and the under-20% group from 1.34x to 1.13x.
The under-20% group fell to 1.21x by trading day 10 and 1.06x by day 12, close to the IPO price. IPOs with few lock-ups have many shares sellable from the first day, so they start at a low multiple, and the remaining premium shrinks further in the stretch where the 15-day lock-up expires. IPOs with many lock-ups start high on the first day, but a large part of the listing-day premium disappears within the first 20 trading days. Both paths bend most steeply between trading days 5 and 20.
15. Lock-up expiry day returns: -3.60% vs KOSDAQ on the 15-day expiry
Looking at the expiry day alone makes the effect of lock-up selling clearer. The point is that on the 15-day lock-up expiry day, the share price falls 3.60% more than KOSDAQ, and 8.64% more on a cumulative basis over the next five trading days. Institutions with 15-day lock-ups usually hold shares they could not sell near the opening price and sell them on the expiry day. Even if the price 15 days after listing is already below the first day’s, it still leaves the institution a profit as long as it is above the IPO price.
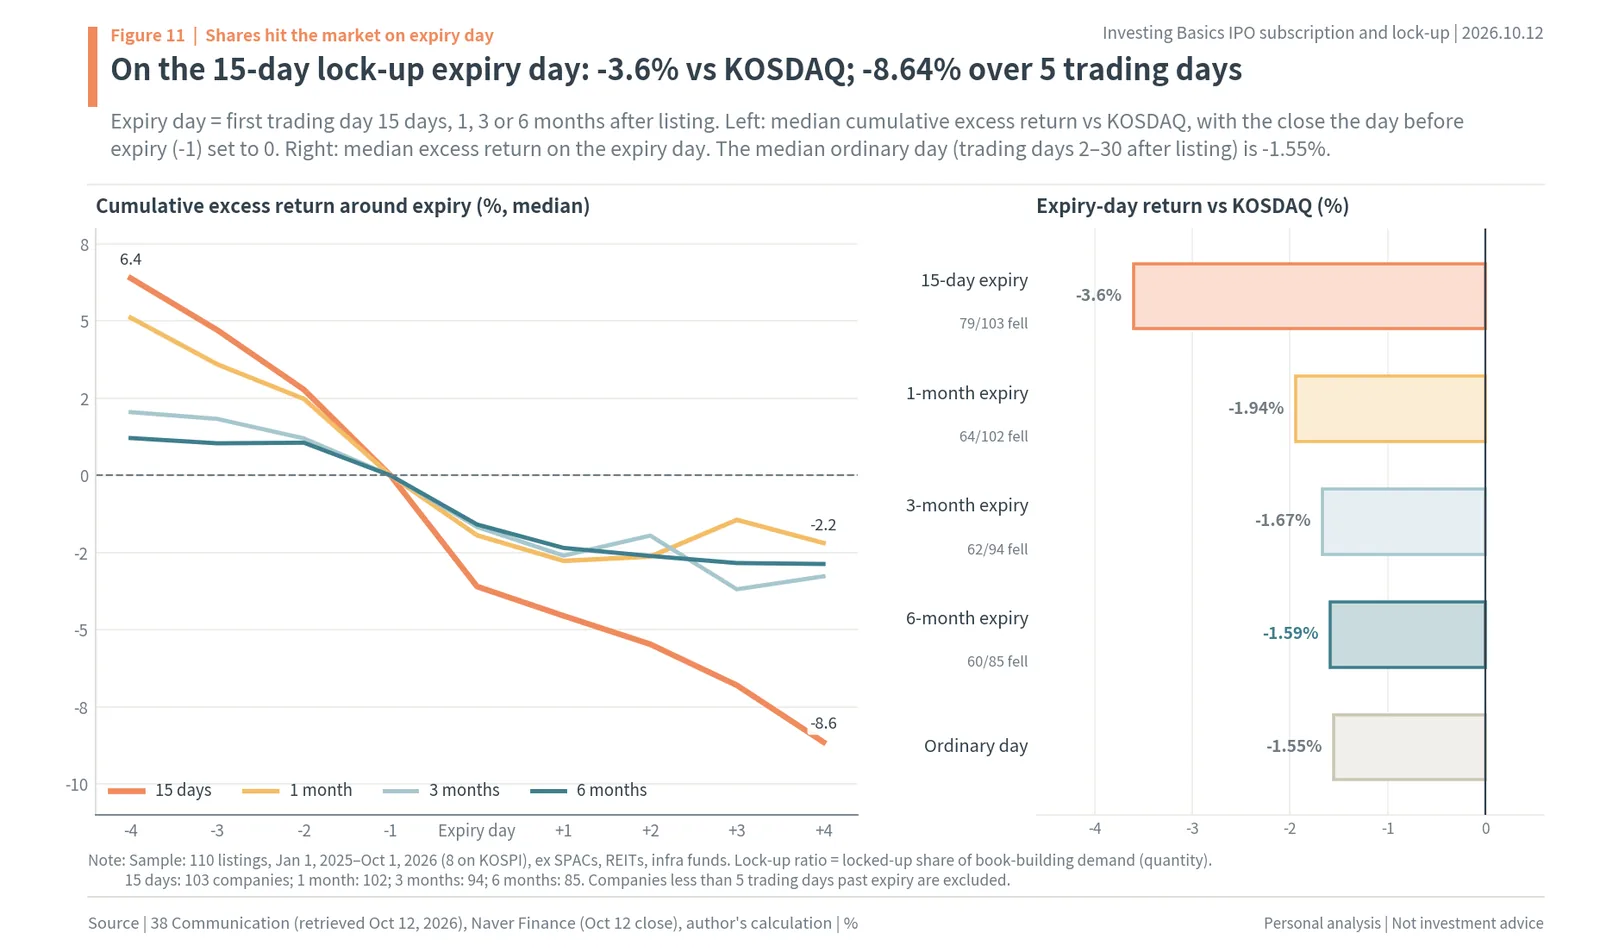
The left side of Figure 11 sets the close the day before expiry (-1) to 0 and connects the median cumulative excess return (vs KOSDAQ) for the trading days before and after. For the 15-day expiry, the point four days before expiry (-4) is +6.39%, meaning the price was already coming down before the expiry date. It keeps falling: -3.60% on the expiry day and -8.64% cumulative by trading day +4. The 1-month expiry is -1.94% on the day and -2.19% cumulative by +4, smaller than the 15-day. The 3-month expiry is -1.67% and -3.27%, and the 6-month -1.59% and -2.87%.
The right side collects only the expiry-day excess returns. On the 15-day expiry day, 79 of 103 companies were weaker than KOSDAQ. On the 1-month expiry day it was 64 of 102, at 3 months 62 of 94, and at 6 months 60 of 85. The median ordinary day used for comparison, trading days 2-30 after listing, is -1.55%. The -3.60% on the 15-day expiry day is more than double that ordinary day. The 1-, 3- and 6-month expiry days are only slightly weaker than an ordinary day.
There are two reasons the 15-day expiry reacts most. First, as the previous section showed, the 15-day share is the largest of all lock-up periods after the reform, at 36.5%. Second, 15-day lock-ups expire right after listing, while the price is still above the IPO price. By the time 3- and 6-month lock-ups expire, much of the first-day premium has already gone, so selling then leaves less profit than at the 15-day expiry. So expiry-day selling is heaviest when lock-up shares are large and the price is above the IPO price.
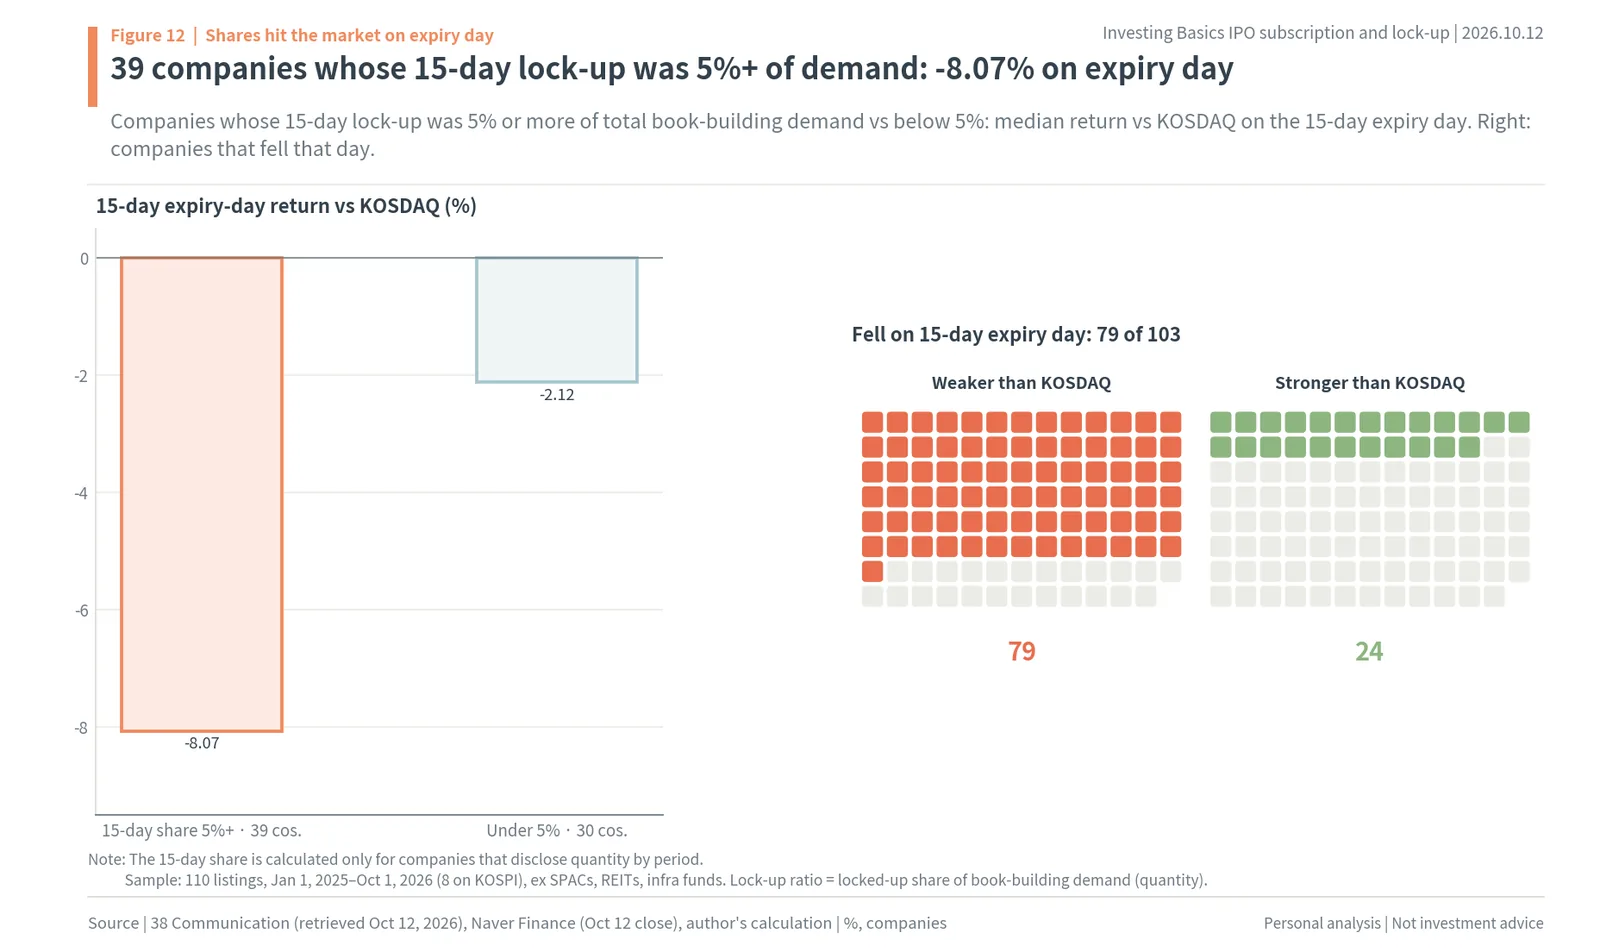
The reaction also depends on how large the 15-day lock-up is. The 39 companies whose 15-day lock-up quantity was 5% or more of total book-building demand fell 8.07% more than KOSDAQ on the 15-day expiry day. The 30 under 5% fell 2.12% more. Companies with many 15-day lock-ups release more shares on the expiry day, so that day’s drop is nearly four times larger. The right side of Figure 12 shows in boxes that 79 of 103 companies were weaker than KOSDAQ on the 15-day expiry day.
Because expiry dates are set in advance, the days the selling comes can also be known in advance. The expiry date is the listing date plus 15 days, 1 month, 3 months or 6 months, and if that day is a weekend or holiday, shares can be sold from the next trading day. How many lock-up shares there are for each period can be checked in the book-building results notice and the registration statement (final offering terms). So an IPO’s 15-day lock-up share is a number that tells you in advance the size of the selling 15 days after listing.
How to read expiry-day numbers
When using expiry-day numbers on a real IPO, look at three things together. The first is the trend before the expiry date. In the 15-day expiry chart, the point four days before expiry (-4) was +6.39%, which means the stock was already more than 6% weaker than KOSDAQ over the few days before expiry. Investors who know the expiry date sell before it. So the selling around the 15-day expiry comes not on one day but over the week around it.
The second is the price level on the expiry day. Expiry-day selling is heavy when the price that day is above the IPO price. Locked-up institutions received their shares at the IPO price, so if the price is above it, they can sell and lock in a profit. If the price has already fallen below the IPO price, they would have to sell at a loss, so selling shrinks.
The third is other shares released on the same day. The 1-month lock-up expiry coincides with the one-month mandatory holding expiry of financial investors such as venture capital funds. If shares are released through several channels on the same day, that day’s selling is larger than the institutional lock-up figure. Gathering the period-by-period lock-up quantities from the book-building results, each shareholder’s mandatory holding period from the registration statement and other IPOs’ expiry dates on the same day onto one calendar lets you draw that week’s selling in advance. So expiry-day numbers are read not as one day’s move but as a week’s selling calendar.
16. Lock-up quality: bid prices, final allocation and length
Even with the same lock-up ratio, how firm those lock-ups are differs. The point is that once you look at the lock-up period, the prices locked-up institutions bid and the share locked-up institutions received in the final allocation, the size of expiry-day selling diverges even within the same lock-up ratio. The previous section showed that IPOs with many 15-day lock-ups fall more on the expiry day. The same principle applies to the orders of locked-up institutions.
Haechitech, listed in August 2026, had a lock-up ratio of 15.08%. But 26 of the 37 institutions that committed to lock-ups bid below the KRW 23,000 bottom of the range, and their average order price was KRW 18,028 (Korea Economic Daily, August 23, 2026). If the IPO price is set above what these institutions bid, they receive no shares or few. These lock-ups show up in the lock-up ratio but do not translate into actual allocation or expiry-day selling. The industry calls them “for-show” lock-ups.
The final allocation numbers can also differ from the lock-up ratio. Because of the priority rule, underwriters give locked-up institutions a set share of the institutional allocation first. StradVision’s book-building lock-up ratio was 2.77%, but in the final allocation it gave 33.0% of the institutional allocation (5,186,592 shares) to locked-up institutions. Chaevi’s final locked-up allocation was 14.9%, and Peace Peace Studio’s 74.5% (IB Tomato). The bid-based lock-up ratio shows institutions’ attitude; the final-allocation lock-up ratio shows the shares that will actually be released on expiry dates. Final allocation numbers appear in the amended registration statement before listing and in the securities issuance report after listing.
Lock-up lengths shortened again in 2026. The Korea Economic Daily reported that the share of 6-month lock-ups fell from 10.7% in Q1 2026 to 5.4% in Q2, while the share without lock-ups rose from 49.3% to 65% (June 24, 2026). The average book-building demand ratio also fell from 1,012.7:1 in the first half of 2026 to 420.8:1 in the second half (Korea Economic Daily, August 23, 2026). When institutions that committed to lock-ups in the first half of 2026 found themselves holding shares that had fallen below the IPO price after listing, lock-ups and participation both fell in the second half.
So lock-ups are read in four layers: amount, length, price and final allocation. Amount is the book-building lock-up ratio; length is the mix of 15 days, 1 month, 3 months and 6 months; price is whether locked-up institutions bid at or above the IPO price; and final allocation is the share locked-up institutions actually received. The application steps later in this report calculate mainly with amount and length, which can be taken straight from the disclosures, and leave price and final allocation to be checked in the amended registration statement.
17. Before the reform: low-lock-up IPOs fell below the IPO price first
The link between lock-ups and post-listing prices pointed the same way before the 2025 reform. The point is that even before the rules changed, the fewer the lock-ups, the higher the share of IPOs that fell below their IPO price. Of new listings in 2016-2019, 32% closed their first day below the IPO price, and 49% were below it after one month (Newsis, November 18, 2020). In other words, only about half of IPOs held their IPO price through the first month after listing.
In Korea Exchange data on 31 companies listed in 2024, 21 were below their IPO price. Of the 18 with lock-ups under 10%, 15 were below the IPO price, while 7 of the 13 at 10% or more were above it (SBS Biz, July 7, 2024). Among this report’s 110 companies too, 24 of the 29 with lock-ups under 5% are now below their IPO price, the highest share of the four brackets. IPOs with few lock-ups have many shares sellable from the first day, so the premium disappears early.
What changed after the 2025 reform is the path of IPOs with many lock-ups. Before the reform, IPOs with many lock-ups were rare, so there were few to compare. After it, companies with lock-ups of 30% or more grew to 27; they rose to the 4x cap on the first day, came down at each expiry date, and now 19 of the 27 are below their IPO price. IPOs with many lock-ups only fall later; when the expiry dates came, they moved the same way. So the lock-up ratio is a number that explains the first-day price and at the same time tells you the size and date of selling a few weeks later.
18. Korean IPOs below the IPO price: 27 of 34 listed in 2026
After the first-day selling and the expiry-day selling, where do IPOs stand? The point is that 27 of the 34 companies listed in 2026 are below their IPO price at the October 12 close, and across all 110 companies listed since January 2025, 78 are below it. Subscribers who sold at the opening price and those holding until now ended up with opposite results. This section breaks those numbers down by half-year, lock-up bracket and offering size.
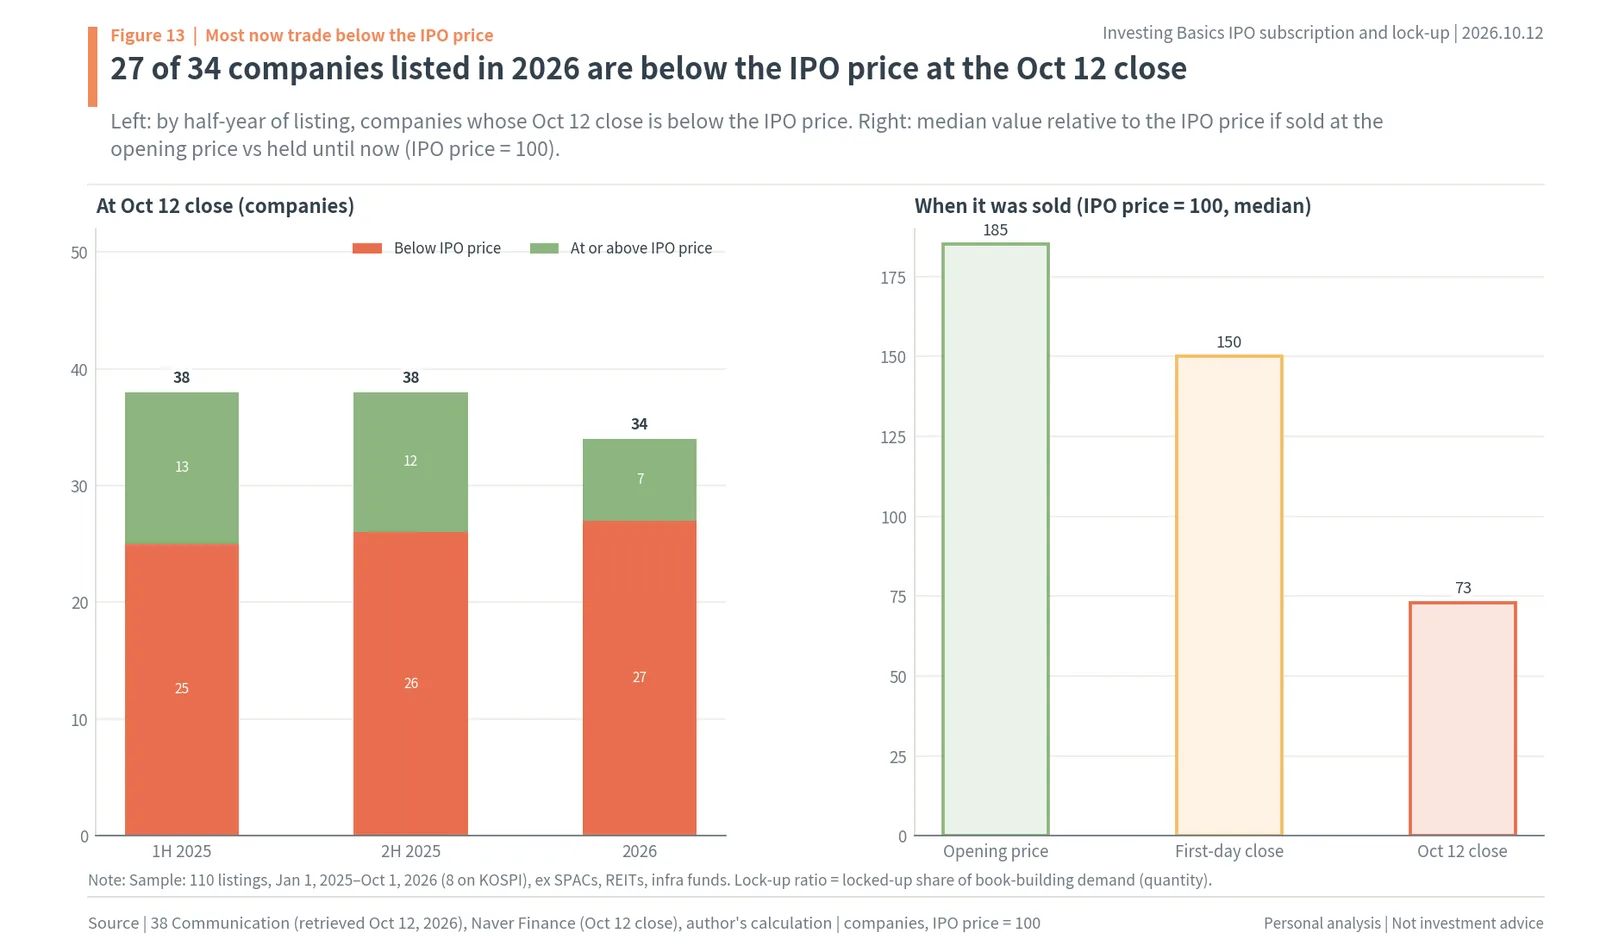
The left side of Figure 13 shows, for each half-year of listing, the companies whose October 12 close is below the IPO price. Of those listed in the first half of 2025, 25 of 38 are below the IPO price; in the second half, 26 of 38; in 2026, 27 of 34. Money Today also counted 22 of 26 companies listed this year as below their IPO price at the August 27 close (August 30, 2026). The more recent the listing, the higher the share below the IPO price.
The right side shows medians by when the shares were sold, with the IPO price set to 100. Selling at the opening price gives 185, at the first-day close 150, and holding until October 12 gives 73. In other words, among those who received the same IPO at the same price, those who sold at the opening price made 85% and those who held lost 27%. As shown earlier, this gap opens as lock-up selling comes out in turn between the first-day close and the expiry dates.
19. Largest Korean IPOs: LG CNS, Daehan Shipbuilding, K Bank and lock-ups
Large IPOs followed the same path. The point is that even large IPOs with high lock-up ratios opened high and are now below their IPO price, and only 2 of the top 10 are above it. Offering size is the final IPO price multiplied by the number of shares offered.
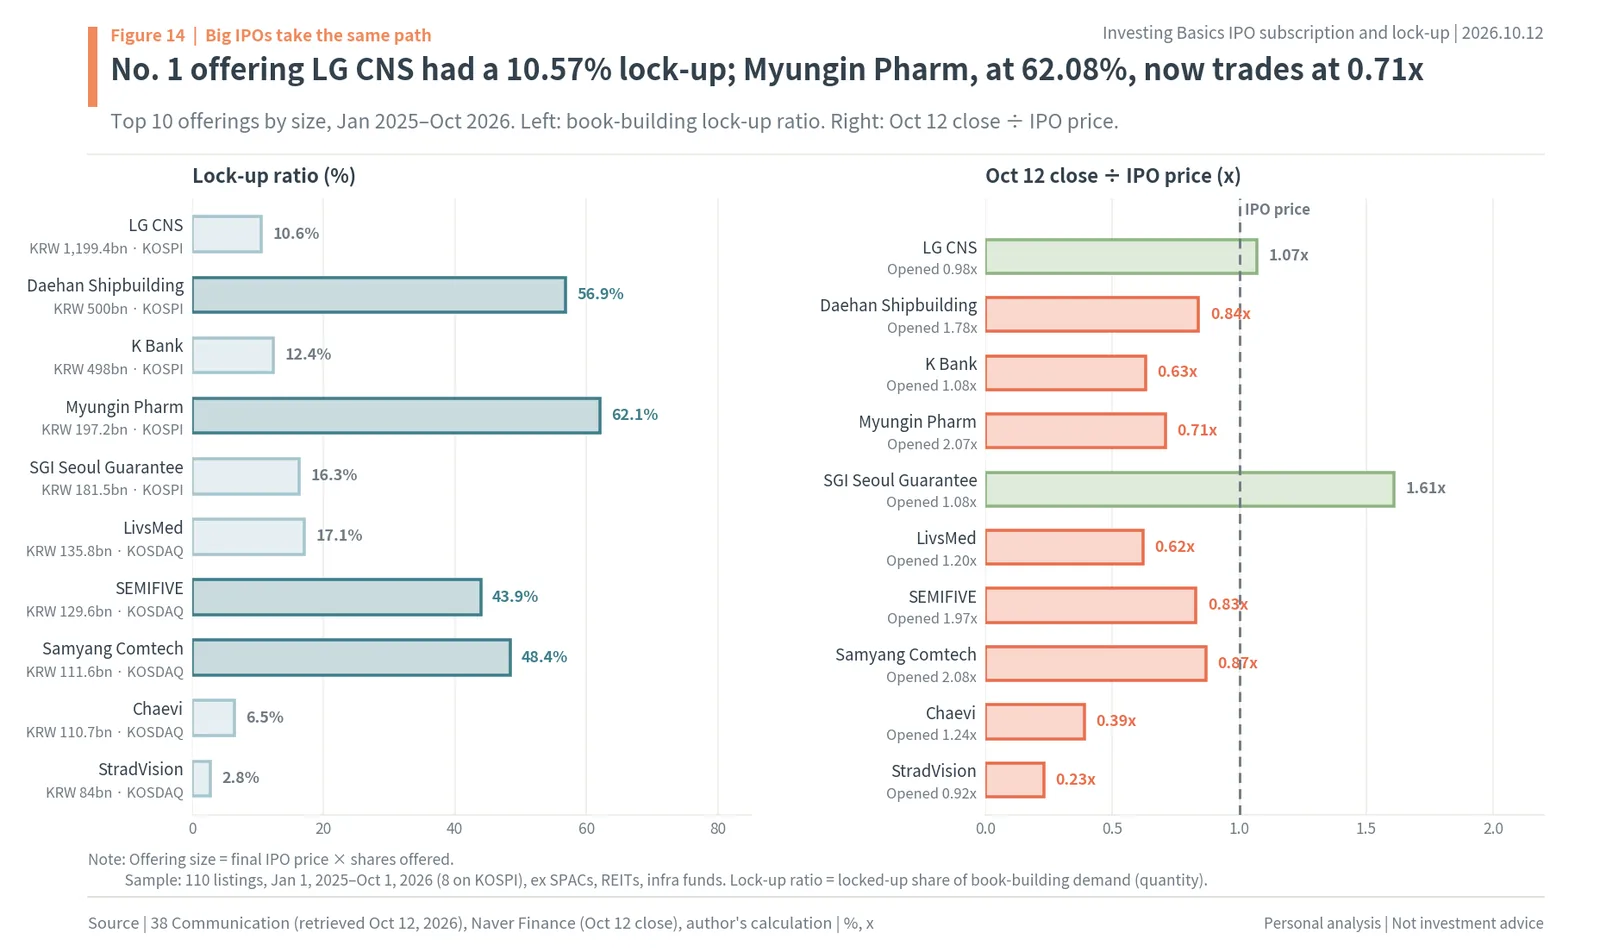
Figure 14 shows the top 10 offerings by size from January 2025 to October 2026. LG CNS, the largest offering (KRW 1,199.4bn, about $900 million), had a 10.57% lock-up and opened at 0.98 times the IPO price; its October 12 close is 1.07x. Daehan Shipbuilding, second (KRW 500bn), had a 56.86% lock-up and opened at 1.78x, but is now at 0.84x. Myungin Pharm, with a 62.08% lock-up, came down from an opening of 2.07x to 0.71x now. Samyang Comtech, at 48.37%, also went from an opening of 2.08x to 0.87x.
Large IPOs with few lock-ups fell further. K Bank (279570.KS; KRW 498bn), with a 12.39% lock-up, went from an opening of 1.08x to 0.63x now. Its retail subscription drew about KRW 98.5tn (about $74bn) in deposits at a ratio of 134.6:1 (Byline Network). Chaevi, with a 6.49% lock-up, is now at 0.39x, and StradVision, at 2.77%, at 0.23x. Of the 10, only two are above their IPO price now: LG CNS (1.07x) and SGI Seoul Guarantee (1.61x).
High-lock-up IPOs are below their IPO price too because a lock-up only delays selling. Institutions with 6-month lock-ups can also sell after six months, and even if the price comes down from the first day’s high in the meantime, they still make a profit as long as it is above the IPO price. IB Tomato found that MakinaRocks (78.17%), which had a high lock-up ratio in the first half of 2026, had fallen 62.3% from its first-day close as of July 22. A lock-up raises the first-day price but does not protect that high price.
20. Retail subscription ratios: 951:1 to 1,426:1
Subscription ratios moved the same way. The point is that retail subscription ratios rose every year while institutional demand ratios did not rise as much, and high subscription ratios did not protect post-listing prices. The higher the subscription ratio, the fewer shares individuals receive and the higher the first-day value of the shares received. That leaves more room for a price that starts high to come down further on expiry dates.
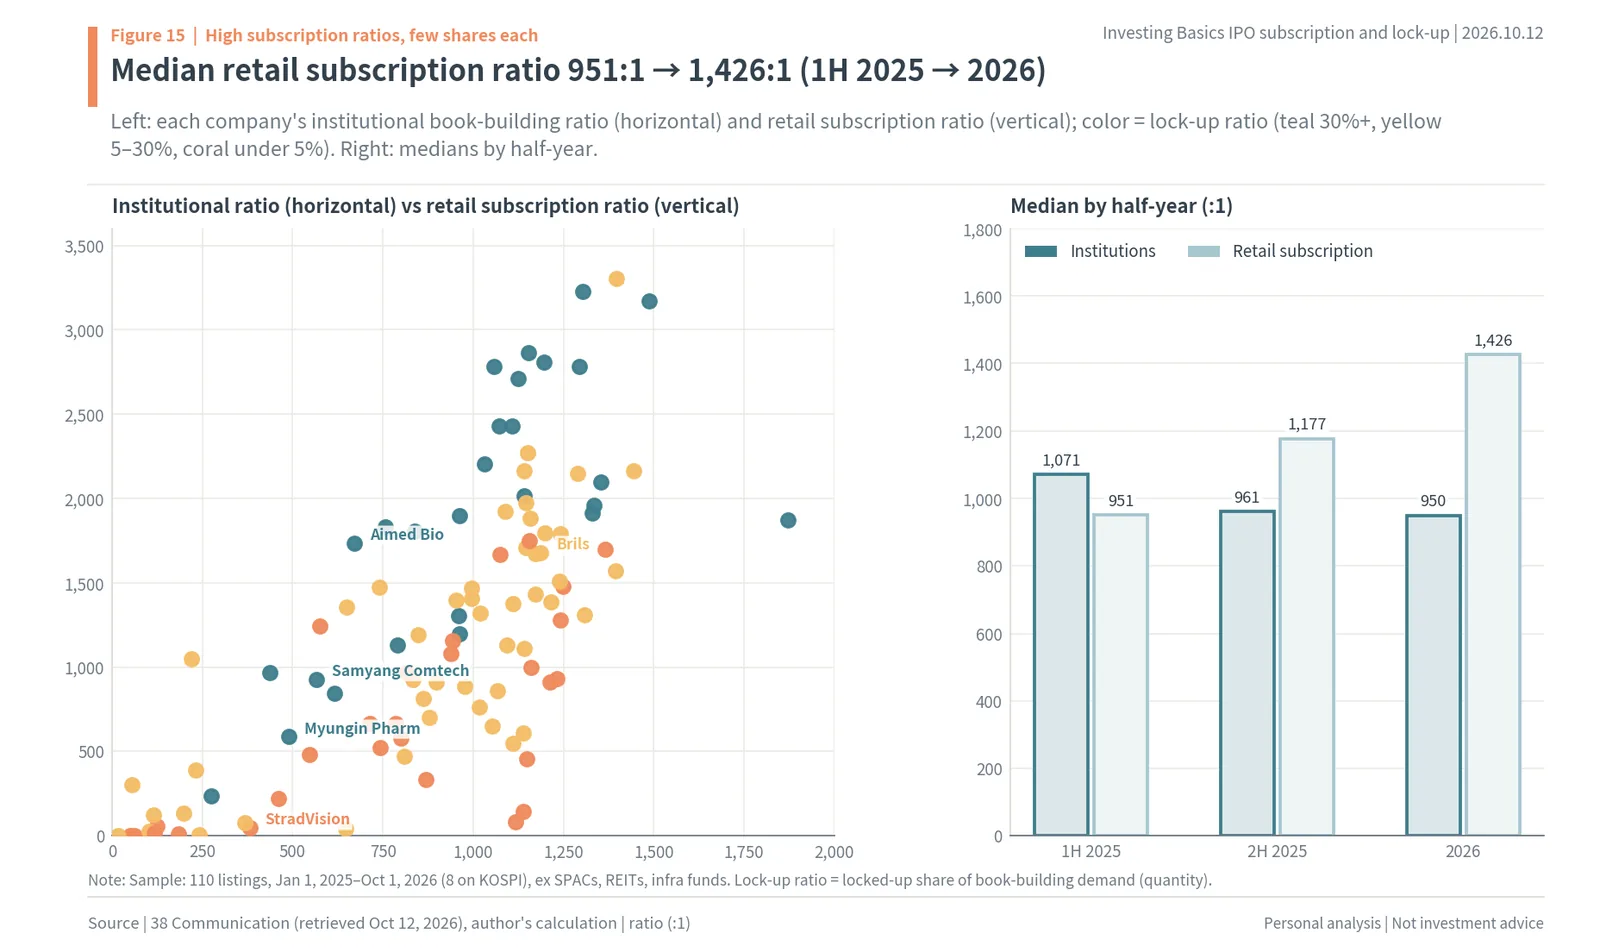
The left side of Figure 15 plots each company’s institutional book-building ratio and retail subscription ratio. Dots with retail ratios of 2,000:1 or more cluster among companies with institutional ratios above 1,000:1, and many of them are teal dots with lock-ups of 30% or more. The more lock-ups and the higher the institutional ratio, the more retail subscriptions crowd in too. The right side shows medians by half-year. The median retail subscription ratio rose from 951:1 in the first half of 2025 to 1,177:1 in the second half and 1,426:1 in 2026, while the institutional ratios were 1,071:1, 961:1 and 950:1.
A retail subscription ratio rising from 951:1 to 1,426:1 means the deposit needed to get one share by proportional allocation became 1.5 times larger. By the Financial Supervisory Service’s count, retail subscription deposits in 2025 were KRW 780tn (about $586bn), and the average subscription ratio was 1,106:1 (Money Today). Individuals’ subscription money grew, and the shares that money received shrank.
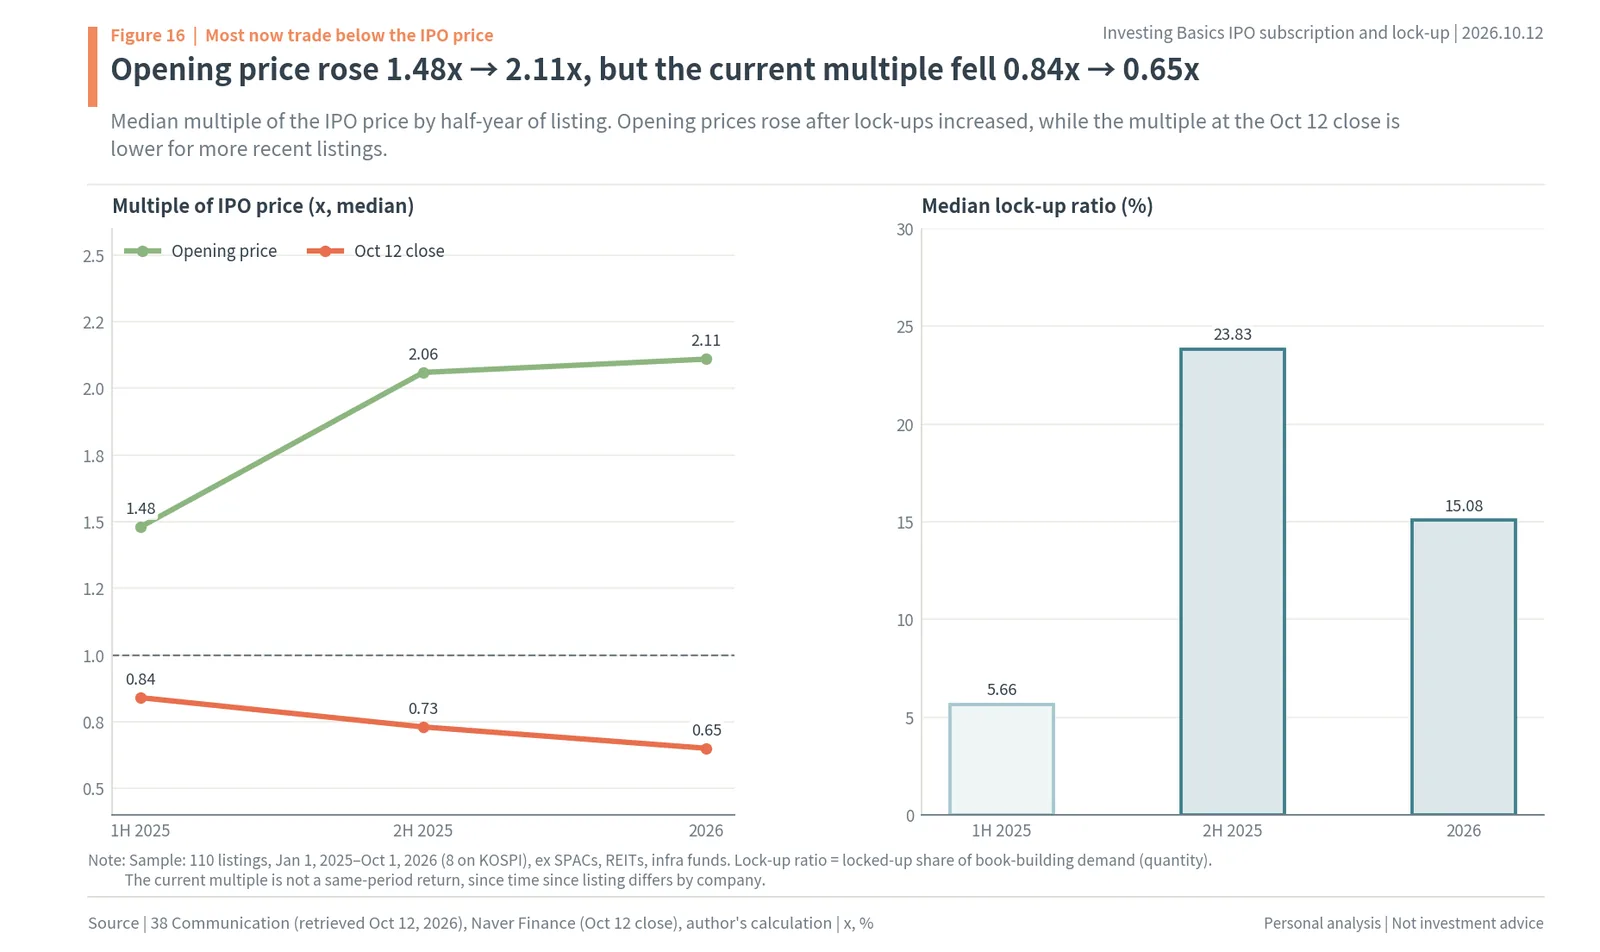
Figure 16 puts the half-yearly opening price and October 12 close multiples side by side. The opening price rose from 1.48x to 2.06x and 2.11x, but the current multiple fell from 0.84x to 0.73x and 0.65x. On the right, the median lock-up ratios are 5.66%, 23.83% and 15.08%. The current multiple is not a same-period return, because the time since listing differs from company to company. Even so, it is clear that the more recent the listing, the higher the opening price it started from and the shorter the time it took to fall below the IPO price. The higher opening prices widened the room to fall after the expiry dates.
Within 2026 too, the pattern split by month. The eight companies listed in March had a median lock-up ratio of 69.7% and a median opening price of 3.41 times the IPO price. The three listed in May had a 73.0% lock-up and opened at 4.00x, so the median of all three was the first-day cap. By contrast, the six listed in August had a 1.3% lock-up and opened at 0.95x, so the median started below the IPO price. The six listed in September had a 3.8% lock-up and opened at 2.32x. When IPOs that institutions had locked up heavily in the first half fell below their IPO price as they passed their expiry dates, institutions avoided lock-ups in the second half and the shares sellable on the first day rose again. The lock-up ratio captures the mood of that month’s IPO market, so when looking at an IPO, compare its lock-up ratio with those of other companies listed in the same month.
21. Lock-up expiry calendar for October 2026 Korean IPOs
The days lock-up selling arrives can be calculated in advance from the listing date alone. The point is that the 15-day lock-ups of the five companies listing in October expire between October 30 and November 7, and the 1-month lock-ups of September listings expire over the same stretch. These dates tell subscribers when to sell, and tell investors who want to buy after listing when the selling arrives.
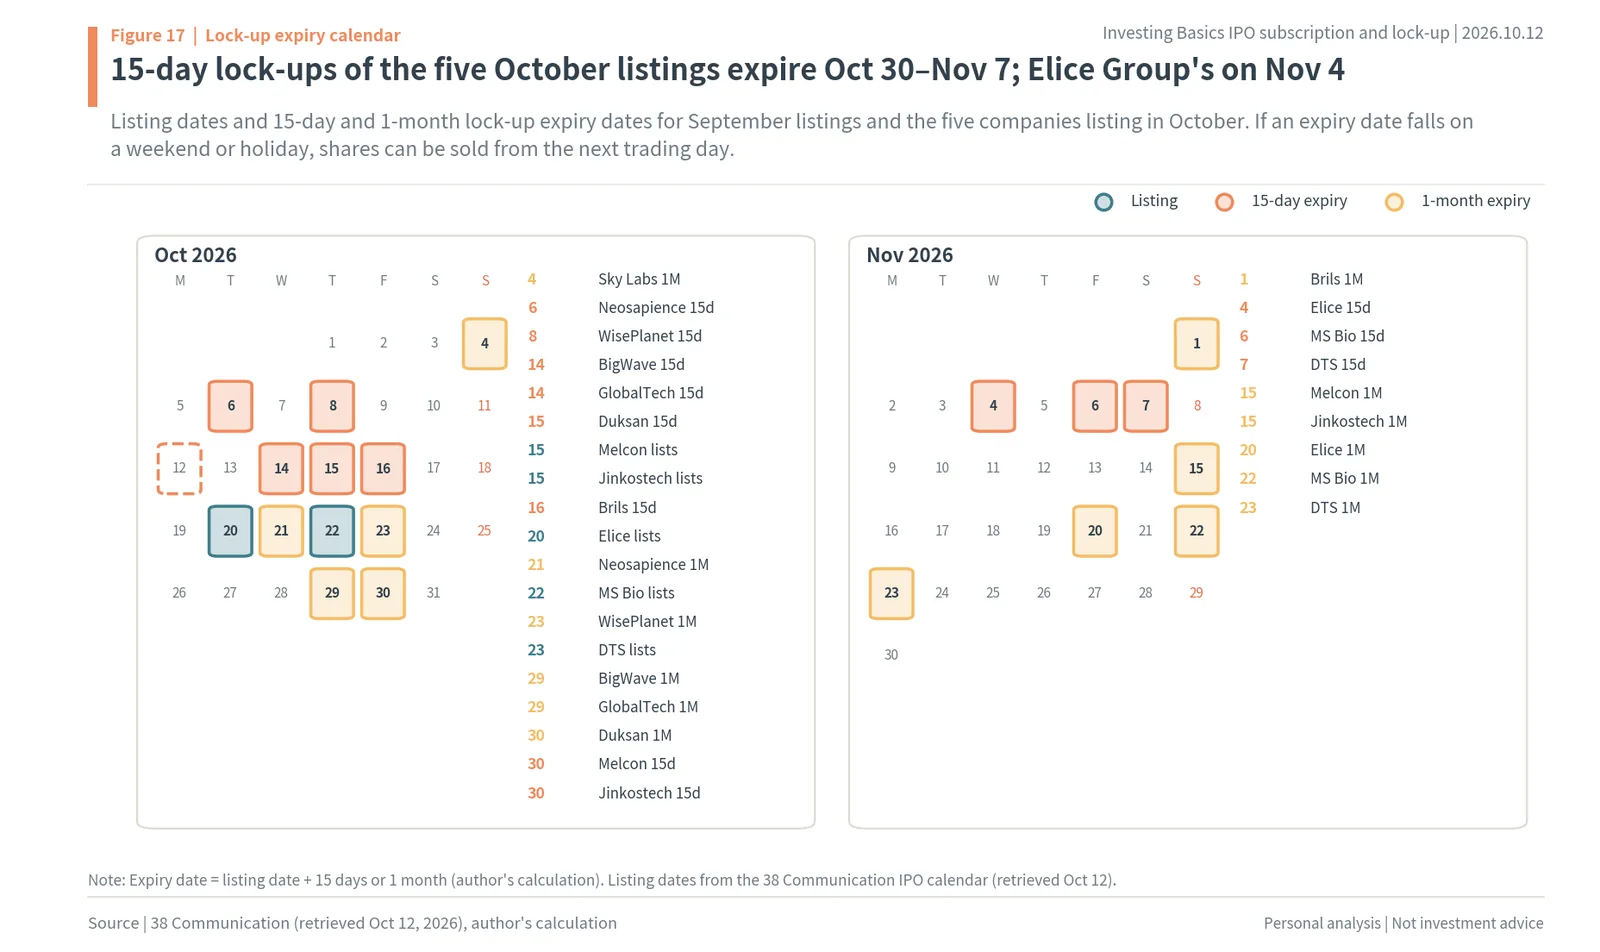
Figure 17 puts the listing dates and 15-day and 1-month lock-up expiry dates of September listings and the five companies listing in October on a calendar. Melcon (179880.KQ) and Jinkostech (250030.KQ) list on October 15, Elice Group (0158S0.KQ) on the 20th, MS Bio on the 22nd and DTS on the 23rd (38 Communication IPO calendar). The 15-day lock-ups expire on October 30 for Melcon and Jinkostech, November 4 for Elice Group, November 6 for MS Bio and November 7 for DTS. The 15-day lock-ups of the five October listings expire on October 30-November 7, with Elice Group’s on November 4.
September listings see their 1-month lock-ups expire in October. Neosapience (listed September 21) on October 21, WisePlanet Company (September 23) on October 23, BigWave Robotics and Global Technology (September 29) on October 29, and Duksan Navcours (September 30) on October 30. Brils, listed October 1, has its 15-day lock-up expire on October 16 and its 1-month lock-up on November 1 (a Sunday, so from November 2). If an expiry date falls on a weekend or holiday, shares can be sold from the next trading day.
22. Six steps to read an IPO’s lock-ups (Elice Group example)
This section turns the numbers so far into six steps readers can follow themselves. The point is that from one book-building results notice you read the institutional demand ratio, the price position, the lock-up ratio and the lock-up period mix, calculate the expiry dates from the listing date, and calculate the deposit from the subscription ratio. The example is Elice Group, due to list on KOSDAQ on October 20. Its IPO price is KRW 90,500 (about $68), the top of the KRW 70,400-90,500 indicative range; its institutional demand ratio was 388.84:1, its lock-up ratio 13.70% and its retail subscription ratio 408:1 (proportional 816:1) (38 Communication).
Step 1 is the institutional demand ratio. It shows how many times the offered shares institutions bid for; the median of the 65 post-reform book-buildings is 943:1. Elice Group’s 388.84:1 is less than half that median. Step 2 is the price position. As shown earlier, 92 of 110 companies priced at the top of the range, so the top of the range is the normal result, and a price set below the range means weak institutional demand. Elice Group is at the top of the range.
Step 3 is the lock-up ratio. Compare it with the post-reform median of 23.83%. Elice Group’s 13.70% is below the median. In the brackets shown earlier, it falls in the 5-15% bracket, where the 31 companies opened at a median 1.69 times the IPO price and closed the first day at 1.52x. Step 4 is the lock-up period mix. Check what percentage of the lock-ups are 15-day. Of Elice Group’s 13.70% lock-up, 74.8% is 15-day, more than double the 36.5% of all post-reform IPOs. The combined 3- and 6-month share is 16.0%. Its 15-day lock-up quantity is 10.25% of total book-building demand, above the 5% line shown earlier.
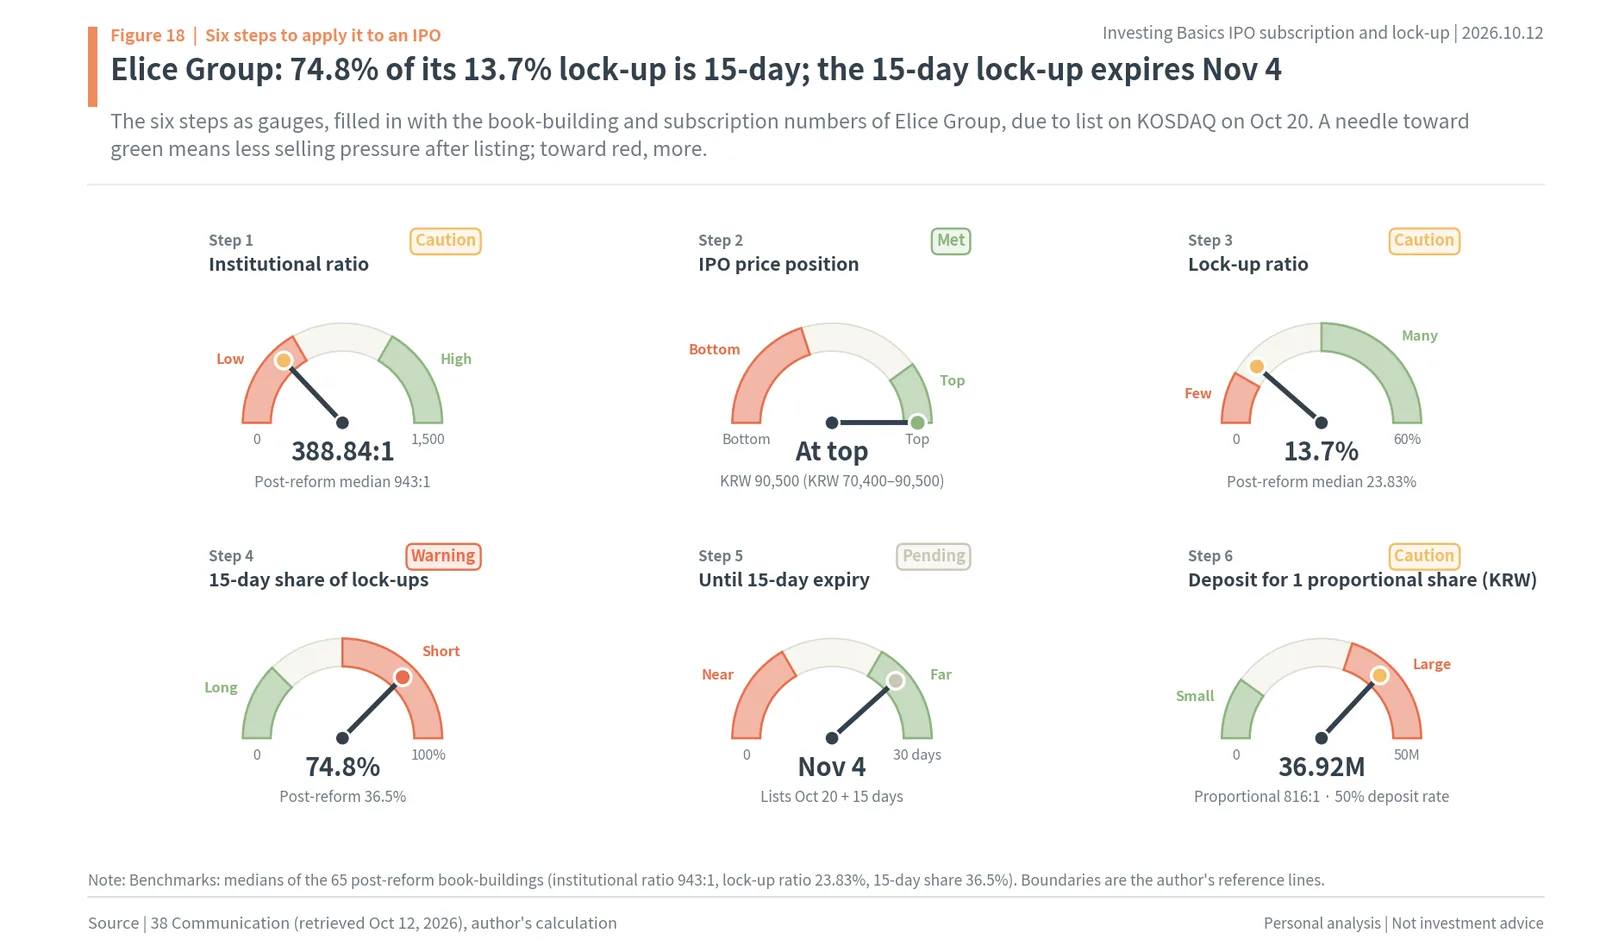
Step 5 is the expiry calendar. Adding 15 days to the October 20 listing date puts the 15-day lock-up expiry on November 4, the 1-month expiry on November 20 and the 3-month expiry on January 20, 2027. From October 12 to the 15-day expiry date is 23 days. Step 6 is the deposit. At a proportional ratio of 816:1, getting one share requires subscribing for 816 shares; multiplying by the KRW 90,500 IPO price and the 50% deposit rate gives KRW 36,924,000, or about KRW 36.92 million (about $27,700). Figure 18 turns these six steps into gauges. Of Elice Group’s 13.7% lock-up, 74.8% is 15-day, and the 15-day lock-up expires on November 4.
After the six steps, Elice Group reads as an IPO whose lock-ups are below the median and mostly expire after 15 days. By the numbers shown earlier, such an IPO has heavy first-day selling, and selling returns around its 15-day expiry date, November 4. For a subscriber, the order these numbers point to is to decide whether to sell before November 4; for an investor who wants to buy after listing, to use the price after November 4 as the reference.
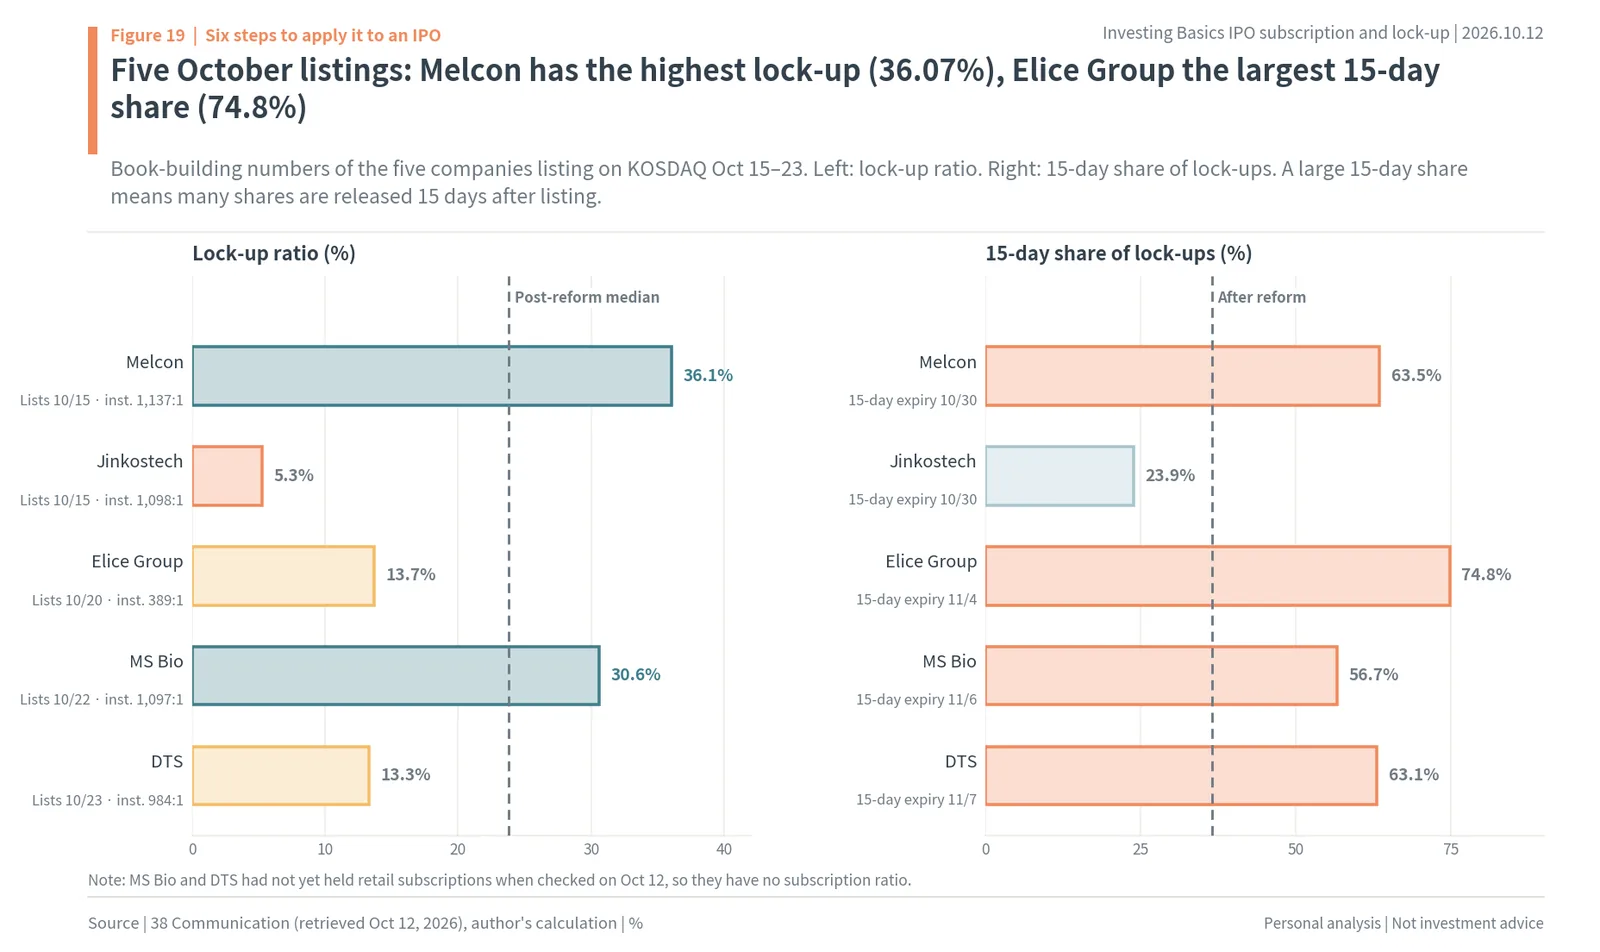
Applying the same method to the five companies listing in October shows the differences. The left side of Figure 19 is the lock-up ratio. Melcon is highest at 36.07%, followed by MS Bio at 30.62%, Elice Group at 13.70%, DTS at 13.31% and Jinkostech at 5.29%. The right side is the 15-day share of lock-ups: Elice Group 74.8%, Melcon 63.5%, DTS 63.1%, MS Bio 56.7% and Jinkostech 23.9%. Among the five October listings, Melcon has the largest lock-up at 36.07%, and Elice Group the largest 15-day share at 74.8%.
Melcon has many lock-ups, so its first-day selling should be light, but 63.5% of those lock-ups are 15-day, so selling on its October 30 expiry date is also large. Jinkostech has few lock-ups at 5.29%, so its first-day selling is heavy, but its lock-ups are long, with 59.7% in 3 and 6 months. The deposit for one proportional share was about KRW 21.42 million for Melcon (proportional 3,483:1) and about KRW 16.10 million for Jinkostech (proportional 1,370:1). MS Bio and DTS had not yet held retail subscriptions when checked on October 12, so they have no subscription ratio.
23. Melcon vs Jinkostech: same listing day, opposite lock-ups
The six steps are more useful for comparing companies that list on the same day than for one company alone. The point is that Melcon and Jinkostech, both listing on October 15, are opposites in the amount and length of their lock-ups, so the size of their first-day and expiry-day selling is expected to be opposite too. Both are due to list on KOSDAQ, and their IPO prices were set at the top of their indicative ranges, KRW 12,300 and KRW 23,500 respectively (38 Communication).
In Step 1, the institutional demand ratios are 1,136.84:1 for Melcon and 1,097.62:1 for Jinkostech, both above the post-reform median of 943:1. In Step 2, both priced at the top of their ranges. Up to here, the two are the same. Similar numbers of institutions crowded in and bid in the same price zone. Looking only at the IPO price and demand ratio, the two cannot be told apart.
They split at Step 3. Melcon’s lock-up ratio of 36.07% is above the post-reform median of 23.83%, while Jinkostech’s 5.29% is far below it. Plugging in the bracket figures from earlier, Melcon falls in the 30%-or-more bracket (median opening 3.38x, first-day close 2.53x), and Jinkostech sits at the low end of the 5-15% bracket (the under-5% bracket opened at 1.35x and closed at 1.13x). Jinkostech has far more institutional shares sellable on the first day.
Step 4, the lock-up period mix, points the other way. Of Melcon’s lock-ups, 63.5% are 15-day, and the combined 3- and 6-month share is 18.0%. Its 15-day lock-up quantity is 22.92% of total book-building demand, more than four times the 5% line shown earlier. Of Jinkostech’s lock-ups, 23.9% are 15-day and 59.7% are 3- and 6-month. Its 15-day lock-up quantity is only 1.26% of total demand. Melcon has light first-day selling but heavy selling on the 15-day expiry date; Jinkostech has heavy first-day selling but light selling on the 15-day expiry date.
In Step 5, the expiry dates are the same for both. The 15-day lock-ups expire on October 30, 15 days after the October 15 listing; the 1-month lock-ups on November 15 (a Sunday, so from November 16); and the 3-month lock-ups on January 15, 2027. October 30 also coincides with the 1-month lock-up expiry of Duksan Navcours, listed September 30. When several IPOs’ lock-ups expire on the same day, short-term money trading IPOs crowds to one side that day.
In Step 6, the deposit was about KRW 21.42 million (about $16,100) per share for Melcon at a proportional ratio of 3,483:1, and about KRW 16.10 million (about $12,100) for Jinkostech at 1,370:1. The retail subscription ratios are 1,741.48:1 for Melcon and 685:1 for Jinkostech. Retail subscriptions crowded more into Melcon, which has more lock-ups. This matches the pattern in the subscription-ratio chart: IPOs with many lock-ups and high institutional ratios draw more retail subscriptions.
Putting the two side by side makes clear what the six steps measure. Steps 1-2 measure how many institutions crowded in; Step 3 how much first-day selling was reduced; Steps 4-5 when and how much of that reduced selling comes back; and Step 6 what individuals pay to receive the shares. Melcon is an IPO that is light on the first day and heavy on October 30; Jinkostech is heavy on the first day and light on its expiry date. So even for two IPOs listing on the same day, the reference point for when to sell differs.
The same order can be applied to MS Bio, listing on October 22, and DTS, listing on the 23rd. MS Bio has an institutional demand ratio of 1,096.56:1 and a lock-up ratio of 30.62%, placing it in the 30%-or-more bracket, and 56.7% of its lock-ups are 15-day. Its 15-day lock-up quantity is 17.36% of total book-building demand, more than three times the 5% line. Its 15-day lock-up expires on November 6. DTS has an institutional demand ratio of 983.98:1 and a lock-up ratio of 13.31%, in the 5-15% bracket; 63.1% of its lock-ups are 15-day, and its 15-day lock-up quantity is 8.40% of total demand. Its 15-day expiry date is November 7, a Saturday, so shares can be sold from November 9. For both, read first-day selling by the lock-up ratio and expiry-day selling by the 15-day share. The 15-day expiry dates of the five October listings are bunched within the eleven days from October 30 to November 9, so that stretch is one in which selling overlaps across newly listed stocks as a whole.
24. How much is one equal-allocation IPO share worth?
What most retail subscribers actually receive is one or two equal-allocation shares. The point is that the value of one equal share is set almost entirely by the IPO’s opening price and lock-up mix, and relative to the minimum deposit it is far larger than for proportional allocation. Equal allocation only requires subscribing for the minimum quantity (usually 10 shares), and if there are more accounts than equal shares, one share goes by lottery.
With Brils, the calculation runs like this. The deposit for the minimum 10 shares in equal allocation is KRW 97,500. Receiving one equal share and selling at the opening price made KRW 42,300, more than 43% of the KRW 97,500 put in. Selling at the first-day close made KRW 11,850, and at the October 12 close KRW 550. Getting the same one share by proportional allocation required putting in KRW 32.69 million, so comparing the profit on that one share with the money tied up, the equal side is hundreds of times larger. An individual’s IPO return is ultimately decided by when that one equal share is sold.
When to sell is gauged with the lock-up bracket figures shown earlier. As medians across the 110 companies, a share with an IPO price of 100 was worth 185 at the opening price, 150 at the first-day close and 73 at the October 12 close. The 30%-or-more bracket opened at 338 and closed the first day at 253, and the under-5% bracket at 135 and 113. IPOs with few lock-ups show a large gap between the opening price and the close even within the first day, while IPOs with many lock-ups keep their premium through the first-day close and start losing it around the 15-day expiry date. So the value of one equal share is read through the lock-up ratio for the first day, and through the lock-up period mix for what comes after.
25. IPO subscription and lock-up expiry: key takeaways
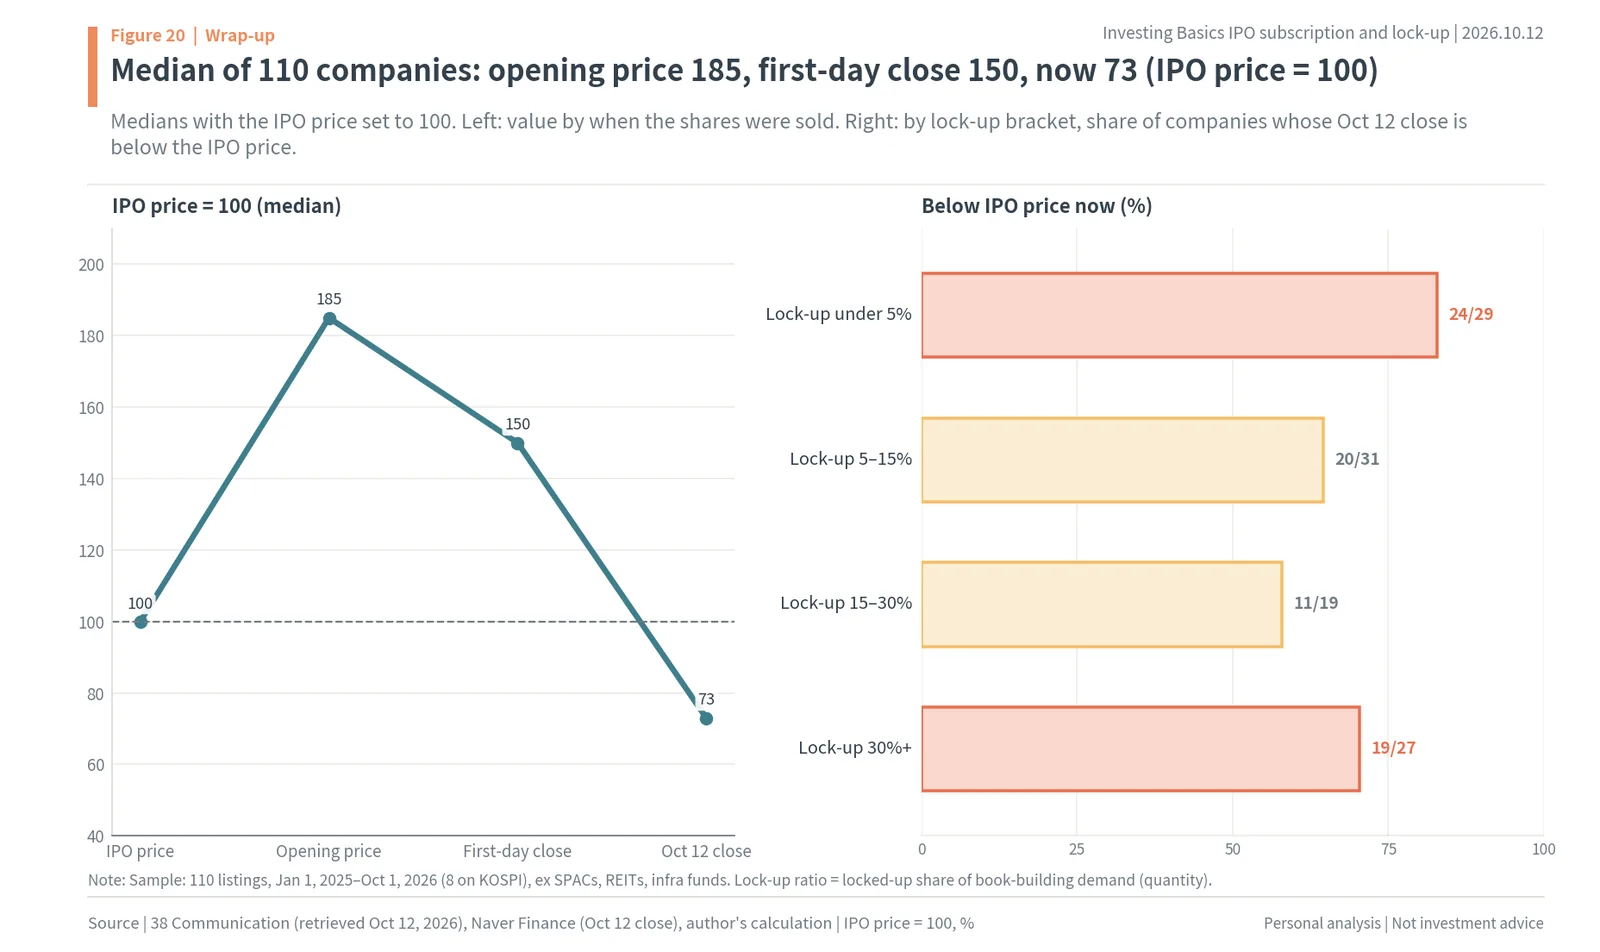
Finally, setting all 110 companies at an IPO price of 100 sums up the path of an IPO in one line. As medians across the 110, the opening price is 185, the first-day close 150 and the October 12 close 73. The right side shows, by lock-up bracket, the share of companies now below their IPO price. Of those with lock-ups under 5%, 24 of 29 are below the IPO price; at 5-15%, 20 of 31; at 15-30%, 11 of 19; and at 30% or more, 19 of 27. Even IPOs with many lock-ups come down below their IPO price over time.
This report has one thread. A quarter of the offered shares is split among individuals, and most of the rest goes to institutions through book-building. Since July 2025, locked-up institutions have received shares first, so the lock-up ratio rose, the shares sellable on the first day fell and opening prices rose. But more than a third of the extra lock-ups are 15-day, so that selling moved to 15 days after listing, and on the 15-day expiry day share prices fell 3.60% more than KOSDAQ. So an IPO is read not just by its lock-up ratio but by its lock-up period mix and expiry calendar.
마오채둥 정리. IPO subscription hands 25% of the offered shares to individuals; half of that is split by number of accounts and the rest by deposit, so one proportional share of a popular IPO costs tens of millions of won. What sets the post-listing price is institutions’ lock-up commitments. After lock-up priority allocation in July 2025, the median lock-up ratio rose from 5.77% to 23.83% and pushed opening prices up, but 36.5% of the extra lock-ups are 15-day, so selling arrives on the expiry date 15 days after listing. A lock-up does not remove selling; it moves it to the expiry date.
Korea IPO Subscription and Lock-Up FAQ
Q. What is an IPO lock-up ratio in Korea?
It is the share of the quantity institutions bid in book-building that they committed to hold for a mandatory period of 15 days, 1 month, 3 months or 6 months. Among 110 Korean IPOs, the median was 5.77% before lock-up priority allocation began in July 2025 and 23.83% after it.
Q. How are Korean IPO shares allocated to retail investors?
Retail subscribers get 25% of the offered shares. At least half of that is split equally among accounts that subscribe for the minimum (usually 10 shares), and the rest is split in proportion to the deposit, which is 50% of the subscription amount. For Brils, one proportional share required a deposit of KRW 32.69 million, while the minimum 10 shares for equal allocation cost KRW 97,500.
Q. What happens to the stock price when a lock-up expires?
Locked-up shares become sellable. On the 15-day lock-up expiry day, the median Korean IPO fell 3.60% more than KOSDAQ (103 companies), and 8.64% more over the next five trading days. The 39 companies whose 15-day lock-ups were 5% or more of book-building demand fell 8.07% more on the expiry day.
Q. Do IPOs with high lock-up ratios do better?
On day one, yes: IPOs with lock-ups of 30% or more opened at a median 3.38 times the IPO price, vs 1.35x under 5%. But a lock-up only delays selling: 19 of those 27 companies were below their IPO price at the October 12, 2026 close.
Q. How do you find a Korean IPO’s lock-up expiry dates?
Add 15 days, 1 month, 3 months or 6 months to the listing date; if the date falls on a weekend or holiday, shares can be sold from the next trading day. Elice Group lists on October 20, 2026, so its 15-day lock-up expires on November 4, and 74.8% of its 13.70% lock-up is 15-day.
Sources
- 38 Communication, book-building results, new listings, IPO subscription calendar and company detail pages (lock-up bid quantity by period, allocation ratios, proportional subscription ratios) (link), retrieved Oct 12, 2026
- Naver Finance, daily prices (Dec 1, 2024-Oct 12, 2026), retrieved Oct 12, 2026
- Yahoo Finance, USD/KRW (KRW=X) close, Oct 12, 2026
- Financial Services Commission, Capital Markets Act amendment introducing cornerstone investors passes the National Assembly (link), Apr 23, 2026
- Financial Services Commission, stronger mandatory holding for executives of newly listed companies (link), Feb 22, 2022
- MTN, curbing IPO flipping: more lock-ups and book-building bans for violations (link), Jan 21, 2025
- Aju Business Daily, regulators announce IPO and delisting reforms (link), Jan 21, 2025
- Newsis, retail IPO allocation up to 30% with equal allocation (link), Nov 18, 2020
- Financial News, first-day price limit for new listings set at 60-400% (link), Jun 25, 2023
- Money Today, 2025 IPO market analysis: zero prices above the band, 41% lock-up share (link), Mar 4, 2026
- Korea Economic Daily, institutional IPO flipping weighs on underwriters (link), Jun 24, 2026
- Korea Economic Daily, institutional IPO lock-up ratio only 3.5% (link), Aug 23, 2026
- IB Tomato, IPO lock-up ratios rose but failed to defend prices (link), Jul 27, 2026
- Money Today, first-day pop then slide: IPO price froth persists (link), Aug 30, 2026
- Byline Network, K Bank subscription deposits about KRW 10tn, ratio 134.6:1 (link), Feb 23, 2026
- AlphaSquare, Sky Labs IPO institutional shares on listing day (link), Sep 1, 2026
- Asia Economy, Korea Securities Depository October mandatory holding releases (link), Sep 30, 2026
- MTN, interest to be paid on IPO subscription deposits (link), Jul 15, 2026
- Shinhan Securities, IPO subscription guide (link)