
EV/EBITDA Explained: Enterprise Value, Net Debt, EBITDA and How It Differs from PER (Korean Stock Examples)
EV/EBITDA is the most widely used valuation multiple after PER. PER divides the shareholders’ part (market cap) by net income; EV/EBITDA divides the price of the whole company, debt included (EV = market cap + net debt), by the cash the business earns (EBITDA = operating profit + depreciation). That puts companies that borrow, companies that hoard cash and companies with heavy equipment on the same scale. KEPCO’s market cap is KRW 18.7tn, but its EV is KRW 149.3tn. Data as of the October 8, 2026 close.
- EV (enterprise value) = market cap + net debt; EBITDA = operating profit + depreciation. EV/EBITDA is how many years of that cash the whole company is worth.
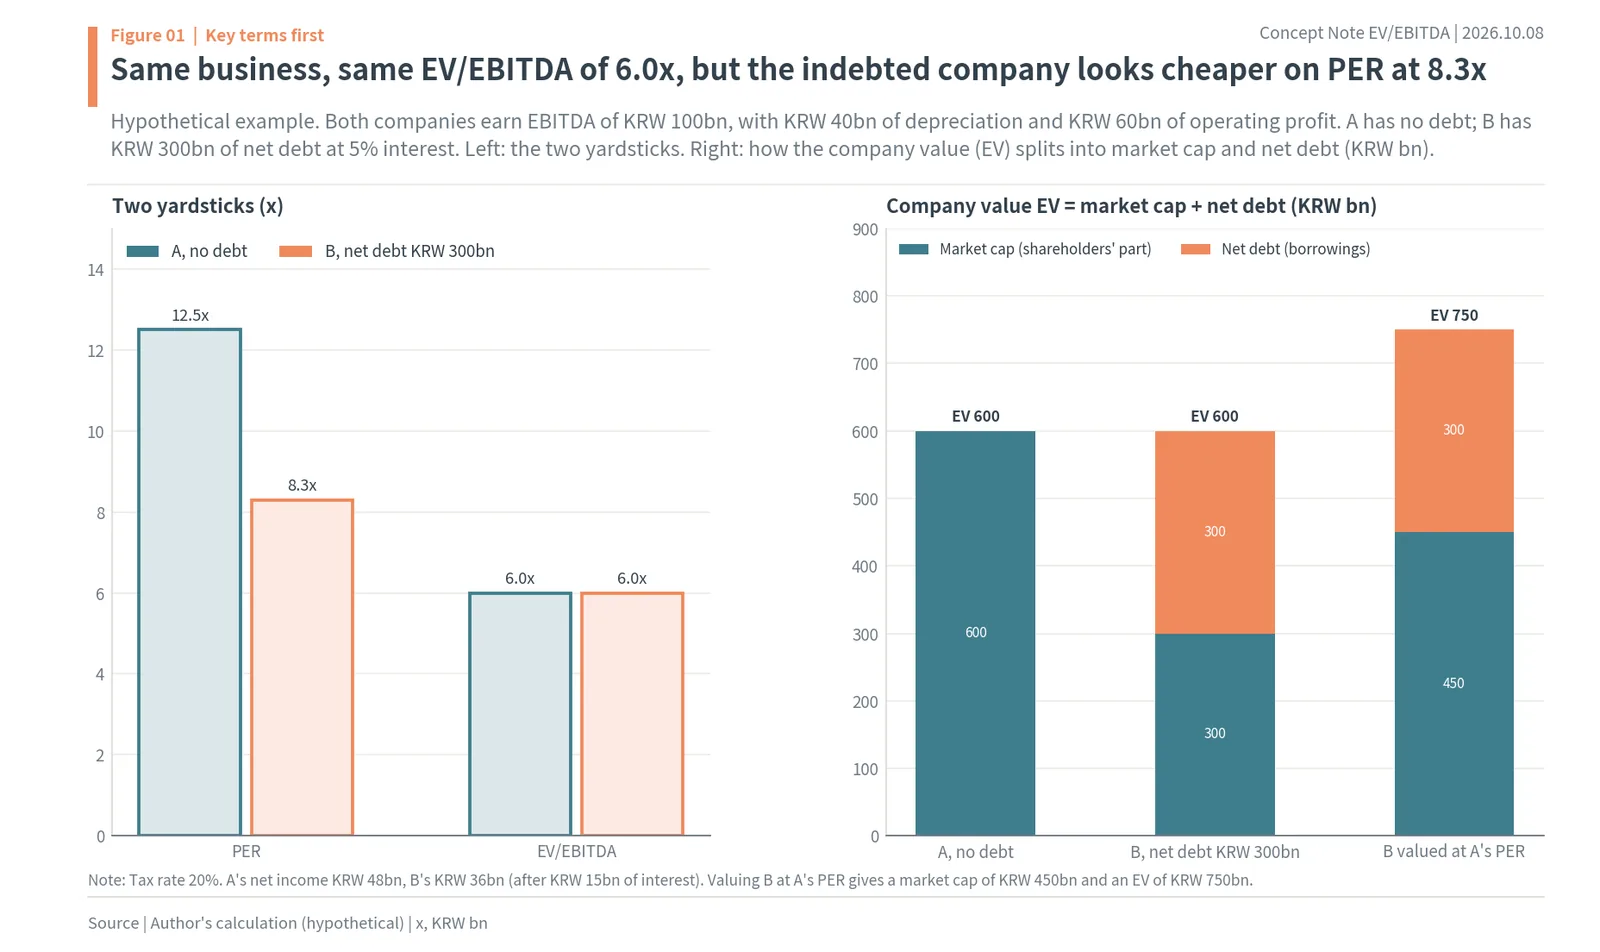
- Hypothetical: the same business (EBITDA KRW 100bn) is 6.0x EV/EBITDA either way, but PER is 12.5x with no debt and 8.3x with KRW 300bn of net debt.
- KEPCO: market cap KRW 18.7tn + net debt KRW 130.7tn = EV KRW 149.3tn (8.0x market cap), EV/EBITDA 6.9x vs PER 4.6x.
- Median of 102 large non-financial Korean companies: EV/EBITDA 10.8x and PER 21.1x; the three cheapest on PER (KCC, Korea Gas, KEPCO) rank 29th–41st on EV/EBITDA.
- Depreciation is 77.0% of SK Telecom’s EBITDA, and brokers use 3.6–3.8x as telecom target multiples.
Key takeaways
- KEPCO has a market cap of KRW 18.7tn, but adding KRW 130.7tn of net debt makes its whole-company value (EV) KRW 149.3tn, 8.0 times the market cap (author’s calculation).
- Dividing EV by EBITDA (operating profit + depreciation) puts companies that borrow and companies that hoard cash on the same scale.
- That is why KCC, Korea Gas Corp and KEPCO, the three cheapest stocks on PER, fall to 29th–41st of 102 on EV/EBITDA (author’s calculation).
Written: October 9, 2026 (prices are October 8 closes; Korean markets were closed on October 9 for Hangul Day)
Concepts covered: EV (enterprise value), net debt, EBITDA, depreciation, EV/EBITDA, how it differs from PER
Data: KRX closes and market caps on Oct 8, WISEfn EBITDA, net debt and consensus (retrieved Oct 9), broker reports and M&A news, Damodaran US sector multiples (January 2026)
None1. This post explains EV/EBITDA with numbers from the Korean stock market. None2. Someone who buys a whole company does not just pay for the shares. None3. They also take on the company’s debt, and they also get the cash in its vault. None4. So the price of the whole company is market cap plus debt minus cash, and that is called EV. None5. KEPCO carries KRW 130.7tn of net debt on top of a KRW 18.7tn market cap, for an EV of KRW 149.3tn (author’s calculation). None6. The shares are only 12.5% of the whole-company value. None7. Measured only by PER, which is based on net income, a company like this looks cheap because the debt is hidden.
8. PER prices the shareholders’ part; EV/EBITDA prices the whole company, debt included.
None9. This post covers a hypothetical example, what EV and EBITDA mean, why multiples differ by sector, the Korean market today, M&A deals and broker math, and six steps to apply it to your own stock.
1. EV, net debt and EBITDA, with a hypothetical example (vs PER)
None10. EV (enterprise value) is market cap plus net debt, and net debt is interest-bearing debt minus cash and equivalents (Hankyung economic dictionary). None11. If net debt is negative, the company has more cash than debt, so EV is smaller than market cap. None12. EBITDA is earnings before interest, taxes, depreciation and amortization; in practice it is operating profit plus depreciation. None13. Depreciation spreads the cost of equipment already bought over several years, so no cash leaves the company that year. None14. That makes EBITDA close to the cash a business earns in a year. None15. EV/EBITDA tells you how many years of that cash the whole-company value represents. None16. A company with an EV of KRW 100m that earns EBITDA of KRW 20m trades at 5x, meaning about five years to earn back the price (Korea Investment & Securities investor education). None17. In a hypothetical example, two companies run the same business: EBITDA of KRW 100bn, depreciation of KRW 40bn, operating profit of KRW 60bn. None18. A has no debt, while B has KRW 300bn of net debt at 5% interest. None19. Both businesses are worth the same KRW 600bn, so both have an EV/EBITDA of 6.0x. None20. A has a KRW 600bn market cap and KRW 48bn of net income, so its PER is 12.5x (20% tax rate, author’s calculation). None21. B pays KRW 15bn of interest, earns KRW 36bn and has a KRW 300bn market cap, so its PER is 8.3x. None22. The same business looks about a third cheaper on PER simply because B borrowed. None23. Put A’s PER of 12.5x on B and its market cap becomes KRW 450bn and its EV KRW 750bn, paying KRW 150bn more for the same business.
24. For the same business, EV/EBITDA is 6.0x for both, while PER makes the indebted one look cheaper at 8.3x.
2. How to calculate EV: KEPCO, HMM and Samsung Electronics
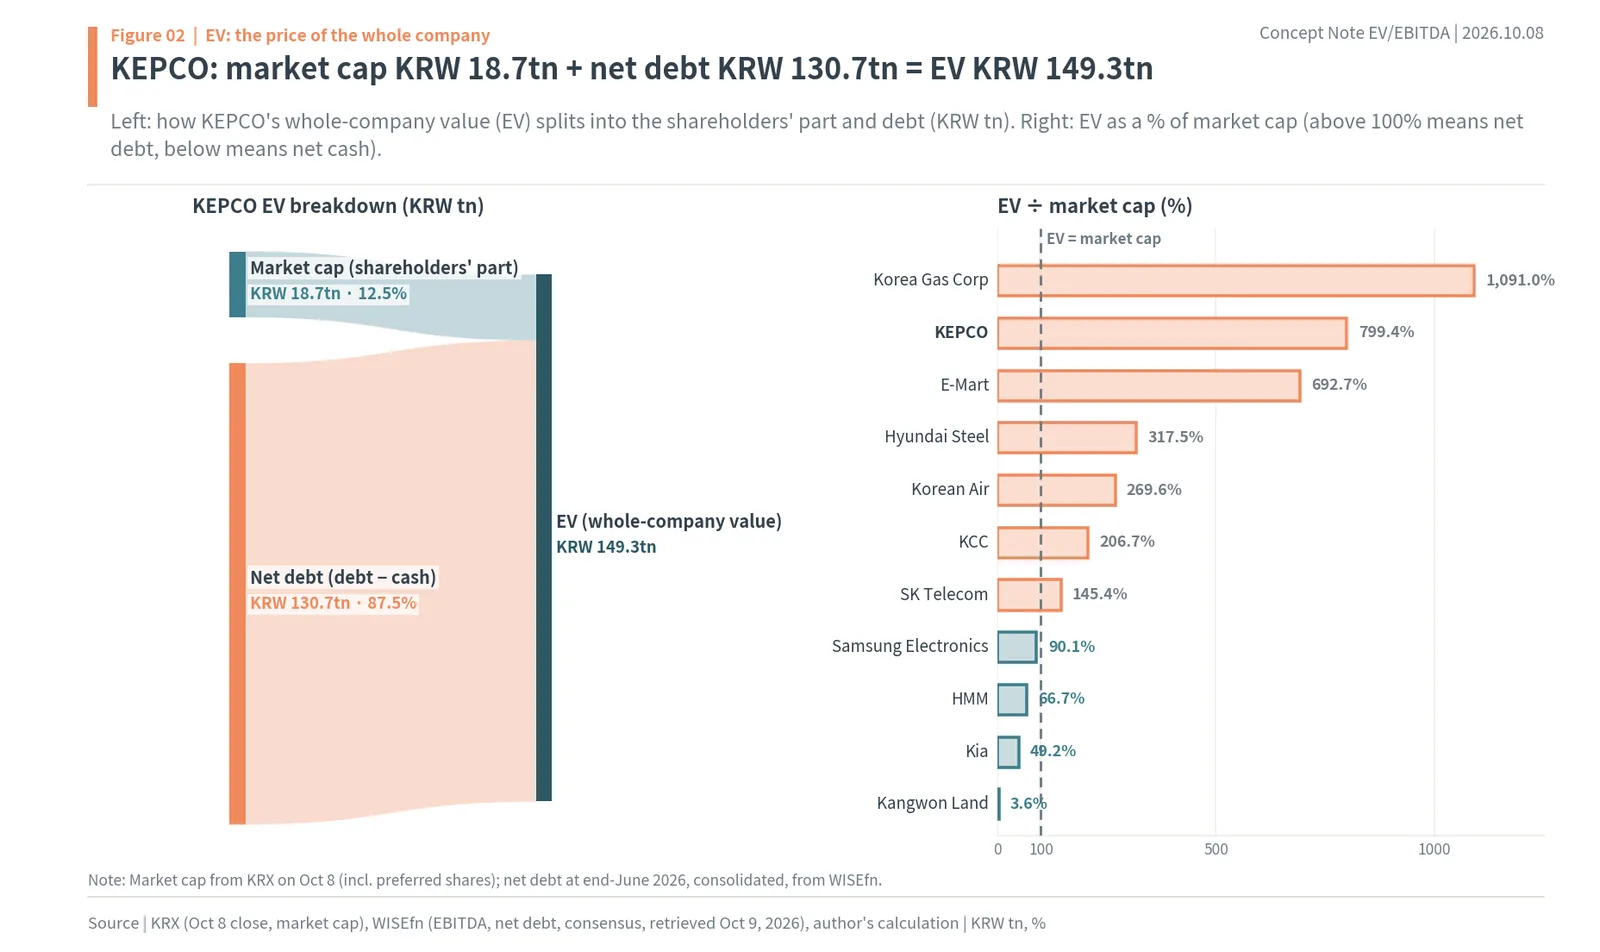
None25. KEPCO closed at KRW 29,100 on October 8, for a market cap of KRW 18.7tn (KRX). None26. Its net debt at the end of June 2026 was KRW 130.7tn, 87.5% of its KRW 149.3tn EV (WISEfn, author’s calculation). None27. That means the whole company is worth 8.0 times its market cap.
28. KEPCO: market cap KRW 18.7tn + net debt KRW 130.7tn = EV KRW 149.3tn.
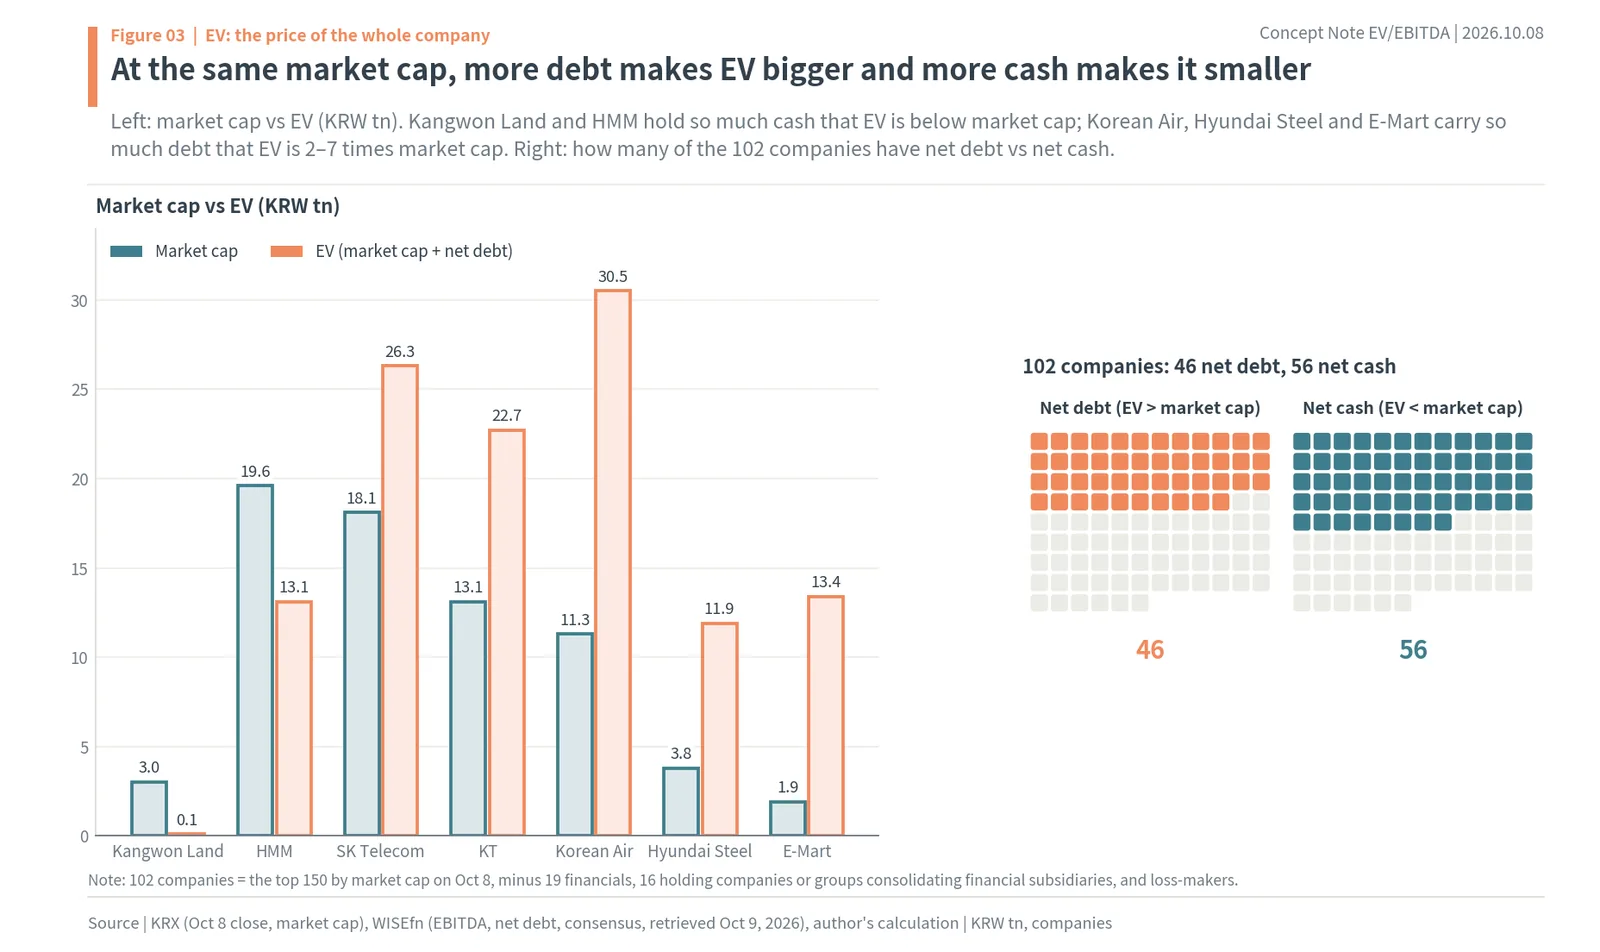
None29. The other way round, a cash-rich company has an EV smaller than its market cap. None30. Samsung Electronics has a market cap of KRW 1,687.4tn (including preferred shares); subtracting KRW 167.6tn of net cash gives an EV of KRW 1,519.8tn. None31. HMM has a KRW 19.6tn market cap and KRW 6.5tn of net cash, so its EV of KRW 13.1tn is 66.7% of market cap. None32. Kangwon Land has a KRW 3.0tn market cap and KRW 2.9tn of net cash, leaving an EV of just KRW 108.4bn. None33. Of the 102 non-financial, profitable companies among the top 150 by market cap, 46 have net debt and 56 have net cash. None34. Korea Gas Corp’s EV is 1,091.0% of its market cap, E-Mart’s 692.7% and Korean Air’s 269.6%.
35. At the same market cap, more debt makes EV bigger and more cash makes it smaller.
3. EBITDA and depreciation: telecom, airlines and steel
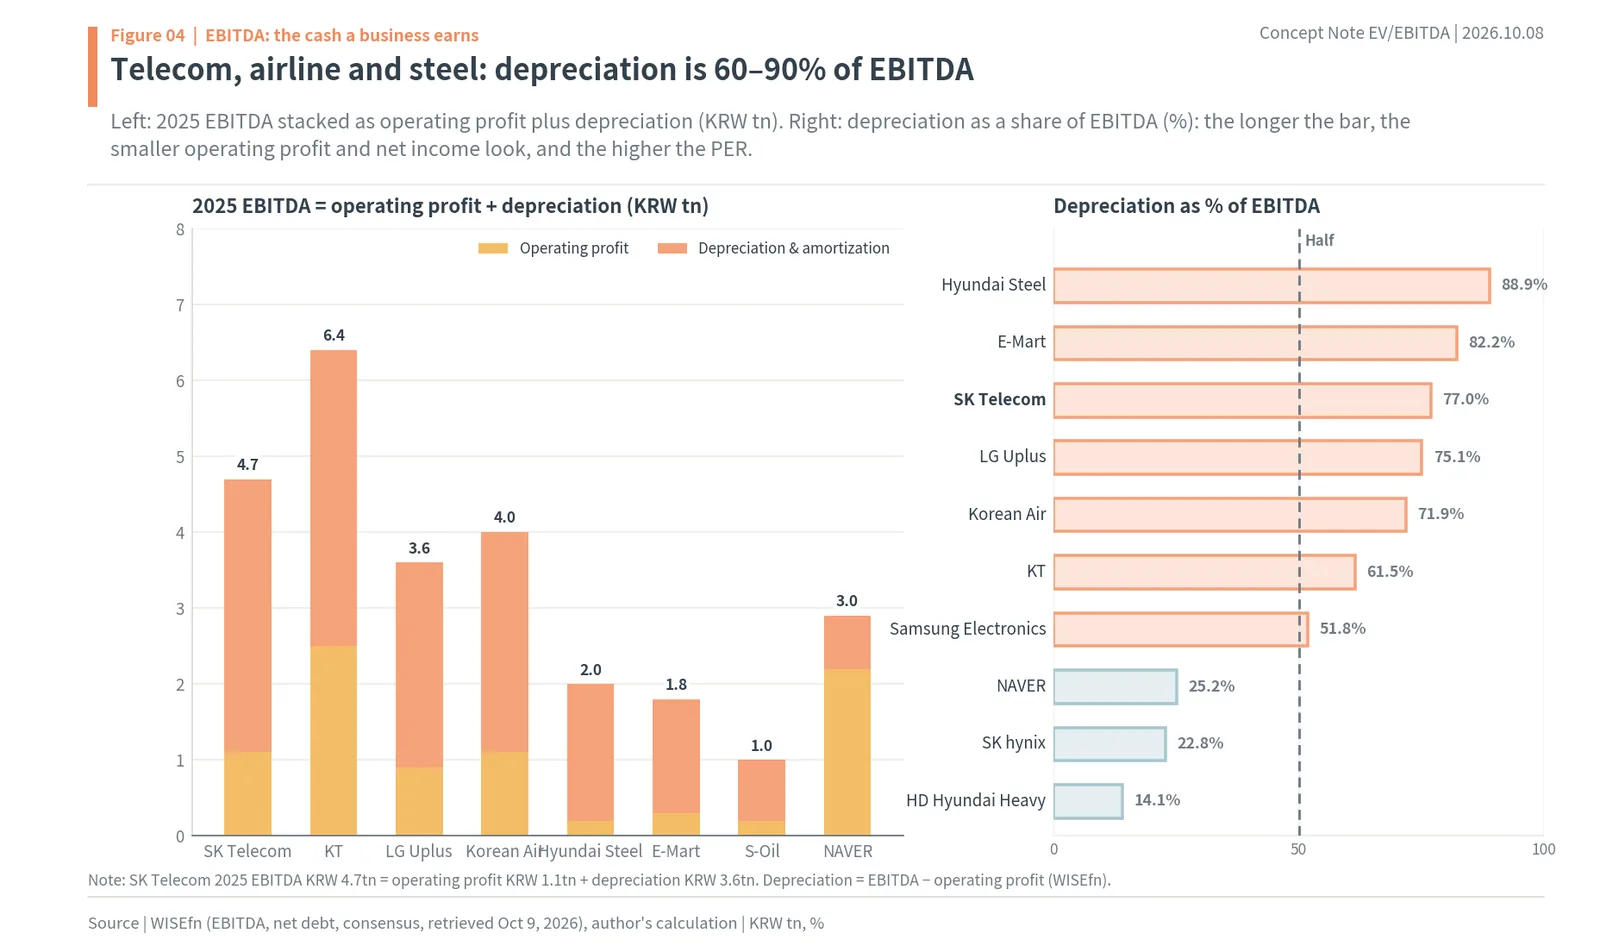
None36. SK Telecom’s 2025 EBITDA was KRW 4.66tn: KRW 1.07tn of operating profit plus KRW 3.59tn of depreciation (WISEfn). None37. Depreciation is 77.0% of its EBITDA. None38. Telecoms spend heavily up front on base stations and fiber, then expense that cost over many years. None39. Depreciation is 61.5% of EBITDA at KT, 75.1% at LG Uplus, 71.9% at Korean Air and 88.9% at Hyundai Steel. None40. At KEPCO, 2025 depreciation of KRW 13.8tn was larger than operating profit of KRW 13.5tn. None41. Companies with heavy depreciation report small operating profit and net income, so their PER looks high. None42. EBITDA adds depreciation back, so it shows the cash-earning power of companies with large installed assets.
43. In telecom, airlines and steel, depreciation is 60–90% of EBITDA, so EV/EBITDA shows their size better than PER.
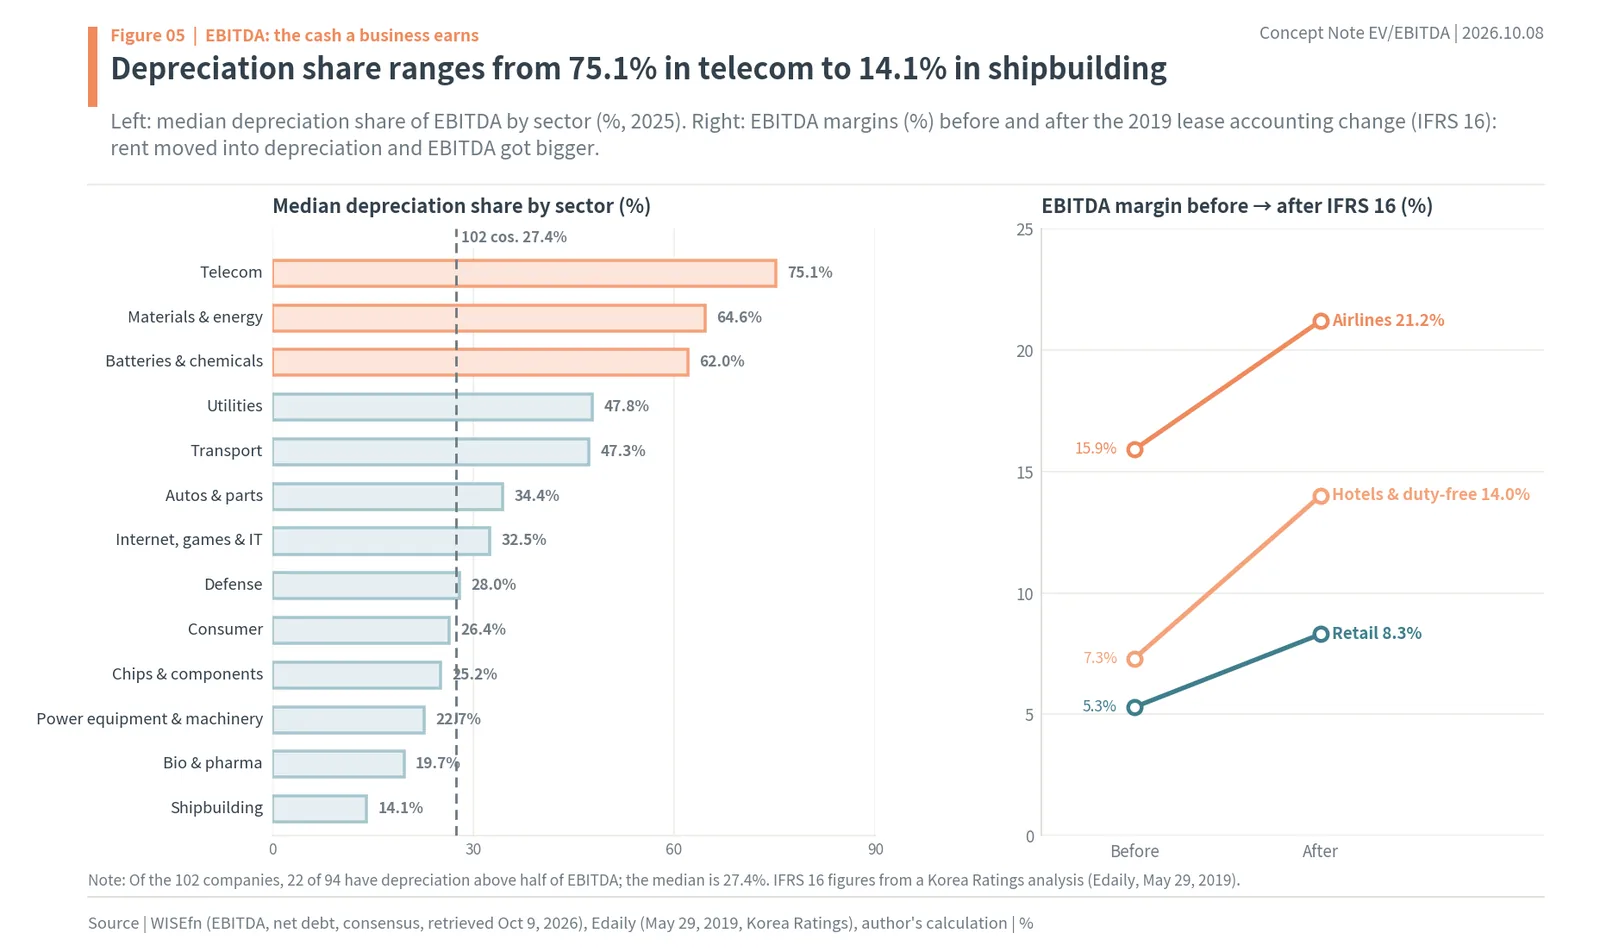
None44. Among the 102 companies, 22 of 94 have depreciation above half of EBITDA, and the median share is 27.4% (author’s calculation). None45. By sector, telecom is highest at 75.1%, then materials & energy at 64.6% and batteries & chemicals at 62.0%; shipbuilding is lowest at 14.1%. None46. When lease accounting changed in 2019 (IFRS 16), leased aircraft and store rent moved into depreciation, and EBITDA grew. None47. In a Korea Ratings analysis, EBITDA margins went from 15.9% to 21.2% for airlines, 7.3% to 14.0% for hotels and duty-free, and 5.3% to 8.3% for retail (Edaily).
48. Depreciation shares differ by sector, and EBITDA strips out those accounting differences.
4. Why fair EV/EBITDA differs by sector
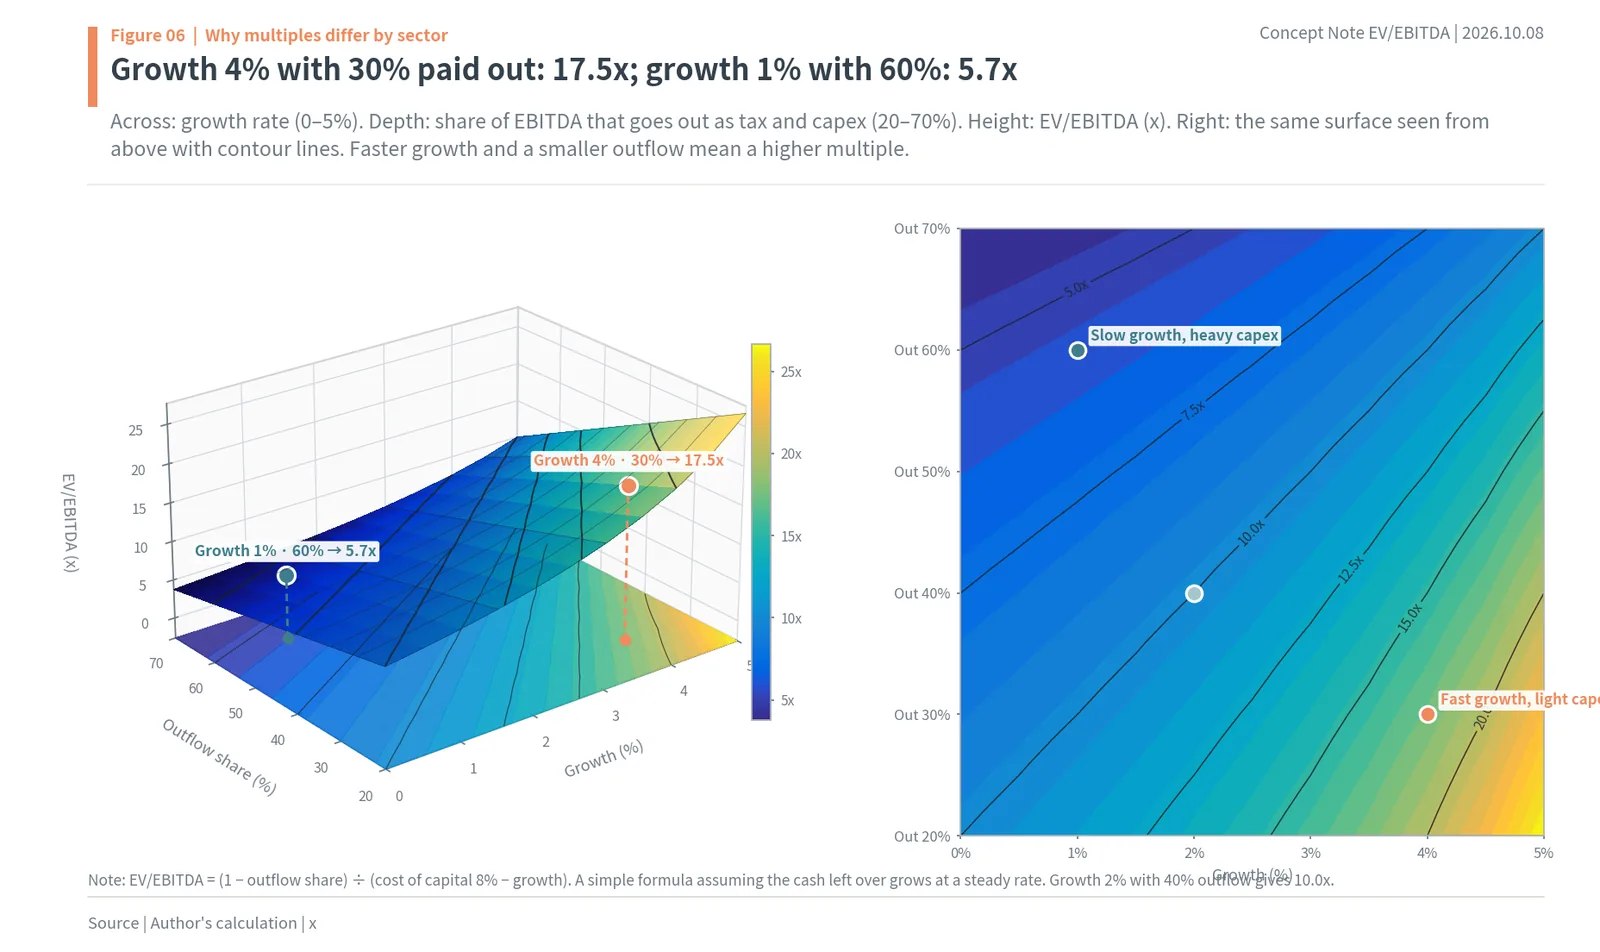
None49. The value of a company is the cash it will keep in the future, converted into today’s money. None50. Take the tax and capex that go out of EBITDA, and what is left is the cash the company keeps. None51. So EV/EBITDA can be written simply as (1 − outflow share) ÷ (cost of capital − growth rate). None52. At an 8% cost of capital, 2% growth and a 40% outflow give 10.0x (author’s calculation). None53. 4% growth with a 30% outflow gives 17.5x, while 1% growth with a 60% outflow gives 5.7x. None54. Sectors that grow fast and spend little on equipment earn a higher multiple on the same EBITDA. None55. Telecom, airlines and utilities must keep laying new equipment every year, so their outflow is large and their multiples are low.
56. The higher the growth and the smaller the outflow, the higher the EV/EBITDA.
5. Median EV/EBITDA of Korean stocks in 2026
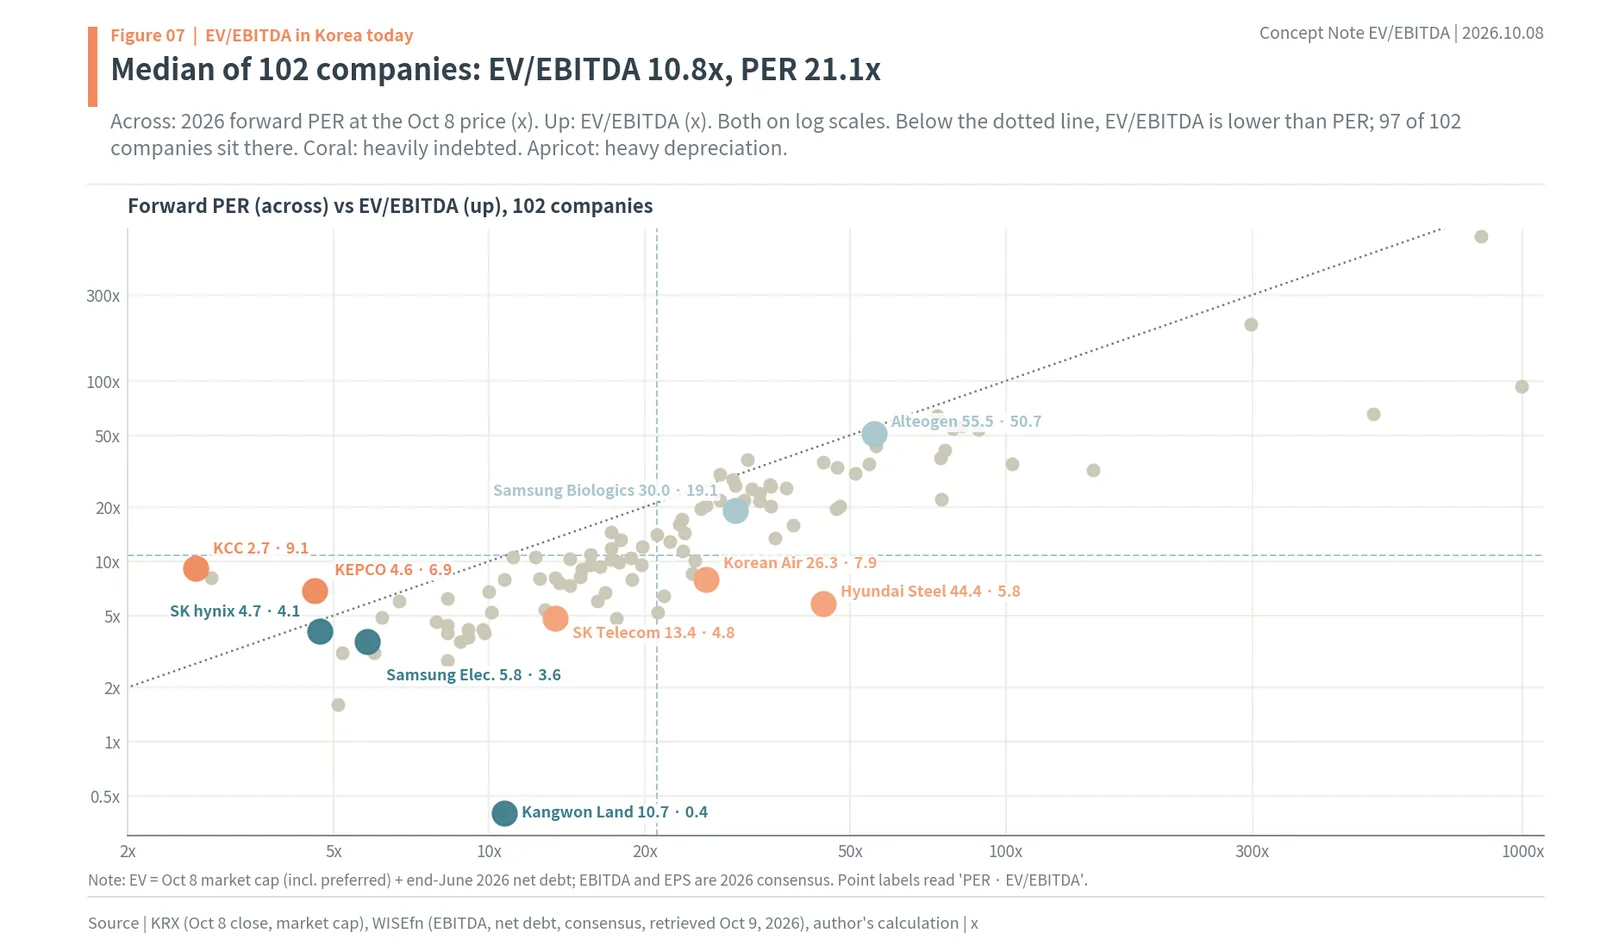
None57. From the top 150 by market cap on October 8, the author removed 19 financials, 16 holding companies or groups consolidating financial subsidiaries, and loss-makers, leaving 102. None58. EV is the Oct 8 market cap (including preferred shares) plus end-June 2026 net debt, and EBITDA is 2026 consensus (author’s calculation). None59. The median EV/EBITDA of the 102 is 10.8x, and the median forward PER is 21.1x. None60. For 97 of the 102, EV/EBITDA is lower than PER. None61. EBITDA is bigger than net income, so the same company shows a smaller number on EV/EBITDA than on PER. None62. That is why EV/EBITDA is compared with other EV/EBITDA figures, not directly with PER. None63. Samsung Electronics trades at 3.6x EV/EBITDA and 5.8x PER, and SK hynix at 4.1x and 4.7x. None64. KEPCO is a rare case where EV/EBITDA of 6.9x is higher than PER of 4.6x. None65. Its net debt is seven times its market cap, which inflates EV.
66. The 102-company median is 10.8x EV/EBITDA and 21.1x PER, and KEPCO’s 6.9x is above its 4.6x PER because of debt.
None67. By band, 18 of the 102 trade below 5x, 27 at 5–10x, 16 at 10–15x and 7 at 15–20x. None68. 14 trade at 20–30x, 11 at 30–50x and 9 above 50x. None69. Telecom, autos and memory chips cluster below 5x, while batteries, chip equipment and biotech sit above 30x.
70. Close to half, 45 of 102, trade below 10x, and 9 trade above 50x.
6. Stocks where PER rank and EV/EBITDA rank split
None71. The author ranked the 102 companies twice, from lowest PER and from lowest EV/EBITDA. None72. KCC, ranked first on PER at 2.7x, is 41st on EV/EBITDA at 9.1x. None73. Korea Gas Corp, second on PER at 2.9x, is 37th at 8.1x, and KEPCO, third at 4.6x, is 29th at 6.9x. None74. All three have net debt larger than their market cap, putting EV at 2.1, 10.9 and 8.0 times market cap. None75. Hyundai Steel, 82nd on PER at 44.4x, climbs to 22nd on EV/EBITDA at 5.8x. None76. Depreciation is 88.9% of Hyundai Steel’s EBITDA, so its net income looks small. None77. Korean Air moves from 63rd on PER (26.3x) to 32nd (7.9x), and LG Electronics from 44th (17.6x) to 16th (4.8x).
78. Heavily indebted companies drop in the EV/EBITDA ranking, and depreciation-heavy ones climb.
7. EV/EBITDA by sector and by year
None79. Sector medians are 42.8x for batteries & chemicals, 25.4x for defense, 24.9x for chips & components and 20.8x for power equipment & machinery (author’s calculation). None80. Bio & pharma is 16.8x, shipbuilding 10.6x, consumer 9.3x and utilities 8.1x. None81. Internet, games & IT is 7.9x, materials & energy 5.8x, transport 5.2x, and both autos & parts and telecom 3.8x. None82. Sectors with big growth expectations sit at the top, and sectors that must keep laying equipment sit at the bottom.
83. Sector medians range more than tenfold, from 42.8x in batteries & chemicals to 3.8x in telecom.
None84. At year-end prices (WISEfn), the median EV/EBITDA of the 102 was 8.4x in 2021 and 6.4x in 2022. None85. It rose to 9.5x in 2023, 9.4x in 2024 and 14.5x in 2025, and is 10.3x on 2026 estimated earnings. None86. The drop from 2025 to the 2026 estimate comes from a big jump in chip EBITDA. None87. Samsung Electronics goes from 7.5x in 2025 to 3.3x on 2026 estimates, and SK hynix from 7.6x to 3.7x (WISEfn).
88. The 102-company median fell from 14.5x in 2025 to 10.3x on 2026 estimated earnings.
8. Telecom EV/EBITDA and broker target multiples
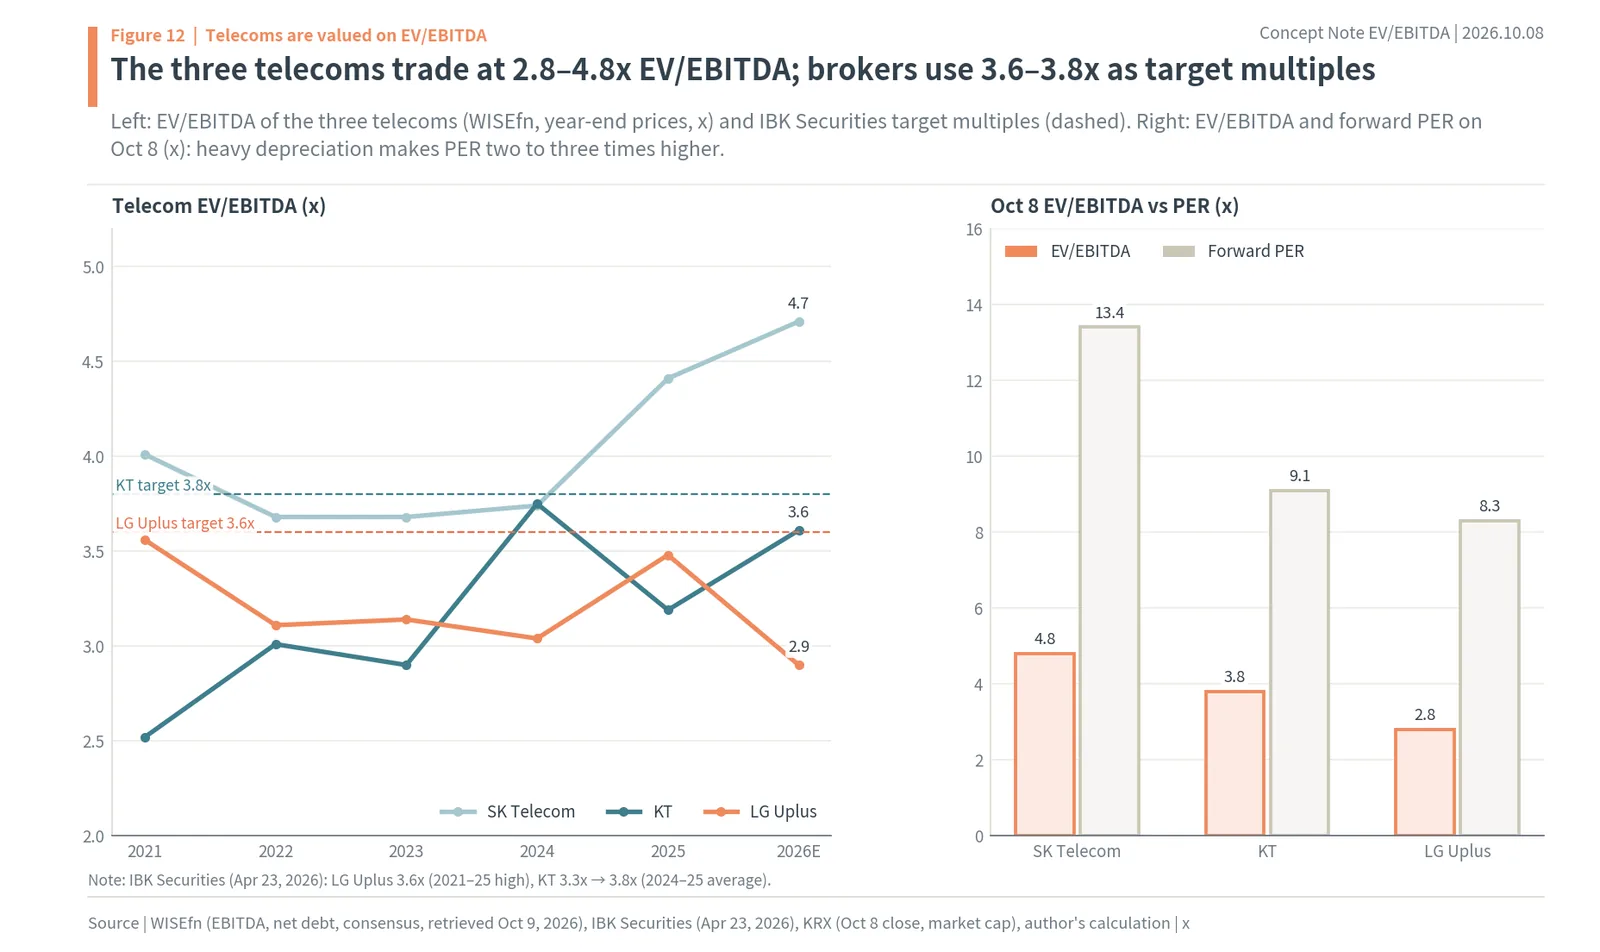
None89. Telecom cash flows are steady and depreciation is large, so brokers set telecom target prices on EV/EBITDA (IBK Securities). None90. IBK Securities applied 3.6x, LG Uplus’s 2021–2025 high, for a KRW 20,000 target (April 23, 2026). None91. The same day it raised KT’s multiple from 3.3x to 3.8x, its 2024–2025 average, for a KRW 75,000 target. None92. As of October 8, EV/EBITDA is 4.8x for SK Telecom, 3.8x for KT and 2.8x for LG Uplus (author’s calculation). None93. At WISEfn year-end prices, the three have moved between 2.5x and 4.7x since 2021. None94. Their PERs are 13.4x, 9.1x and 8.3x.
95. The three telecoms trade at 2.8–4.8x EV/EBITDA, and brokers use 3.6–3.8x as target multiples.
9. Korea vs US sector EV/EBITDA (Damodaran)
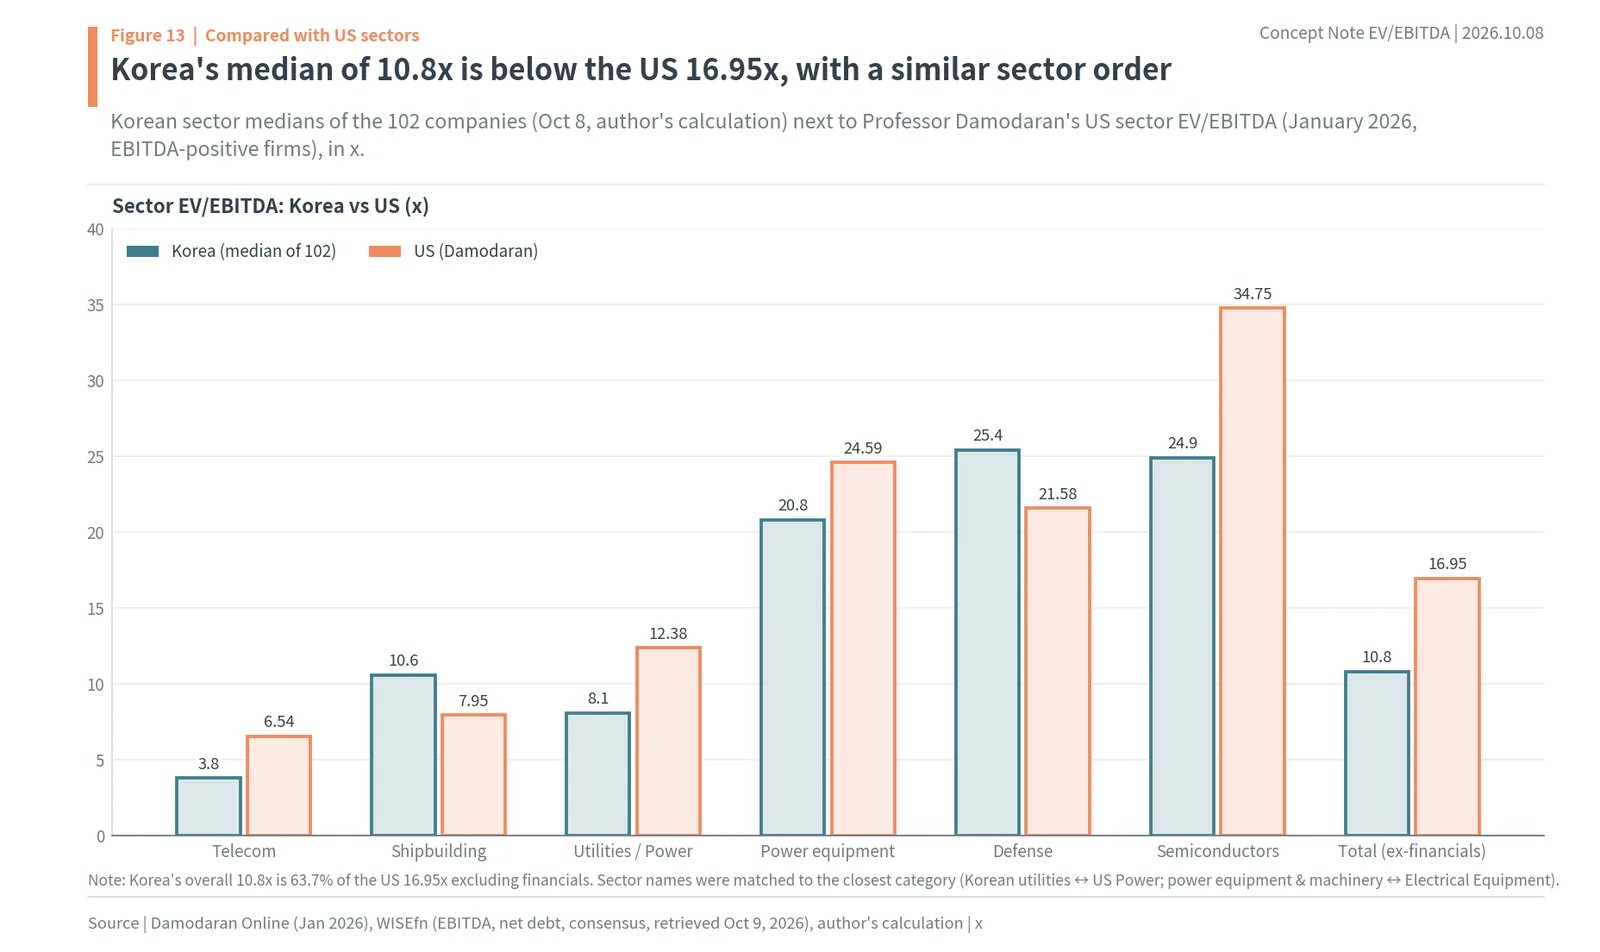
None96. Professor Damodaran’s January 2026 US sector data puts EV/EBITDA for the whole market excluding financials at 16.95x. None97. Telecom services are 6.54x, air transport 7.58x, power 12.38x and shipbuilding 7.95x. None98. Semiconductors are 34.75x, electrical equipment 24.59x and aerospace/defense 21.58x. None99. Korea’s 102-company median of 10.8x is about 64% of the US 16.95x (author’s calculation). None100. Korean telecom at 3.8x is below US 6.54x, and Korean chips & components at 24.9x is below US 34.75x. None101. Korean defense at 25.4x is above US 21.58x.
102. Korea’s 10.8x median is below the US 16.95x, with a similar sector order.
10. EV/EBITDA multiples in M&A deals
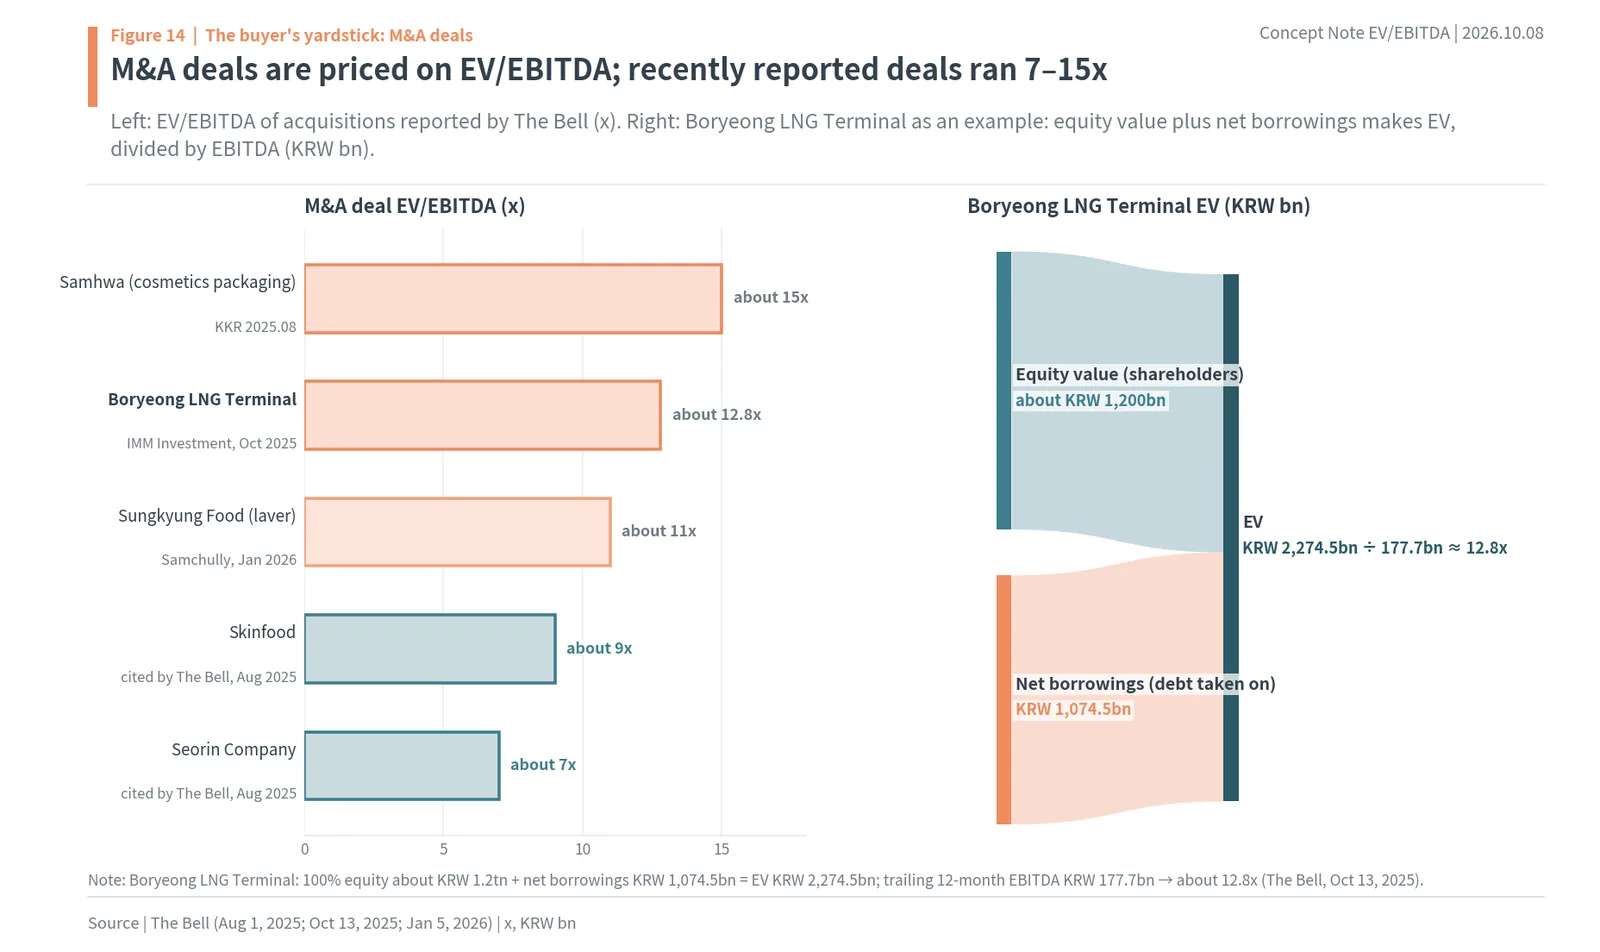
None103. Private equity funds and companies buying whole businesses price them on EV/EBITDA. None104. They take on the debt too, so equity value plus net borrowings, the EV, is what they actually pay. None105. IMM Investment valued Boryeong LNG Terminal at about KRW 1.2tn for all the equity plus KRW 1,074.5bn of net borrowings, an EV of KRW 2,274.5bn (The Bell). None106. That is about 12.8x trailing 12-month EBITDA of KRW 177.7bn. None107. KKR’s purchase of Samhwa (cosmetics packaging) was about 15x, and Samchully’s purchase of Sungkyung Food (laver) about 11x (The Bell). None108. Skinfood, cited in the same coverage, was about 9x, and Seorin Company about 7x.
109. M&A deals are priced on EV/EBITDA, and recently reported deals ran 7–15x.
11. How to calculate a target price with EV/EBITDA (Korean Air)
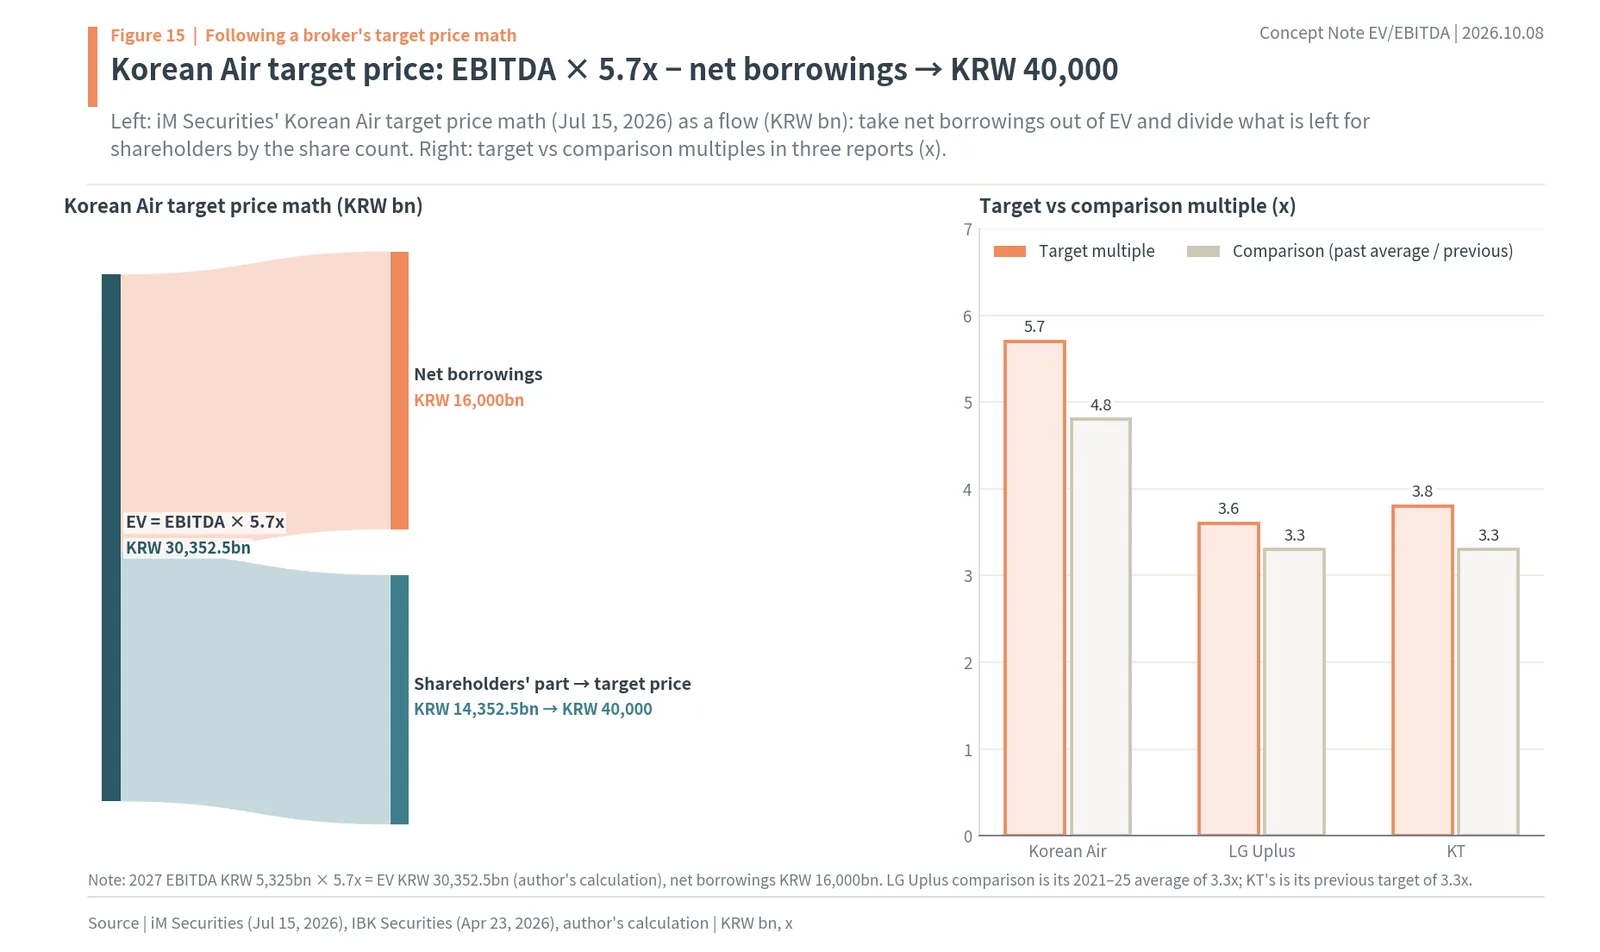
None110. iM Securities set its Korean Air target price on EV/EBITDA (July 15, 2026). None111. It multiplied 2027 EBITDA of KRW 5,325bn by 5.7x for a whole-company value of KRW 30,352.5bn (author’s calculation). None112. Subtracting KRW 16tn of net borrowings leaves KRW 14,352.5bn for shareholders. None113. Dividing that by the share count gave a KRW 40,000 target price. None114. The 5.7x multiple is above Korean Air’s three-year average of 4.8x. None115. Because the math is “EBITDA × multiple − net debt = equity value”, the more debt a company has, the harder the multiple hits the share price.
116. Broker math is EBITDA × multiple − net debt ÷ shares; for Korean Air, 5.7x gave KRW 40,000.
12. EBITDA and capex
None117. EBITDA adds back depreciation, so it does not subtract the money needed for new equipment. None118. That is why EBITDA should be read together with how much of it goes to capital expenditure (capex). None119. On 2026 estimates, Korean Air spends 90.2% of EBITDA on capex, KEPCO 79.9% and HMM 68.9% (WISEfn, author’s calculation). None120. KT spends 49.3%, LG Uplus 47.6% and SK Telecom 39.3%. None121. Samsung Electronics spends 17.9% and SK hynix 16.5%, keeping most of their EBITDA. None122. KEPCO’s EBITDA of KRW 21.8tn minus capex of KRW 17.4tn leaves KRW 4.4tn.
123. The more of EBITDA that capex takes, the less cash is left from the same EBITDA.
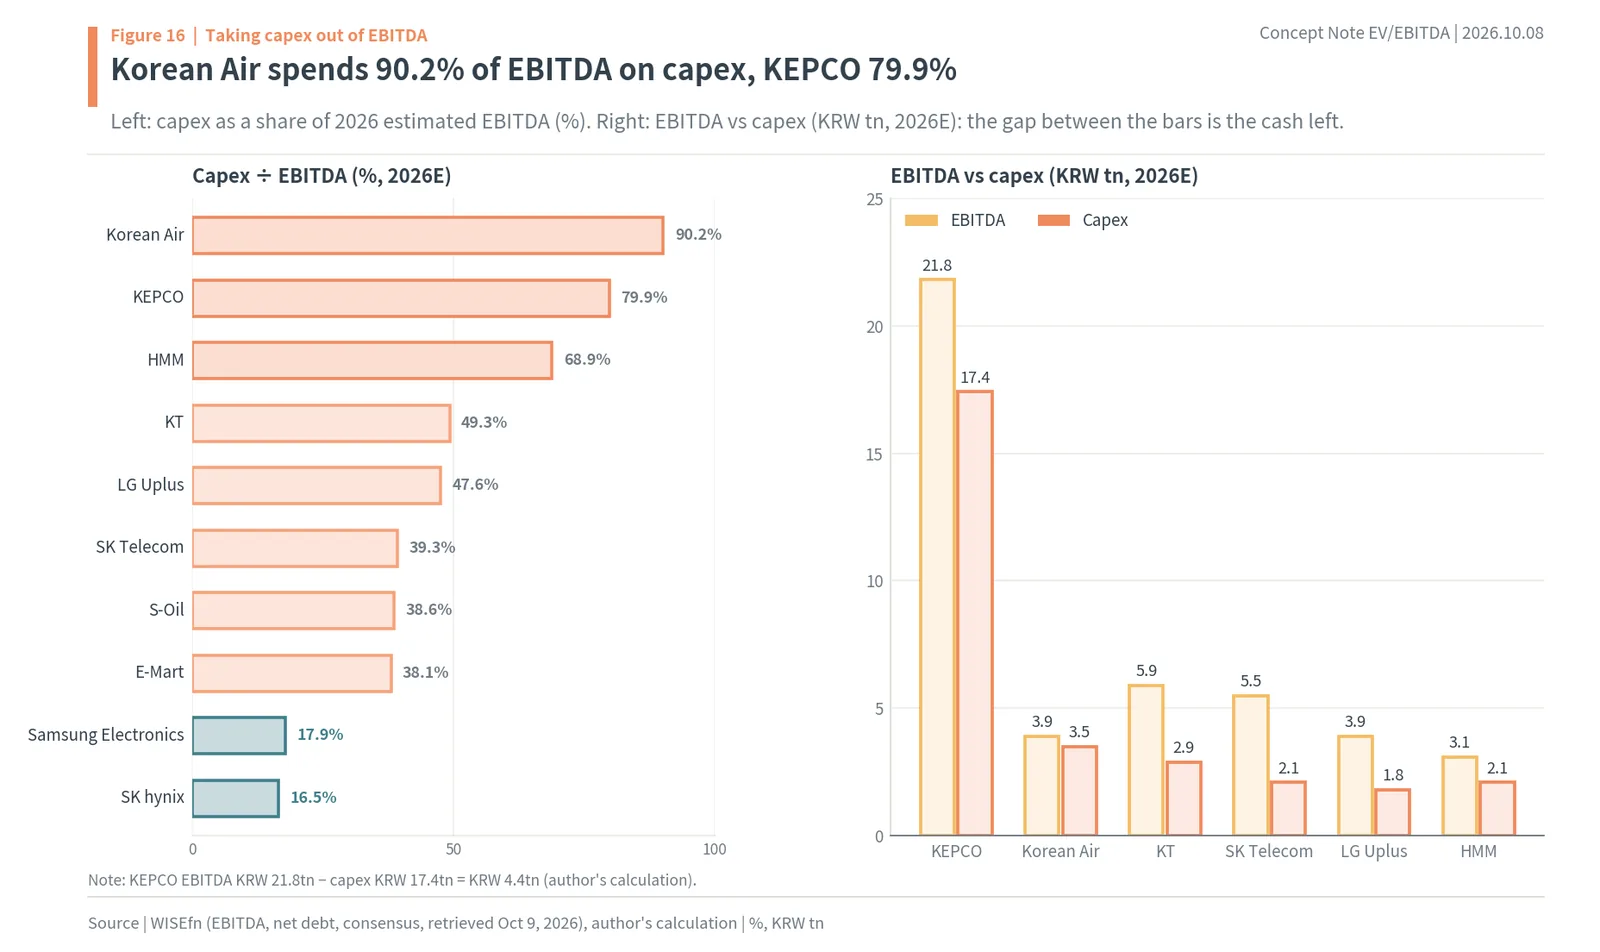
13. Why debt makes the multiple hit the share price harder
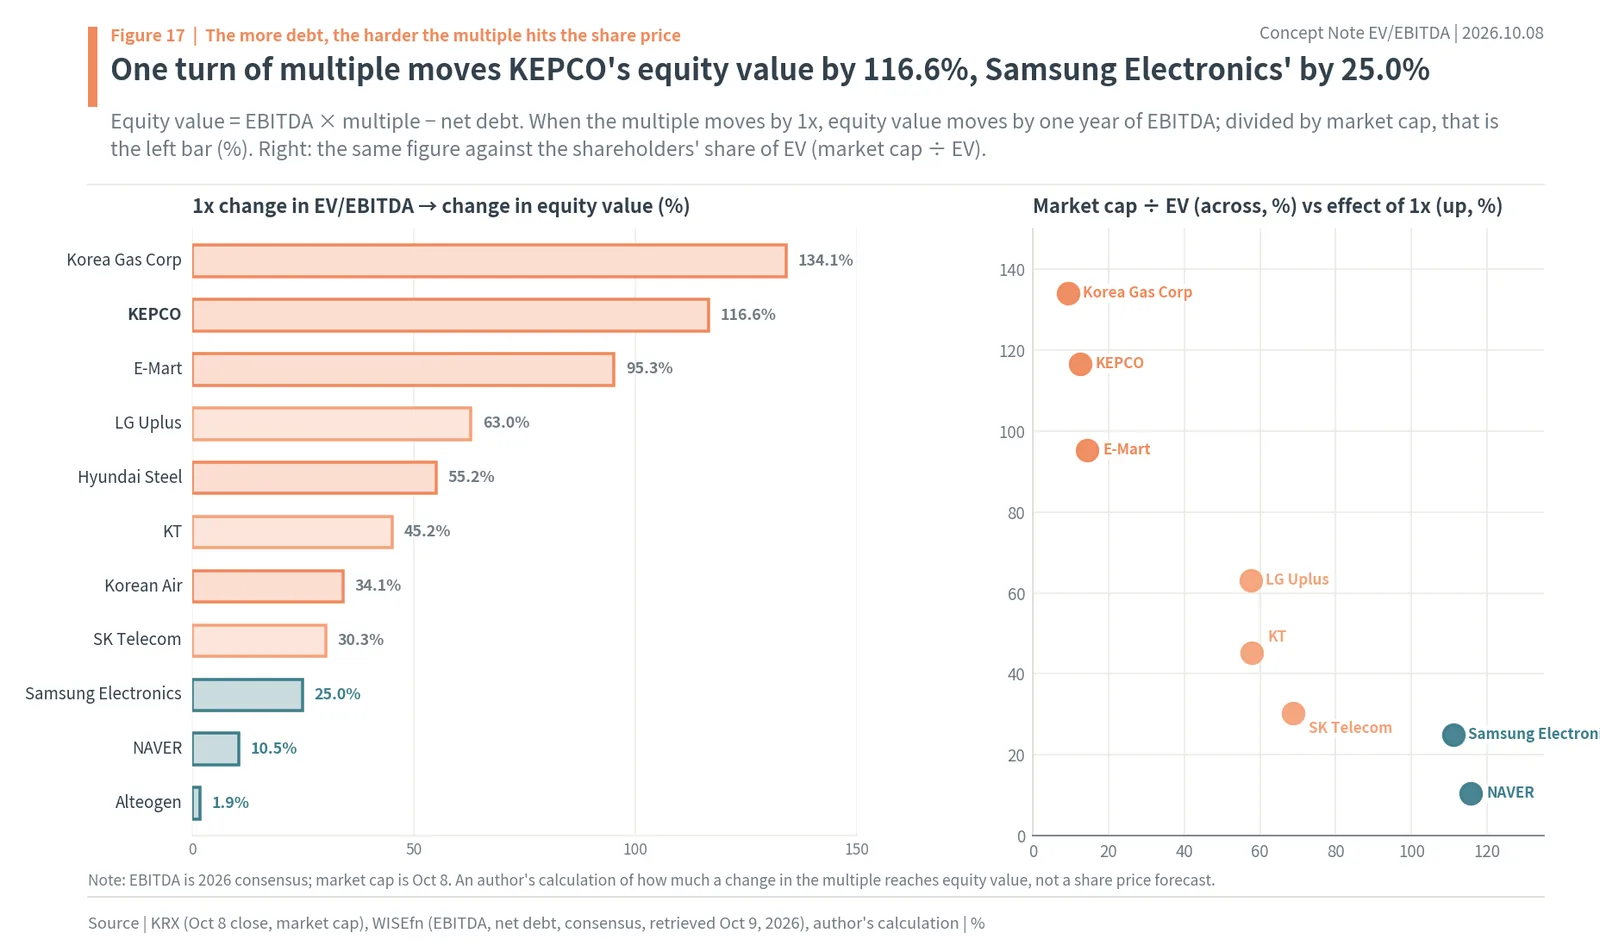
None124. Equity value = EBITDA × multiple − net debt, so a 1x change in the multiple changes equity value by one year of EBITDA. None125. Divide that by market cap to see how much 1x moves the share price (author’s calculation). None126. It is 134.1% for Korea Gas Corp, 116.6% for KEPCO and 95.3% for E-Mart. None127. It is 63.0% for LG Uplus, 55.2% for Hyundai Steel, 45.2% for KT and 34.1% for Korean Air. None128. It is 25.0% for Samsung Electronics, 10.5% for NAVER and 1.9% for Alteogen. None129. The smaller the shareholders’ slice of EV because of debt, the more the same change in the multiple moves the share price.
130. One turn of multiple moves KEPCO’s equity value by 116.6%, Samsung Electronics’ by 25.0%.
14. Six steps to calculate EV/EBITDA for your stock (KEPCO example)
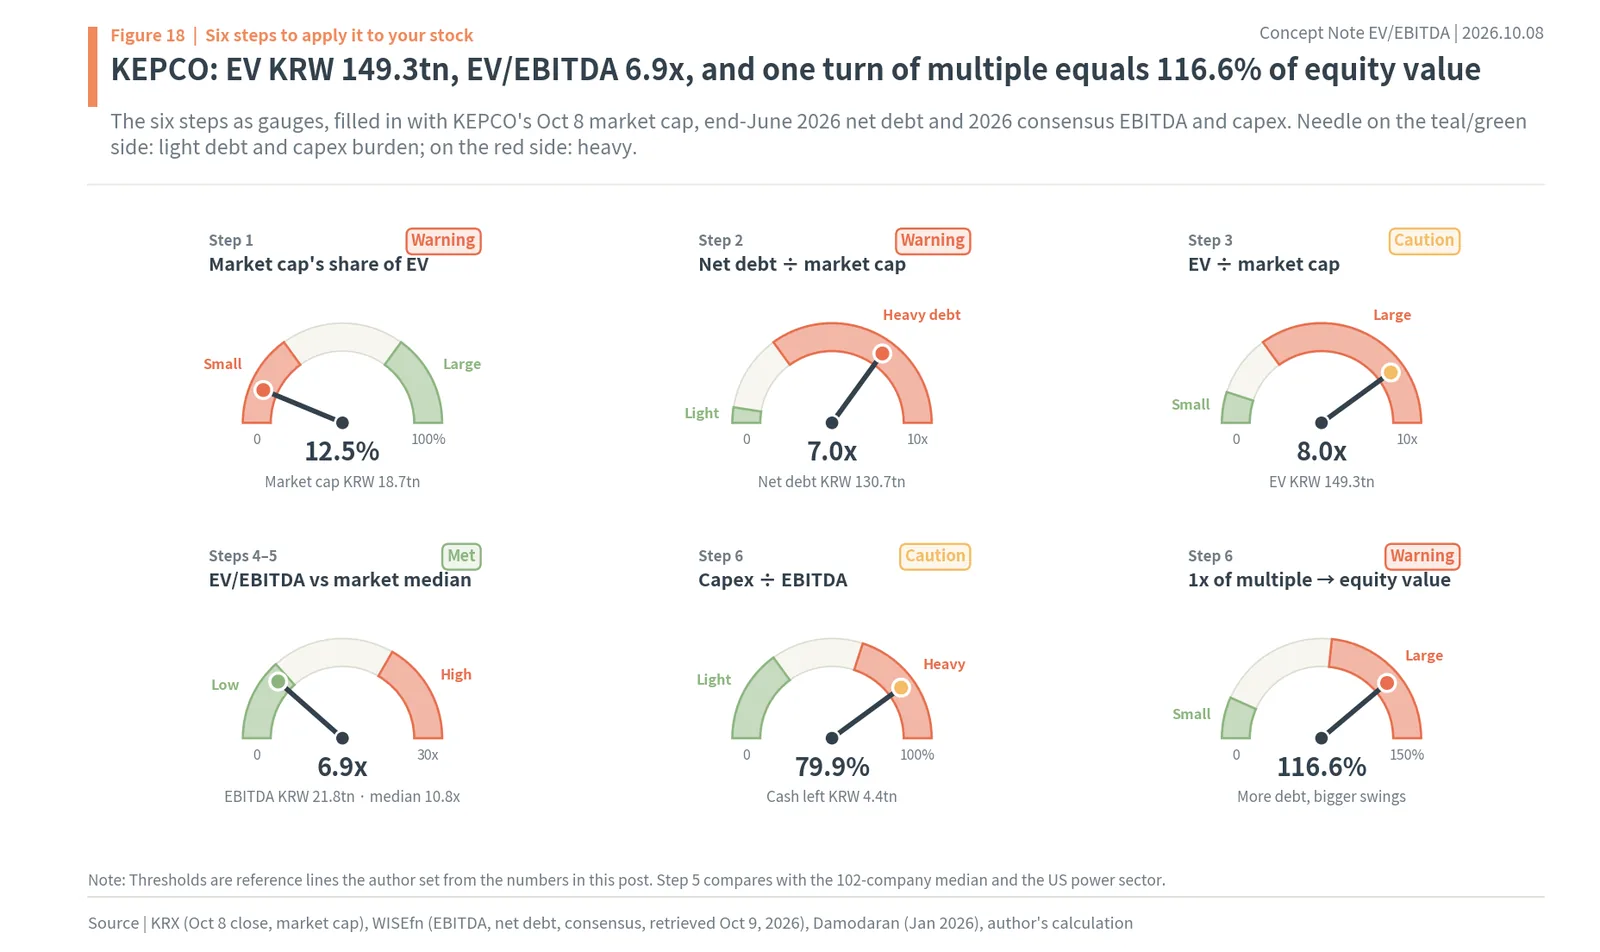
None131. Step 1 is market cap: share price × shares, plus the preferred shares’ market cap. None132. Step 2 is net debt: interest-bearing debt minus cash in the latest quarter. None133. Step 3 is EV: market cap + net debt, and how many times market cap it is. None134. Step 4 is EBITDA: operating profit + depreciation, using this year’s estimate. None135. Step 5 is EV ÷ EBITDA, compared with the same sector, the company’s own history and the market median. None136. Step 6 is the cash left after capex and how much a 1x change in the multiple moves the share price. None137. For KEPCO, step 1 gives a market cap of KRW 18.7tn and step 2 net debt of KRW 130.7tn. None138. Step 3 gives an EV of KRW 149.3tn, 8.0 times market cap, and step 4 a 2026 estimated EBITDA of KRW 21.8tn. None139. Step 5 gives 6.9x EV/EBITDA, below the 102-company median of 10.8x and the US power sector’s 12.38x. None140. Step 6 leaves KRW 4.4tn after capex, and one turn of multiple equals 116.6% of equity value (author’s calculation).
141. KEPCO: EV KRW 149.3tn, EV/EBITDA 6.9x, and one turn of multiple equals 116.6% of equity value.
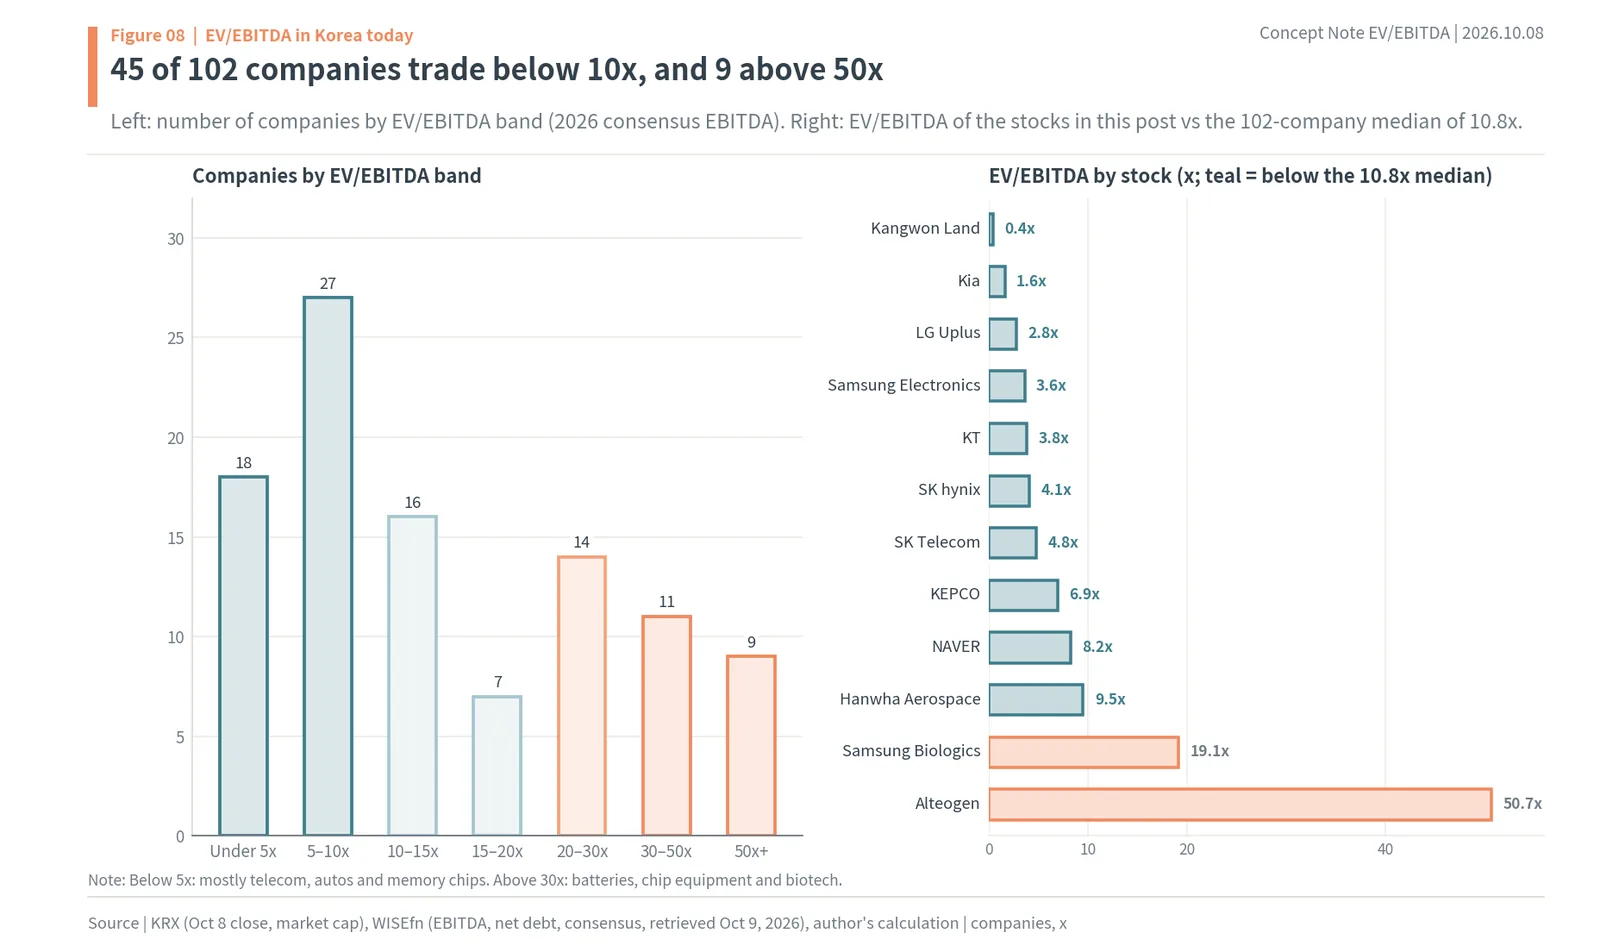
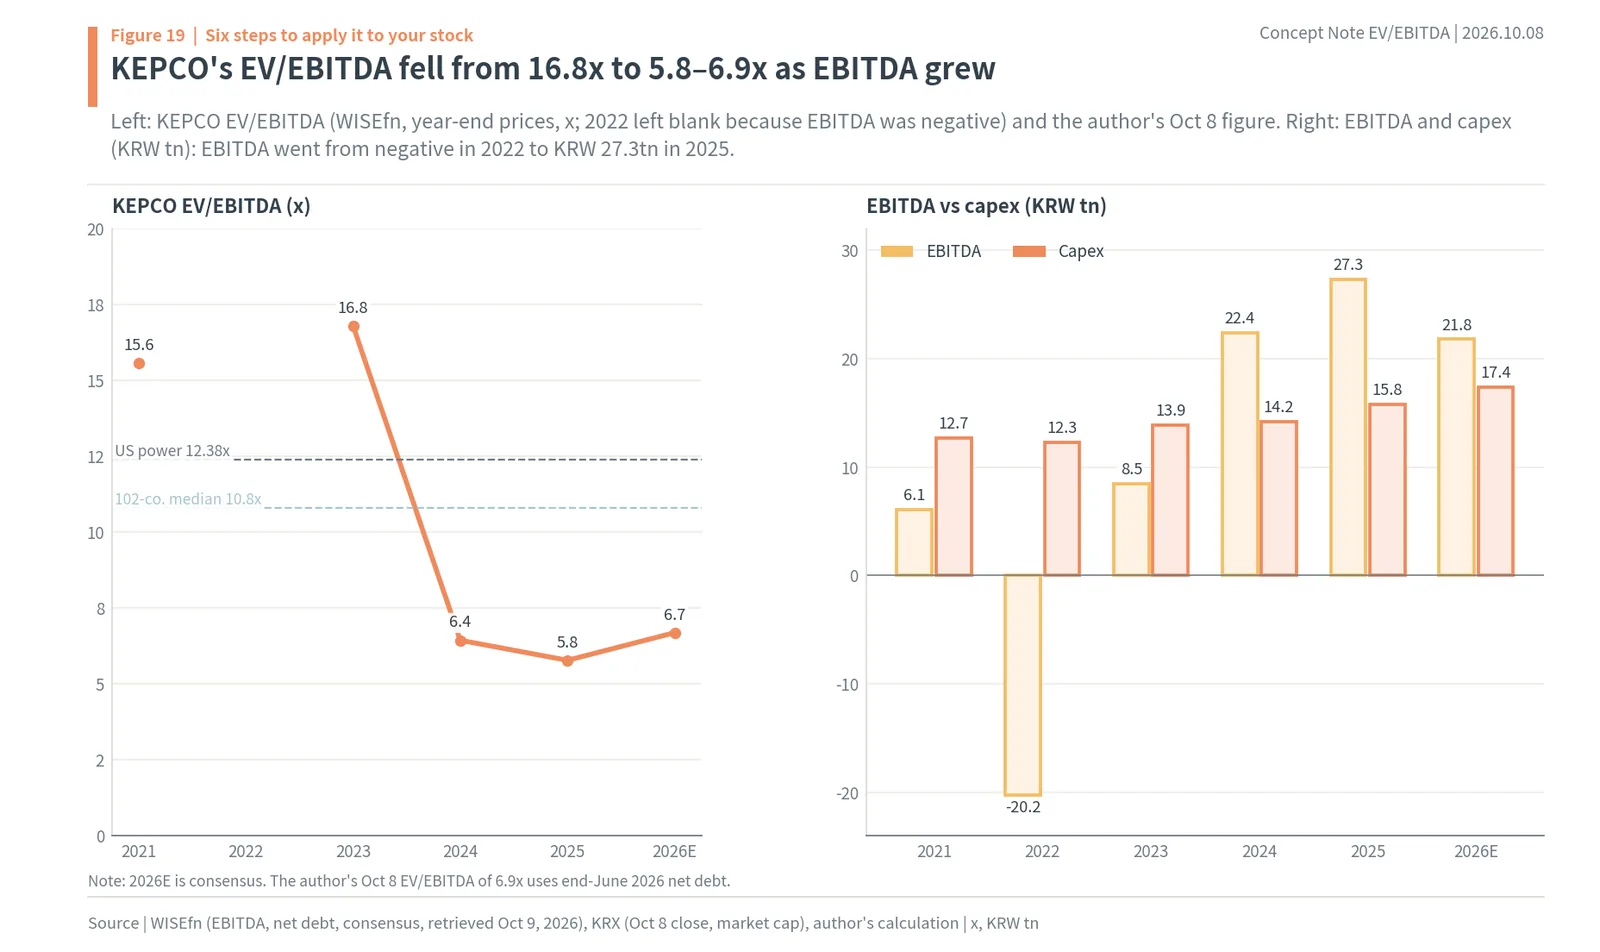
None142. At year-end prices, KEPCO’s EV/EBITDA was 15.6x in 2021 and 16.8x in 2023 (WISEfn). None143. It fell to 6.4x in 2024 and 5.8x in 2025, because EBITDA went from negative to KRW 27.3tn in 2025. None144. 2026 estimated EBITDA is KRW 21.8tn and estimated capex KRW 17.4tn. None145. This is an explainer and does not make a buy or sell call on any stock.
146. KEPCO’s EV/EBITDA fell from 16.8x to 5.8–6.9x as EBITDA grew.
Maochaedung’s take
PER prices the shareholders’ part; EV/EBITDA prices the whole company. A buyer of a whole company takes on its debt and gets its cash, so the company’s value is market cap plus net debt, the EV. Dividing it by EBITDA, which adds depreciation back, puts companies that borrow, companies that hoard cash and companies with heavy equipment on the same scale. That is why KCC, Korea Gas Corp and KEPCO, the cheapest on PER, fall to 29th–41st on EV/EBITDA, while depreciation-heavy Hyundai Steel and Korean Air climb. The author’s view: the more debt or equipment a stock carries, the more you should read EV/EBITDA and net debt next to its PER.
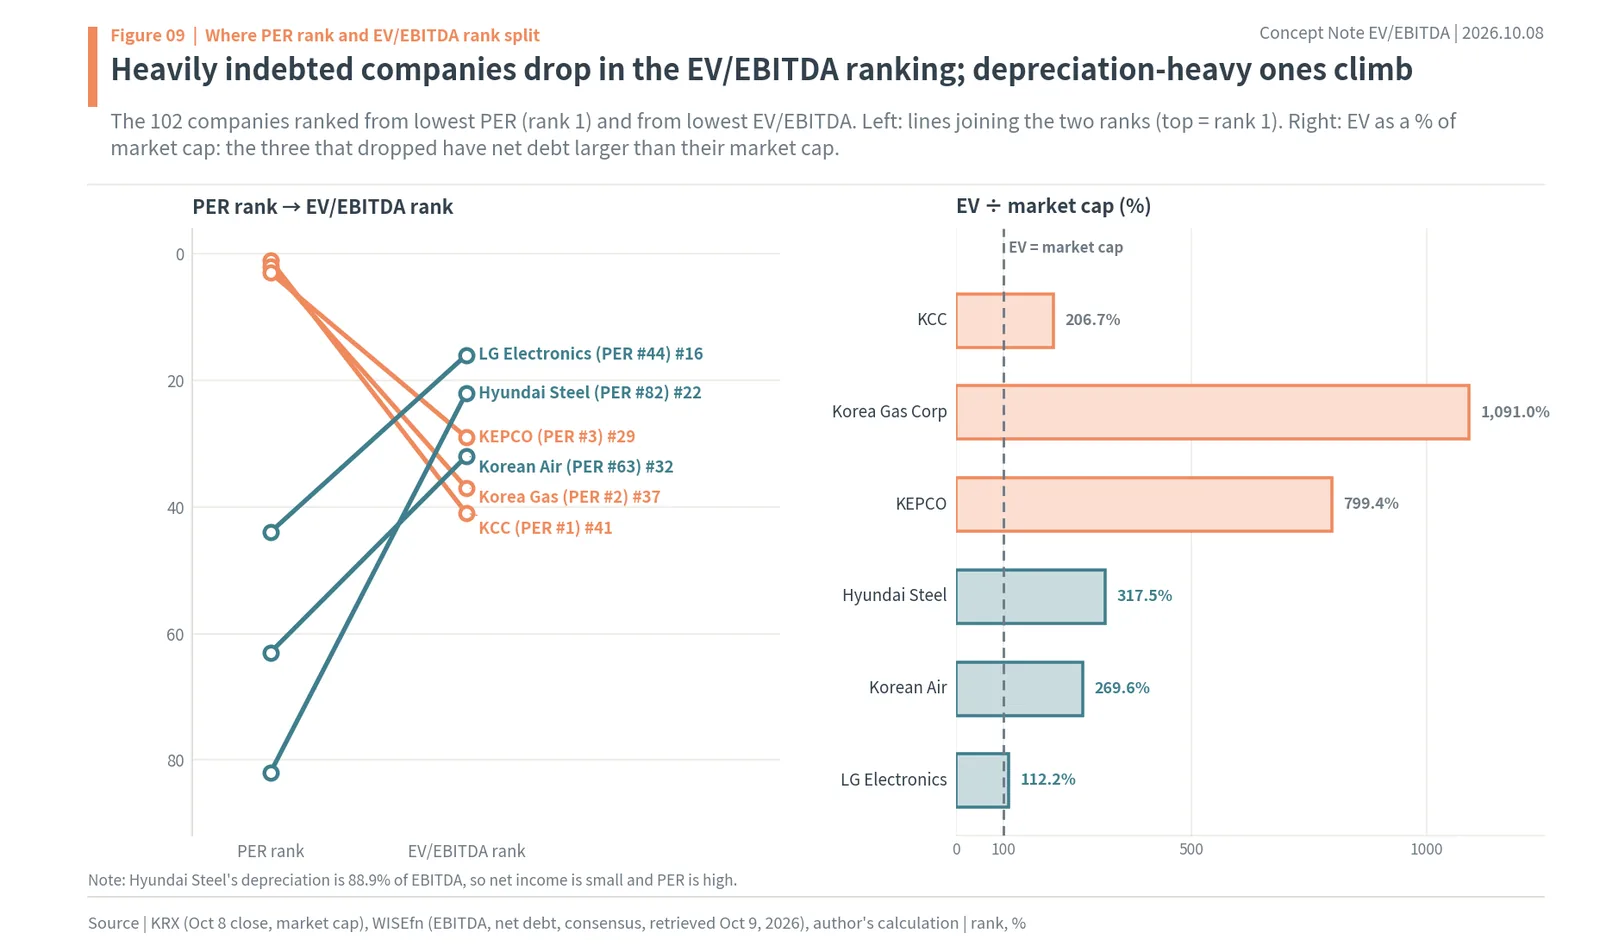
EV/EBITDA FAQ
Q. How do you calculate EV/EBITDA?
EV (enterprise value) = market cap + net debt (interest-bearing debt − cash), and EBITDA = operating profit + depreciation. Divide EV by EBITDA. KEPCO’s EV is KRW 149.3tn and its 2026 estimated EBITDA KRW 21.8tn, so 6.9x.
Q. What is the difference between EV/EBITDA and PER?
PER divides the shareholders’ part (market cap) by net income; EV/EBITDA divides the whole-company value, debt included, by earnings before depreciation. For the same business, borrowing makes PER look lower but leaves EV/EBITDA unchanged (hypothetical: 12.5x vs 8.3x PER, 6.0x EV/EBITDA for both).
Q. What is a good EV/EBITDA?
It depends on the sector. On October 8, 2026 the median of 102 large non-financial Korean companies was 10.8x; sector medians were 42.8x for batteries & chemicals, 24.9x for chips & components and 3.8x for telecom. Higher growth and a smaller capex outflow mean a higher multiple.
Q. Why are telecom stocks valued on EV/EBITDA?
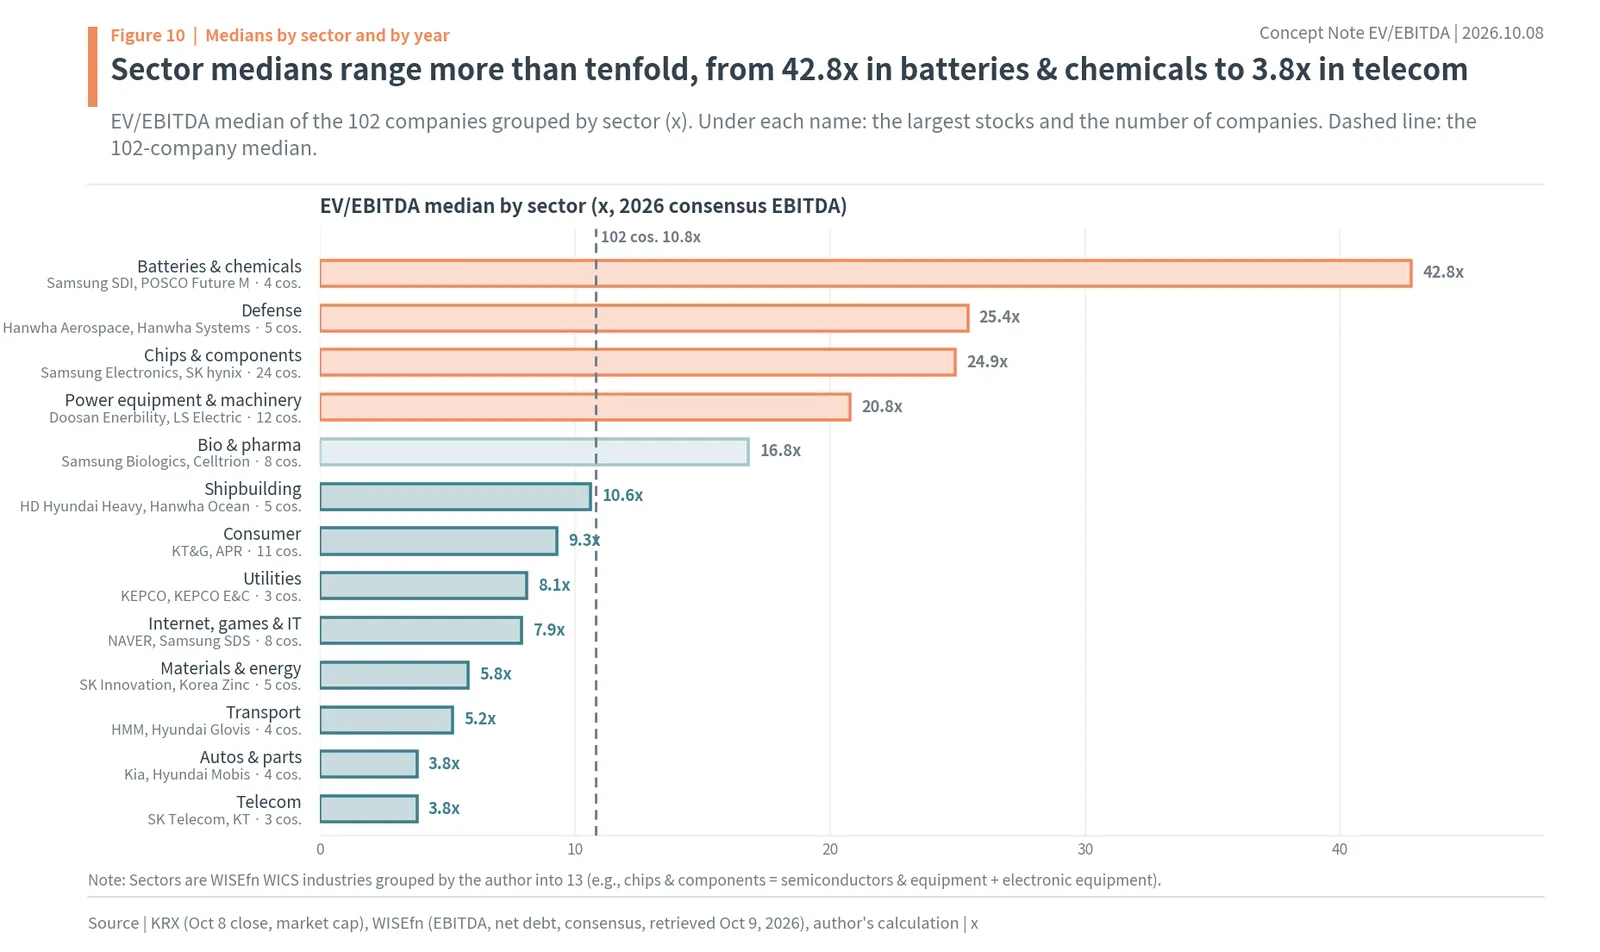
Depreciation is so large that net income looks small. Depreciation is 77.0% of SK Telecom’s 2025 EBITDA, and IBK Securities used 3.6x for LG Uplus and 3.8x for KT as target multiples.
Q. How do brokers set a target price with EV/EBITDA?
They multiply EBITDA by a target multiple to get EV, subtract net borrowings and divide the equity value by the share count. iM Securities multiplied Korean Air’s 2027 EBITDA of KRW 5,325bn by 5.7x and subtracted KRW 16tn of net borrowings for a KRW 40,000 target.
Sources
- Korea Exchange (KRX), closing prices and market caps of all listed stocks, Oct 8, 2026
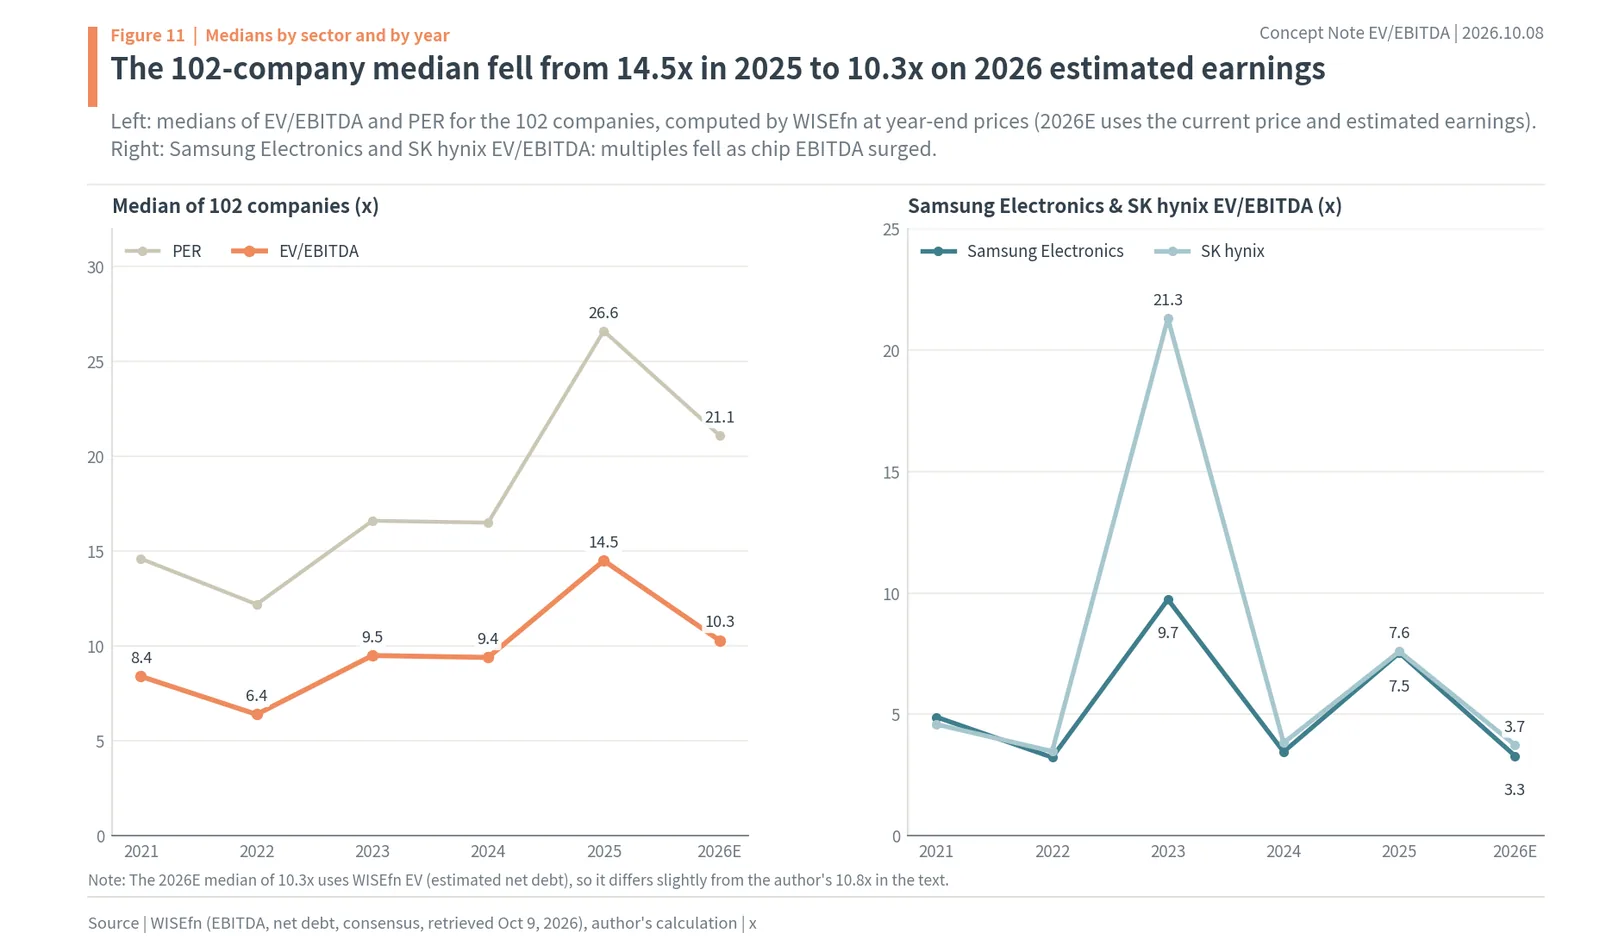
- WISEfn (Naver company data), valuation ratios (EBITDA, net debt, EV/EBITDA, PER, 2021–2026E) and capex, retrieved Oct 9, 2026
- Hankyung economic dictionary, EV/EBITDA (link)
- Korea Investment & Securities investor education, EV/EBITDA (link)
- Edaily, lease accounting change and credit ratings (link), May 29, 2019
- The Bell, KKR’s Samhwa acquisition at 15x (link), Aug 1, 2025
- The Bell, IMM Investment’s 13x bid for Boryeong LNG Terminal (link), Oct 13, 2025
- The Bell, Sungkyung Food at 11x (link), Jan 5, 2026
- iM Securities, Korean Air report (link), Jul 15, 2026
- IBK Securities, LG Uplus report (link), Apr 23, 2026
- IBK Securities, KT report (link), Apr 23, 2026
- Damodaran Online, Enterprise Value Multiples by Sector (US) (link), Jan 2026