Korea’s Margin Call Fallout: 94% of Margin Calls Ended in Forced Sales, and Samsung Now Sets the Next Wave
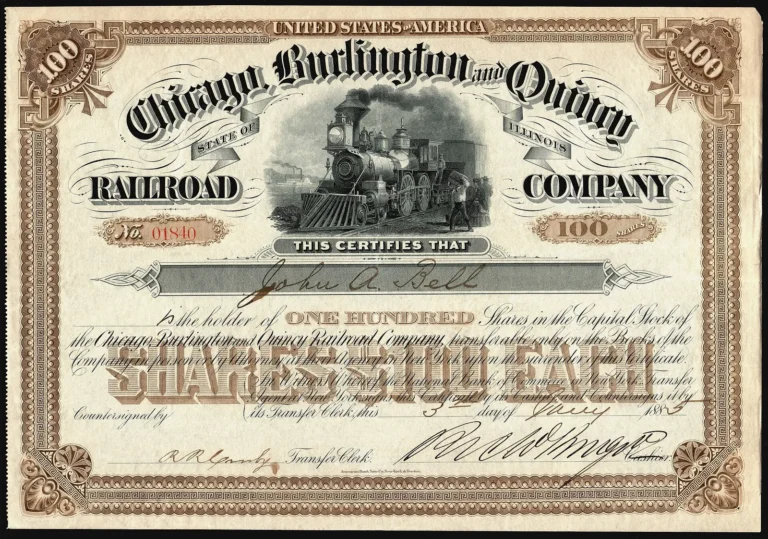
In the summer of 1929, the most common way to buy stocks in America was to put down 10% of the price and borrow the rest from a broker. The shares you bought were the collateral. The Federal Reserve’s own history of the crash lists this as one of the reasons prices soared that year. Brokers’ loans, the money New York Stock Exchange member firms borrowed to fund their clients’ margin buying, went from $3.219bn in September 1926 to about $8.5bn at the end of September 1929, two and a half times in three years.
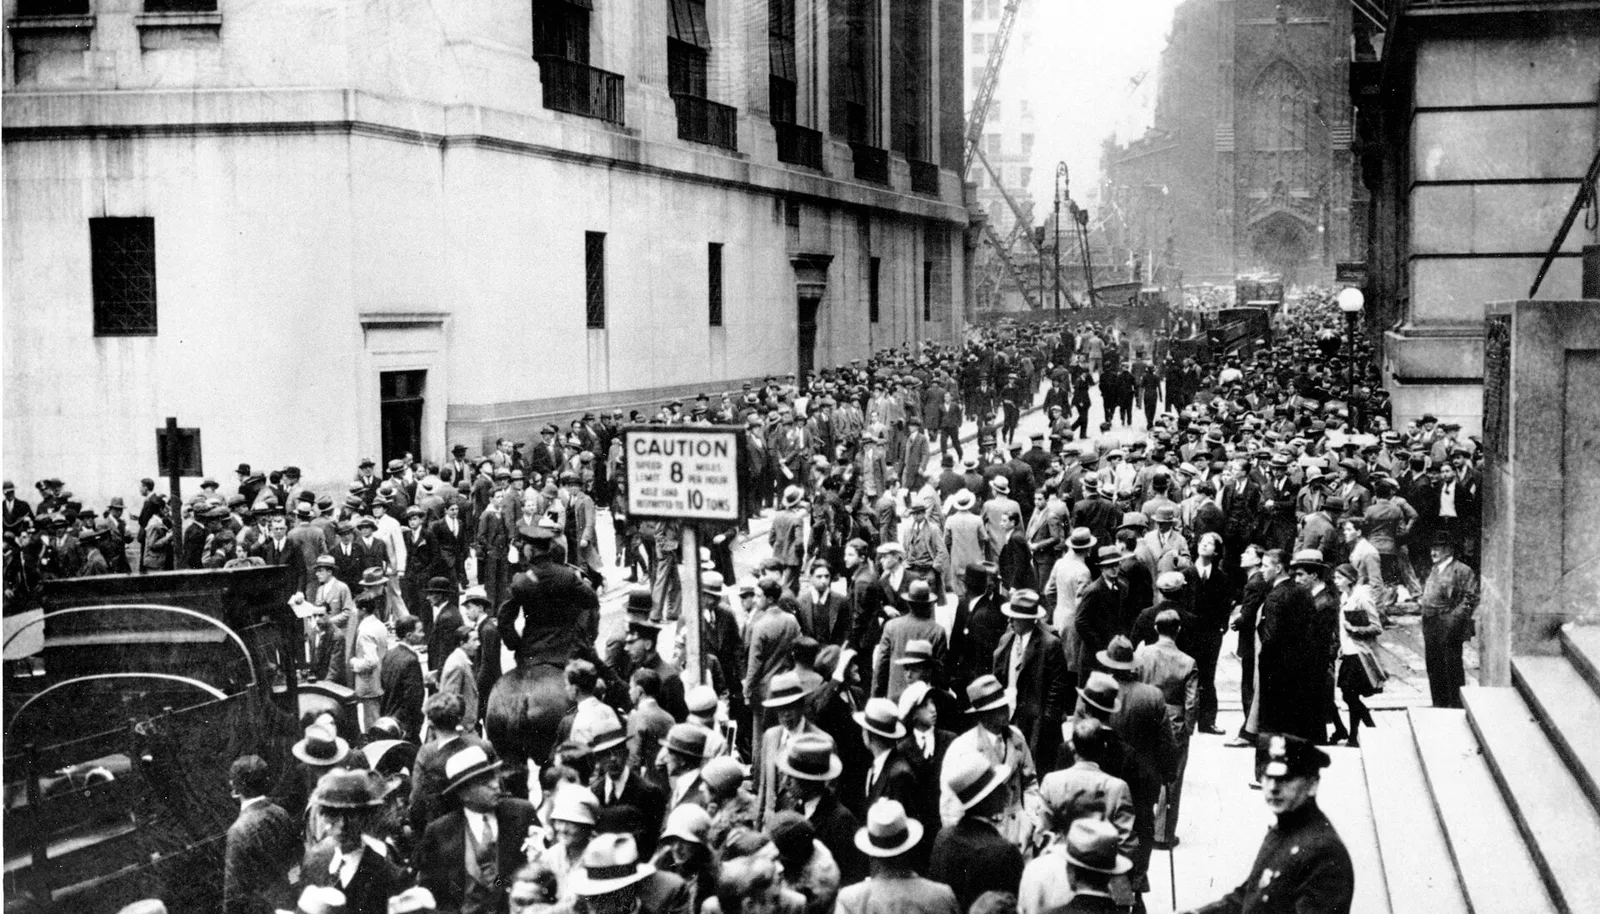
The Dow Jones Industrial Average peaked at 381.17 on September 3. On Monday, October 28, it fell about 13%, and on Tuesday, October 29, it fell about 12% more. For someone who had paid only 10% of the price, a 10% fall meant all of their own money was gone. Brokers asked for more cash (the margin call), and the shares of accounts that could not pay were sold the next day. That selling pushed prices lower, and the lower prices ate into the next account’s collateral. By July 8, 1932, the Dow was at 41.22, 89% below its peak.
The crash did not stay in the economy. Congress used Section 7 of the Securities Exchange Act of 1934 to let the Federal Reserve set how much an investor may borrow to buy stocks, and the Fed put Regulation T into effect on October 1, 1934. The share of a stock purchase you could fund with debt became a matter of law, and that rule is still in place today.
So what about this time? In October 2026, Korea’s KOSPI fell 20.70% in about ten days, from 7,003.74 to 5,554.22, and stock bought with borrowed money was force-sold every morning. This report asks four questions. How many accounts were force-sold? How big is this wave by historical standards? Where does the fallout spread: the economy, politics, or investing culture? And how much more gets sold if Samsung Electronics (005930.KS) and SK hynix (000660.KS) fall further?
As of: October 18, 2026. Margin loans, deposits, unpaid purchases and forced sales are daily data from the Korea Financial Investment Association (KOFIA) freesis database through October 15 (KOFIA publishes one day late). Stock prices are Korea Exchange (KRX) closes through October 16, downloaded via Yahoo Finance. Korean won figures are converted at KRW 1,340.95 per dollar, the October 16, 2026 Yahoo Finance close. Account counts, ages and margin calls come from data the 10 largest Korean brokerages submitted to the offices of lawmakers Kim Sang-hoon, Kim Hyun-jung and Kang Jun-hyeon, as reported by Herald Business (July 28), the Korea Economic Daily (August 19) and Aju Business Daily (September 1 and 2). Margin balances by stock come from Hans Economy (October 15) and from Segye Ilbo (October 16) citing NICE Investors Service. The 1929 facts come from Federal Reserve History and the Federal Reserve’s annual report. Numbers the author calculated are marked as the author’s calculation or estimate.
Korean terms used in this report: margin loans (sinyong yungja) are loans from a broker to buy stocks, held for months, with the shares as collateral. Unpaid purchases (misu) are cash-account purchases made before paying, which must be settled two trading days later (T+2). Forced selling (bandae maemae, literally “counter-trading”) is the broker selling a client’s shares without their say. The maintenance ratio (dambo yuji biyul) is account value divided by the loan, which must usually stay above 140%. The down payment ratio (bojeunggeum-yul) is the share of a margin purchase paid with the investor’s own money, 45% at many brokers.
What this report covers: how many accounts were force-sold and how that is estimated, where this year ranks in history, how much debt sits in two stocks and why the July low matters, how the 23% margin-call threshold is calculated, how the two stocks’ fall maps to next-day forced sales (two models by the author), how margin debt first grows and then shrinks in a fall, paper losses and their effect on consumption and broker interest, how the government’s response differs from 2020 and 2022, the 1929 and 2015 precedents, what age and leveraged products say about investing culture, and the author’s view, dates to watch and methods.
1. Forced selling hit at least 23,800 accounts in the first half of October
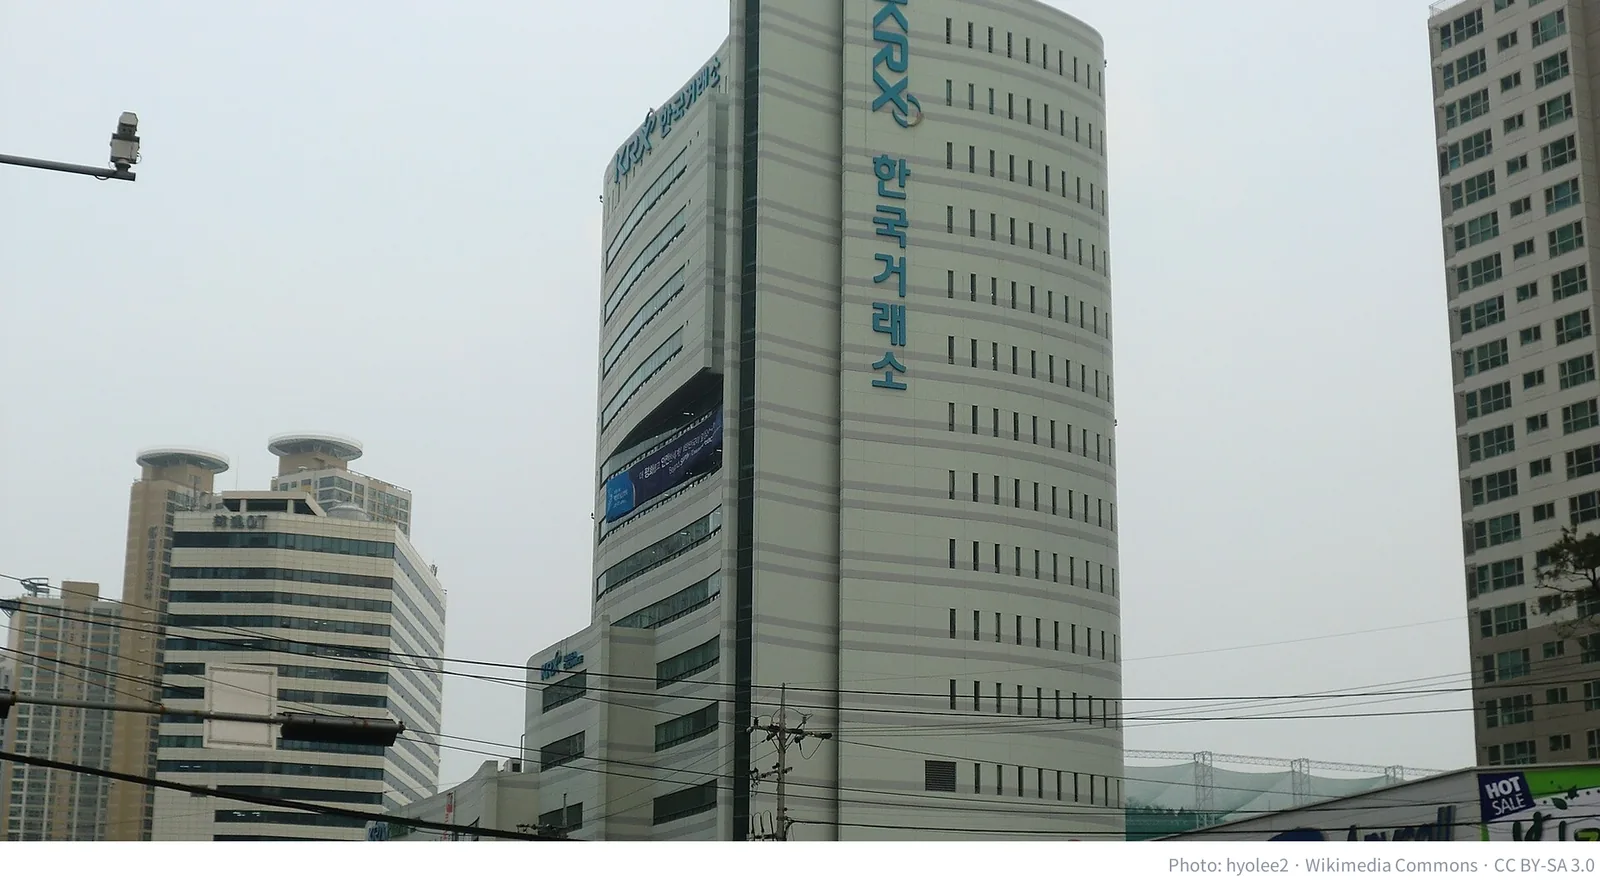
Two terms first: margin debt and forced selling
Margin debt in Korea means buying stocks with a broker’s money, and there are two ways to do it. One is a margin loan: the broker lends for months and holds the purchased shares as collateral. The other is an unpaid purchase: the investor buys on credit and promises to pay by settlement, two trading days after the trade. Forced selling is the broker selling the client’s shares. For a margin loan, it happens when the account value falls below 140% of the loan (the maintenance ratio) and the investor cannot top it up. For an unpaid purchase, it happens when the investor does not pay by settlement. Either way, the shares are sold the next morning in the pre-open auction.
This is what Korean investors mean when they say they were “liquidated.” The shares are sold not on the day the investor chooses but on the day the broker chooses, and not at a price the investor picks but at whatever the morning auction sets.
The account counts we actually have
There is no official count of how many people were hit. KOFIA publishes only the daily amount of forced selling, and only for unpaid purchases. The closest thing to a head count is the number of accounts with an executed forced sale, which lawmakers obtained from the 10 largest brokerages and made public.
According to data from lawmaker Kim Sang-hoon’s office, in June alone 21,615 accounts at the 10 largest brokerages had a margin loan force-sold, and 38,755 had an unpaid purchase force-sold, 60,370 in total. Data from lawmaker Kim Hyun-jung’s office show 41,761 margin-loan accounts force-sold in July alone, about double June’s number. These 10 brokerages hold about 84% of all margin loans.
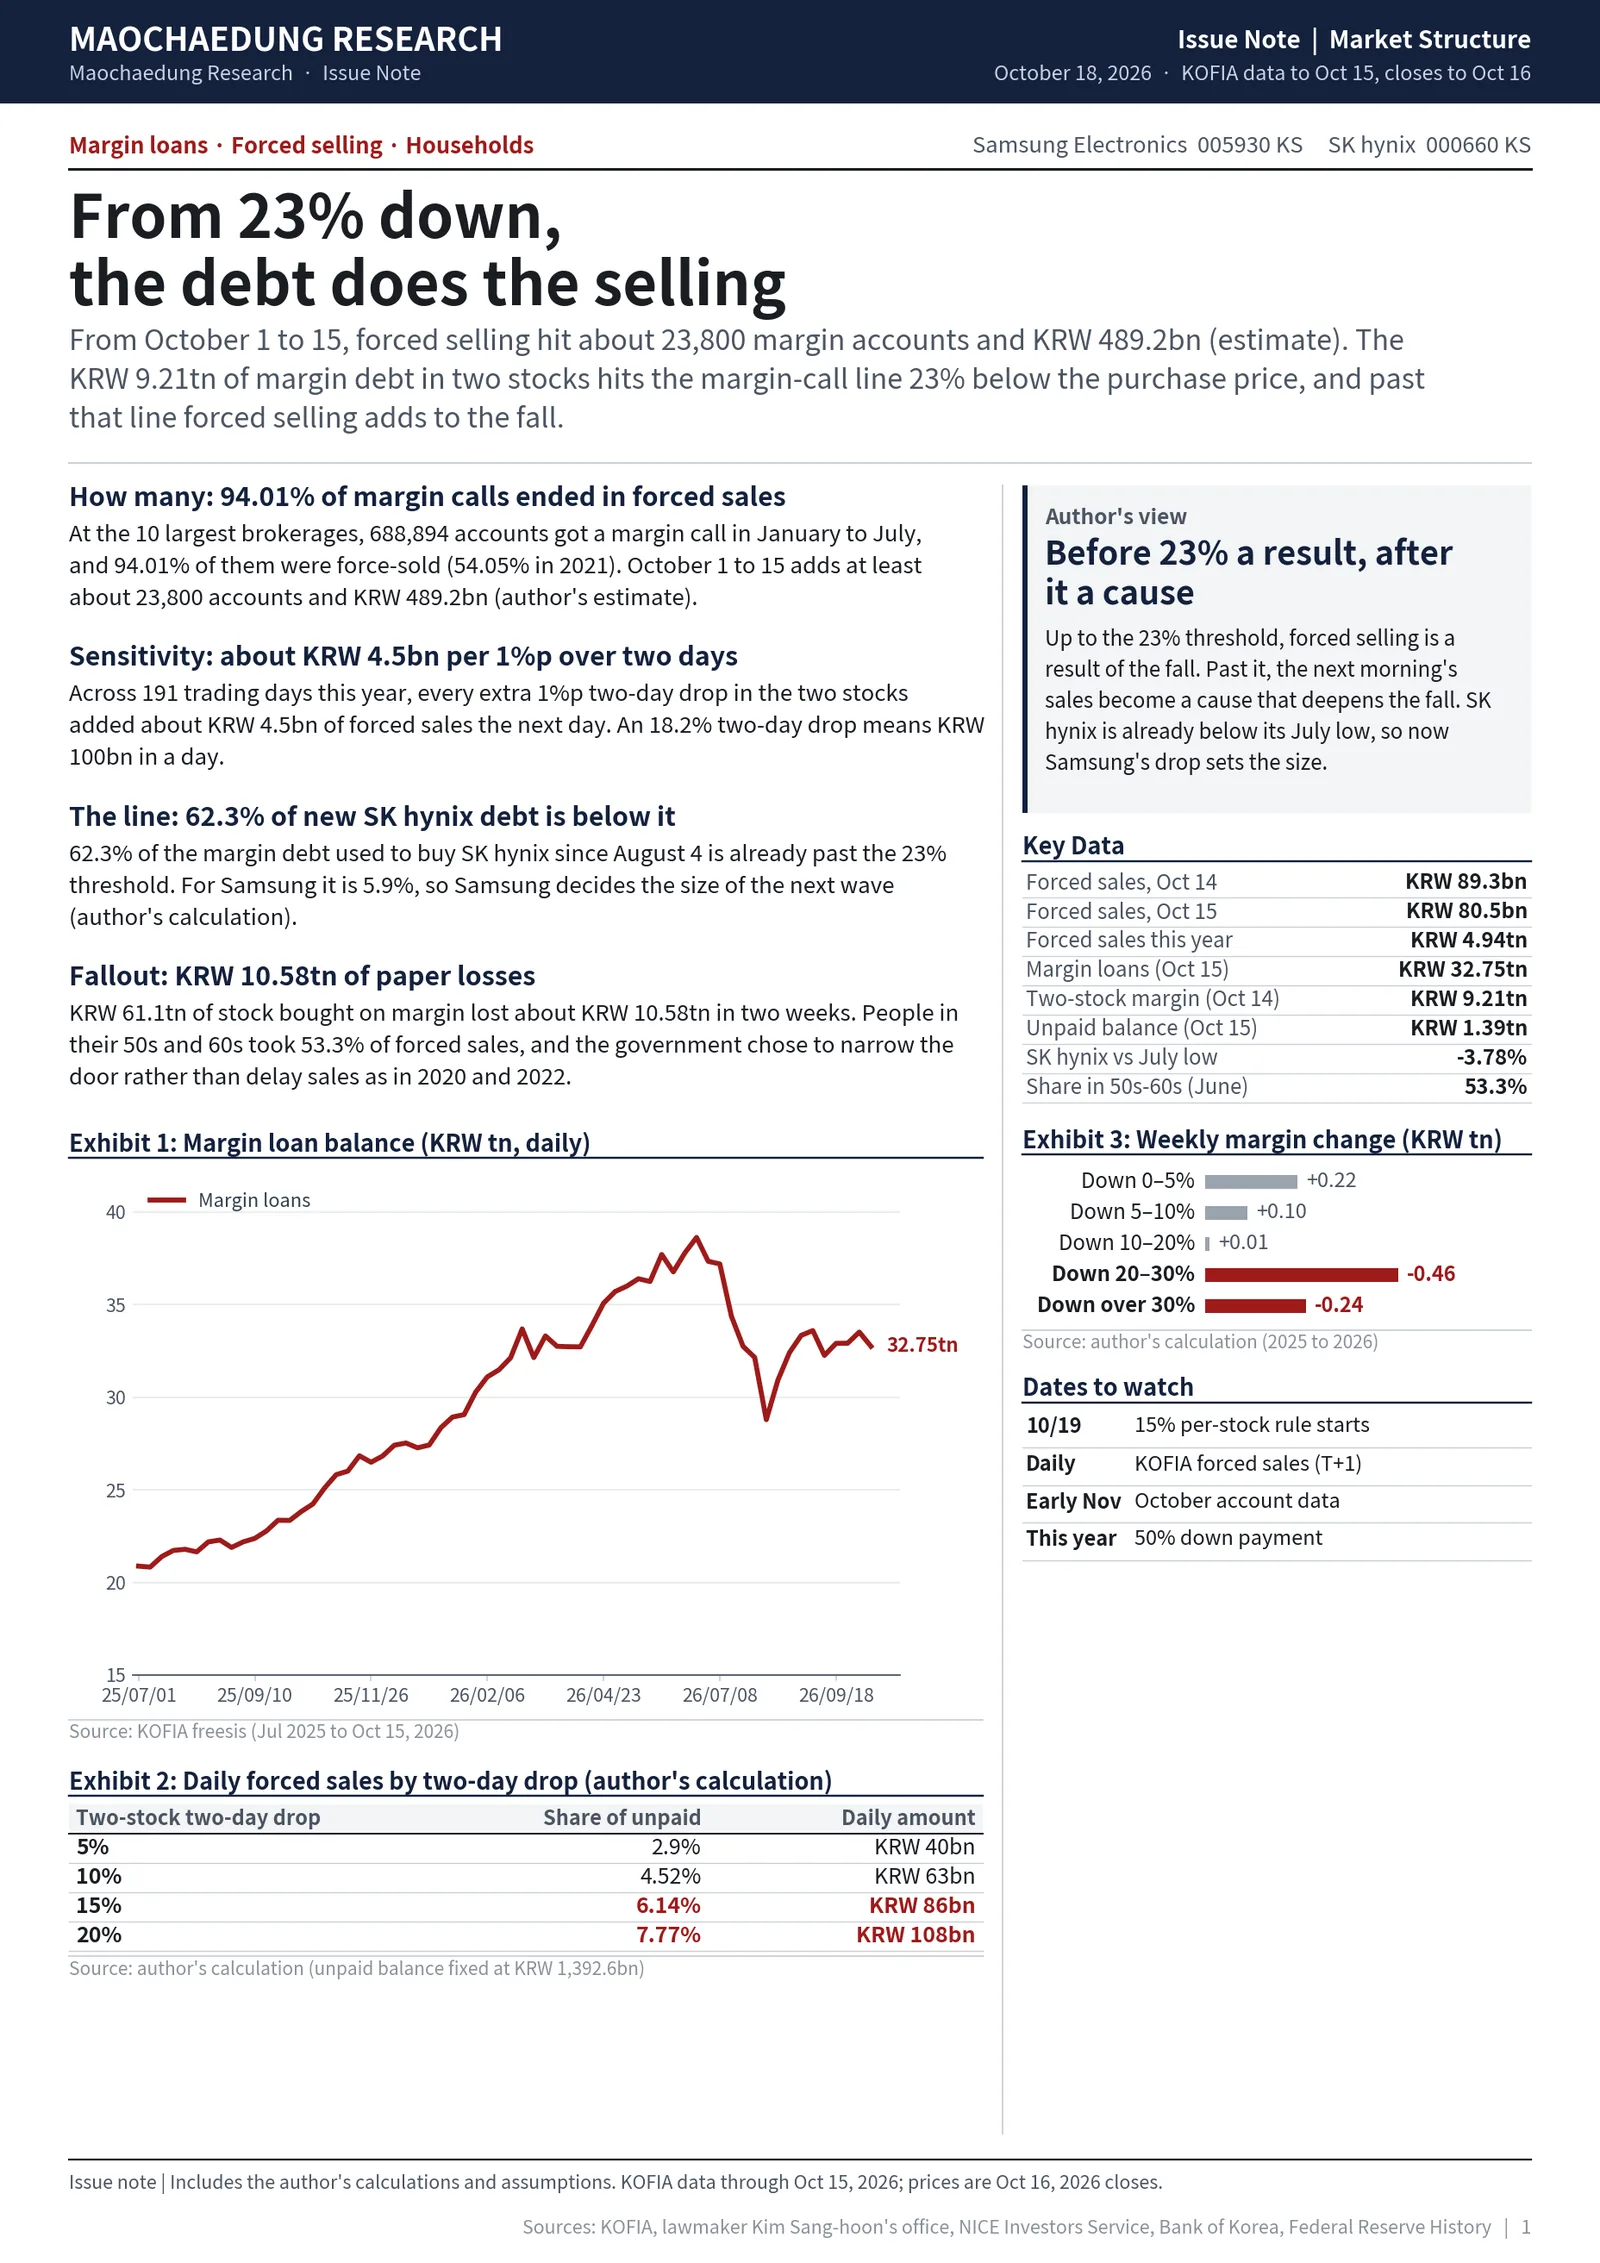
There is a bigger number. Data from lawmaker Kang Jun-hyeon’s office show that 688,894 accounts at the 10 largest brokerages received a margin call, a notice that collateral was short, from January to July. That nearly matched the 767,173 for all of 2025 in just seven months. What happened next matters more. In 2026, 94.01% of margin-called accounts ended in a forced sale. The rate was 54.05% in 2021, 44.54% in 2022, 46.93% in 2023 and 40.24% in 2024, then jumped to 85.97% in 2025. In earlier years a little over half of margin-called investors found the cash to hold on; this year more than nine in ten had none. From January to July, 6,170 accounts were liquidated after losing all of their principal (KRW 31.2bn). By age in the first half: 1,682 in their 40s, 1,426 in their 50s, 1,345 in their 30s, 553 in their 60s and 155 aged 70 and over. The count in their 60s more than tripled from 169 in the first half of 2025, and for 70 and over from 43. Collateral shortfalls from January to July totaled KRW 5.13tn (about $3.82bn), 1.8 times the KRW 2.87tn for all of 2025.
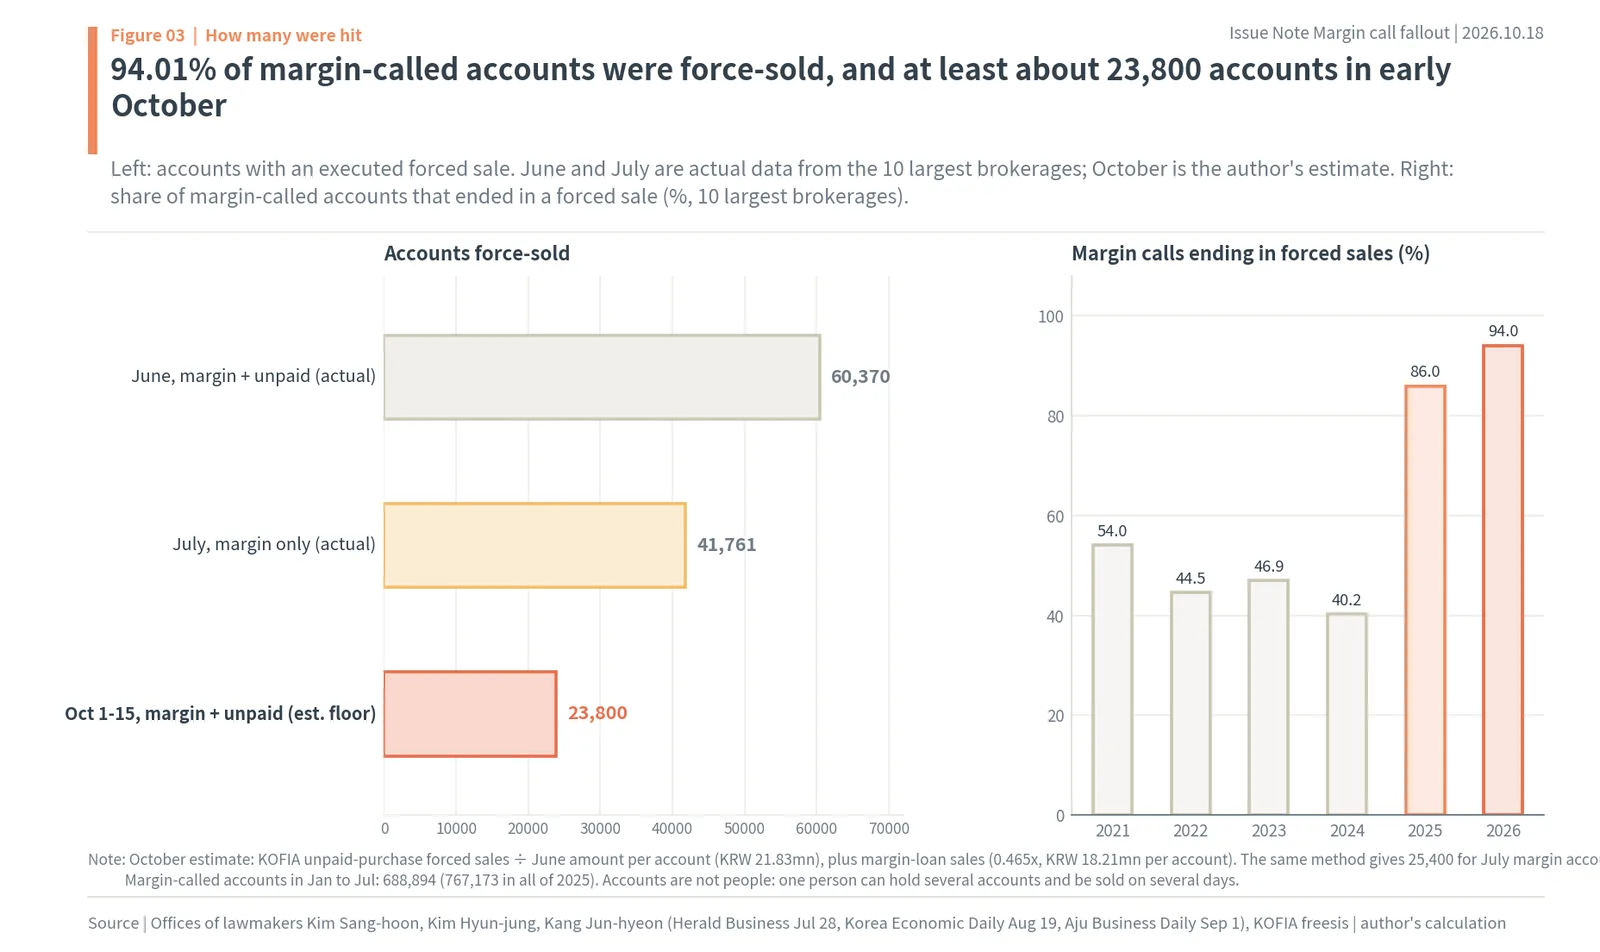
As Figure 3’s title says, 94.01% of margin-called accounts were force-sold, and at least about 23,800 accounts were sold in the first half of October. The left panel shows accounts with an executed forced sale: 60,370 in June and 41,761 margin-loan accounts in July are actual data, while 23,800 for October 1 to 15 is the author’s estimate. The right panel shows how the share of margin calls ending in forced sales changed each year.
Estimating October 1 to 15: at least 23,800 accounts
October account counts are not out yet; lawmakers’ data usually arrive a month or two later. So the author divided amounts by the amount sold per account. In June, the 10 largest brokerages force-sold KRW 845.9bn of unpaid purchases across 38,755 accounts, about KRW 21.83mn (about $16,300) per account. Margin-loan forced sales were KRW 393.5bn across 21,615 accounts, about KRW 18.21mn (about $13,600) per account. In the same month, margin-loan forced sales were 0.465 times unpaid-purchase forced sales.
KOFIA’s count of unpaid-purchase forced sales for October 1 to 15 is KRW 333.9bn. Divided by KRW 21.83mn, that is about 15,300 accounts. Margin-loan forced sales are not published, so applying June’s ratio (0.465) gives KRW 155.3bn, which divided by KRW 18.21mn is about 8,500 accounts. Together that is about 23,800 accounts and KRW 489.2bn (about $365mn) (author’s estimate). October 12 to 15 alone accounts for about 18,300.
This estimate is on the low side. The same method gives 25,400 margin-loan accounts for July, but the actual July figure was 41,761. In July the amount per account was smaller than in June, and margin-loan forced sales were larger relative to unpaid purchases. If October looks like July, the real count is higher than this estimate.
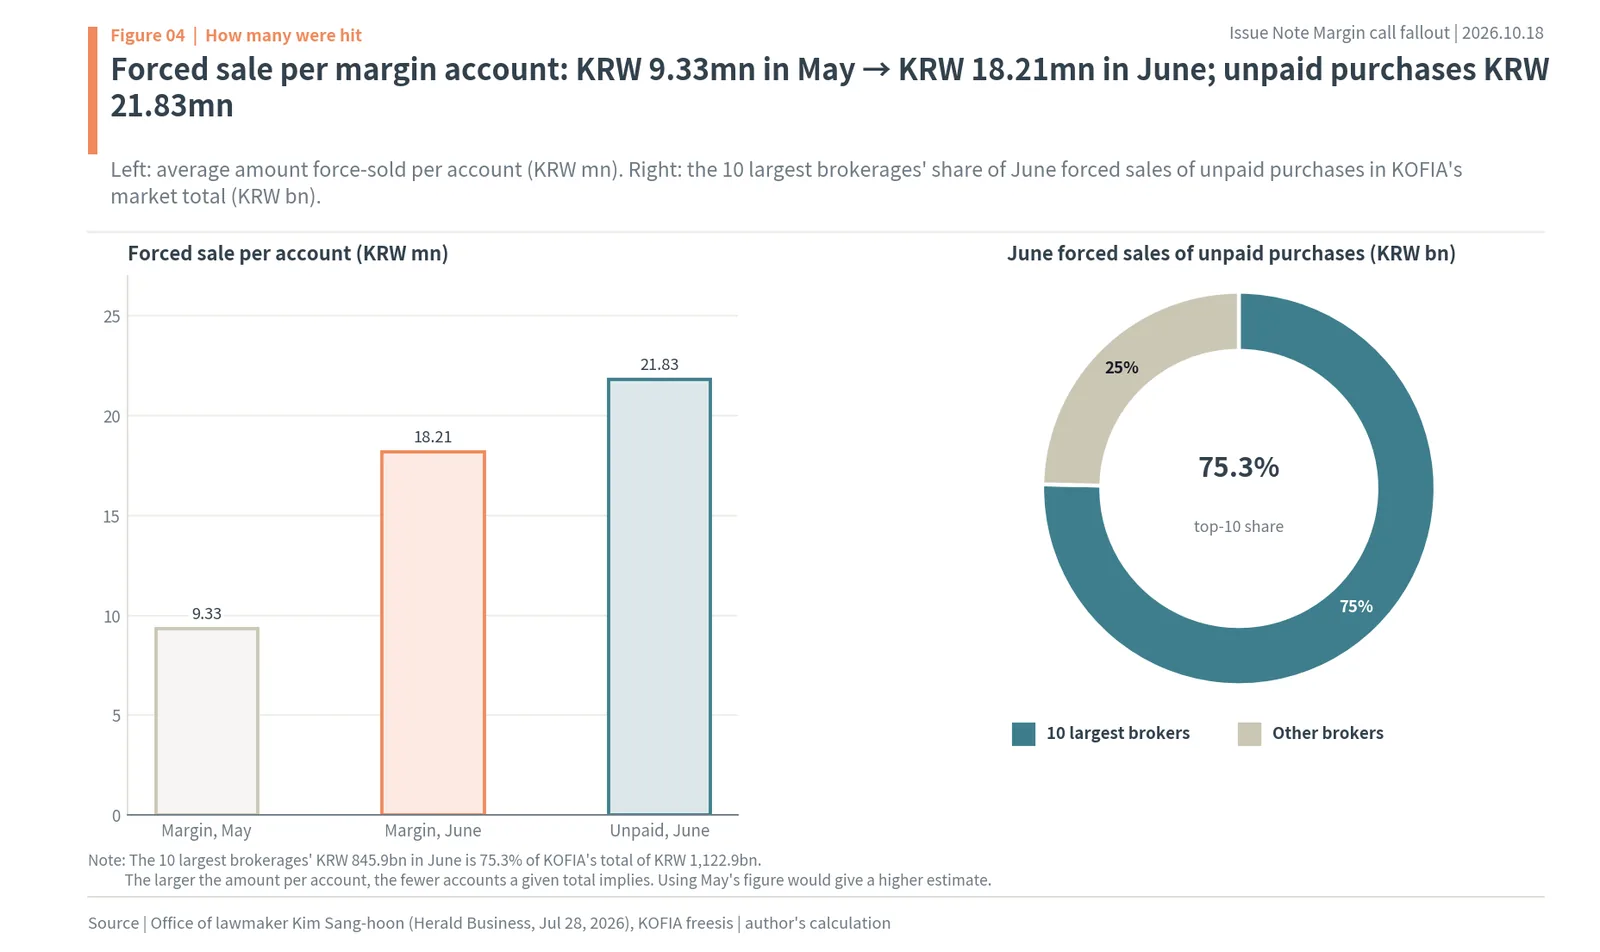
Figure 4 shows the per-account amounts used for the estimate. Margin-loan forced sales per account rose from KRW 9.33mn in May to KRW 18.21mn in June, and unpaid purchases were KRW 21.83mn per account. The right panel shows that the 10 largest brokerages’ June unpaid-purchase forced sales of KRW 845.9bn were 75.3% of KOFIA’s market total of KRW 1,122.9bn. Applying the top 10’s per-account amount to the market total assumes the other brokers sold similar-sized accounts.
An account is not a person. One person can hold accounts at several brokers, and the same account can be counted more than once if it is sold on several days. Still, the scale is clear. Korea had 14.42 million individual shareholders at the end of 2025, and in seven months this year more than 680,000 accounts received a margin call, most of them followed by a forced sale.
2. This year’s margin liquidations are already the second largest on record
Every day in October: from KRW 6.4bn to KRW 89.3bn
KOFIA’s daily figure for forced sales of unpaid purchases, published one day late, was KRW 6.4bn on October 8. As the KOSPI started to fall, it grew to KRW 27.1bn on the 12th, KRW 59.4bn on the 13th and KRW 89.3bn (about $66.6mn) on the 14th, and was still KRW 80.5bn on the 15th. October 1 to 15 adds up to KRW 333.9bn, more than all of September’s KRW 219.1bn in half a month. Forced sales on the 14th were 7.2% of the previous day’s unpaid balance: more than 7 of every 100 won bought on credit were force-sold in a single morning. The unpaid balance itself grew from KRW 931.6bn on October 7 to KRW 1,392.6bn on October 15. As prices fell, more people bought on credit, and that credit came back as morning forced sales.
This figure covers only unpaid purchases. Amounts sold because of margin-loan collateral shortfalls are not published daily. Data from lawmaker Kang Jun-hyeon’s office show KRW 4.82tn of forced sales at the 10 largest brokerages from January to July: KRW 2.93tn from unpaid purchases and KRW 1.89tn from margin and stock-backed loans. Adding the margin-loan side to KOFIA’s number makes total forced selling much larger.
KRW 4.94tn this year, second only to 2023
Adding up KOFIA’s daily data since 1998, forced sales of unpaid purchases this year total KRW 4.94tn (about $3.69bn) through October 15. By year, that is second only to 2023’s KRW 9.85tn, and already above 2021’s KRW 4.90tn. In 2023, forced-sale orders that could not be executed during the October trading halt of Youngpoong Paper were counted again day after day, which inflated the total. The record single day, KRW 549.7bn on October 20, 2023, was a product of that counting. Setting 2023 aside, it is fair to say this is the biggest year on record for margin liquidations that actually went through.
There is a closer comparison. When the KOSPI fell 8.77% on August 5, 2024, forced sales the next day were KRW 43.3bn, and margin loans fell 12.2% from KRW 19.52tn on August 1 to KRW 17.13tn on August 8. This year’s KRW 89.3bn on October 14 is double that, and the margin balance before the fall was 1.7 times as large.
Daily averages make the gap even clearer. This year’s daily average is KRW 25.9bn, 3.6 times last year’s KRW 7.1bn. During the 2020 COVID-19 crash the daily average was KRW 15.7bn, and during the 2021 margin boom it was KRW 19.7bn.
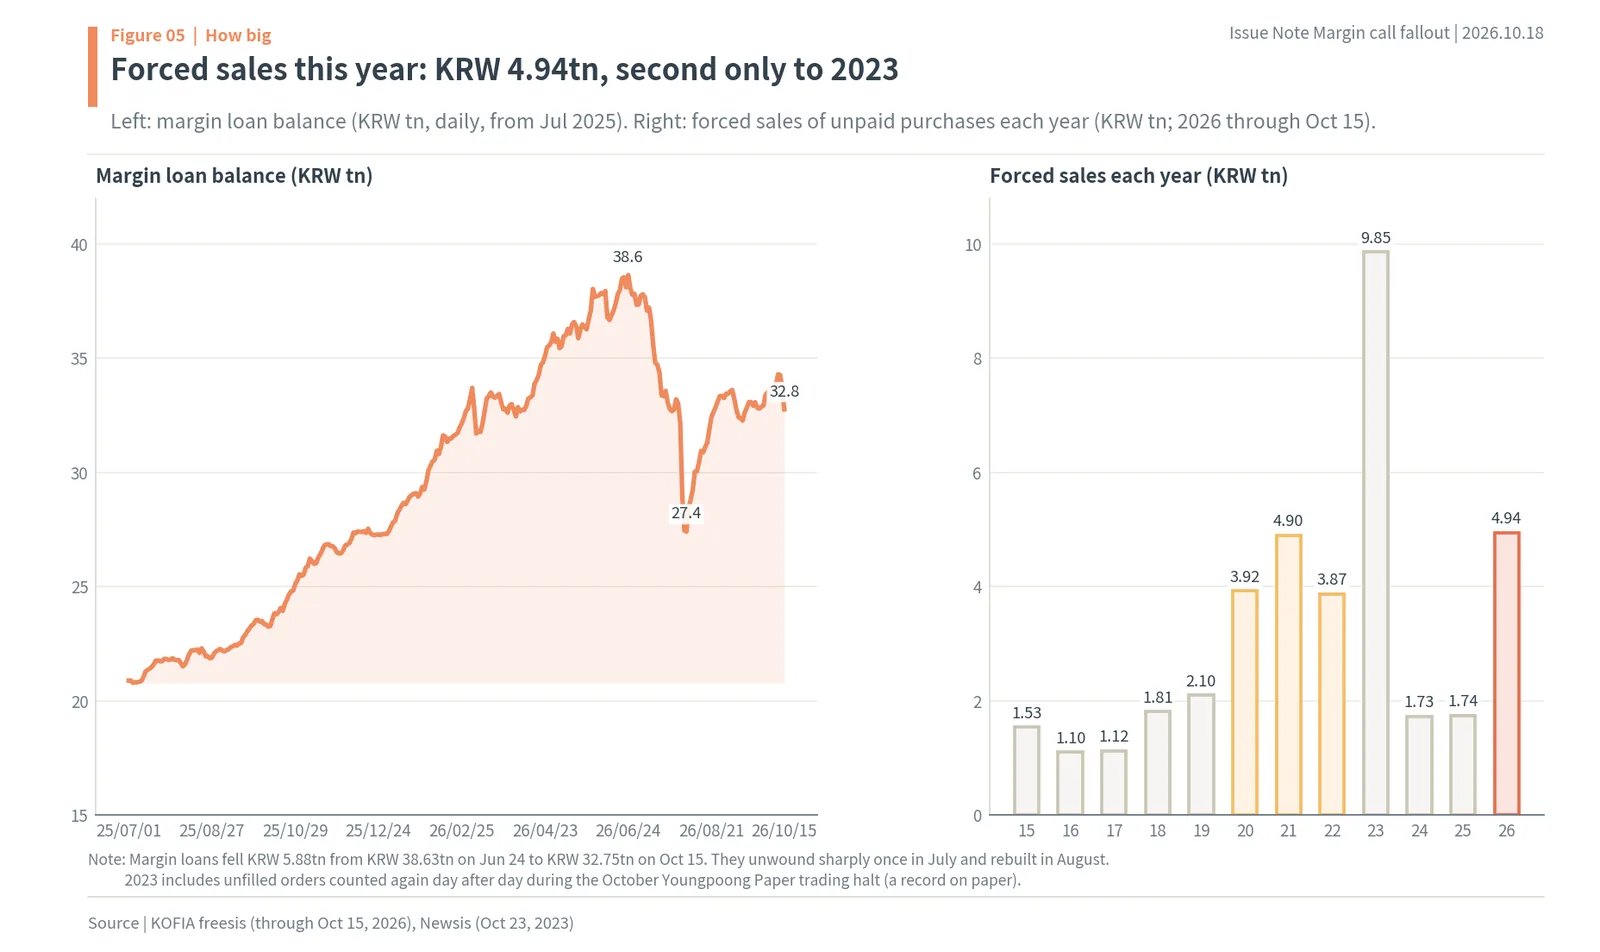
As Figure 5’s title says, this year’s KRW 4.94tn is the most since 2023. The line on the left is the margin loan balance since July 2025. It peaked at KRW 38.63tn (about $28.8bn) on June 24, fell to KRW 27.4tn on August 4 in the July crash, then rebuilt to KRW 32.75tn (about $24.4bn) on October 15. That is KRW 5.88tn (15.23%) below the peak, but still above the 2021 record of KRW 25.65tn. The bars on the right are yearly forced-sale totals: the yellow bars for 2020 to 2022 are the last margin boom, and the red bar on the far right is this year.
Two of the five biggest months ever: June and July 2026
Monthly totals show where the size came from. The biggest month since 1998 was October 2023 at KRW 2,967.2bn (Youngpoong Paper). Next came July 2023 at KRW 1,196.3bn and August 2023 at KRW 1,131.3bn. Fourth was June 2026 at KRW 1,122.9bn and fifth was July 2026 at KRW 992.8bn. May 2026, at KRW 707.7bn, ranks ninth. June was the month volatility jumped after single-stock leveraged products on Samsung Electronics and SK hynix listed on May 27, and July had several days when the KOSPI moved more than 10%.
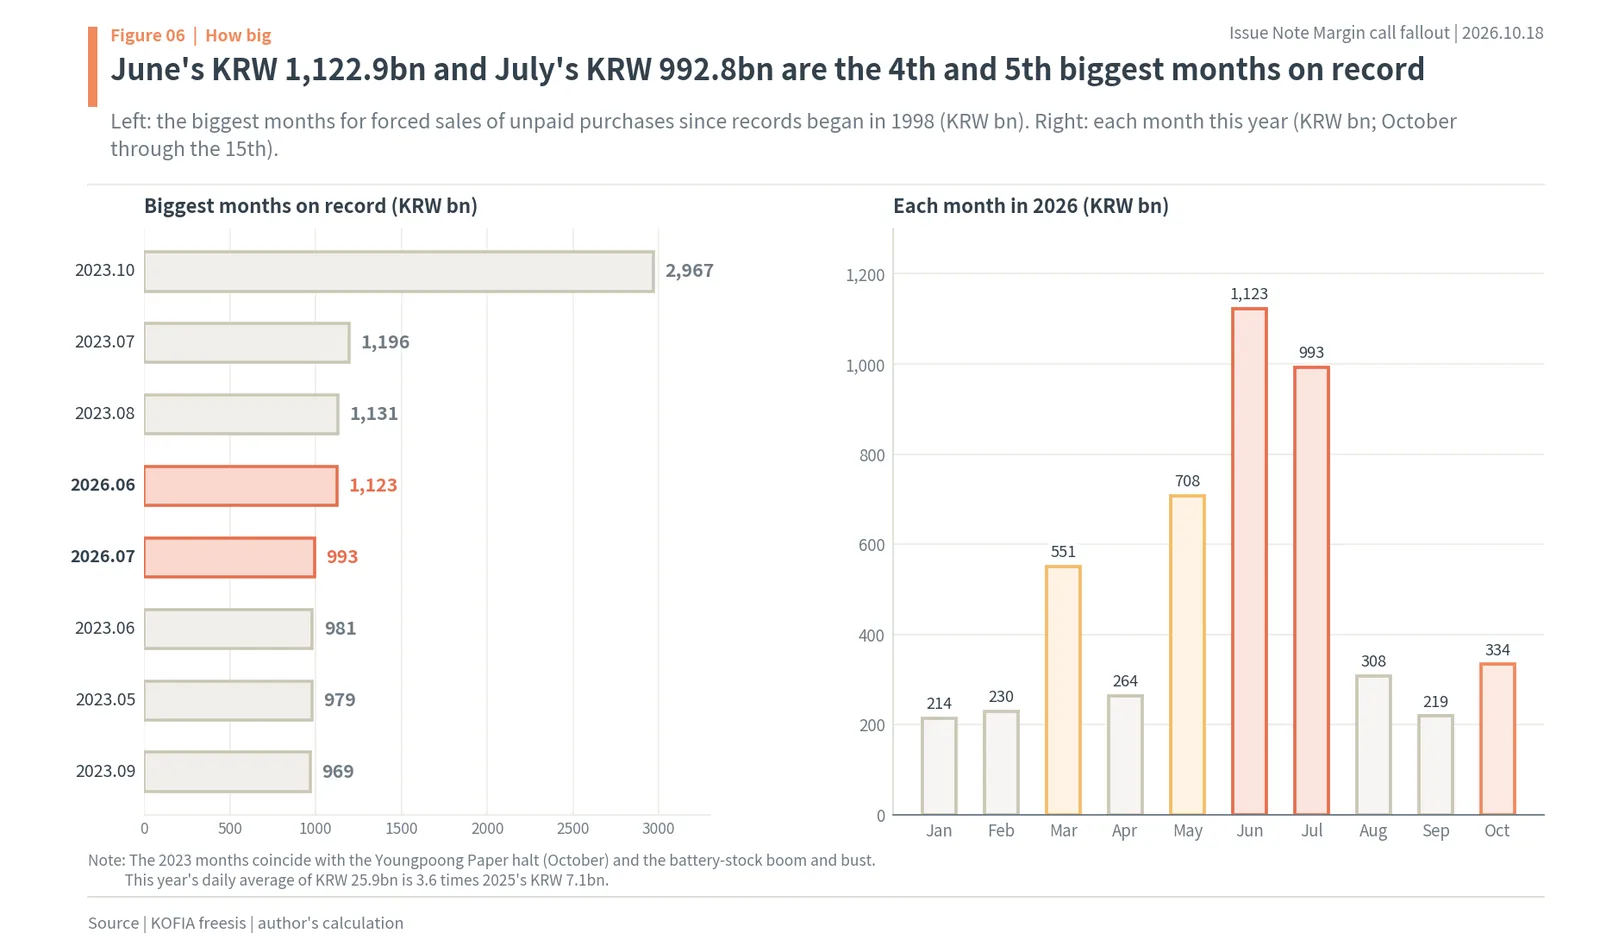
As Figure 6’s title says, June’s KRW 1,122.9bn and July’s KRW 992.8bn are the 4th and 5th biggest months on record. The bars on the right show this year’s forced sales rising through March (KRW 550.8bn), May (KRW 707.7bn), June and July, easing in August (KRW 307.5bn) and September (KRW 219.1bn), then jumping again to KRW 333.9bn in just half of October. Debt builds up, a crash comes, forced selling unwinds the debt, and it builds again: this is the third time this year.
What size means is simple. When the same fall hits, more debt means more forced selling. This year margin debt started from a level 1.5 times the 2021 record, and where that debt is concentrated is the subject of the next chapter.
3. More than a quarter of the debt sits in two stocks

KRW 9.21tn, 27.3% of margin loans
Margin balances by stock, reported by Hans Economy on October 15, show KRW 4.80tn in Samsung Electronics and KRW 4.41tn in SK hynix on October 14. Together that is KRW 9.21tn (about $6.87bn), 27.3% of the KRW 33.71tn of margin loans that day. NICE Investors Service’s end-September count gave the same picture: KRW 9.2tn in the two stocks out of KRW 33.4tn, or 27.5%. More than 1 of every 4 won of margin debt is tied to two stocks.
The concentration grew over four months. On June 1, Koscom data showed KRW 4.26tn of margin loans in Samsung Electronics and KRW 3.53tn in SK hynix, KRW 7.79tn together, or 20.7% of the KRW 37.68tn total that day. Then the July crash unwound more than KRW 10tn of debt across the market, yet the two stocks’ debt grew to about KRW 9.2tn and their share passed 27%. The crash flushed out debt in other stocks while new debt betting that “chips always come back” poured into these two. NICE counted KRW 10.4tn (31.1%) in the whole semiconductor sector at the end of September, a little over 88% of it in the two stocks.
Concentration makes forced selling bigger. Debt spread over many stocks holds up when one stock falls. Debt piled into the same two stocks sets off alarms together when both fall. And because the two stocks are such a large part of the KOSPI’s market value, their fall is the index’s fall, which also shrinks the collateral behind debt in other stocks.
SK hynix down 30.91% and Samsung down 21.92% in two weeks
From October 2 to October 16, SK hynix closed down 30.91%, from KRW 1,841,000 to KRW 1,272,000. Samsung Electronics fell 21.92% from KRW 276,000 to KRW 215,500, and the KOSPI fell 19.07% from 7,003.74 to 5,668.05. On October 15 alone, the KOSPI fell 7.57%, Samsung Electronics 9.48% and SK hynix 11.06%, and a circuit breaker halted trading during the session.
An account that bought with a 45% down payment hits the 140% collateral line when the stock falls 23% below the purchase price (calculated in the next chapter). For someone who bought on margin at October 2 prices, SK hynix is already past that threshold and Samsung is just short of it.
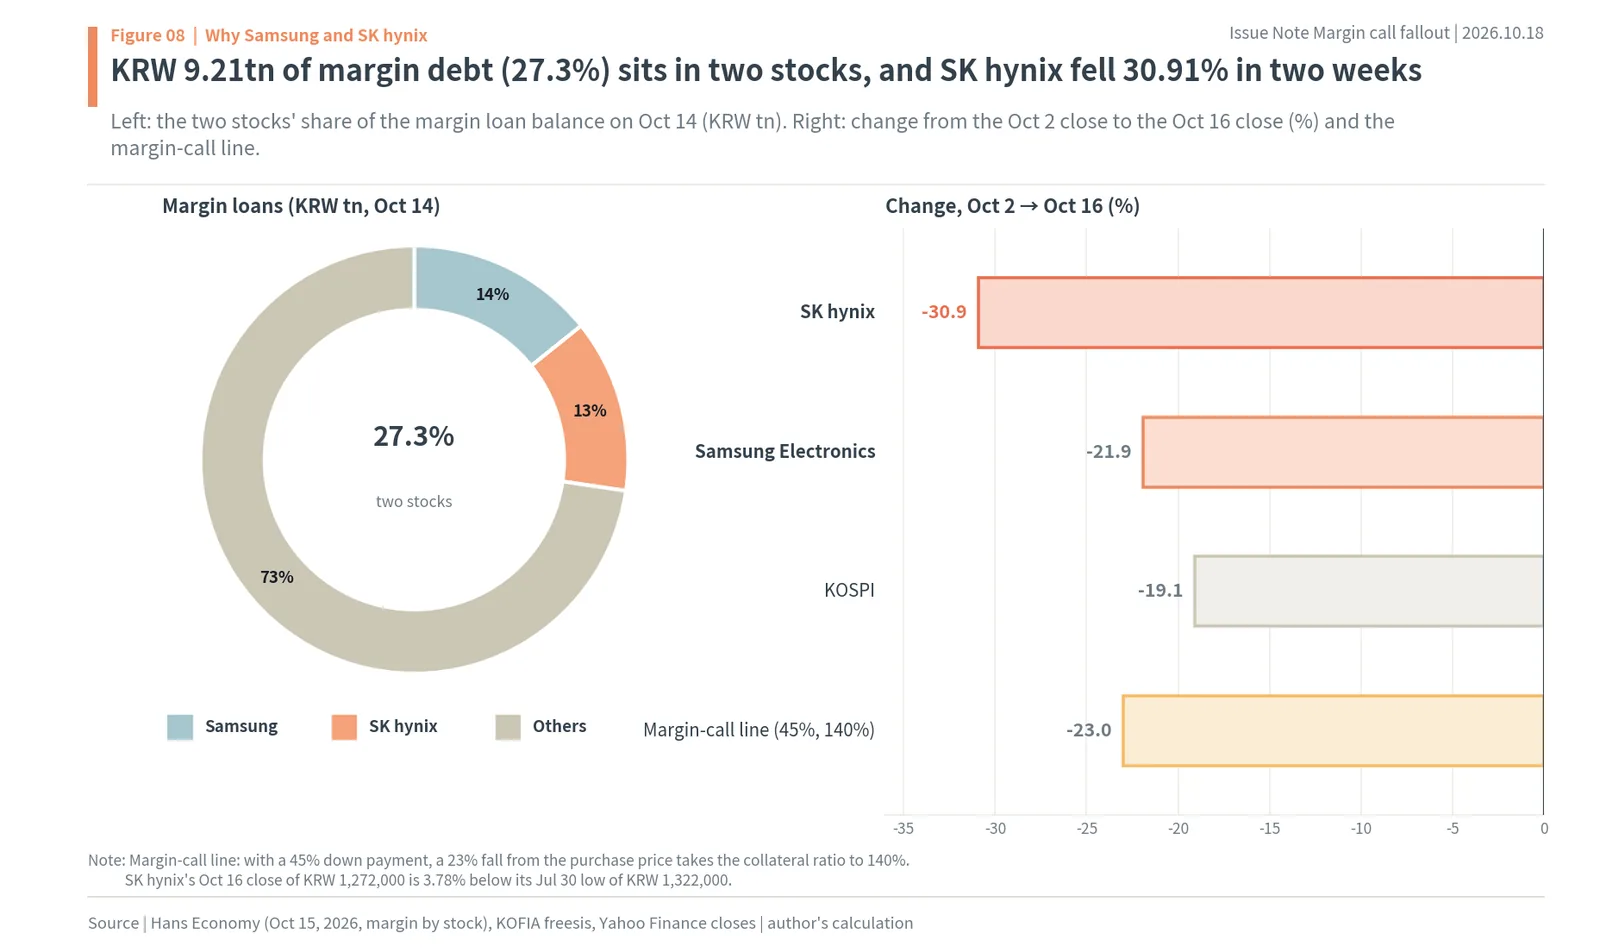
As Figure 8’s title says, KRW 9.21tn of margin debt (27.3%) sits in two stocks, and SK hynix fell 30.91% in two weeks. The donut on the left shows the shares of Samsung Electronics (about 14%) and SK hynix (about 13%) in the October 14 margin balance. The bars on the right show changes from October 2 to October 16, and the yellow bar at the bottom is the 23% margin-call line. Only the SK hynix bar is longer than the line.
SK hynix broke its July low
The risk is not only in debt taken on near this year’s peak. There is also debt that survived the July crash. On July 30, SK hynix fell to KRW 1,322,000 and Samsung Electronics to KRW 207,000 before both rebounded sharply the next day. Debt that was not sold even at that low has its margin-call line below that low. But SK hynix’s October 16 close of KRW 1,272,000 (about $949) is 3.78% below its July low, while Samsung’s KRW 215,500 is 4.11% above.
Breaking the low means debt that was safe for three months is now moving toward the threshold. Forced sales above KRW 80bn on both October 14 and 15 can be read as new debt bought near the peak and older debt that survived July entering the alarm zone on the same days.
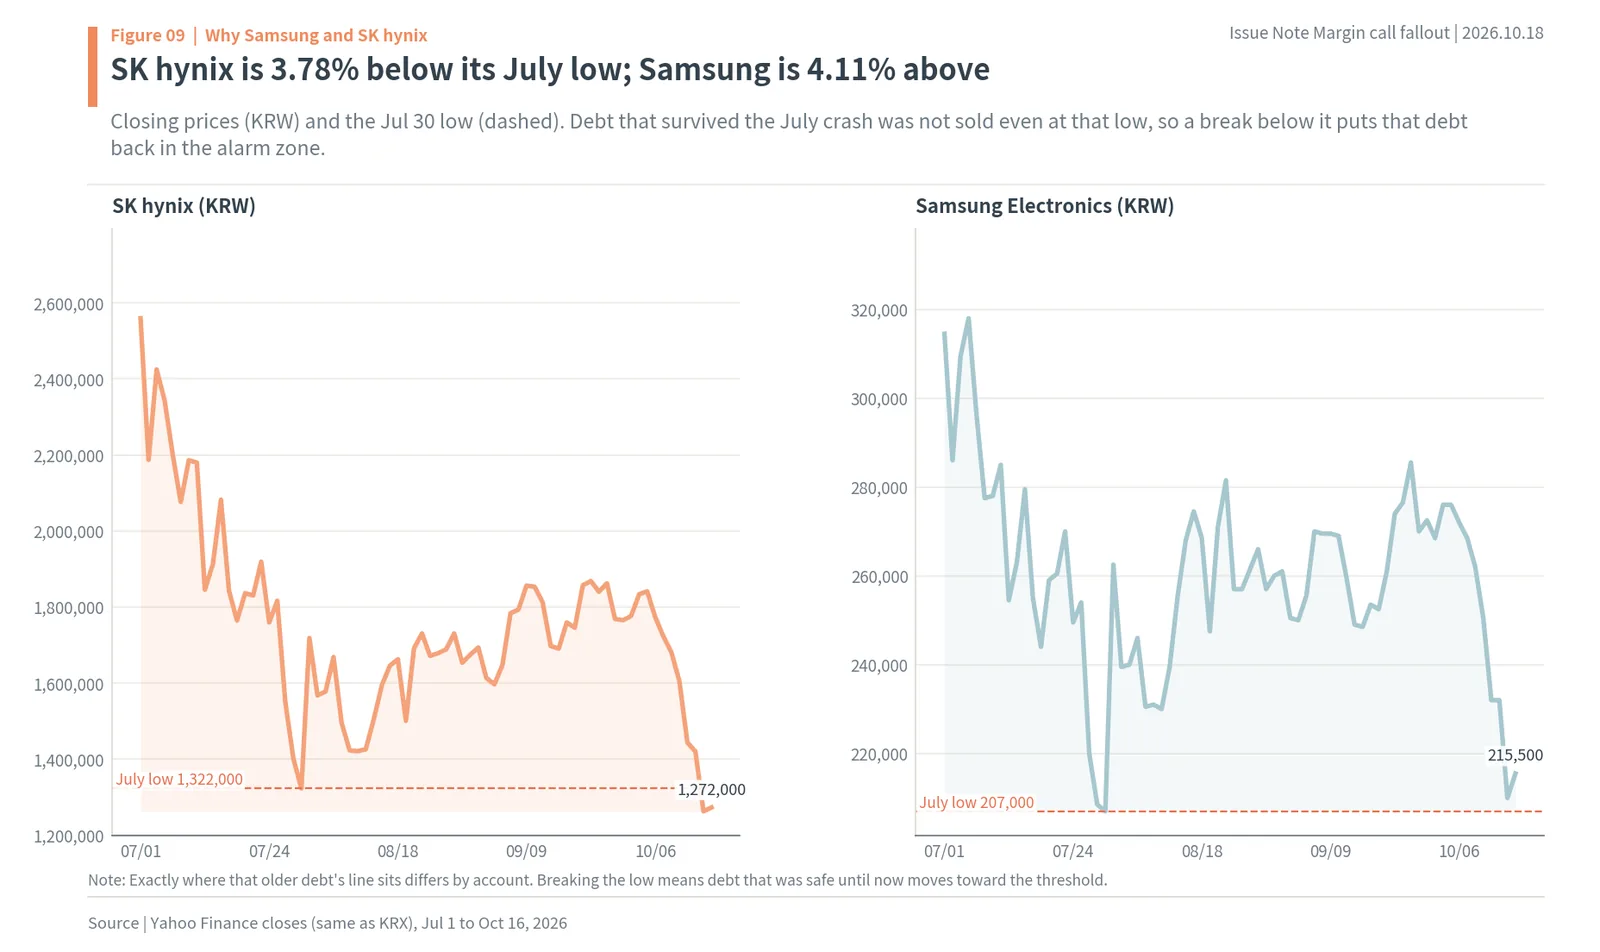
As Figure 9’s title says, SK hynix is 3.78% below its July low and Samsung is 4.11% above. The dashed lines in both panels mark the July 30 low. The SK hynix line is already below it, and the Samsung line sits just above it. On the day Samsung breaks that line, the older Samsung debt will be in the same position as SK hynix’s. This is where the reason Samsung sets the size of future forced selling begins.
4. 23% is a threshold you can calculate
The collateral ratio on a KRW 100mn account
When you buy stocks on margin, you pay part of the price with your own money (the down payment) and borrow the rest. The share you pay yourself is the down payment ratio, and many Korean brokers now use 45%. To buy KRW 100mn (about $74,600) of stock, you put in KRW 45mn and borrow KRW 55mn. The broker requires the collateral ratio, account value divided by the loan, to stay above 140% (the maintenance ratio). At the start it is KRW 100mn ÷ KRW 55mn, about 182%.
If the stock falls 23%, the KRW 100mn of stock is worth KRW 77mn, and KRW 77mn ÷ KRW 55mn = 140%. One more won of decline and the collateral is short; the broker asks for more cash, and if the investor cannot pay by the deadline, the shares are force-sold. The 23% is not a hunch. It comes from the formula 1 – maintenance ratio × (1 – down payment ratio) = 1 – 1.4 × 0.55 (author’s calculation). With a 50% down payment the threshold is 30%, and with a 150% maintenance ratio it is 25%.
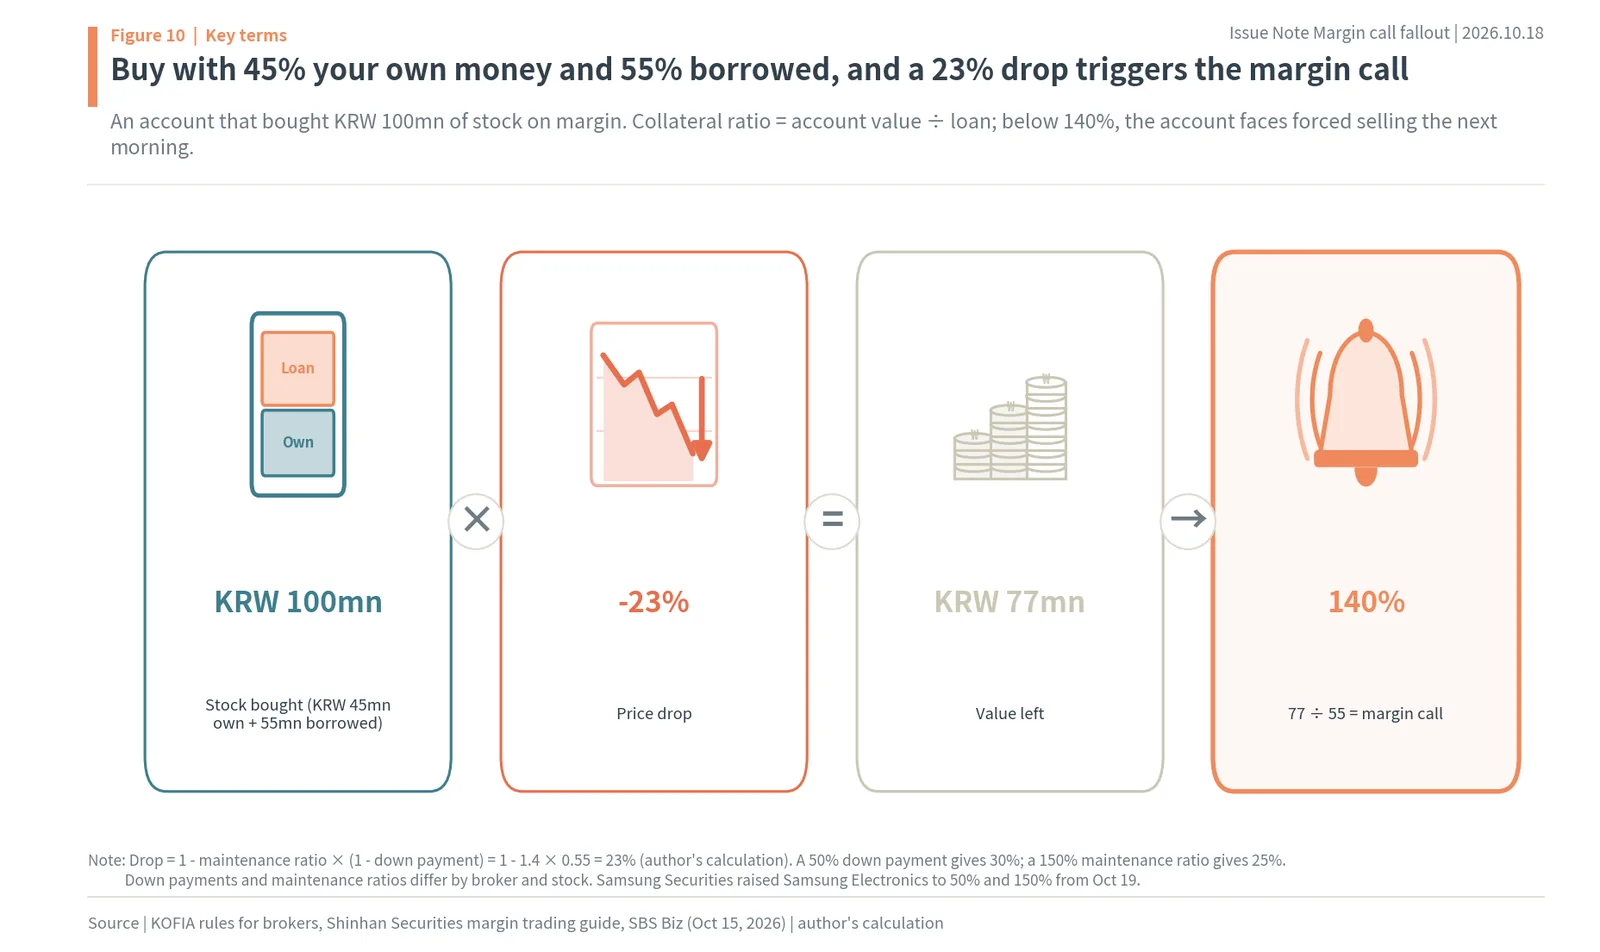
As Figure 10’s title says, if you buy with 45% of your own money and 55% borrowed, a 23% drop triggers the margin call. From left: KRW 100mn of stock bought (KRW 45mn of your own plus KRW 55mn borrowed), a 23% fall, KRW 77mn of value left, and the alarm at KRW 77mn ÷ KRW 55mn = 140%.
Far more is sold than the shortfall
Once past the threshold, the amount sold is larger than the shortfall. To protect against a further fall the next day, brokers set the number of shares to sell using a price 15-30% below the reference price. Korea Investment & Securities’ margin trading guide says it calculates the quantity at 15% below the previous close and that shares may be sold at the daily lower limit. In a case the Financial Supervisory Service (FSS) cited in March, a collateral shortfall of about KRW 2.01mn led to KRW 30.9mn of stock being sold. By the calculation in my companion note on Korea’s 15% per-stock margin cap, published the same day, a 20% discount sells 8.3 times the shortfall, and a discount above 28.6% sells the whole account.
The threshold changes what a fall is
This threshold is the anchor of this report. Before 23%, a fall leaves a margin account with only a paper loss. The loss hurts, but the shares stay in the account, and if the price comes back, so does the money. Past 23%, things change. The shares leave the account and hit the market as sell orders. Those orders arrive all at once in the next morning’s pre-open auction and push down the opening price. A lower open cuts the collateral ratio of other accounts that were still short of the threshold. A fall triggers forced selling, and forced selling triggers the next fall. That is what “from 23% down, the debt does the selling” means.
America went through the same chain in 1929. Its threshold was not 23% but about 10%: with only 10% of the price paid, a 10% fall wiped out the investor’s money. The lower the threshold, the faster and more often the chain turns. Letting the Fed set the own-money share in 1934, and the Korean securities industry’s plan to raise the minimum down payment from 45% to 50% within this year, both push this threshold further away.
5. Each extra 1%p two-day drop adds about KRW 4.5bn
What was matched against what
To answer “if prices fall this much, how much more is force-sold?” with a number, two things have to be matched: the size of the fall, and the forced selling that fall produces. The author matched the two for each of 191 trading days from January to October 15 this year.
The fall is the change in Samsung Electronics and SK hynix weighted by their margin balances (Samsung 52.1%, SK hynix 47.9%, as of October 14). Forced selling shows up a day late, because accounts that cannot pay for credit purchases by settlement or that are short of collateral are sold the following morning. So each day’s forced selling is matched with the two stocks’ fall over the previous two trading days. Forced selling is measured as a share, that day’s forced sales divided by the previous day’s unpaid balance, so that days with large and small credit balances sit on the same scale.
Why two days? Unpaid purchases must be paid for two trading days after the trade. Investors who do not want to, or cannot, put in more money after a fall let settlement pass, and their shares are sold the next morning. Margin accounts that get a call on a shortfall day and cannot top up by the next business day are also sold the day after. So this morning’s forced selling carries both yesterday’s and the day before’s declines. In fact, the biggest forced-sale days all came a day or two after big falls: KRW 169.8bn on June 9 after the falls on June 5 and 8, KRW 122.0bn on July 31 after July 28 and 29, and KRW 89.3bn on October 14 after October 12 and 13.
The result: 0.325%p of unpaid purchases per 1%p
Fitting a straight line through the 191 points gives forced-sale share = 1.274% + 0.325 × two-day drop (%p), with an R² of 0.47. Every extra 1%p that the two stocks fall over two days adds 0.325%p of the unpaid balance to the next day’s forced sales. The unpaid balance stood at KRW 1,392.6bn (about $1.04bn) on October 15, so that is about KRW 4.5bn (about $3.4mn) per 1%p (author’s calculation).
Along this line, a 5% two-day drop means about KRW 40bn of forced sales the next day, 10% about KRW 63bn, 15% about KRW 86bn, 20% about KRW 108bn and 25% about KRW 131bn. The two-day drop that pushes daily forced sales above KRW 100bn (about $74.6mn) is 18.2% (author’s calculation).
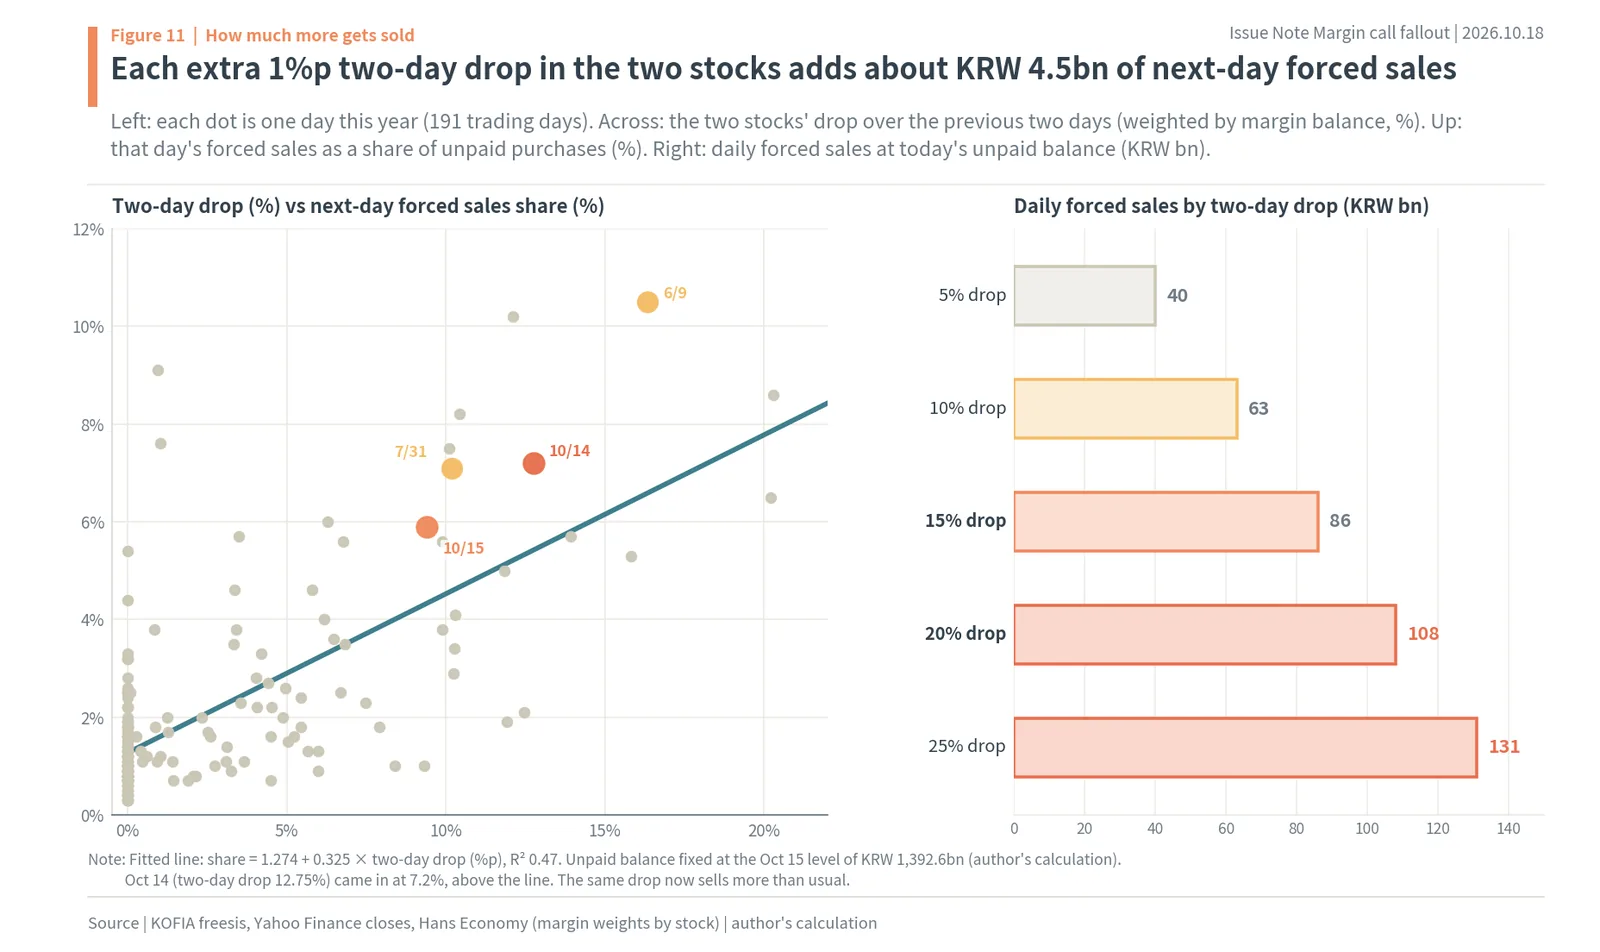
As Figure 11’s title says, each extra 1%p two-day drop in the two stocks adds about KRW 4.5bn of next-day forced sales. The gray dots on the left are this year’s trading days, and the teal line is the fit. The red dot is October 14, the coral dot October 15, and the yellow dots July 31 and June 9. The bars on the right convert the line into daily amounts at today’s unpaid balance.
October sits above the line
Note that the October points sit above the line. On October 14, the two stocks had fallen 12.75% over the previous two days. The line says 5.4%, but the actual share was 7.2%. On October 15, after a 9.41% two-day drop, the line says 4.3% and the actual was 5.9%. July 31 (a 10.18% two-day drop, 7.1% actual) was also above the line. When a fall has run for days and credit and margin debt are already bunched near the threshold, the same drop sells more than the line predicts. As the previous chapter showed, SK hynix breaking its July low and pulling older debt into the alarm zone explains much of that gap.
The same picture in drop bands
Averaging by bands of decline instead of fitting a line gives the same shape. After days when the two stocks rose over two days (114 days), the next day’s forced-sale share averaged 1.24%. After falls of 0-3% (22 days) it was 2.11%, 3-6% (26 days) 2.30%, 6-10% (13 days) 3.58%, 10-15% (12 days) 5.44%, and after falls of more than 15% (4 days) 7.72%.
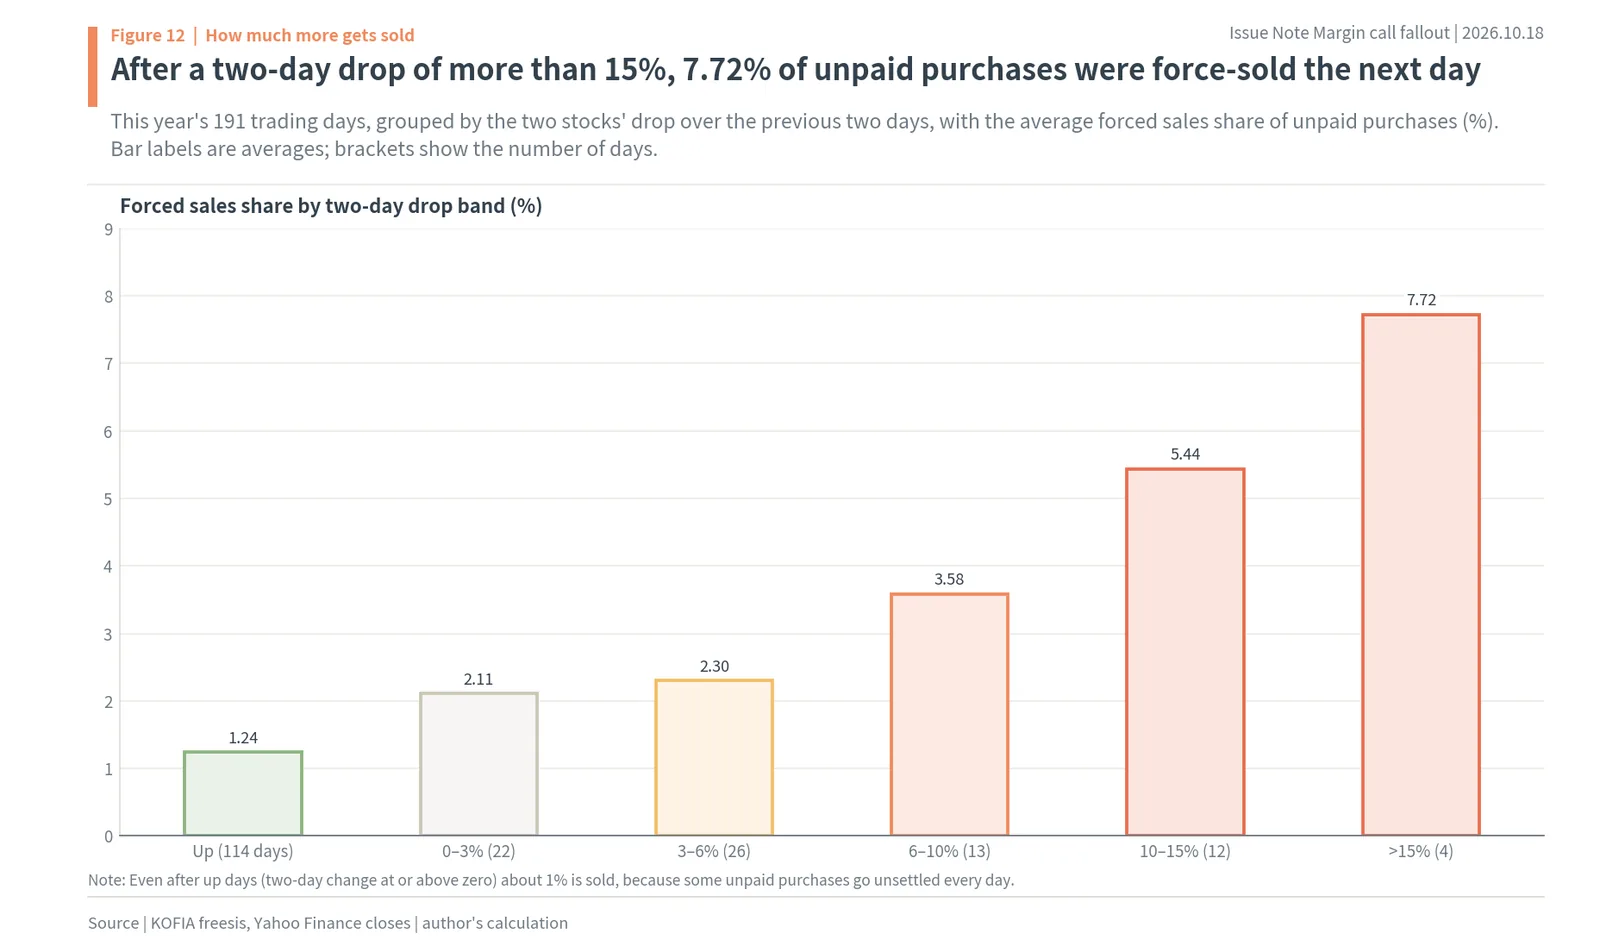
As Figure 12’s title says, after a two-day drop of more than 15%, 7.72% of unpaid purchases were force-sold the next day. The bars get steeper to the right: the bigger the fall, the more forced selling each extra unit of decline brings. This is the threshold chain from the previous chapter showing up in numbers.
This calculation uses only unpaid-purchase forced sales. Amounts sold because of margin-loan collateral shortfalls are not published daily, so they are not in these numbers. Data from lawmaker Kang Jun-hyeon’s office put margin and stock-backed loan forced sales at 0.65 times unpaid-purchase forced sales from January to July, so total forced selling is best taken as a little more than 1.6 times these figures. At what prices that margin-loan debt was built up is calculated separately in the next chapter.
6. New SK hynix debt is already below the line; Samsung sets the next wave
Splitting the debt by purchase price
The previous chapter looked at how unpaid purchases respond. This chapter looks at margin loans, debt held for months. Margin debt becomes dangerous when the stock falls 23% below the purchase price. So when, and at what price, the debt was used to buy is itself the size of the risk.
Margin balances by stock are not published daily, so the author calculated with one assumption. From August 4, the end of the July crash (the KRW 27.4tn trough), to October 14, market-wide margin loans grew by KRW 6.3tn. The author assumed this new debt bought at the price on the day the balance grew (each day’s increase treated as a purchase that day), with the two stocks’ share equal to their 27.3% share on October 14. That puts new debt in the two stocks since August at about KRW 1.72tn (about $1.28bn). Comparing each purchase price with the October 16 close, the author counted how much of that debt is below the margin-call line (a 23% fall) at a 45% down payment and 140% maintenance ratio.
SK hynix 62.3%, Samsung 5.9%
The two stocks came out very differently. 62.3% of the debt used to buy SK hynix since August 4 is already below the line. SK hynix’s October 16 close of KRW 1,272,000 divided by 0.77 is KRW 1,652,000; all debt bought above that price is now more than 23% under water. From late August to early October SK hynix mostly traded between KRW 1.65mn and KRW 1.87mn, and much of the debt was built up in that range. By the same calculation, only 5.9% of the Samsung debt is below the line. Samsung’s alarm price is KRW 279,900, and Samsung did not trade above that on many days after August. For the two stocks combined, about KRW 0.57tn (32.9%) of the new debt is below the line now (author’s calculation).
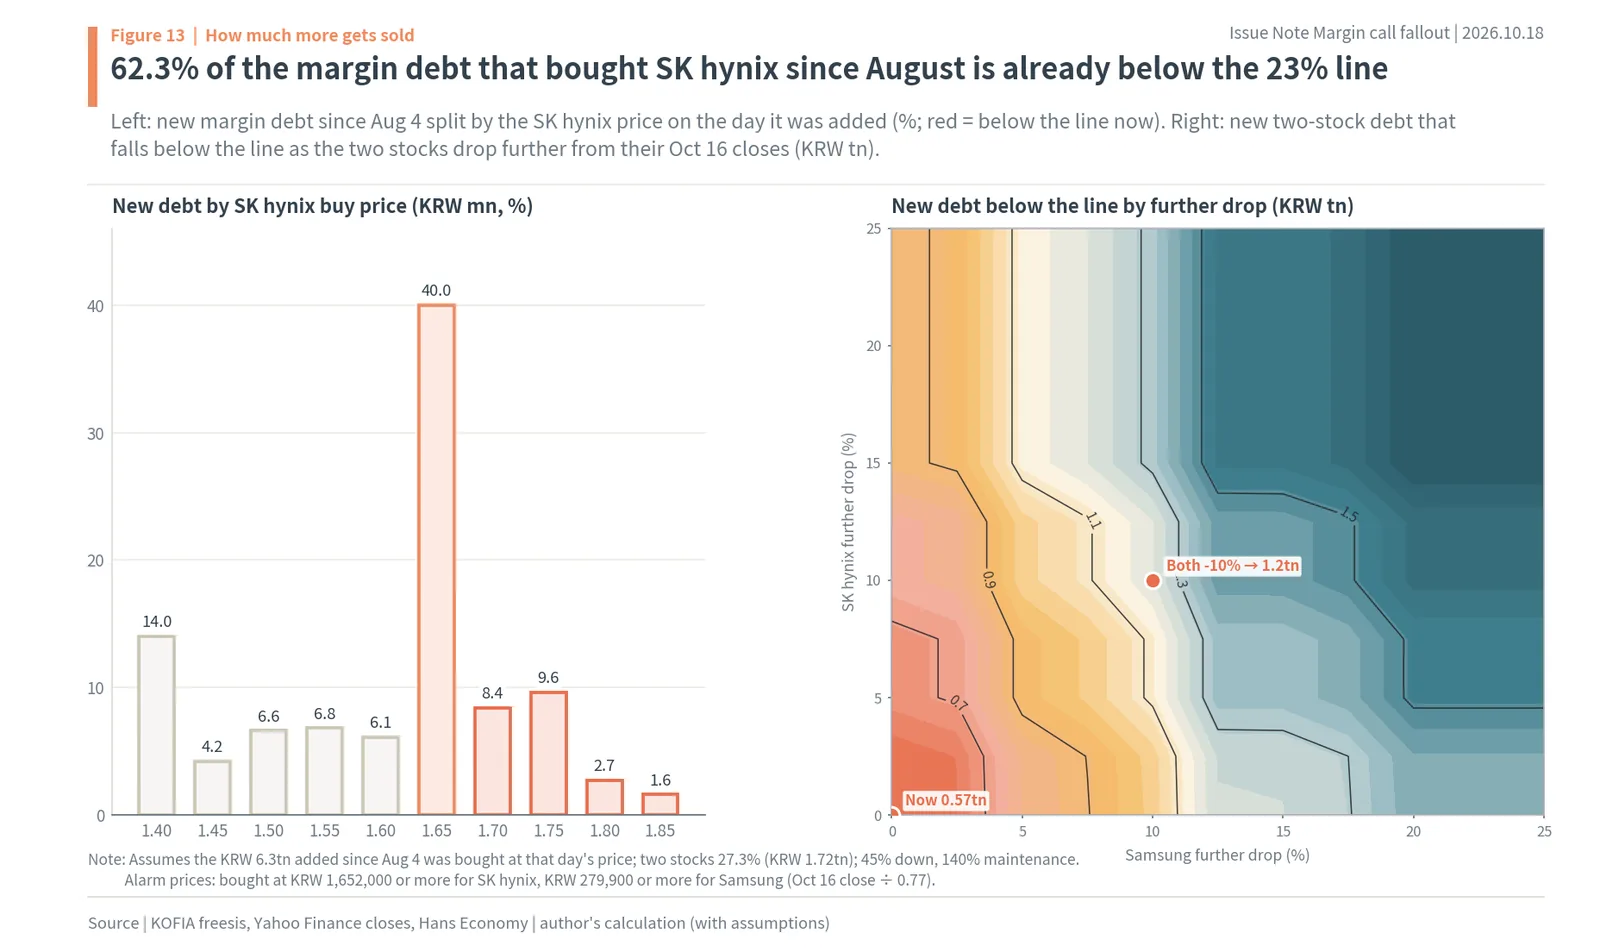
As Figure 13’s title says, 62.3% of the margin debt that bought SK hynix since August is already below the 23% line. The bars on the left split the new debt by SK hynix purchase price band. 40% sits in the KRW 1.65mn band alone, and everything from that band to the right is red. The contour map on the right shows how much of the new two-stock debt falls below the line as both stocks drop further from their October 16 closes.
Change the threshold and the numbers change at once. Applying Samsung Securities’ new terms for Samsung Electronics from October 19, a 50% down payment and 150% maintenance ratio (a threshold of a 25% fall), the new two-stock debt below the line falls from KRW 0.57tn to KRW 0.22tn, and the SK hynix share from 62.3% to 26.3% (author’s calculation). Two points of threshold cut the debt in the alarm zone by more than half. That is why the industry wants a higher down payment.
A surface of further drops
A surface shows what lies ahead. If both stocks fall another 10% from their October 16 closes, 69.9% of the new two-stock debt (KRW 1.2tn) goes below the line. At 20% each, all KRW 1.72tn does. But which stock falls matters. With 62.3% of the SK hynix debt already below, a further SK hynix fall adds relatively little. More than 94% of the Samsung debt is still above the line, so every step Samsung falls brings more debt below it.
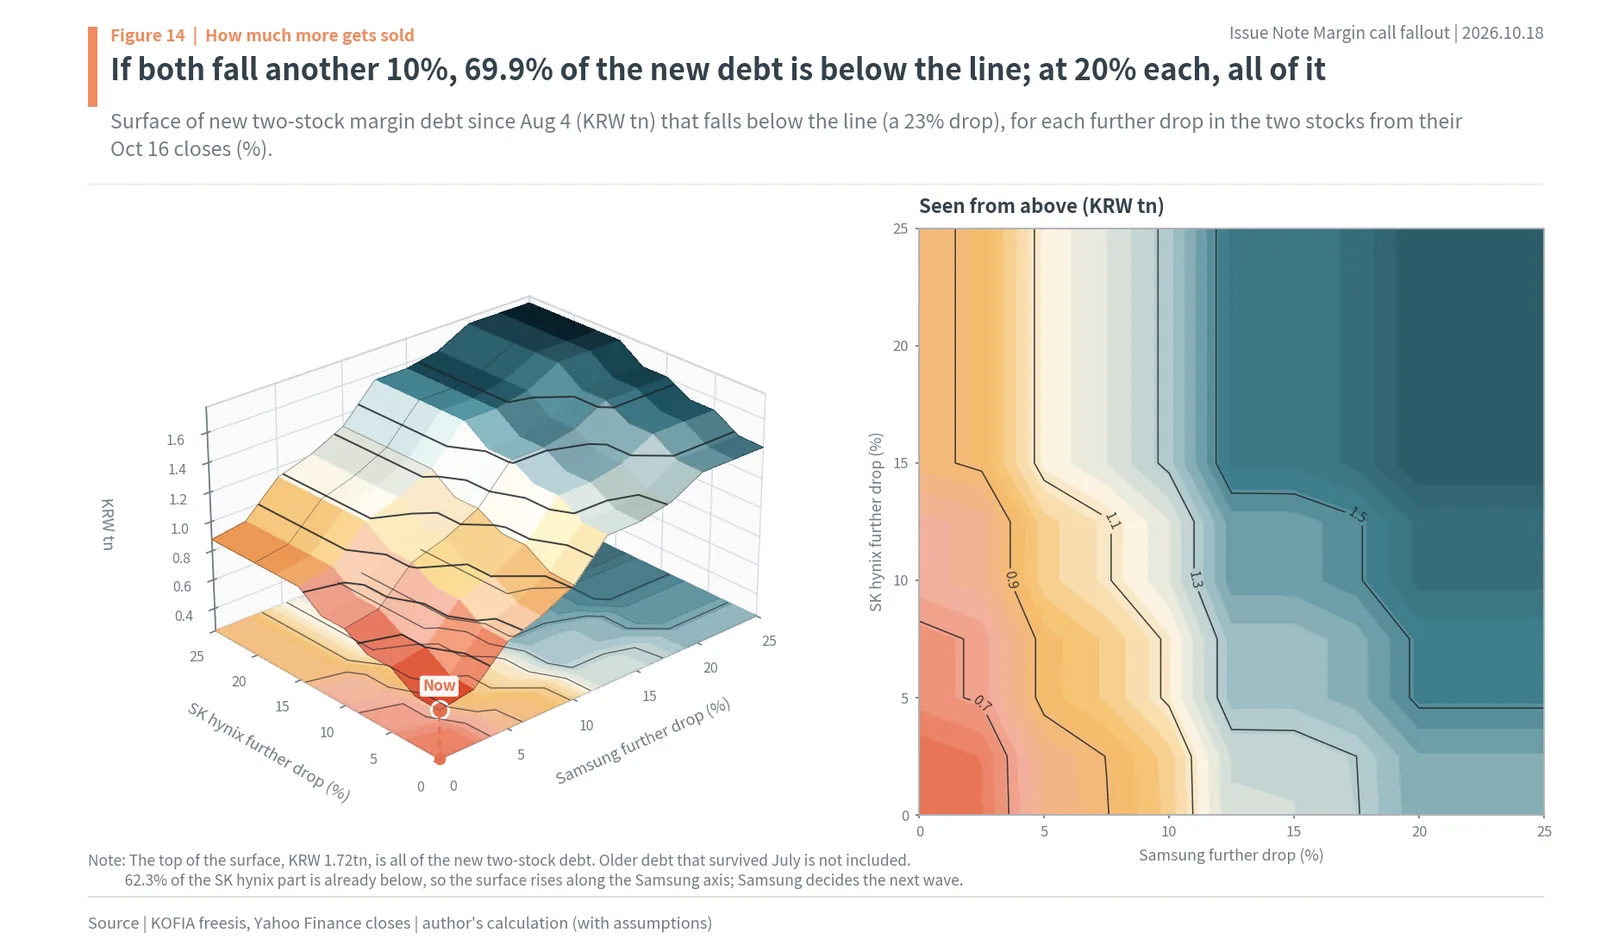
As Figure 14’s title says, if both fall another 10%, 69.9% of the new debt is below the line, and at 20% each, all of it. On both the surface and the contour map, the color changes fastest along the Samsung (horizontal) axis. How much further Samsung falls decides the size of the next wave of forced selling.
This calculation leaves out older debt that survived July (about KRW 7.5tn in the two stocks). That debt’s line is below the July low. SK hynix has already broken that low; Samsung is 4.11% above it. If Samsung breaks its July low, far more debt outside this surface enters the alarm zone. That is why the number the author watches most in this sell-off is KRW 207,000 (about $154) for Samsung Electronics.
7. Margin debt grows first, then sells past the threshold
“How much does margin debt grow when prices fall?”
You might expect margin debt to shrink when prices fall, but at first it does the opposite. Buying the dip with borrowed money, what Korean investors call “water-pouring” (averaging down), comes first. Debt shrinks only after the fall deepens and crosses the threshold. The author took every week (5 trading days) from January 2025 to October 15, 2026 in which the two stocks fell, grouped them by how far the two stocks were below their 60-trading-day high, and averaged the change in margin loans in each group.
In weeks when the two stocks were within 5% of their high, margin loans grew by an average of KRW 220bn (1.06%) a week. In weeks 5-10% below, they grew KRW 100bn (0.50%). In weeks 10-20% below, they barely moved (KRW 10bn). In weeks 20-30% below, they fell KRW 460bn (1.24%), and in weeks more than 30% below, they fell KRW 240bn (author’s calculation). The point where debt stops growing and starts shrinking is right around 20%, near the 23% margin-call threshold.
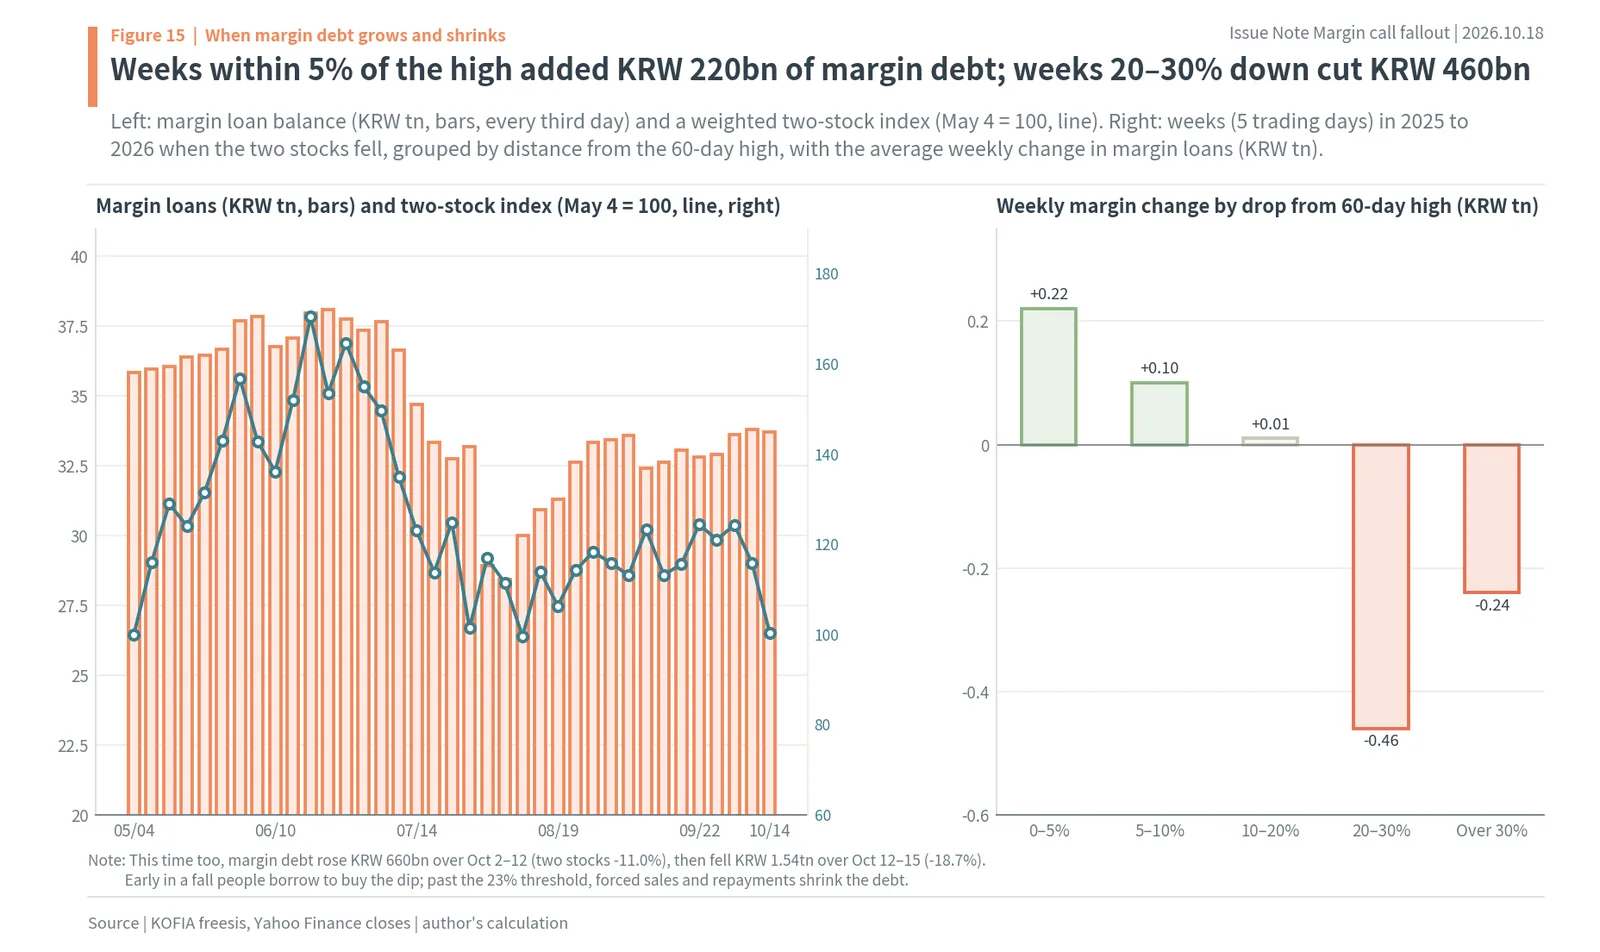
As Figure 15’s title says, weeks within 5% of the high added KRW 220bn of margin debt, and weeks 20-30% down cut KRW 460bn. The bars on the left are margin loans every third trading day since May, and the line is the weighted two-stock index (May 4 = 100). Line and bars rose together until the June peak; the bars collapsed in the July crash, then rebuilt faster than the line in August. The bars on the right are the averages by band.
October followed the same pattern
October followed that shape exactly. From October 2 to 12, while the weighted two-stock index fell 11.0%, margin loans rose KRW 660bn, from KRW 33.63tn to KRW 34.29tn. Debt that saw the falling price as a chance came in. From October 12 to 15, as the two stocks fell another 18.7%, margin loans dropped KRW 1.54tn to KRW 32.75tn: the newly added debt crossed the threshold and left through forced sales and repayments. On October 15 the two stocks were 29.2% below their 60-trading-day high.
July was the same. Margin loans fell KRW 10.39tn from July 3 to August 4, and then KRW 5.85tn came back in August alone. More than half of the debt the crash unwound returned within a month. The threshold flushes debt out, but the debt comes back quickly. That is why forced selling spiked three times this year.
More borrowing now means bigger forced sales later
This pattern gives two answers to “how much will margin debt grow?” First, debt grows early in a fall: KRW 220bn a week when the two stocks are within 5% of their high. Second, that debt was bought at high prices near the peak, so it is the first to reach the threshold in the next leg down. The finding that 62.3% of new SK hynix debt since August is already below the line is the same story. Dip-buying early in a fall becomes the raw material for forced selling in the next stage.
Unpaid purchases went the same way. The unpaid balance of KRW 931.6bn on October 7 became KRW 1,392.6bn on October 15 as the fall continued. More people bought on credit during the fall, and credit not paid for at settlement turns straight into morning forced sales.
8. Economy: losses pile up in indebted accounts rather than spreading
KRW 61.1tn of stock bought on margin, KRW 10.58tn of paper losses in two weeks
To see the economic size of margin debt, look not at the money borrowed but at the stock it bought. Margin loans stood at KRW 33.63tn on October 2. At a 45% down payment, each won borrowed bought KRW 1.82 of stock, so the stock bought on margin was worth KRW 61.1tn (about $45.6bn). Applying the KOSPI’s change from October 2 to 16 (-19.07%) to the KOSPI part of the margin balance, and the KOSDAQ’s change (-11.03%) to the KOSDAQ part, the paper loss on that stock is about KRW 10.58tn (about $7.89bn). Of that, the KRW 16.7tn of stock bought with the KRW 9.21tn of debt in Samsung Electronics (-21.92%) and SK hynix (-30.91%) lost about KRW 4.39tn (author’s calculation, assuming a 45% down payment).
That loss is small next to the drop in the KOSPI’s market value over the same period (KRW 5,774.7tn on October 2 to KRW 4,581.2tn on October 15, a fall of KRW 1,193.5tn, about $890bn). But the weight is different. The market-value loss is spread across 14.42 million individual shareholders plus foreign and institutional investors. The margin paper loss lands on accounts whose own money is only 45% of what they bought. A 10% fall wipes out 22% of the investor’s money, a 23% fall wipes out half, and at that point the shares are force-sold and the paper loss becomes a real one.
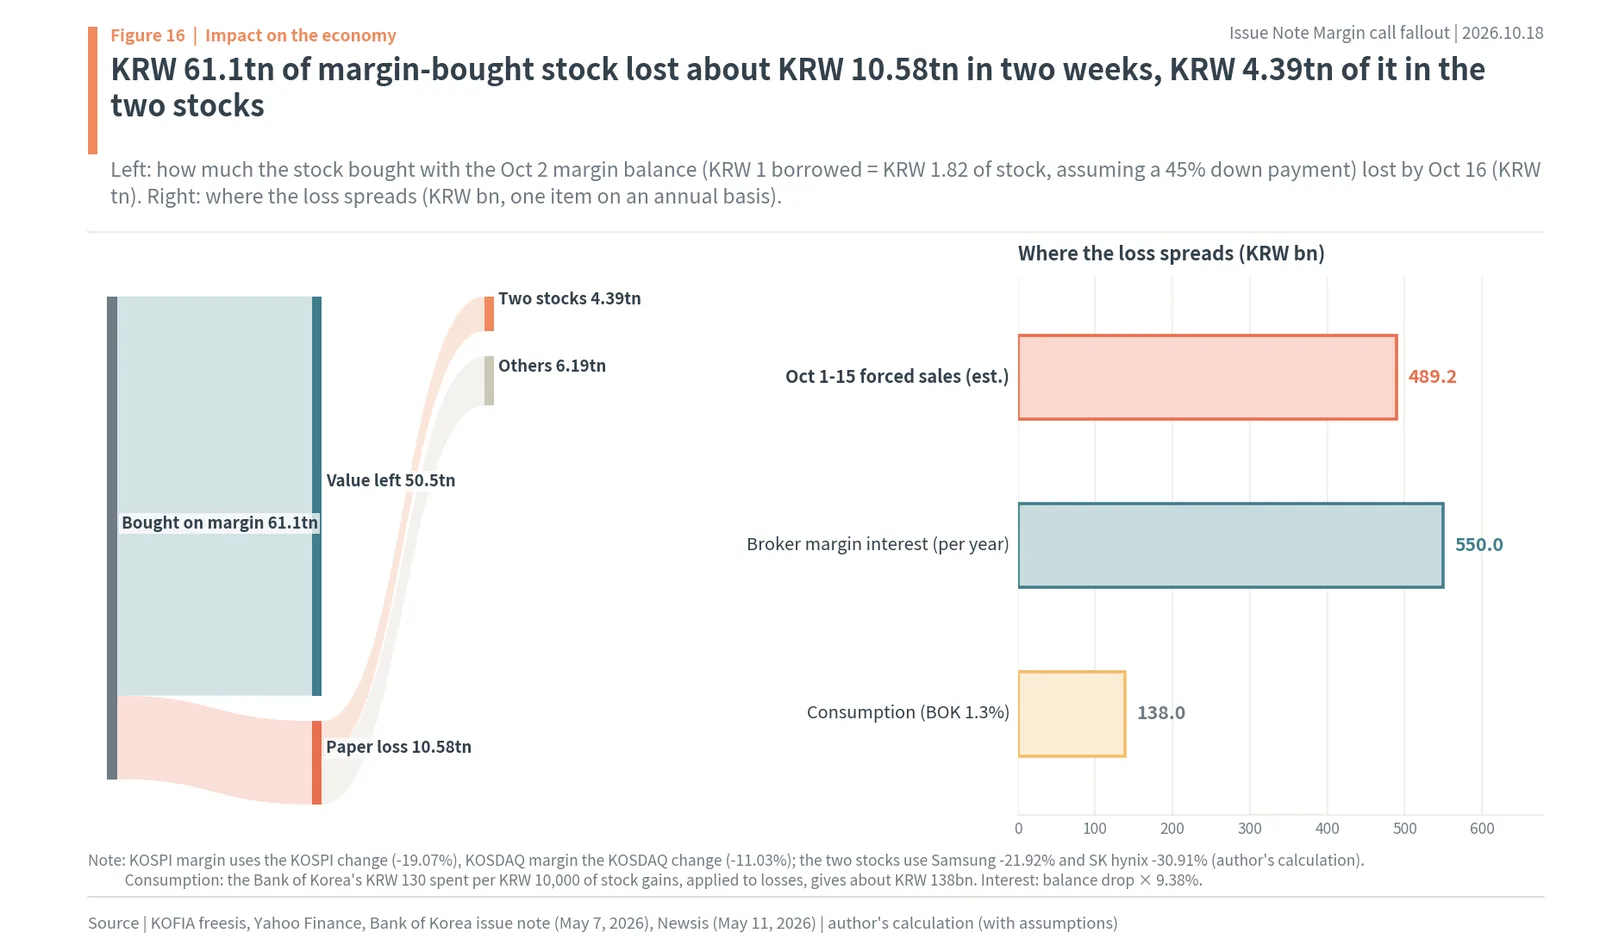
As Figure 16’s title says, KRW 61.1tn of margin-bought stock lost about KRW 10.58tn in two weeks, KRW 4.39tn of it in the two stocks. The flow chart on the left splits the KRW 61.1tn into KRW 50.5tn of value left and KRW 10.58tn of paper losses, and splits the losses into KRW 4.39tn in the two stocks and KRW 6.19tn in the rest. The right panel shows the size of three places the loss spreads to.
Consumption: Korean households spend only 1.3% of stock gains
It is often said that falling stocks cut spending. A Bank of Korea issue note published on May 7, “An Assessment of the Stock Wealth Effect in Korea,” estimated that Korean households spend about KRW 130 of every KRW 10,000 of stock gains (1.3%). That is less than in the United States (3.2%), Germany (3.8%) or Japan (2.2%), because 73.2% of stock assets are held by the top 20% by wealth and a large share of stock gains moves into real estate. Applying the same ratio to losses, the KRW 10.58tn margin paper loss cuts consumption by about KRW 138bn (author’s calculation).
For the economy as a whole, that is not a big number. That is exactly what it says about margin losses: they do not spread thinly across the economy but pile up thickly in indebted accounts. When the Bank of Korea wrote in the same note that a stock correction with leverage such as margin loans built up could lead to a recession, it was looking at the repayment burden of indebted households rather than total spending. Data from lawmaker Kang Jun-hyeon’s office show that in the first half alone, 4,270 unpaid-purchase accounts and 1,541 margin-loan accounts were force-sold for more than KRW 100mn each.
There is debt outside the brokers too. Stock loans from capital companies and others, secured on brokerage accounts, were about KRW 1.6tn at the end of January, up from KRW 1.2tn at the end of May 2025, and can lend up to three times the collateral value. Peer-to-peer stock loans reached KRW 898.3bn at the end of June, up 71.5% from the end of 2025, and regulators capped monthly new lending from July 16. Brokers’ stock-backed loans (cash borrowed against shares held) averaged KRW 25.97tn a day in the second quarter. None of this shows up in KOFIA’s forced-sale numbers, but because the collateral is the same stocks, it moves the same way in the same fall. The Bank of Korea’s September financial market report said a KRW 2.3tn drop in banks’ other household loans was partly due to less stock investing by individuals.
Market: sell orders in the morning auction
Forced selling leaves a mark on the market, because it arrives as a burst of sell orders in the next morning’s auction. The KRW 80.5bn of unpaid-purchase forced sales on October 15 was 0.28% of that day’s KOSPI turnover of KRW 28.64tn. That is small for the whole day, but it is packed into the narrow window of the pre-open auction. Brokers set the quantity at 15-30% below the previous close, and the orders come in regardless of price. A lower open cuts the collateral ratio of accounts still short of the threshold, and those accounts become the next morning’s sell orders. Mirae Asset Securities’ move to push back the payment deadline for clients trying to avoid forced sales by 20 minutes from October 19, from 8:30 a.m. to 8:50 a.m. when the auction starts, is meant to ease that morning pressure.
Brokers: less interest income, and late forced sales become losses
For brokers, margin debt is an interest business. The 10 largest brokerages’ average margin loan rate (for loans over 90 days) is 9.38%. Their margin loan interest income in the first quarter was about KRW 600bn, 13.8% of first-quarter net profit. With margin loans down KRW 5.88tn, from KRW 38.63tn on June 24 to KRW 32.75tn on October 15, annual interest at the average rate falls from KRW 3.62tn to KRW 3.07tn, about KRW 550bn (about $410mn) less (author’s calculation).
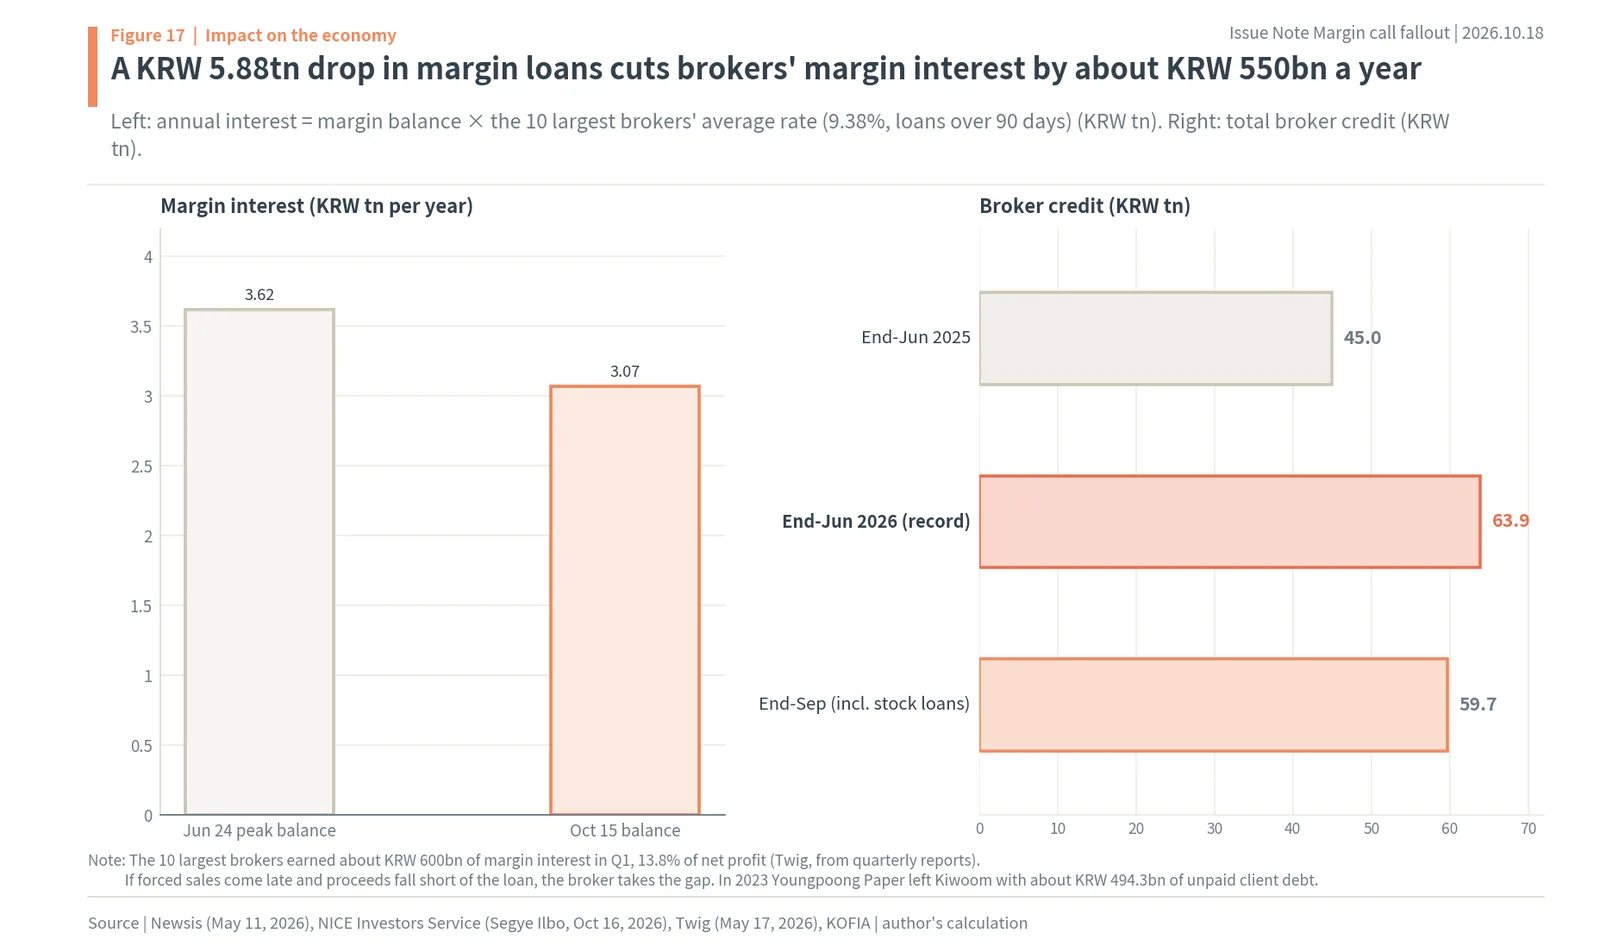
As Figure 17’s title says, a KRW 5.88tn drop in margin loans cuts brokers’ margin interest by about KRW 550bn a year. The right panel shows the size of broker credit. By NICE Investors Service’s count, the securities industry’s credit grew from KRW 45tn at the end of June 2025 to KRW 63.9tn at the end of June 2026, 60.4% of equity, and margin loans plus stock-backed loans were KRW 59.7tn at the end of September.
A bigger risk than lost interest is forced selling that comes too late. If a stock is stuck at the lower limit and cannot be sold, the proceeds fall short of the loan and the gap (an uncollected receivable) becomes the broker’s loss. When Youngpoong Paper was suspended in 2023, Kiwoom Securities was left with about KRW 494.3bn of client receivables. NICE Investors Service judged that such losses are unlikely to hit all at once in Samsung Electronics and SK hynix, given how heavily they trade, but wrote that delayed forced sales could cause losses beyond investors’ down payments. Margin debt concentrated in two stocks also means the collateral and the risk sit in the same stocks.
9. Politics: from delay to tightening
In 2020 and 2022, forced selling was delayed
When forced selling surged in the past, the government’s first card was delay. On March 13, 2020, as it banned short selling during the COVID-19 crash, the Financial Services Commission (FSC) waived the margin maintenance requirement from March 16 to September 15. Brokers no longer had to sell right away when an account fell below 140%. In 2022, during the rate-hike sell-off, it granted the same waiver from July 4 to September 30, and on September 23 extended it to the end of the year.
On the ground, the effect was small. In both 2020 and 2022, most brokers delayed forced sales by only about a day, because of the risk of absorbing losses. Broker credit fell 35.7% in 14 trading days, from KRW 10.03tn on March 12, 2020 to KRW 6.53tn on March 30. Delay only switched off the alarm for a while; the debt unwound anyway.
In 2026, the door to margin debt is being narrowed
This year the direction is the opposite. After single-stock leveraged ETFs and ETNs on Samsung Electronics and SK hynix listed on May 27 and volatility jumped, new listings were halted on July 16, and from July 31 buying these products required a KRW 30mn cash deposit and prior training. On September 23, KOFIA and the 10 large brokerages announced self-regulation keeping margin lending on any one stock within 15% of a broker’s total margin book. The cap on broker credit was cut from the full amount of equity to 90% of equity from October 1, and raising the minimum down payment from 45% to 50% is targeted for this year. The 15% per-stock rule starts tomorrow, October 19.
On October 15, the day the KOSPI fell 7.57%, the FSC chairman told an emergency market meeting that “investing that relies on excessive debt and credit is risky” and asked financial firms to hold back on lending. There was no call to delay forced sales. Brokers moved the same way. Samsung Securities raised its down payment for Samsung Electronics from 45% to 50% and its maintenance ratio from 140% to 150% from October 19, Meritz Securities blocked new margin buying of the two stocks, and Hana Securities made the two stocks ineligible for margin trading from October.
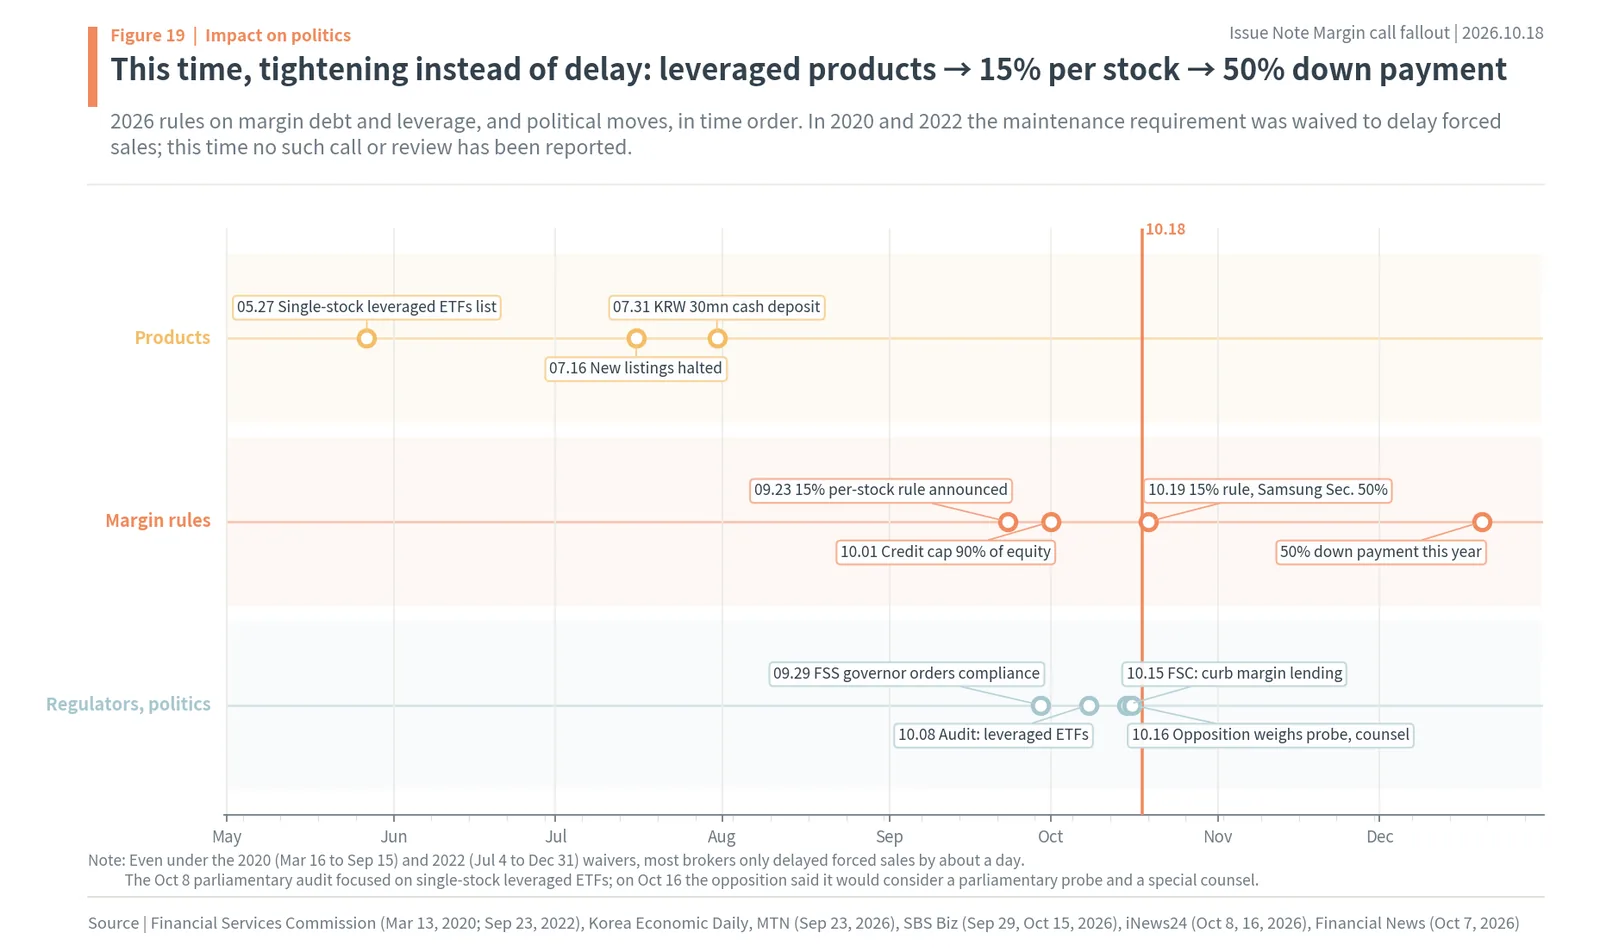
As Figure 19’s title says, this time it is tightening instead of delay: from leveraged-product rules to the 15% per-stock rule and the 50% down payment. The bottom lane is regulators and politics: on September 29 the FSS governor told 23 brokerage CEOs to follow the self-regulation, followed by the October 8 parliamentary audit, the October 15 FSC meeting, and on October 16 the opposition’s talk of a parliamentary investigation and a special counsel.
The audit and the blame game
The political fight shifted from margin debt itself to who built up the market. At the October 8 audit of the National Assembly’s National Policy Committee, the focus was single-stock leveraged ETFs. The FSC chairman said he was “sorry” but disagreed that it was a policy failure, and dismissed an estimate attributed to a foreign investment bank of about KRW 54tn in retail losses as unofficial commentary. Lawmakers from the opposition People Power Party pointed out that the listing review took 29 days, shorter than the 62-day average for ordinary products, and blamed the presidential office. On October 16, People Power Party floor leader Jeong Jeom-sik called the crash the “expensive bill” for a reckless push to lift the stock market and said the party would consider a parliamentary investigation and a special counsel. I could not find an official October statement from the ruling Democratic Party.
This is how forced selling turns into political language. No one is calling for a delay this time because this year’s forced selling is read together with the controversy over leveraged products and encouraging debt-fueled investing. Any step that lets debt hold on longer would struggle to escape the criticism that it fuels margin debt again.
Abroad: after crashes, the rules changed
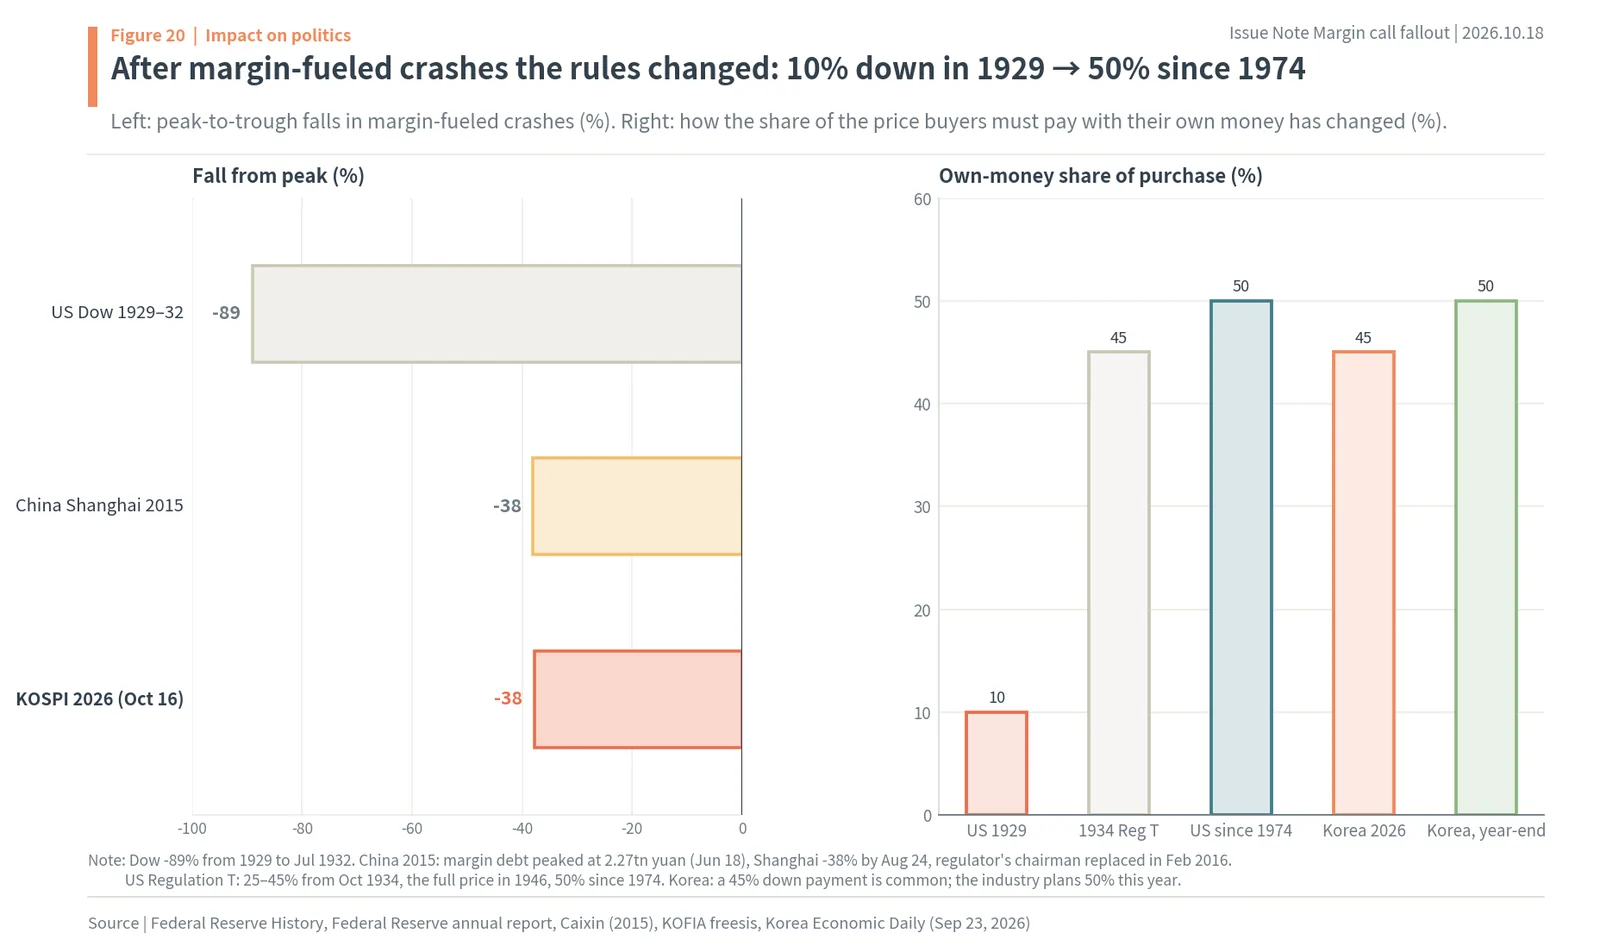
As Figure 20’s title says, after margin-fueled crashes the rules changed. America, where buyers paid 10% of the price in 1929, let the Fed set that share through Section 7 of the Securities Exchange Act of 1934. Regulation T started at 25-45% on October 1, 1934, required buyers to pay the full price with no borrowing from January 1946, and has been fixed at 50% since January 1974. In China in 2015, margin debt peaked at 2.27tn yuan on June 18, and the Shanghai Composite fell 38% from 5,178 on June 12 to 3,209.91 on August 24. The government propped up the market with a pledge by 21 brokers to buy at least 120bn yuan, buying by the “national team” (860bn to 900bn yuan through early August, by a Goldman Sachs estimate), a ban on large shareholders selling, and trading halts, and the head of the China Securities Regulatory Commission was replaced in February of the following year. On July 8 China banned shareholders with more than 5% and executives from selling for six months, and about 1,300 listed companies halted trading that day. A circuit breaker introduced on January 1, 2016 was triggered twice in four days and then suspended. US researchers (NBER, 2018) found that fire sales by accounts near their leverage limits deepened China’s 2015 crash.
The bars on the left show the falls: the US Dow -89% from 1929 to 1932, China’s Shanghai index -38% in 2015, and the KOSPI -37.81% in 2026 (from the June high to October 16). The bars on the right show the share buyers must pay with their own money. The bigger the crash, the more the rules moved toward raising that share.
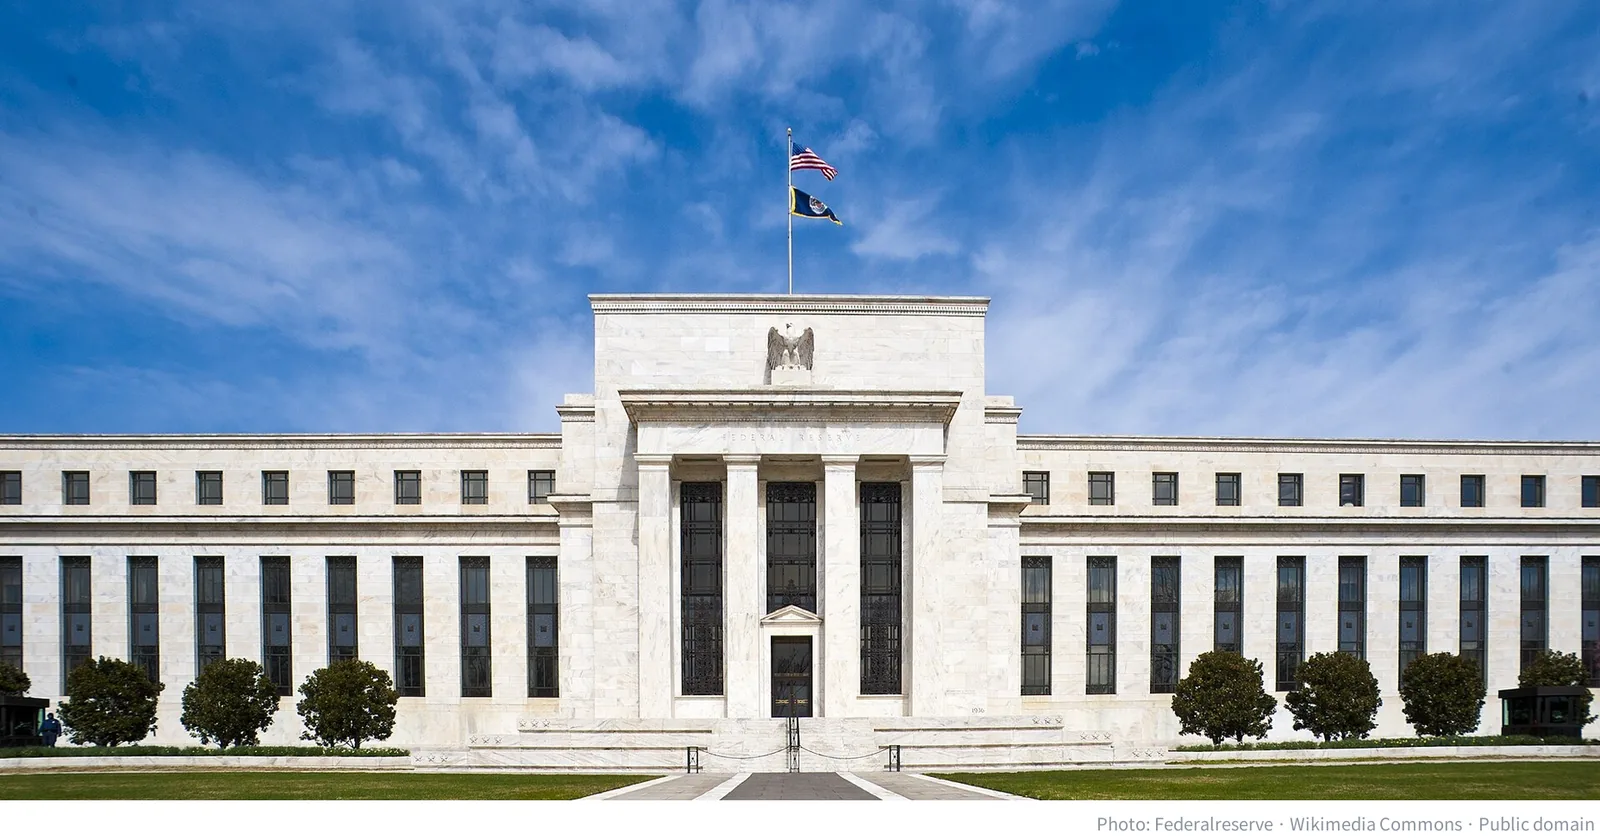
Korea’s tightening this time goes the same way. But in Korea the threshold is being moved not by law but by industry self-regulation and decisions at each broker. When the 50% down payment actually applies at every broker is likely to be the next political question.
10. Culture: margin debt now has an older face and a leveraged one
More than half of forced sales hit people in their 50s and 60s
The face of the 2021 margin boom was people in their 20s and 30s. The Korean words “yeongkkeul” (scraping together every last won, often with loans) and “bit-tu” (investing with debt) spread then. The 2026 numbers show a different face. Data from lawmaker Kim Sang-hoon’s office show that of the KRW 393.5bn of margin-loan forced sales at the 10 largest brokerages in June, KRW 142.0bn hit people in their 50s, KRW 102.9bn their 40s, KRW 67.9bn their 60s, KRW 52.3bn their 30s and KRW 16.3bn those 70 and over. People in their 50s and 60s together took 53.3%. Unpaid-purchase forced sales followed the same order: KRW 288.6bn for people in their 50s, KRW 220.9bn in their 40s and KRW 187.5bn in their 60s.
The fastest growth was among those 70 and over. Their margin-loan forced sales rose 791%, from KRW 1.8bn in January to KRW 16.3bn in June, and the number of accounts force-sold rose 3.3 times, from 357 to 1,174. Data from lawmaker Kang Jun-hyeon’s office show that margin calls in the first half went to 125,558 accounts in their 50s, 98,426 in their 60s and 89,333 in their 40s.
The age of the debt itself has changed too. The share of margin loans held by people aged 60 and over rose from 19.6% in August 2020 to 30.4% in June 2026, while the share held by people in their 20s and 30s fell from 17.1% to 13.3% (the 2020 data cover all brokers and the 2026 data the 10 large brokerages, so the scope differs slightly). At the end of June, margin loans held by people 60 and over at the 10 large brokerages were KRW 9.61tn, including KRW 2.47tn held by those 70 and over.
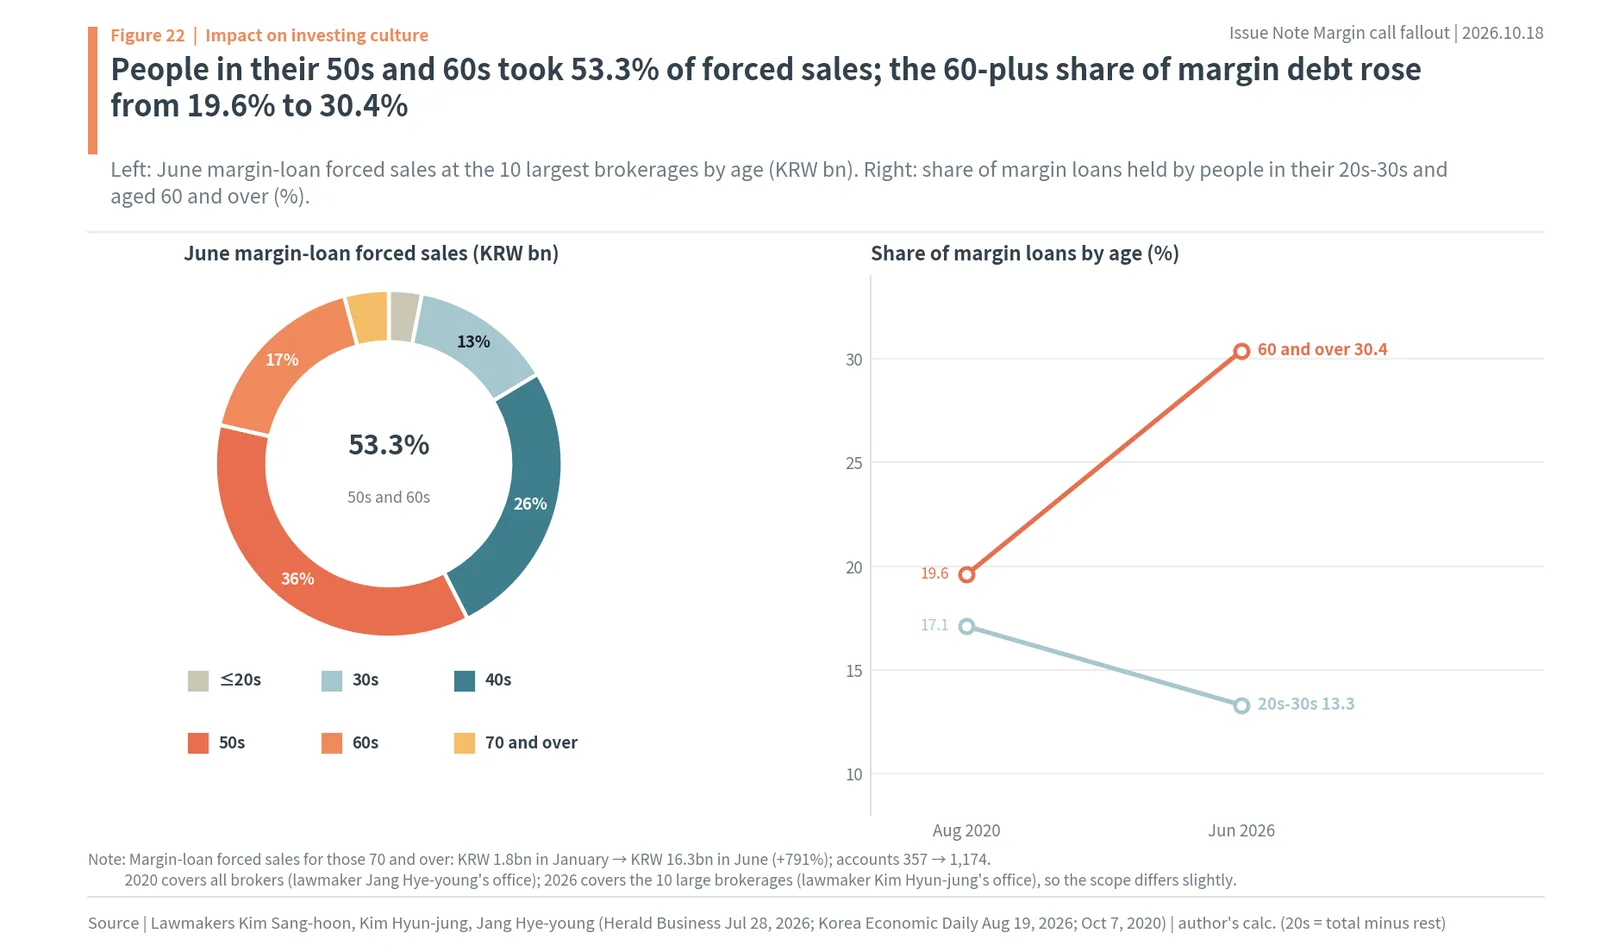
As Figure 22’s title says, people in their 50s and 60s took 53.3% of forced sales, and the 60-plus share of margin debt rose from 19.6% to 30.4%. The donut on the left shows June margin-loan forced sales by age. The slope chart on the right shows the shares of margin loans held by people 60 and over and in their 20s and 30s. The two lines cross and pull apart.
Losses weigh differently on older borrowers. They have less working time left to make up losses, and their retirement savings are often the collateral. That is why the improvement plan the FSS floated in September includes requiring an extra confirmation when older investors trade on credit or margin.
Leveraged products: losing and buying again
The other face of this year’s margin culture is leveraged products. On May 27, single-stock leveraged ETFs and ETNs that track twice the daily move of Samsung Electronics or SK hynix listed. Retail investors bought a net KRW 14.71tn of these 14 products through July 28. FSS data (via lawmaker Choi Eun-seok’s office) show retail investors realized KRW 2.32tn (about $1.73bn) of losses on them from May 27 to August 14.
The buying did not stop after the losses. On October 15, when the KOSPI fell 7.57%, the two stocks’ leveraged products fell 19-22%, and retail investors still bought a net KRW 67bn of them that day. In the KOSPI cash market that day, retail investors bought a net KRW 1.39tn (about $1.04bn) and foreigners sold a net KRW 3.76tn. From October 1 to 14, retail investors bought a net KRW 4.23tn of Samsung Electronics and KRW 2.83tn of SK hynix. Buying more as prices fall, even with borrowed money, has become a habit of Korean retail investing this year. The earlier finding that margin debt grows by KRW 220bn a week when the two stocks are within 5% of their high measures the size of that habit.
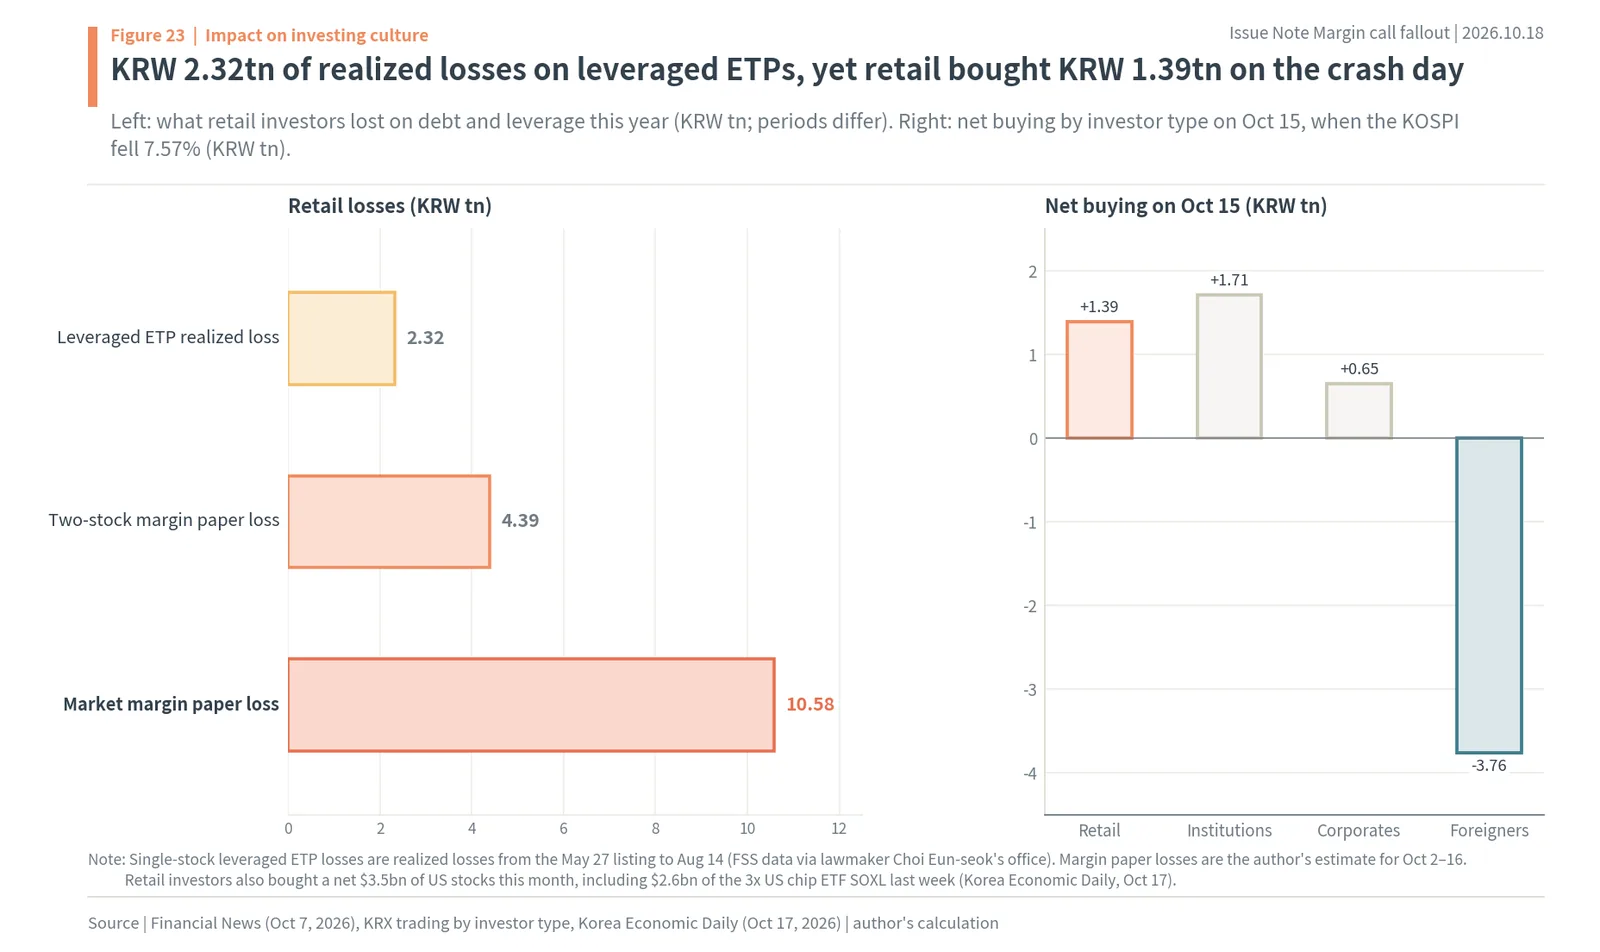
As Figure 23’s title says, retail investors realized KRW 2.32tn of losses on leveraged ETPs, yet bought KRW 1.39tn on the crash day. The left panel shows what retail investors lost on debt and leverage this year (the periods differ). The right panel shows net buying by investor type on October 15: retail and institutions bought, and foreigners sold.
Margin debt has spread to both ends of the age range. Margin loans held by people under 20 rose 152.4%, from KRW 2.1bn at the end of 2025 to KRW 5.3bn at the end of June 2026, and their unpaid-purchase forced sales in the first half were KRW 1.85bn, nearly double the KRW 0.98bn for all of 2025. By the end of August, 807,778 people had completed the training required to buy leveraged products, and about 10% of them (87,367) were 60 or older. Those two numbers are why regulators floated limits on minors’ credit purchases and extra confirmations for older investors at the same time.
From Korean stocks to US leverage
Margin culture has also crossed the border. The Korea Economic Daily reported that retail investors bought a net $3.5bn of US stocks in October so far, including $2.6bn of SOXL, a US 3x leveraged semiconductor ETF, in the past week alone. As the door to margin debt narrows at home, investors look abroad for higher leverage. If the “yeongkkeul” of people in their 20s and 30s went into apartments and crypto, the 2026 margin wave goes into the credit accounts and leveraged products of people in their 50s and 60s. That is why the fallout from forced selling falls hardest on households in their 50s and 60s.
11. The author’s view and dates to watch
Before 23% a result, after it a cause
Linking the numbers so far into one chain: KRW 9.21tn of debt sits in two stocks, and that debt sets off the alarm the moment the stock falls 23% below the purchase price. Accounts that hit the alarm are sold in the next morning’s auction, and those sales push down the opening price and cut into the next account’s collateral. From January to July, 94.01% of margin-called accounts were actually sold: the cash to hold on had run out. So every extra 1%p that the two stocks fell over two days added about KRW 4.5bn of forced sales the next day.
The author’s view is that forced selling is only a result of the fall up to the 23% threshold; past it, the debt becomes a cause that deepens the fall. SK hynix is already below its July low, and 62.3% of its new debt since August is below the threshold. The big debt left is on the Samsung side. How much more Samsung Electronics falls, and especially whether it holds its July low of KRW 207,000, sets the size of forced selling from here. The author’s model says an 18.2% two-day drop in the two stocks pushes daily forced sales above KRW 100bn.
The fallout spreads along this chain. In the economy, KRW 10.58tn of paper losses land on indebted accounts, many of them held by people in their 50s and 60s, and brokers’ margin interest falls by KRW 550bn a year. In politics, unlike the delays of 2020 and 2022, the response has been to narrow the door to margin debt, and the blame over leveraged products has moved to the parliamentary audit and talk of an investigation. In culture, the age of margin debt has risen, and the habit of losing and buying again has moved from Korean leveraged products to US 3x products. From 23% down, the debt does the selling.
Eight signals
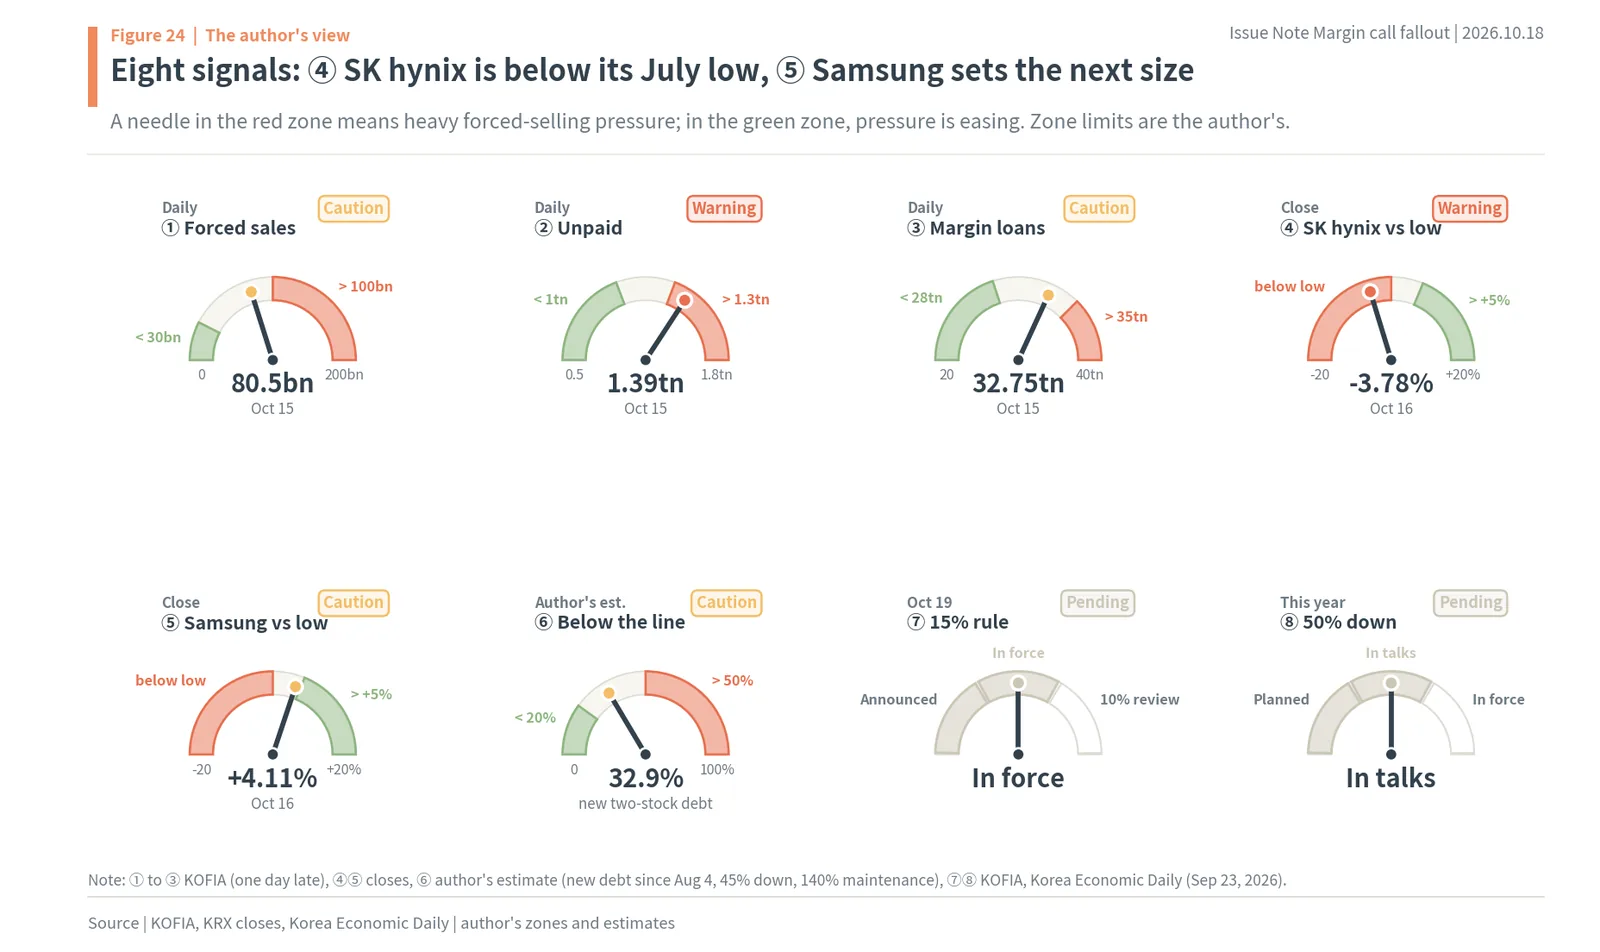
Figure 24 shows the eight signals the author watches. ① Daily forced sales (KRW 80.5bn on October 15), ② the unpaid balance (KRW 1,392.6bn) and ③ margin loans (KRW 32.75tn) come from KOFIA daily, one day late. ④ SK hynix is 3.78% below its July low, in the red zone, and ⑤ Samsung is 4.11% above it, close to the edge. ⑥ is the share of new two-stock debt below the line (32.9%, author’s estimate). ⑦ The 15% per-stock rule takes effect on October 19, and ⑧ the 50% minimum down payment is still under industry discussion. As the title says, ④ SK hynix is below its July low, and ⑤ Samsung decides the next size.
Dates to watch
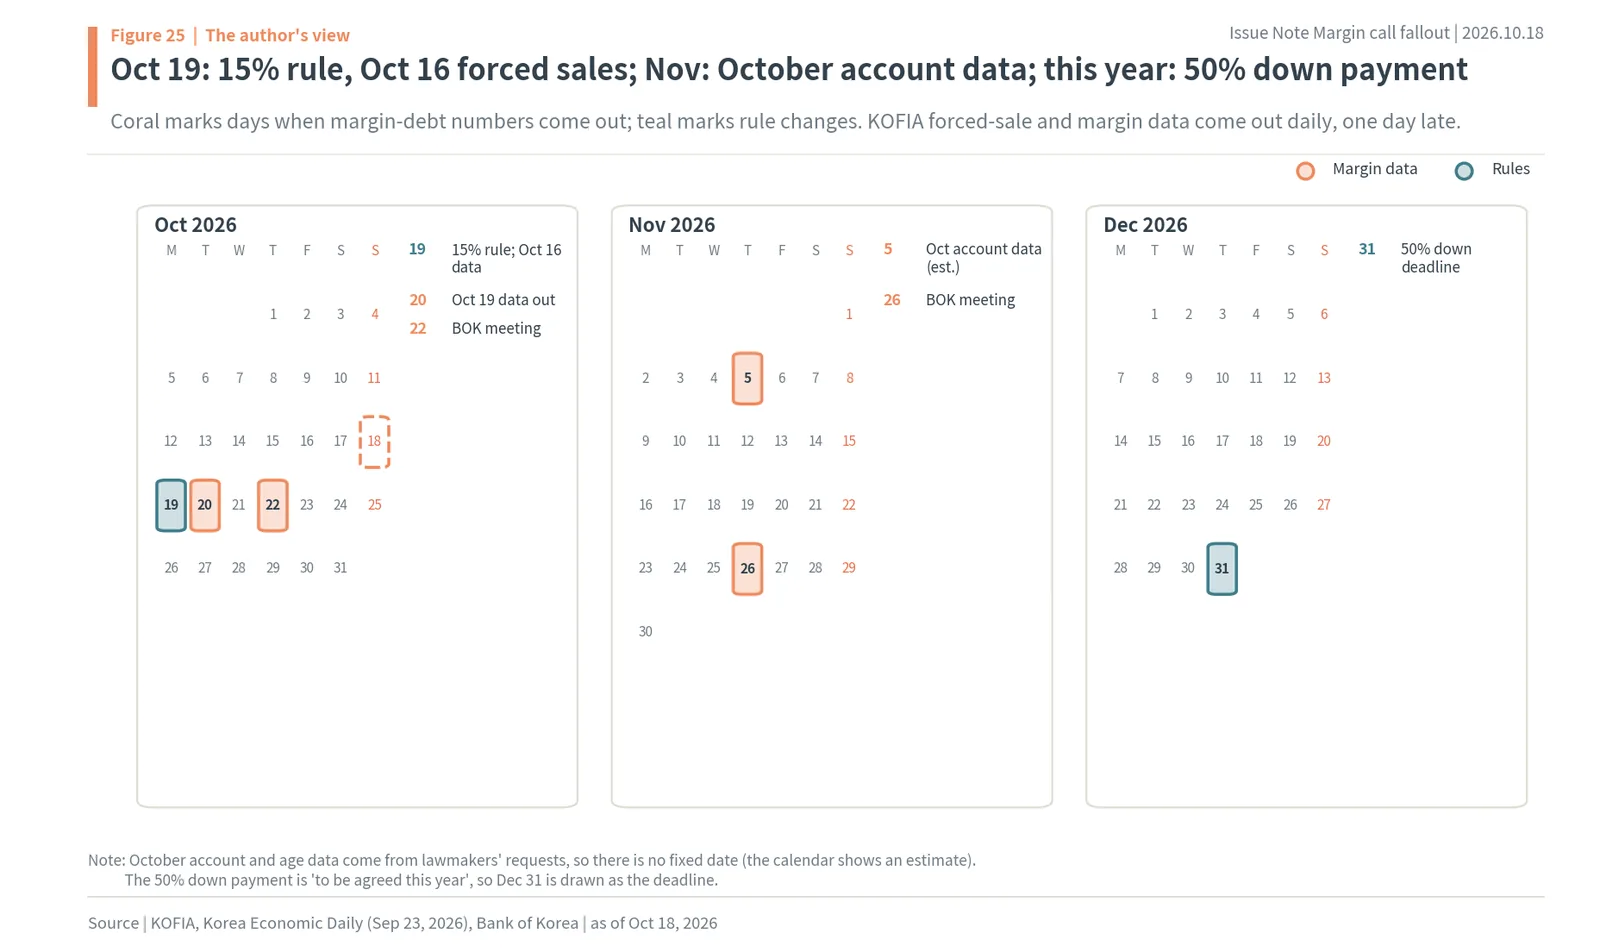
As Figure 25’s title says, the dates to watch are the 15% rule and the release of October 16 forced-sale data on October 19, October account data in November, and the 50% down payment this year. On October 19 the 15% rule starts and KOFIA publishes forced sales and margin loans for October 16. October 19 data come out on October 20. The Bank of Korea’s rate meetings are on October 22 and November 26. October account and age data, released at lawmakers’ request, should come out around early November (an estimate). The 50% minimum down payment is only set for “within the year,” so December 31 is drawn as the deadline.
In 1929 America, the chain of margin debt went beyond the economy to change the law and a generation’s investing habits. Korea’s 2026 chain is still running. Where it stops will be signaled first by one number KOFIA publishes every afternoon, and by one closing price for Samsung Electronics.
12. How the numbers were counted
KOFIA daily data
Margin loan balances (total, KOSPI and KOSDAQ), investor deposits, unpaid purchases, and forced sales of unpaid purchases with their share were downloaded daily from KOFIA freesis from 1998 through October 15, 2026. KOFIA publishes one day late, so October 16 data are not in this report. The forced-sale share is that day’s forced sales divided by the previous day’s unpaid balance, the same as KOFIA’s published figure. The forced-sale amount covers only unpaid purchases; forced sales from margin-loan collateral shortfalls are not published daily. Yearly and monthly totals and daily averages (KRW 25.9bn in 2026, KRW 7.1bn in 2025) are the author’s sums of KOFIA’s daily figures.
Prices and trading
KOSPI, KOSDAQ, Samsung Electronics and SK hynix closes are KRX closes downloaded from Yahoo Finance (through October 16). KOSPI turnover, market value and net buying by investor type come from previously downloaded KRX Information Data System files (through October 16). The July low is the lowest close from July 1 to August 10 (July 30).
Account estimate
Accounts force-sold from October 1 to 15 were estimated from per-account amounts in lawmaker Kim Sang-hoon’s June data for the 10 largest brokerages. Unpaid purchases: KRW 845.9bn ÷ 38,755 accounts = about KRW 21.83mn. Margin loans: KRW 393.5bn ÷ 21,615 accounts = about KRW 18.21mn, and margin-loan amount ÷ unpaid amount = 0.465. KOFIA’s October unpaid-purchase forced sales of KRW 333.9bn ÷ KRW 21.83mn = about 15,300 accounts; margin loans KRW 333.9bn × 0.465 = KRW 155.3bn ÷ KRW 18.21mn = about 8,500 accounts; together about 23,800 accounts and KRW 489.2bn. The same method gives 25,400 margin-loan accounts for July, fewer than the actual 41,761 (lawmaker Kim Hyun-jung’s office), so this estimate is treated as a floor. Accounts are not people.
Sensitivity model 1: two-day drop and next-day forced-sale share
The two stocks’ changes were weighted by their October 14 margin balances (Samsung KRW 4.80tn, SK hynix KRW 4.41tn; Samsung 52.1%). Each day’s forced-sale share was matched with the cumulative change over the previous two trading days (declines only; up days set to zero). The sample is 191 trading days from January 2 to October 15, 2026, and the fitted line is share (%) = 1.274 + 0.325 × two-day drop (%p), R² = 0.47. Amounts use the October 15 unpaid balance of KRW 1,392.6bn, held fixed. The KRW 100bn threshold of 18.2% = (KRW 100bn ÷ KRW 1,392.6bn × 100 – 1.274) ÷ 0.325. The unpaid balance tends to rise during a fall, so actual amounts could be larger.
Sensitivity model 2: purchase prices and the margin-call line
The KRW 6.3tn increase in market-wide margin loans from August 4 (the KRW 27.4tn trough) to October 14 was assumed to have bought at each day’s price, in proportion to that day’s increase. The two stocks’ share was set equal to their 27.3% share on October 14 (KRW 1.72tn of new debt), split between them by margin balance (Samsung 52.1%). The line assumes a 45% down payment and a 140% maintenance ratio (a 23% fall from the purchase price), so the alarm price = October 16 close ÷ 0.77. The surface varies each stock’s further drop from 0% to 25% in steps of 2.5 points. Older debt that survived July (about KRW 7.5tn in the two stocks) and accounts that added collateral are not included. At 50% and 150% (a 25% fall), new debt below the line is KRW 0.22tn.
Debt cycle
Weeks from January 2025 to October 15, 2026 in which the two stocks fell (a negative 5-trading-day change) were grouped by the weighted two-stock index’s distance from its 60-trading-day high, and the change in margin loans over those 5 trading days was averaged.
Paper losses, consumption and interest
Stock bought on margin = October 2 margin balance ÷ 0.55 (a 45% down payment). The KOSPI part of the margin balance uses the KOSPI’s change from October 2 to 16, the KOSDAQ part the KOSDAQ’s, and the two stocks’ part each stock’s change. Consumption applies the Bank of Korea’s estimate (about KRW 130 spent per KRW 10,000 of stock gains) equally to losses. Broker interest = margin balance × the 10 largest brokers’ average rate of 9.38% (loans over 90 days, May 2026).
What was not used
Official October account and age data, daily margin-loan forced sales and daily margin balances by stock are not published and were not used. The 2020 and 2026 age shares of margin loans cover different scopes (all brokers vs the 10 large brokerages) and were used only to compare magnitudes.
Maochaedung’s summary. This wave of forced selling broke out when the cash to hold on had run out: 94.01% of accounts that got a margin call from January to July were actually sold. From October 1 to 15 alone, at least about 23,800 accounts were force-sold, and each extra 1%p that the two stocks fell over two days added about KRW 4.5bn of forced sales the next day (author’s calculation). KRW 9.21tn of debt sits in two stocks, and 62.3% of new SK hynix debt is already past the 23% threshold, so Samsung sets the next size. Losses pile up in indebted accounts of people in their 50s and 60s and in brokers’ interest income, and the government chose tightening over delay. From 23% down, the debt does the selling.
Korea’s margin call wave: quick answers
Q. How many Korean accounts were liquidated by forced selling?
Lawmakers’ data from the 10 largest brokerages show 60,370 accounts force-sold in June (margin loans plus unpaid purchases) and 41,761 margin-loan accounts in July. From January to July, 688,894 accounts got a margin call and 94.01% of them ended in a forced sale, up from 54.05% in 2021. For October 1 to 15 the author estimates at least about 23,800 accounts and KRW 489.2bn. Accounts are not people, since one person can hold several accounts.
Q. How big is this wave of forced selling by historical standards?
KOFIA’s forced sales of unpaid purchases total KRW 4.94tn this year through October 15, second only to 2023 (KRW 9.85tn, inflated by the Youngpoong Paper trading halt) and above 2021’s KRW 4.90tn. June 2026 (KRW 1,122.9bn) and July 2026 (KRW 992.8bn) are the 4th and 5th biggest months since 1998. The daily average this year is KRW 25.9bn, 3.6 times 2025. Margin-loan forced sales are not published daily, so the true total is larger.
Q. How much more is force-sold for each 1%p drop in Samsung and SK hynix?
Across 191 trading days this year, each extra 1%p fall in the two stocks over two days added 0.325%p of the unpaid balance to the next day’s forced sales (R² 0.47), about KRW 4.5bn at the October 15 unpaid balance of KRW 1,392.6bn (author’s calculation). An 18.2% two-day drop would push daily forced sales above KRW 100bn. In October actual forced sales ran above this line.
Q. Why does Samsung Electronics now decide the size of the next wave?
With a 45% down payment and a 140% maintenance ratio, a margin call comes at a 23% fall from the purchase price. The author estimates that 62.3% of new SK hynix margin debt since August 4 is already below that line, against 5.9% for Samsung, and SK hynix has already broken its July low while Samsung is 4.11% above its July low of KRW 207,000. If both stocks fall another 10%, 69.9% of the new two-stock debt goes below the line.
Q. What are the effects on Korea’s economy, politics and investing culture?
Economy: stock bought on margin lost about KRW 10.58tn in two weeks, concentrated in indebted accounts, while the consumption effect is about KRW 138bn and brokers’ margin interest falls about KRW 550bn a year (author’s calculations). Politics: unlike the maintenance waivers of 2020 and 2022, regulators are tightening, with a 15% per-stock cap from October 19 and a 50% down payment planned, and the opposition is weighing a probe. Culture: people in their 50s and 60s took 53.3% of June margin-loan forced sales, and retail investors kept buying leveraged products after KRW 2.32tn of losses.
Sources
- Federal Reserve History, Stock Market Crash of 1929 (link), Nov 22, 2013
- Machlup, The Stock Market, Credit and Capital Formation, Appendix C (link)
- Federal Reserve annual report, margin requirements table (link)
- Korea Financial Investment Association (KOFIA) freesis, market funds and credit balances (link), through Oct 15, 2026
- Herald Business, lawmaker Kim Sang-hoon’s data on forced sales by age and account (link), Jul 28, 2026
- Korea Economic Daily, lawmaker Kim Hyun-jung’s data on July margin forced sales and margin balances by age (link), Aug 19, 2026
- Aju Business Daily, lawmaker Kang Jun-hyeon’s data on margin calls and forced-sale rates (link), Sep 1, 2026
- Aju Business Daily, lawmaker Kang Jun-hyeon’s data on KRW 4.82tn of forced sales from January to July (link), Sep 2, 2026
- Seoul Economic Daily, lawmaker Park Sung-hoon’s data on daily margin and collateral forced sales (link), Sep 2, 2026
- Hans Economy, Samsung Electronics and SK hynix margin balances (link), Oct 15, 2026
- Segye Ilbo, NICE Investors Service review of broker credit (link), Oct 16, 2026
- SBS Biz, Samsung Securities, Meritz and Hana margin measures (link), Oct 15, 2026
- SBS Biz, FSC emergency market meeting (link), Oct 15, 2026
- Korea Economic Daily, KOFIA and 10 brokers’ margin loan self-management plan (link), Sep 23, 2026
- Segye Ilbo, People Power Party floor leader’s remarks (link), Oct 16, 2026
- iNews24, parliamentary audit on single-stock leveraged ETFs (link), Oct 8, 2026
- Financial Services Commission, 2020 market stabilization measures (link), Mar 13, 2020; 2022 extension of the maintenance waiver (link), Sep 23, 2022
- Hankyung Business, Bank of Korea issue note on the stock wealth effect (link), May 7, 2026
- Newsis, broker margin loan rates (link), May 11, 2026
- Twig, 10 largest brokers’ margin interest income (link), May 17, 2026
- Financial News, retail losses on single-stock leveraged ETPs (link), Oct 7, 2026
- Newsis, Youngpoong Paper forced-sale counting (link), Oct 23, 2023
- Smart Today, Mirae Asset’s later payment deadline (link), Oct 16, 2026
- Korea Economic Daily, retail net buying of US stocks and SOXL (link), Oct 17, 2026
- Caixin/ChinaFile, How Beijing Intervened to Save China’s Stocks (link), Jul 20, 2015
- NBER Working Paper 25040, Leverage-Induced Fire Sales and Stock Market Crashes (link), 2018
- KRX Information Data System (KOSPI trading by investor type), Yahoo Finance (closes and USD/KRW), through Oct 16, 2026
- Photos: Associated Press (public domain), hyolee2 (CC BY-SA 3.0), Rob Bulmahn (CC BY 2.0), Cjb8293 (CC BY-SA 4.0), Federalreserve (public domain), Sergiy Galyonkin (CC BY-SA 4.0), Wikimedia Commons
Was this note useful?
Thanks. Your answer helps decide what to cover next.
Korea market snapshot · Oct 23, 2026
New to Korean stocks? Start here for the basics.
Most read
1France Protests 2026: Why Students Are Blocking Schools and Which Stocks Benefit (Munich Re, SCOR)
Get the Saturday note on Korean stocks
One email every Saturday with the week’s new research on Korean listed companies and links to the updated data pages. Built from DART filings and KRX data. Free; unsubscribe in one click. See past issues