Nike (NKE) Stock Forecast: 1.12x Sales, Lowest Since 2010, a 4.72% Dividend Yield and What the November 16–17 Investor Day Could Bring
Nike (NKE) stock forecast, worked out through price-to-sales, margins and the November 16–17 Investor Day. Nike’s stock is down 80.4% from its 2021 record as too many classics, China and tariffs pushed its EBIT margin down to 5.8%. This post asks whether Nike is cheap now, what the margin is worth if it comes back, and whether the first Investor Day in nine years could reprice the stock. Data as of October 9, 2026 (NYSE close of October 8).
- Nike’s market cap of $51.6bn is 1.12x trailing-four-quarter revenue of $45.89bn, the lowest since 2010. The 10-year median is 3.26x, and the low before this year was 1.65x on April 8, 2025.
- The dividend yield is 4.72%, four times the 10-year median of 1.15%. The payout ratio on guidance EPS is 121–143%, and CFO Denton said the dividend is supported “under all scenarios.”
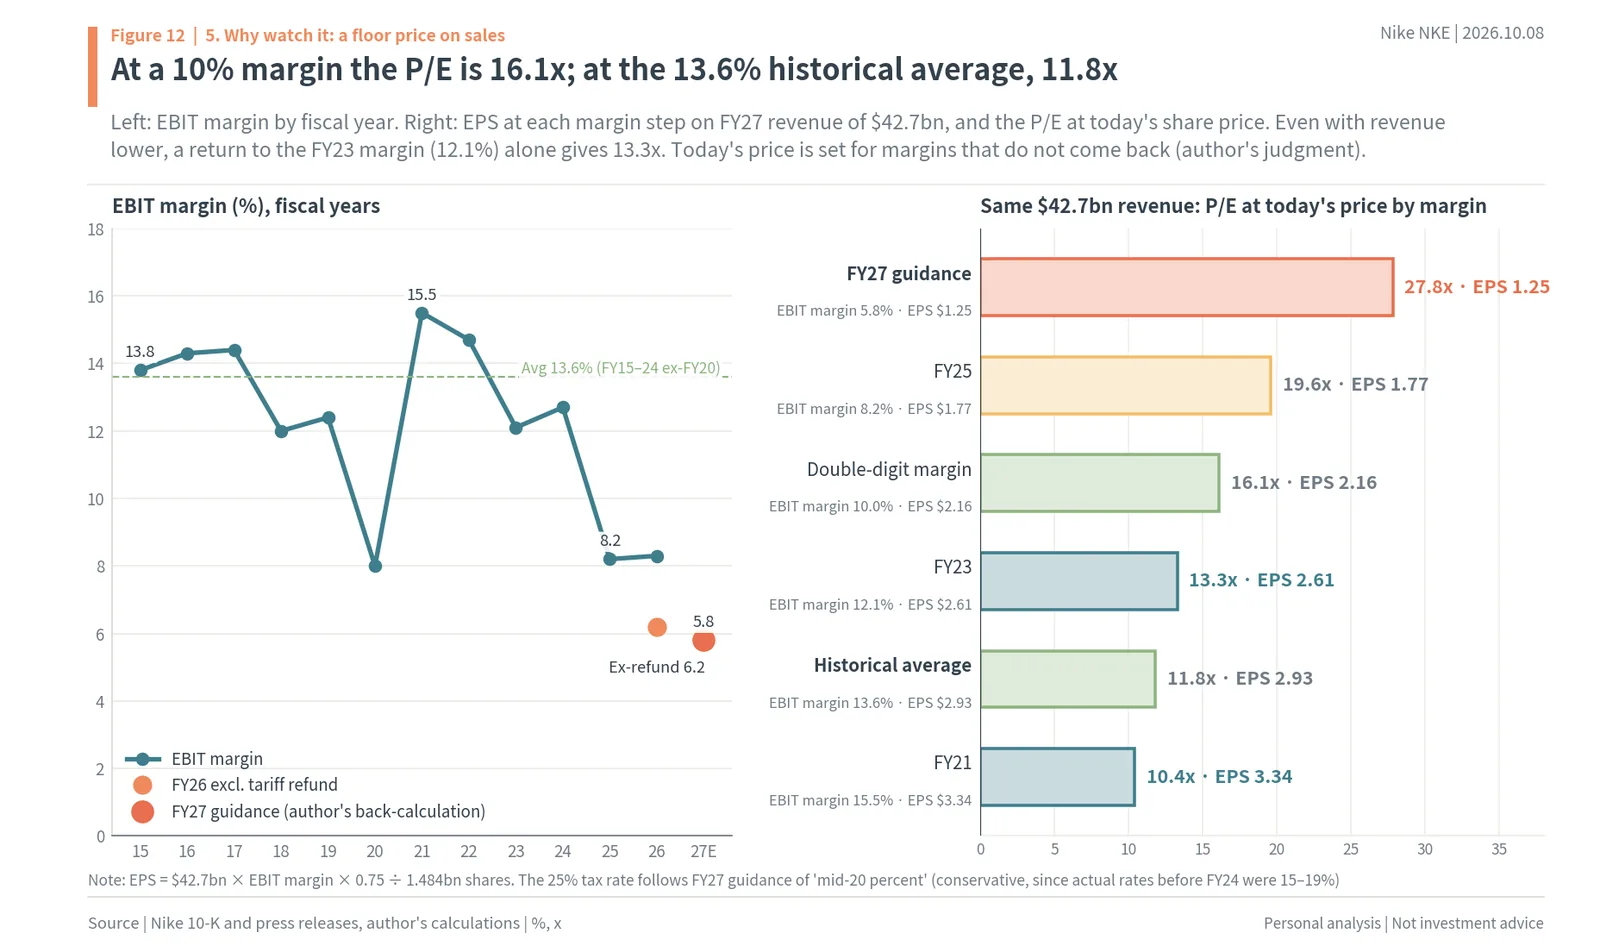
- The P/E is 27.8x guidance EPS of $1.25 because the EBIT margin backed out of FY27 guidance is 5.8%, versus a 13.6% average in FY15–FY24 excluding FY20.
- On the same $42.7bn of revenue, a 10% margin gives EPS of $2.16 (16.1x today’s price) and the historical 13.6% gives $2.93 (11.8x).
- adidas bottomed at €93.95 on November 3, 2022, a day before talks to hire Bjørn Gulden were confirmed, and was 115.5% above the bottom when steady revenue growth began.
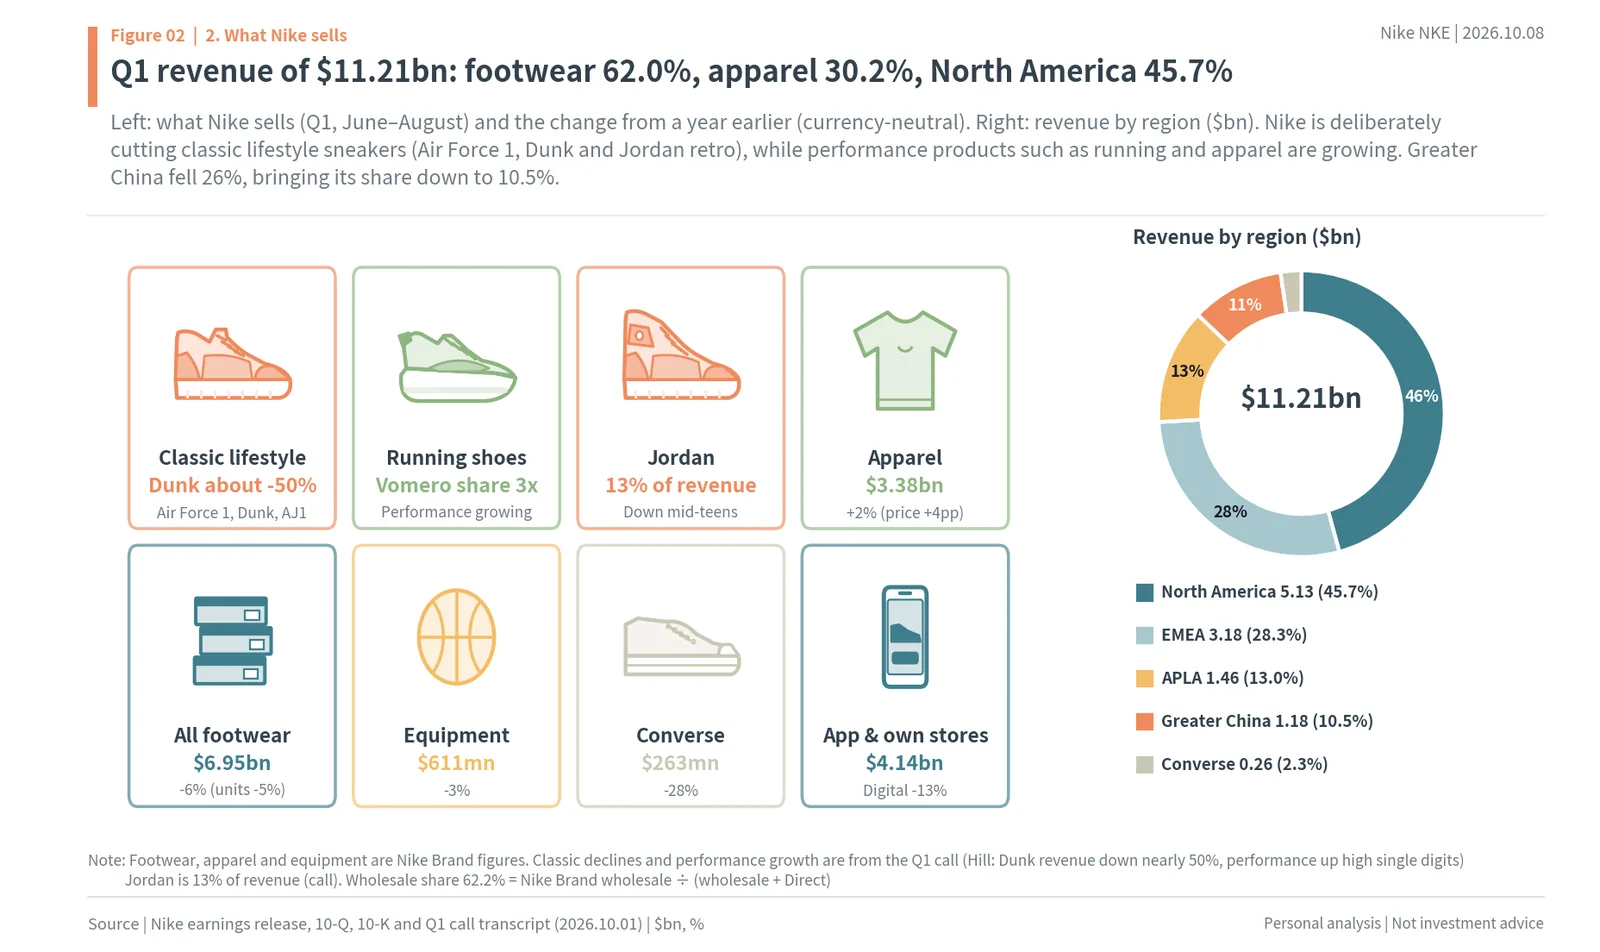
- The November 16–17 Investor Day is the first since 2017. The last three rose over two days (+4.50%, +2.37%, +6.35%), and 2017 gained 25.68% over 60 trading days.
Key takeaways
- Nike’s market cap is 1.12x its revenue over the past year, the lowest since 2010 (10-year median 3.26x), and its 4.72% dividend yield is four times the 10-year median (1.15%), a floor price.
- The P/E looks expensive at 27.8x guidance EPS of $1.25 because the EBIT margin is 5.8%, less than half the historical average (13.6%); if only the margin returns on the same $42.7bn of revenue, EPS is $2.93 and today’s price is 11.8x.
- At the November 16–17 Investor Day, the first in nine years, the new CFO will present a five-year financial algorithm; the stock rose over two days after each of the last three, and in 2017, when it was cheap, it gained 25.68% over 60 trading days.
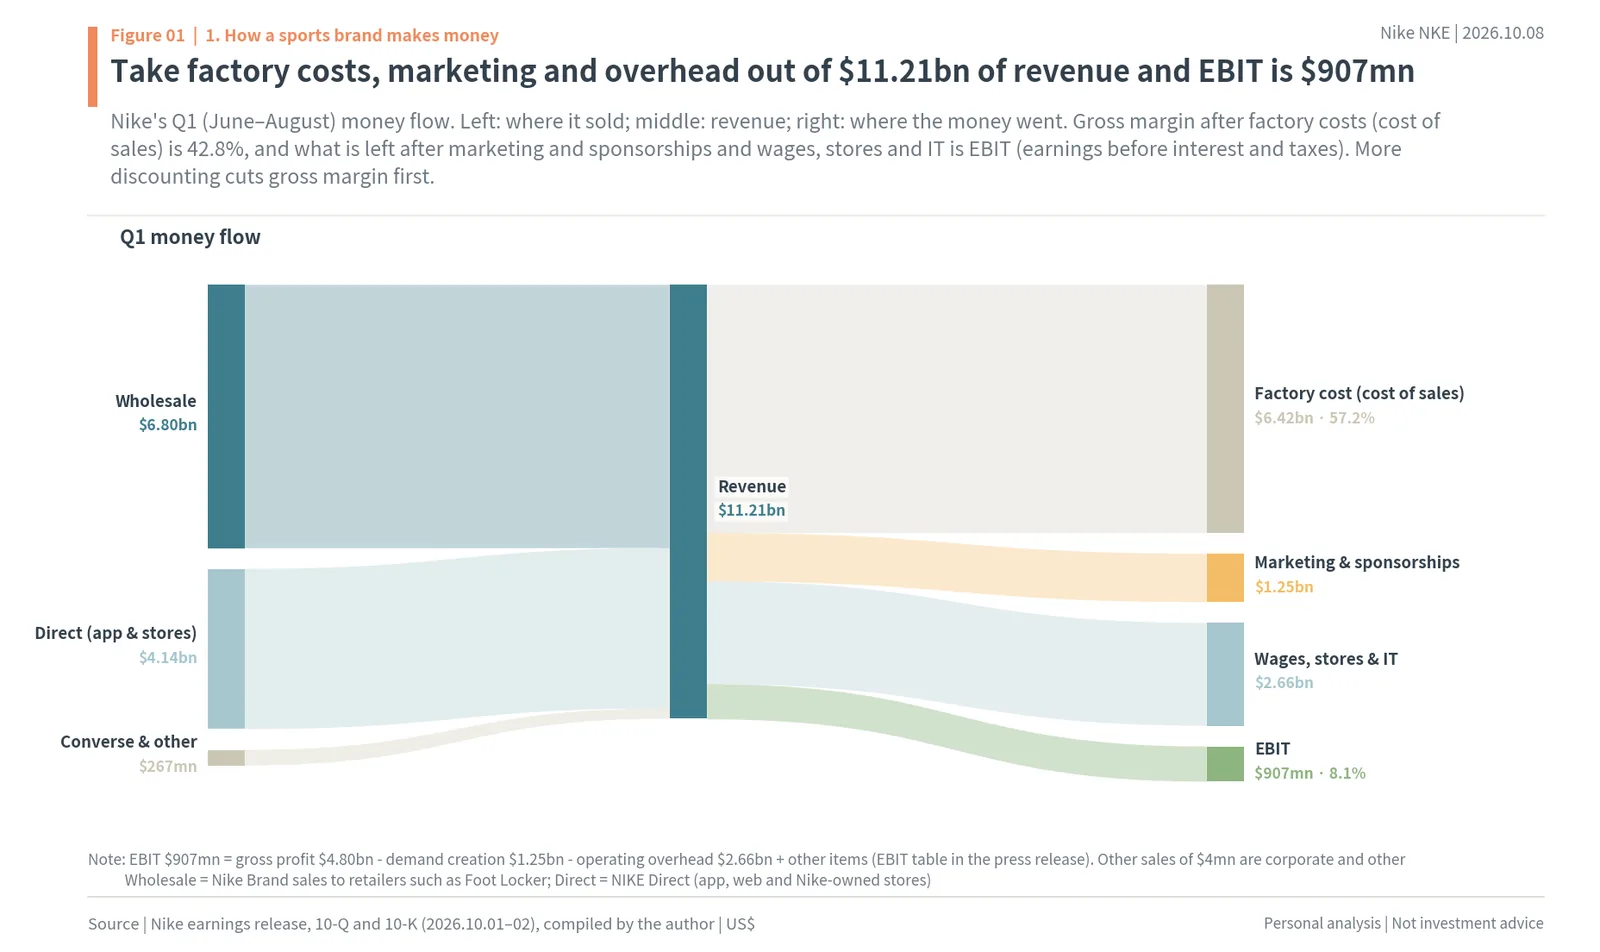
As of: October 9, 2026
Ticker: Nike (NKE, NYSE)
Reference close: $34.74 (NYSE close, October 8, 2026)
This is the author’s personal analysis and opinion.
The author’s calculations and estimates are not confirmed facts.
1. This report looks at whether Nike is cheap now and what could reprice it, through revenue, margins and the November 16–17 Investor Day, based on the author’s calculations.
2. It asks two questions: whether Nike is cheap now, and whether there is a near-term catalyst that could make it expensive again.
3. The order is: how a sports brand makes money → what Nike sells → the stock’s path → why it fell → a floor price on sales (why watch it) → the path adidas took → the Investor Day (why now) → peers and the size of expectations (why this multiple) → dates to watch and when to sell.
4. The conclusion first: on sales, Nike is at its cheapest in 13 years, and the November 16–17 Investor Day, where the new CFO puts numbers on the path back to margins for the first time, is the nearest catalyst to reprice it.
1. How Nike Makes Money: $11.21bn of Q1 Revenue, $907mn of EBIT
5. Nike does not make its shoes and clothes itself: it buys them from contract factories, puts its brand on them and sells them.
6. It sells two ways: wholesale to retailers such as Foot Locker, and direct to consumers through the Nike app, website and its own stores (NIKE Direct).
7. Of Q1 (June–August) revenue of $11.21bn, wholesale was $6.80bn, Direct $4.14bn and Converse $263mn.
8. Taking factory costs (cost of sales) of $6.42bn out of revenue leaves gross profit of $4.80bn, a gross margin of 42.8%.
9. After $1.25bn for marketing and sponsorships (demand creation) and $2.66bn for wages, stores and IT (operating overhead), EBIT (earnings before interest and taxes) of $907mn is left.
10. In this structure discounting hurts most: factory costs stay the same while selling prices are cut, so gross margin falls first, and because fixed costs stay the same, EBIT falls even more.
11. A sports brand’s profit depends first on how close to full price it sells, more than on how much it sells.
2. What Nike Sells: Footwear 62.0%, North America 45.7%
12. Of Q1 revenue of $11.21bn, footwear was 62.0%, apparel 30.2%, equipment 5.4% and Converse 2.3%.
13. Within footwear, Nike is cutting classic lifestyle shoes such as the Air Force 1, Dunk and Jordan 1 and growing running shoes (performance) such as the Vomero and Pegasus.
14. The Jordan brand, 13% of revenue, fell by a mid-teens percentage in Q1, while performance grew high single digits (low double digits excluding China).
15. By region, North America was 45.7%, EMEA 28.3%, APLA 13.0% and Greater China 10.5%, and after a 26% decline Greater China’s share has dropped to just over 10%.
16. Almost half of Nike’s revenue comes from North America, and what is shrinking is the classics it is cutting on purpose and China.
17. Quarterly revenue stayed between $10.97bn and $12.43bn over the past nine quarters.
18. Gross margin fell from 45.4% in Q1 FY25 (June–August 2024) to 40.2% in Q3 FY26.
19. In Q4 (March–May 2026), a $986mn tariff refund came out of cost of sales and the margin jumped to 49.2%; excluding it, the margin was 40.2%.
20. Q1 gross margin was 42.8%, up 0.6 percentage points from a year earlier, the first rise after seven straight quarterly declines excluding the refund.
21. Revenue held up, but gross margin falling more than 5 percentage points is what broke profits.

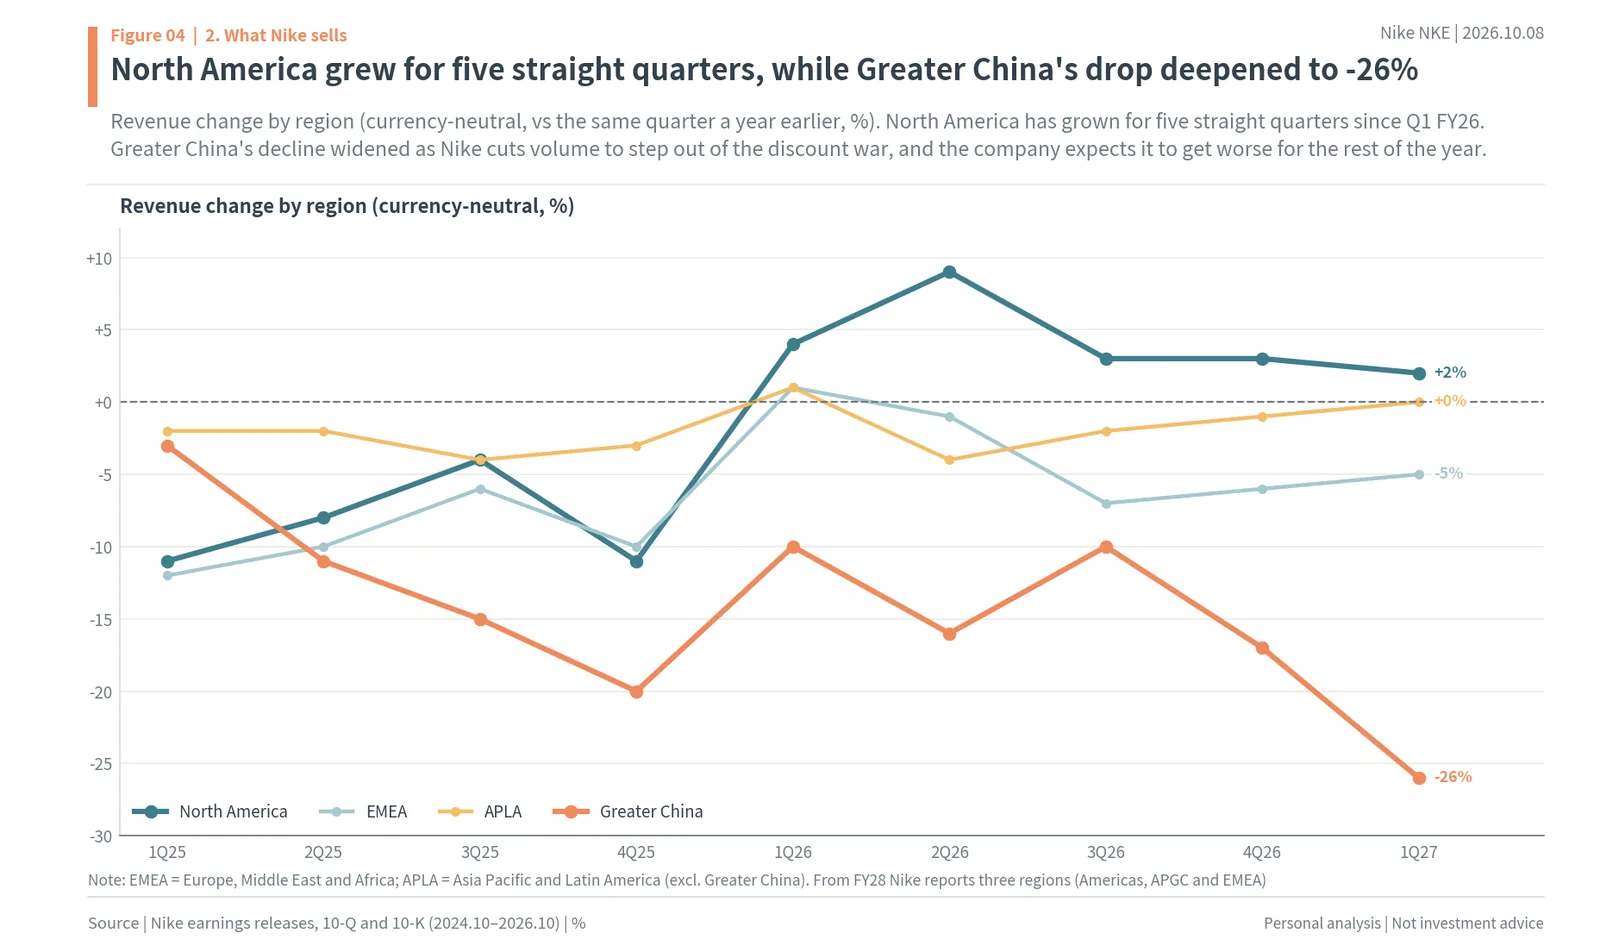
22. By region, North America has grown for five straight quarters since Q1 FY26 (+4%, +9%, +3%, +3%, +2%).
23. Greater China went -10%, -16%, -10% and -17%, then fell 26% in Q1, its deepest drop, and the company expects it to get worse for the rest of the year.
24. EMEA was -5% and APLA 0%, so outside North America revenue is still shrinking.
25. North America has already turned, and China is dragging down the total.
3. Nike Share Price: From the $177.51 Record to $34.74
26. Nike’s stock has fallen 80.4% from its record close of $177.51 on November 5, 2021 to $34.74 on October 8.
27. Over the past two years alone it is down 61.2% from $89.44 on September 27, 2024, and the October 2 close of $33.87 was the lowest since September 2013.
28. The one-year return is -49.7%, 64.7 percentage points behind the S&P 500 (+15.0%) over the same period.
29. On September 21 it was removed from the S&P 100, where it had been for 18 years.
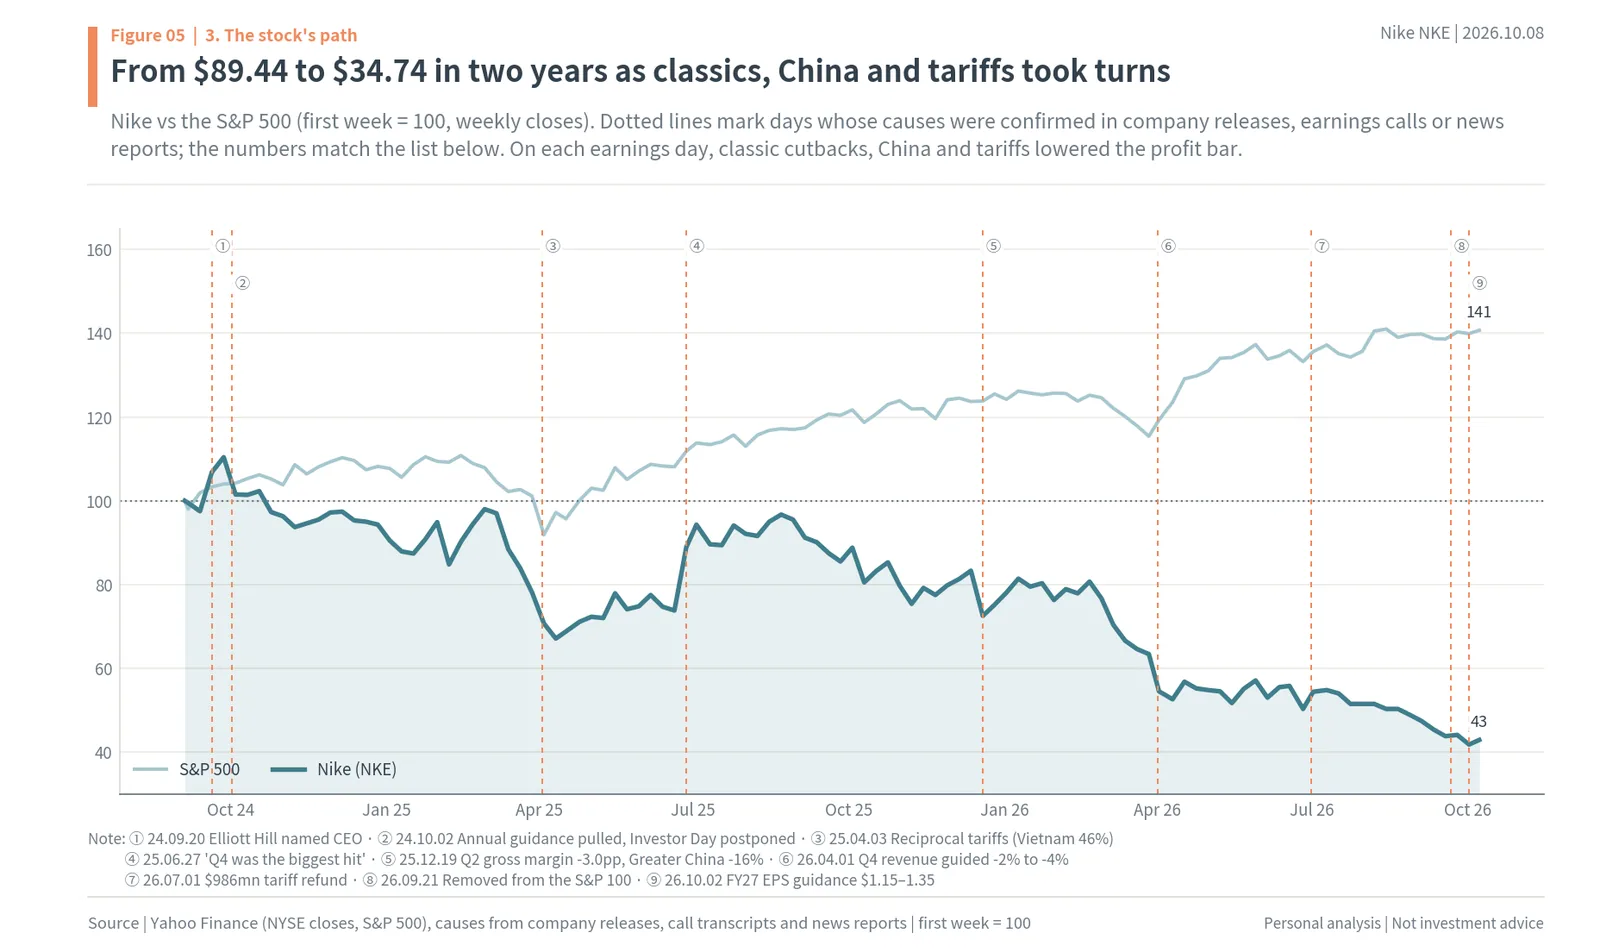
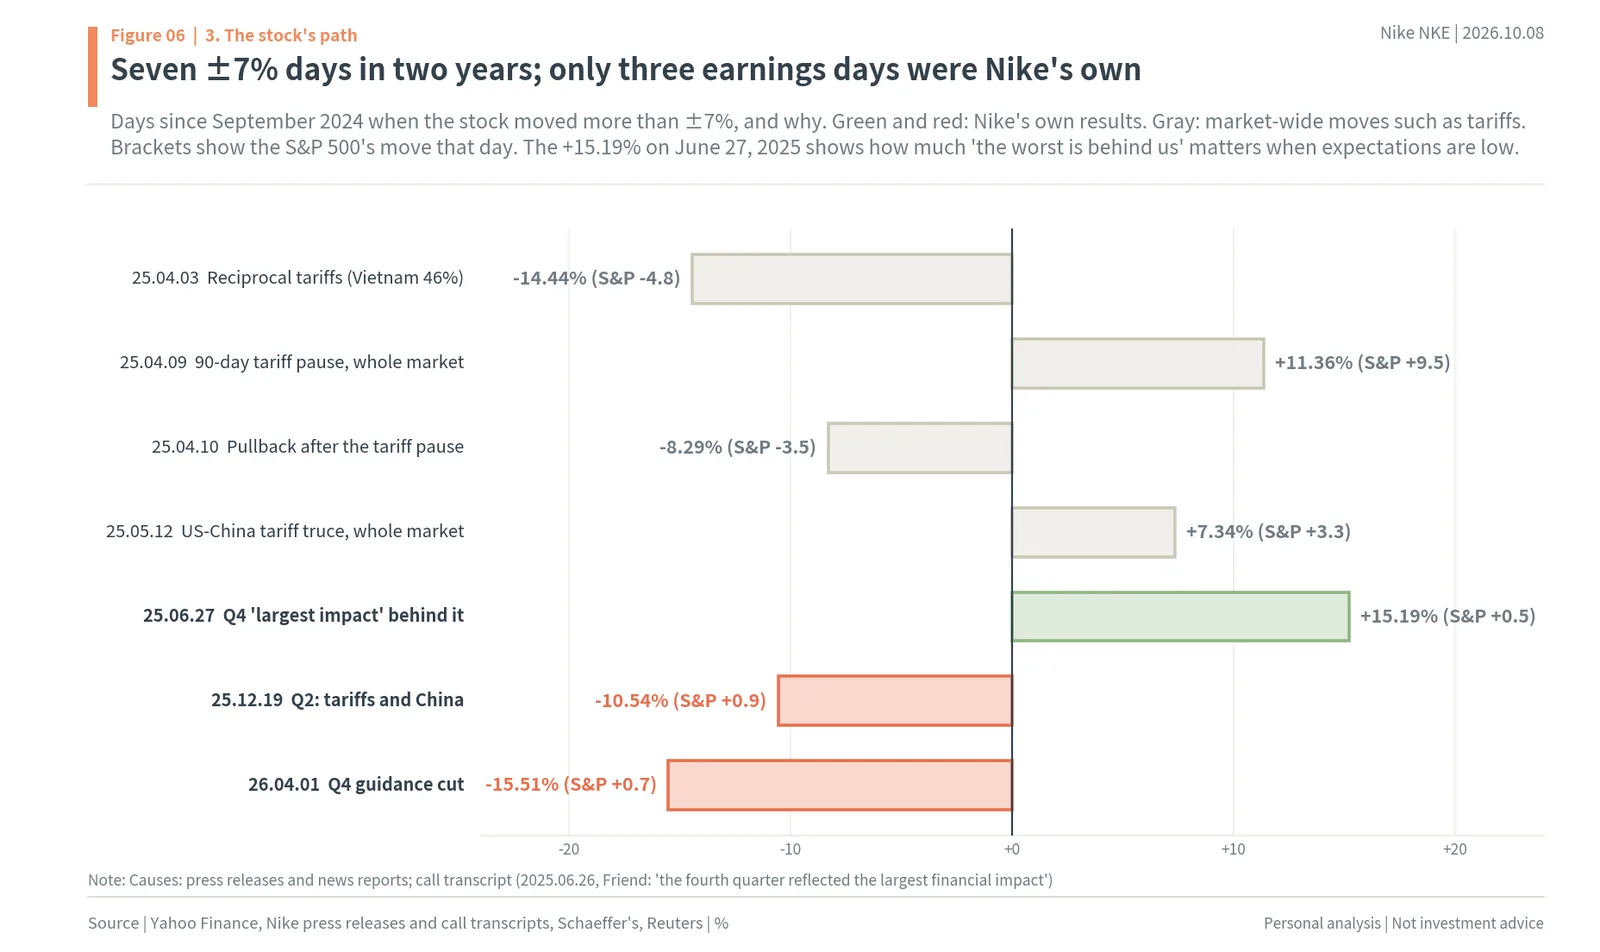
30. Over two years the stock moved more than ±7% in a day seven times, and four of those were days when the whole market moved, as on tariffs.
31. The days with reasons specific to Nike were three earnings days: +15.19% on June 27, 2025, -10.54% on December 19 and -15.51% on April 1, 2026.
32. The -14.44% on April 3, 2025 came the day after the 46% reciprocal tariff on Vietnam was announced, and Nike made half of its FY24 footwear in Vietnam.
33. On each earnings day, classic cutbacks, tariffs and China lowered the profit bar, and the stock fell like a staircase.
4. Why Nike Stock Fell: Too Many Air Force 1s, Dunks and Jordan 1s
34. The Air Force 1, Dunk and Jordan 1 are classics that sold strongly in 2020–2023, and because they sold well, a lot of them were put on the market.
35. On the Q1 call, CEO Elliott Hill admitted about Jordan retro that “we’ve been oversupplying our iconic retro product.”
36. Shoes that had become common were sold at a discount, and the company began cutting the three classics in FY25.
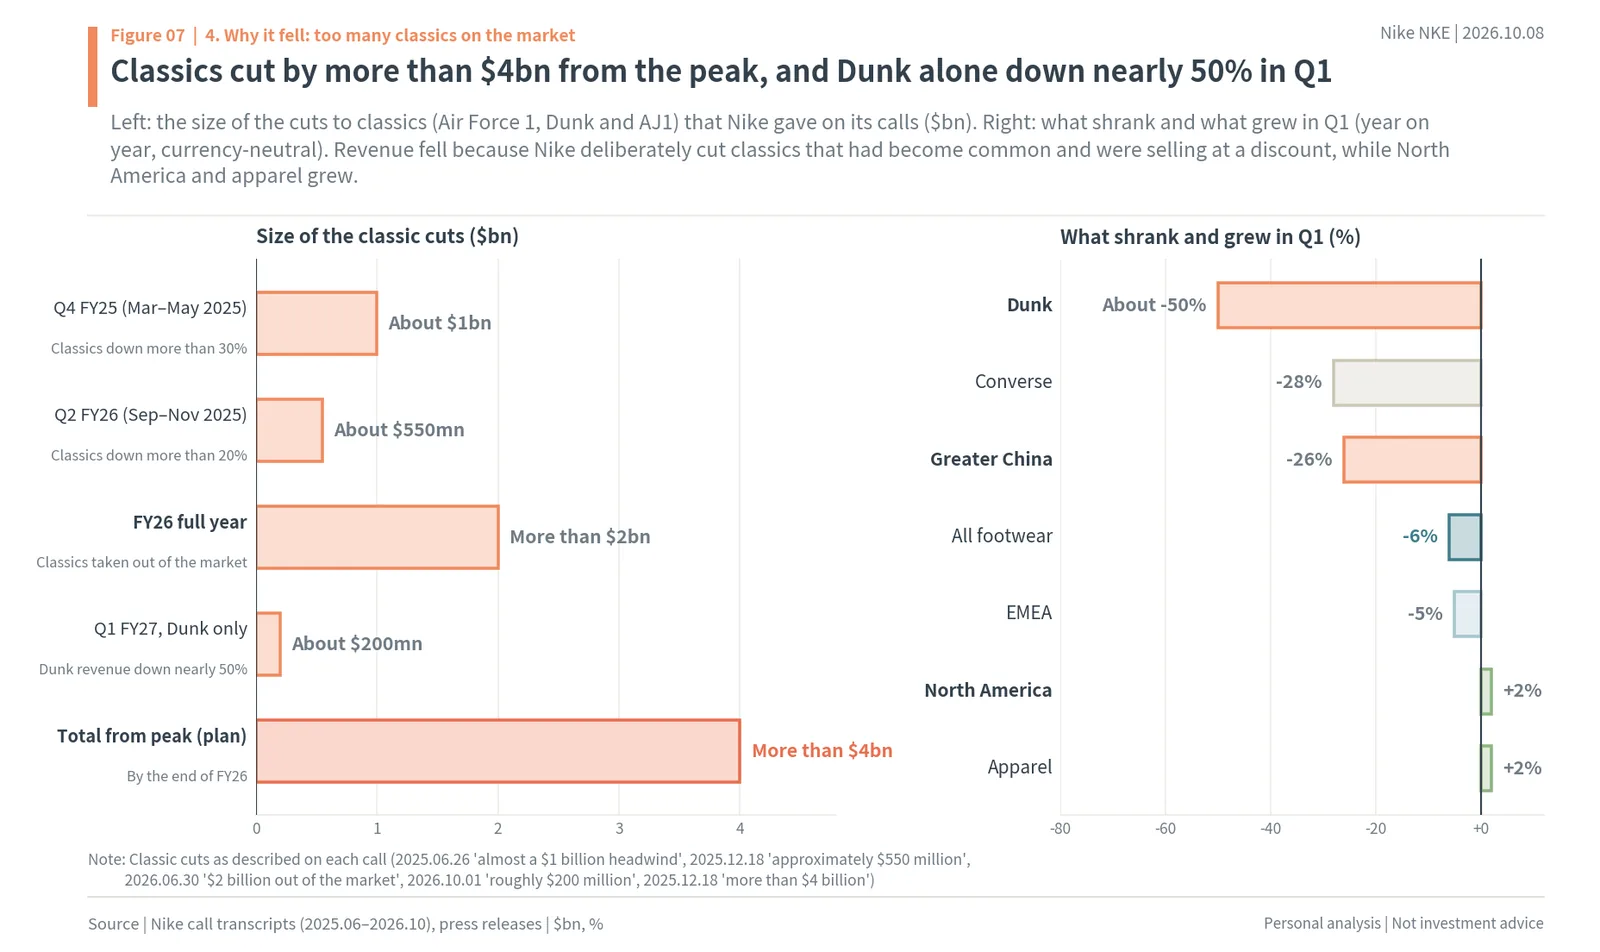
37. Classics fell more than 30% in Q4 FY25, taking out about $1bn, and about $550mn came out in Q2 FY26.
38. Classics taken out of the market in FY26 alone came to more than $2bn, and the company said it would cut them by more than $4bn in total from the peak.
39. In Q2 FY26 the company said currency-neutral revenue grew 6% excluding this classics headwind.
40. In Q1 it also cut Dunk revenue by nearly 50% (about $200mn), and its 10-Q says the cleanup of Sportswear and Jordan will continue beyond FY27.
41. What pulled revenue down was not demand disappearing but the company deliberately clearing out classics it had put on the market in excess.
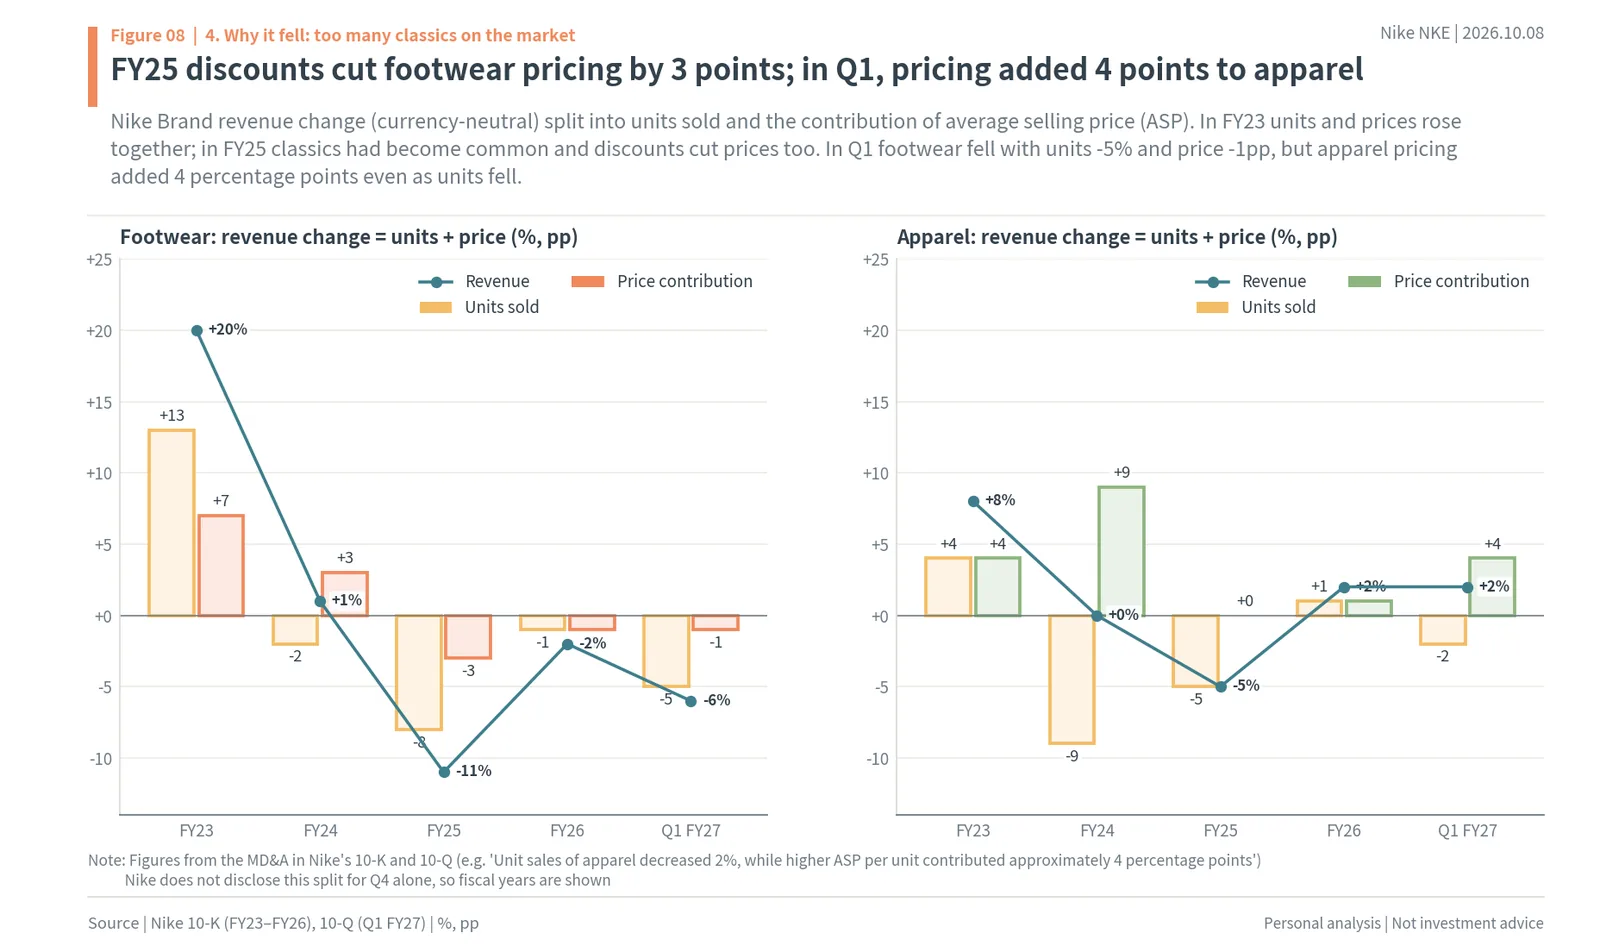
42. Discounting shows up directly in the selling price: every quarter, the company breaks its revenue change down into units sold and average selling price (ASP).
43. In FY23 footwear units rose 13% and price added 7 percentage points, and in FY24 price added 3 percentage points thanks to “higher full-price ASP.”
44. In FY25 footwear units fell 8%, and because of discounts and channel mix, price also took 3 percentage points off revenue.
45. In Q1 footwear units were -5% and price -1 percentage point, while apparel units fell 2% but price added 4 percentage points, so apparel revenue grew 2%.
46. While the classics are being cleared out footwear units shrink, but price is turning up first in apparel.
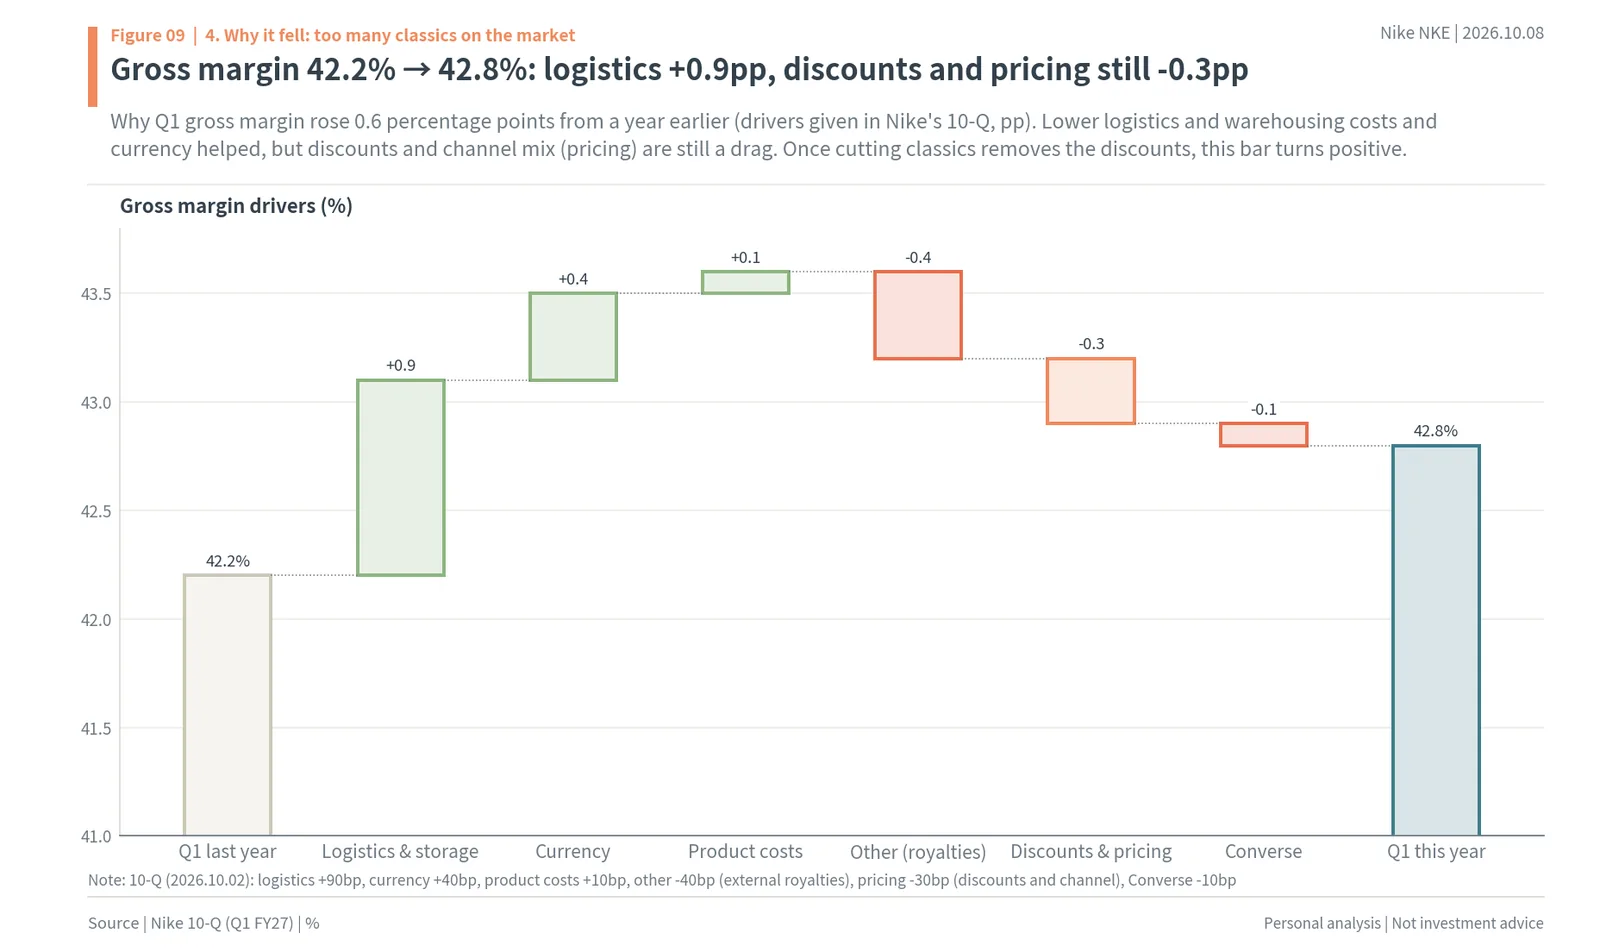
47. Q1 gross margin rose 0.6 percentage points from 42.2% a year earlier to 42.8%, driven by logistics and warehousing (+0.9 percentage points), currency (+0.4) and product costs (+0.1).
48. On the other side, external royalties (-0.4 percentage points), discounts and pricing (-0.3) and Converse (-0.1) took it down.
49. As of September 2025, US tariffs were a cost of $1.5bn a year, which the company said would take a net 1.2 percentage points off FY26 gross margin.
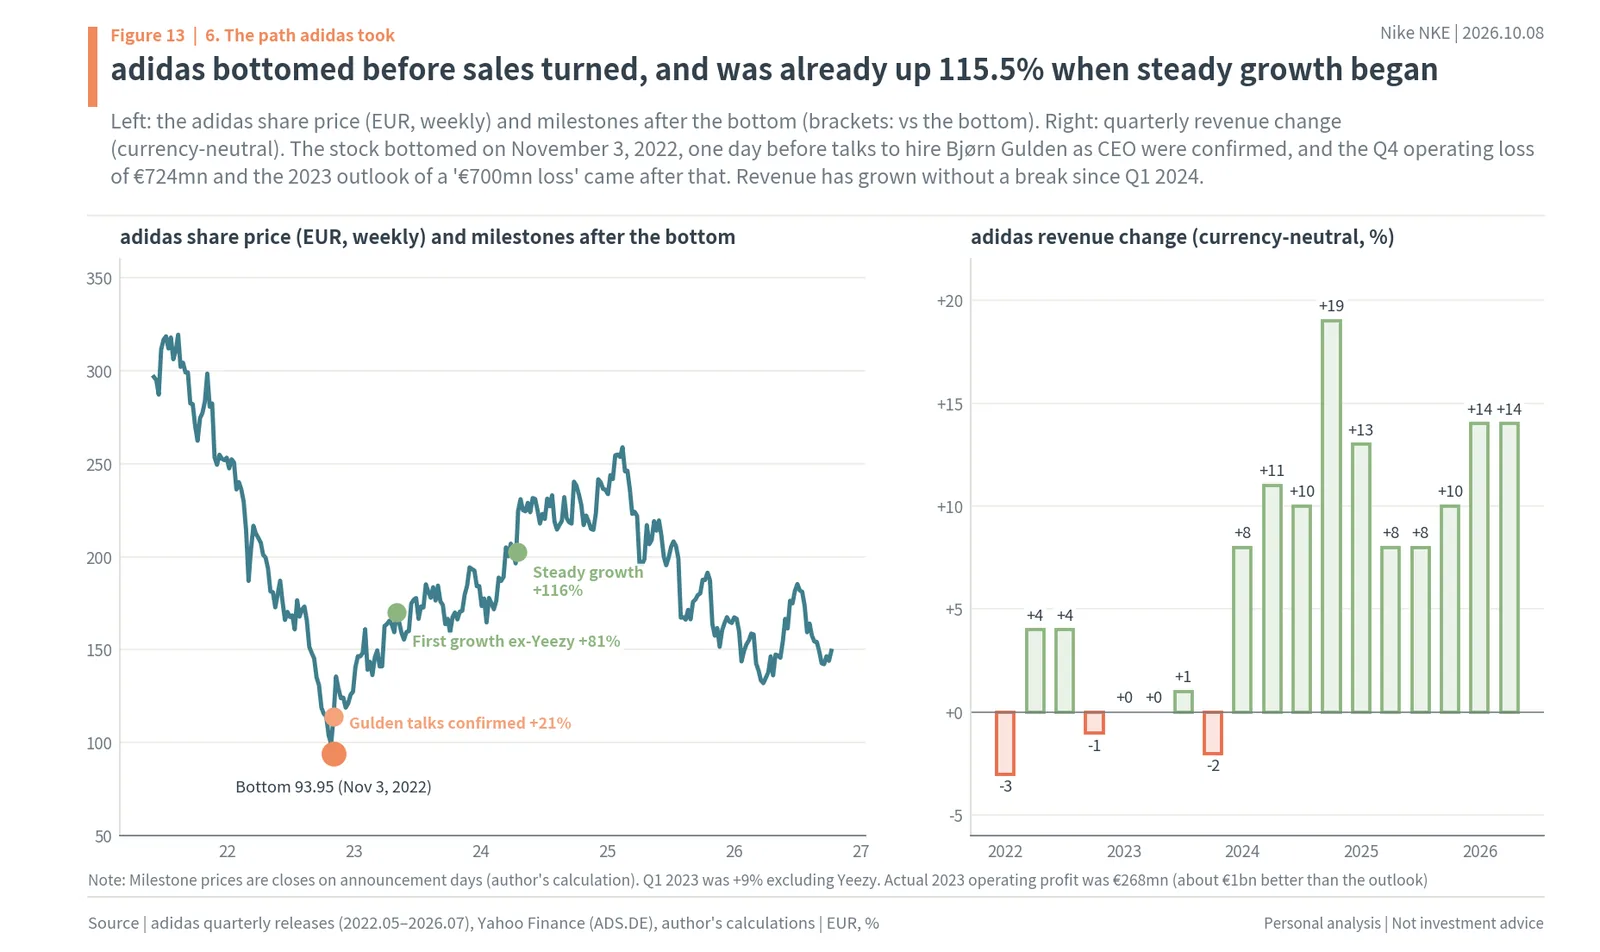
50. On February 20 the Supreme Court ruled the IEEPA tariffs unlawful and Nike recorded a $986mn refund in Q4, but it assumes an additional 15% tariff from August.
51. The discounts and pricing line is still negative, so once the classics cleanup ends and the discounts go away, gross margin has room to rise.
5. Nike P/S at 1.12x and a 4.72% Dividend Yield: A Floor Price on Sales
52. Whether a stock is cheap or expensive is judged on two yardsticks: revenue and earnings.
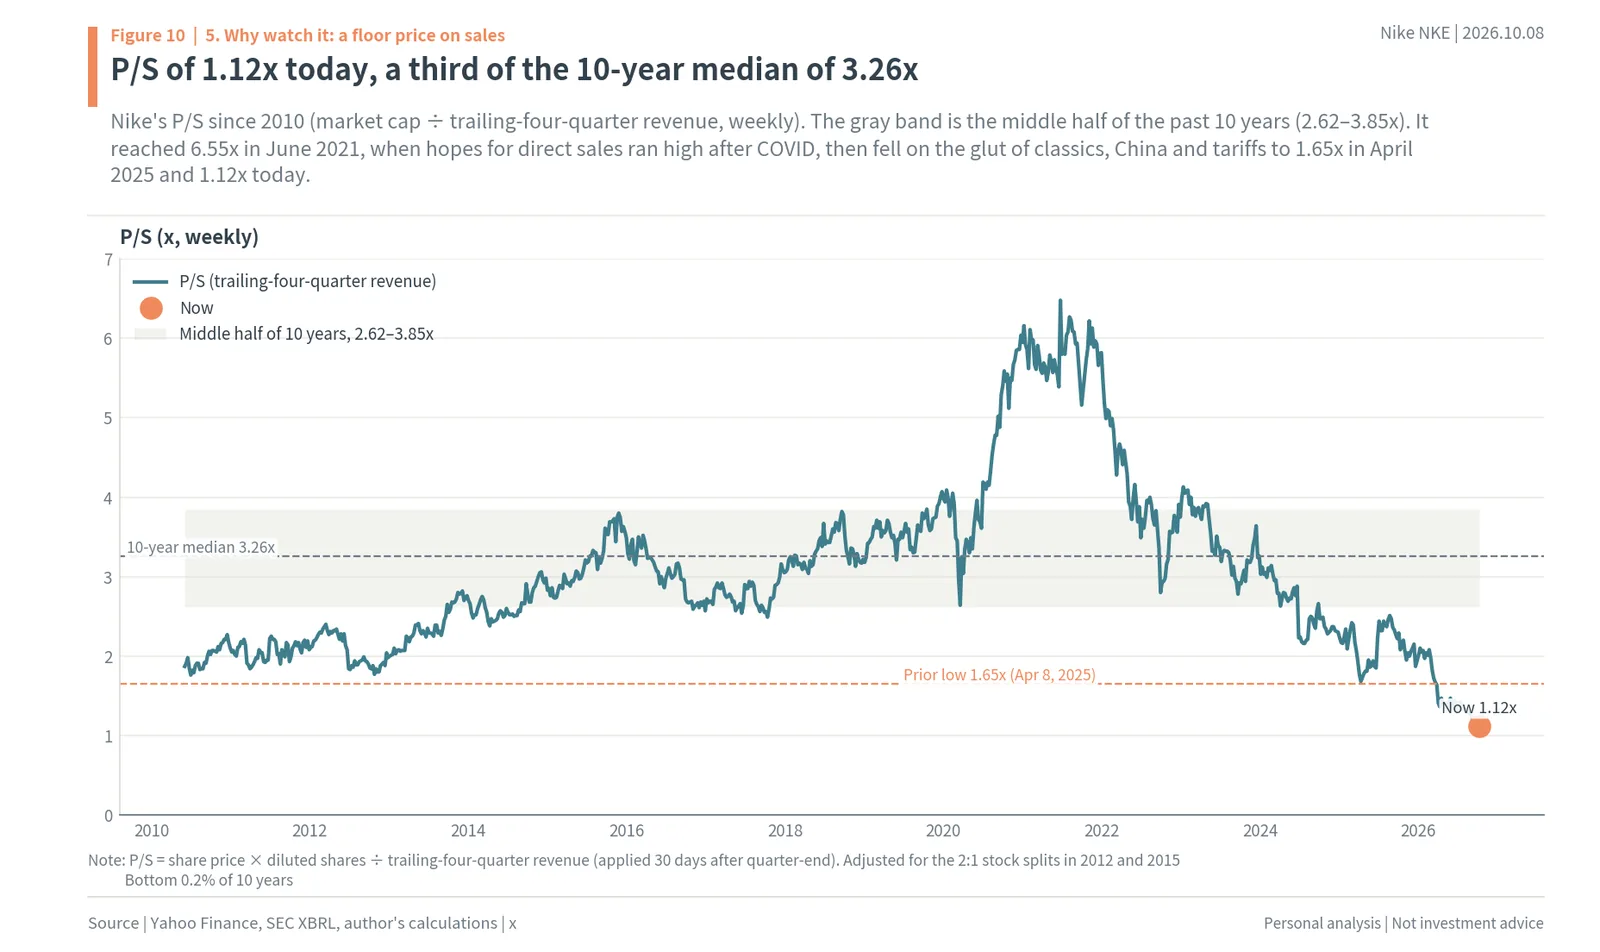
53. On revenue, the market cap of $51.6bn is 1.12x trailing-four-quarter revenue of $45.89bn (P/S), the lowest since 2010.
54. The 10-year median is 3.26x, with the middle half at 2.62–3.85x, and in June 2021, when hopes for direct sales ran high, it reached 6.55x.
55. Before this year, the lowest reading was 1.65x on April 8, 2025, right after the tariff shock.
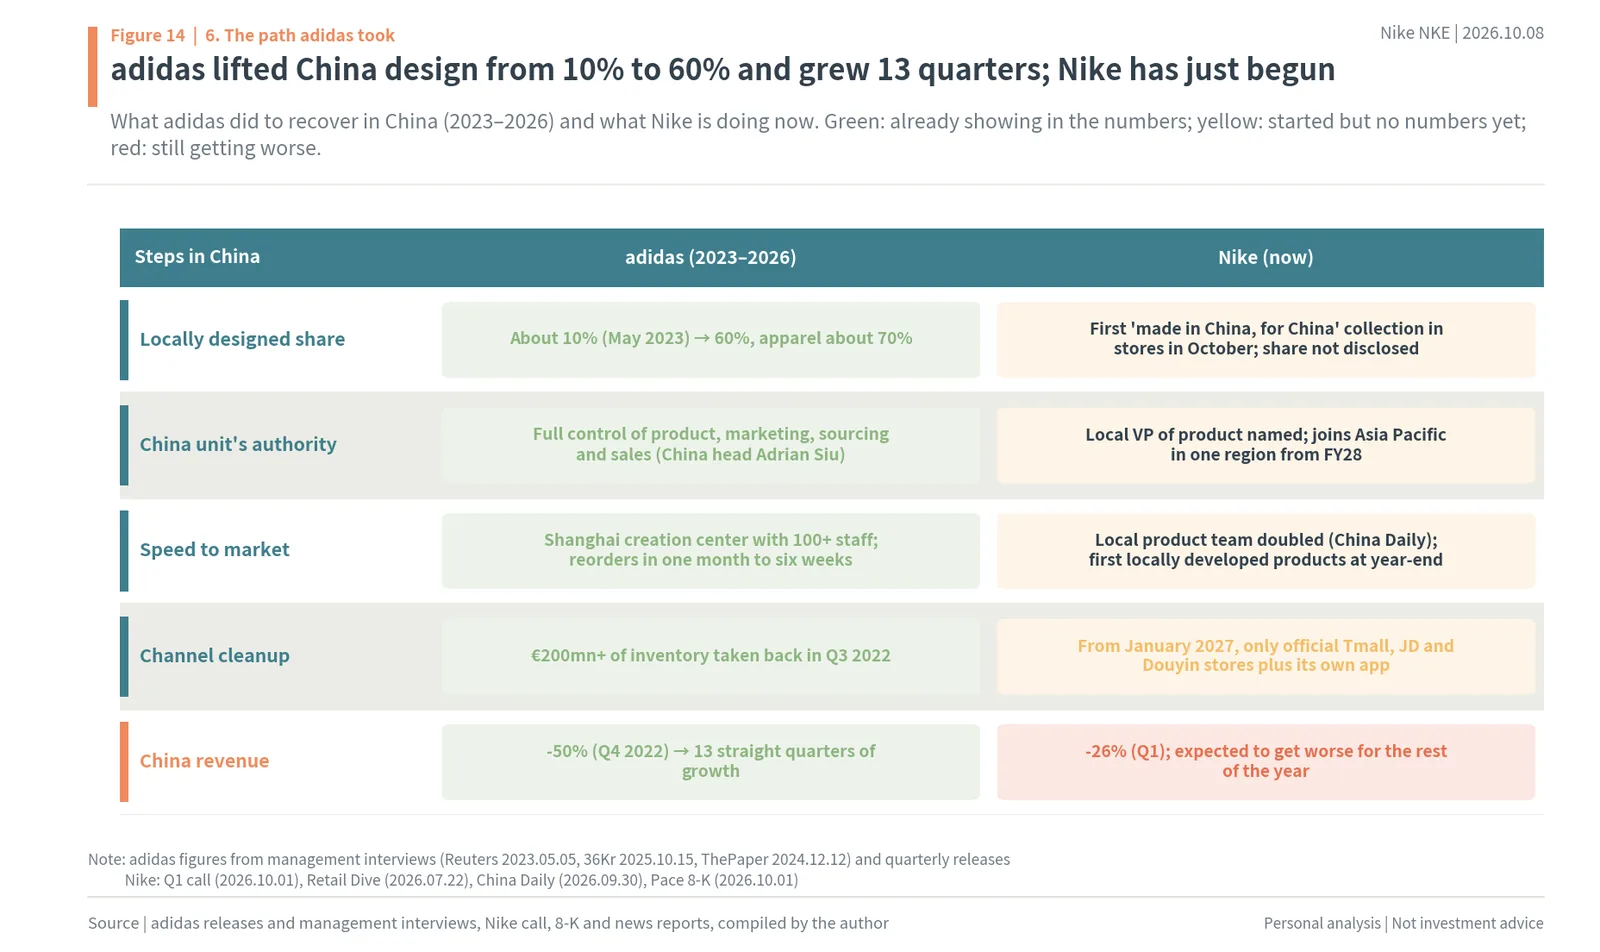
56. Buying a dollar of Nike’s revenue as cheaply as today has not been possible since 2010.
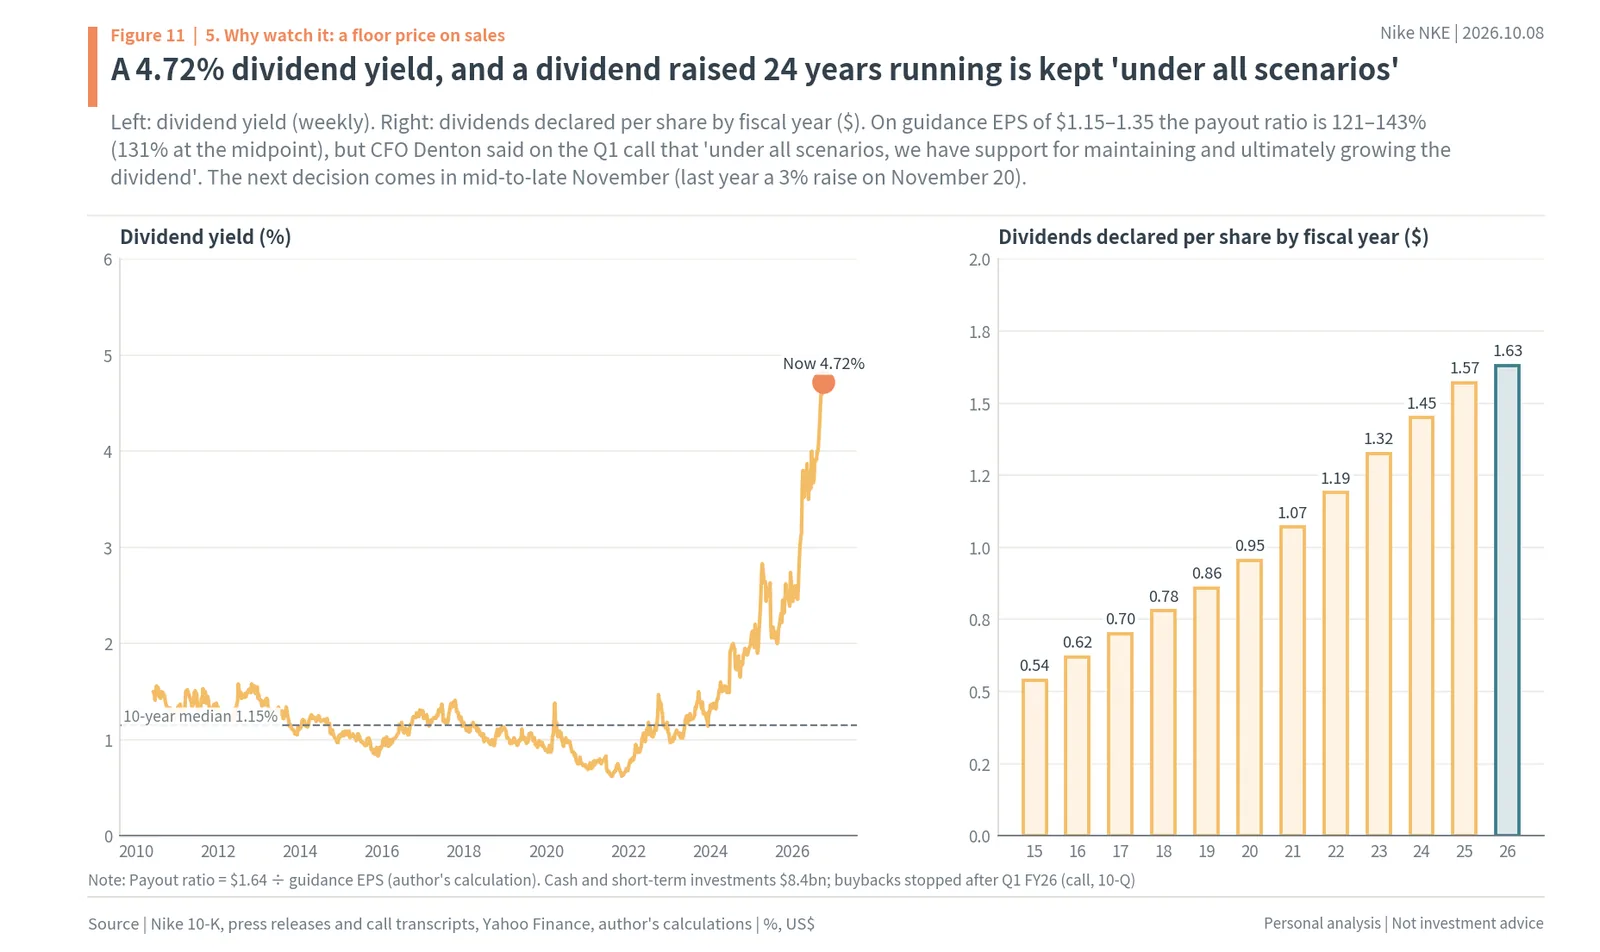
57. The dividend is $1.64 a year, a dividend yield of 4.72%, four times the 10-year median of 1.15%.
58. The dividend declared per share rose every year from $0.54 in FY15 to $1.63 in FY26, and last November 20 it was raised 3%, the 24th straight annual increase.
59. On guidance EPS of $1.15–1.35, the payout ratio is 121–143% (131% at the midpoint).
60. On the Q1 call, CFO Denton said that “under all scenarios, we have support for maintaining and ultimately growing the dividend over time,” and cash and short-term investments are $8.4bn.
61. With the promise to keep the dividend, the 4.72% yield is the number that props up the floor under the stock.
62. On earnings it looks different: the P/E is 27.8x guidance-midpoint EPS of $1.25, and 22.3x trailing-four-quarter EPS of $1.56 excluding the tariff refund.
63. It is cheap against revenue and expensive against earnings because margins are at a floor.
64. The EBIT margin averaged 13.6% in FY15–FY24 excluding the COVID year (FY20), and was 15.5% in FY21.
65. It fell to 8.2% in FY25 and to 6.2% in FY26 excluding the tariff refund.
66. Working FY27 guidance backward (about $42.7bn of revenue if it falls 8%, EPS of $1.25) at a 25% tax rate gives an EBIT margin of 5.8%.
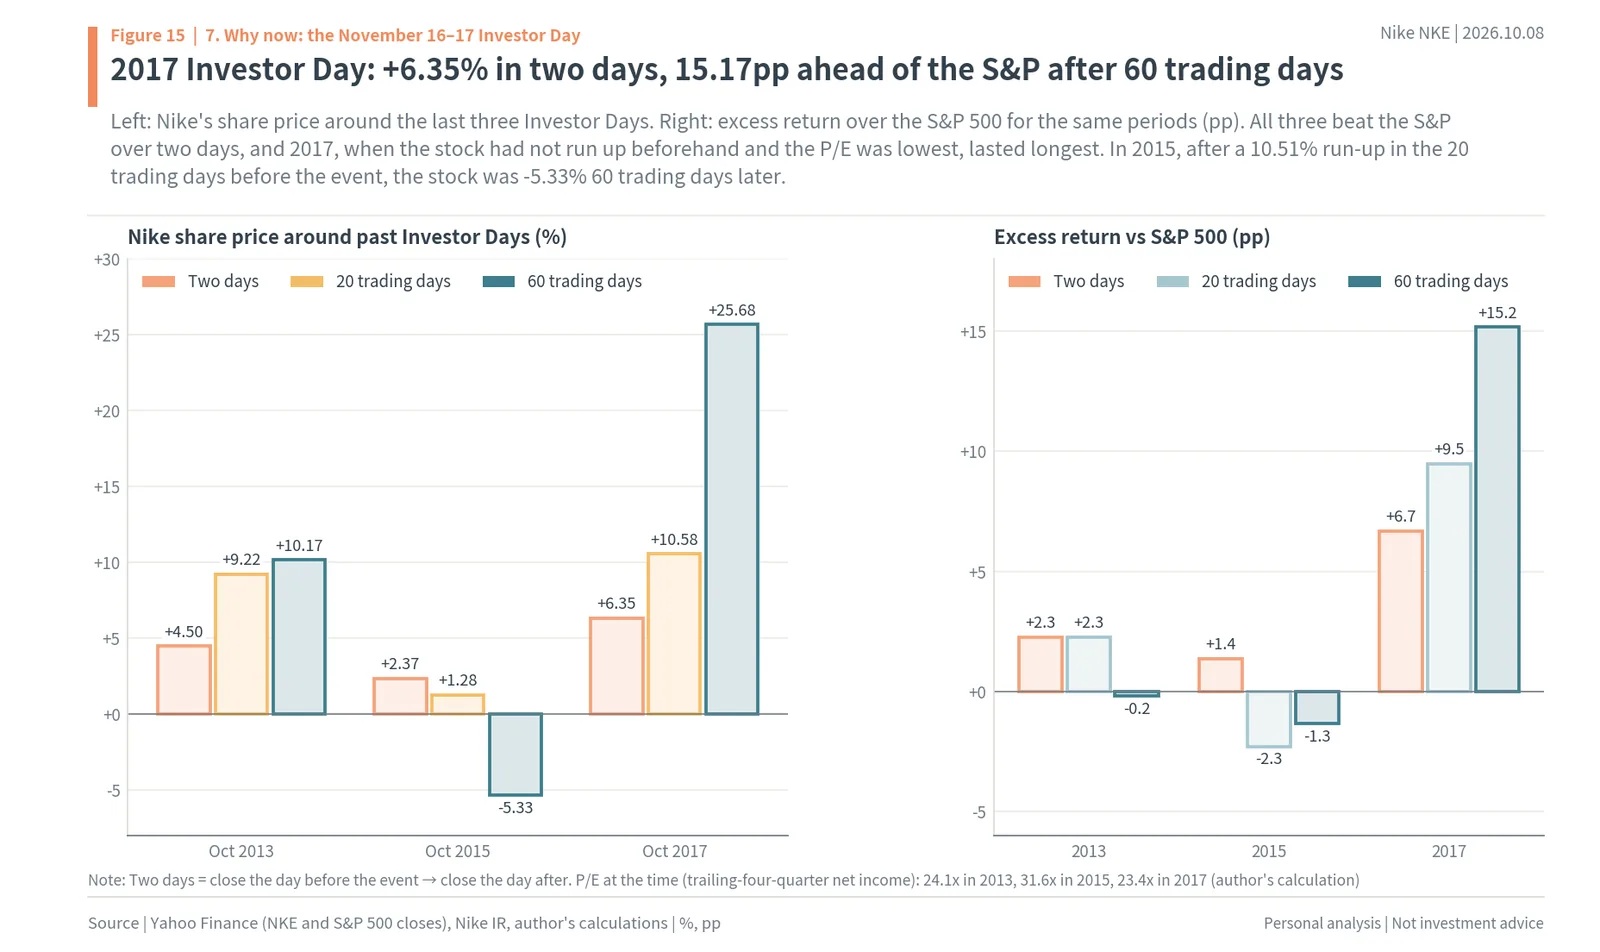
67. On the same $42.7bn of revenue, a 10% margin gives EPS of $2.16 (16.1x today’s price), FY23’s 12.1% gives $2.61 (13.3x) and the historical average of 13.6% gives $2.93 (11.8x).
68. Even with revenue lower, a return of the margin alone brings the P/E into the teens, so the author sees today’s price as set for margins that do not come back.
6. The adidas Turnaround: The Stock Bottomed Before Sales Recovered
69. In 2022 adidas was in a position similar to Nike’s today, with China revenue collapsing (down 27–50% a quarter) and the end of its Yeezy partnership at the same time.
70. Its stock fell 72.1% from €336.25 on August 4, 2021 to €93.95 on November 3, 2022.
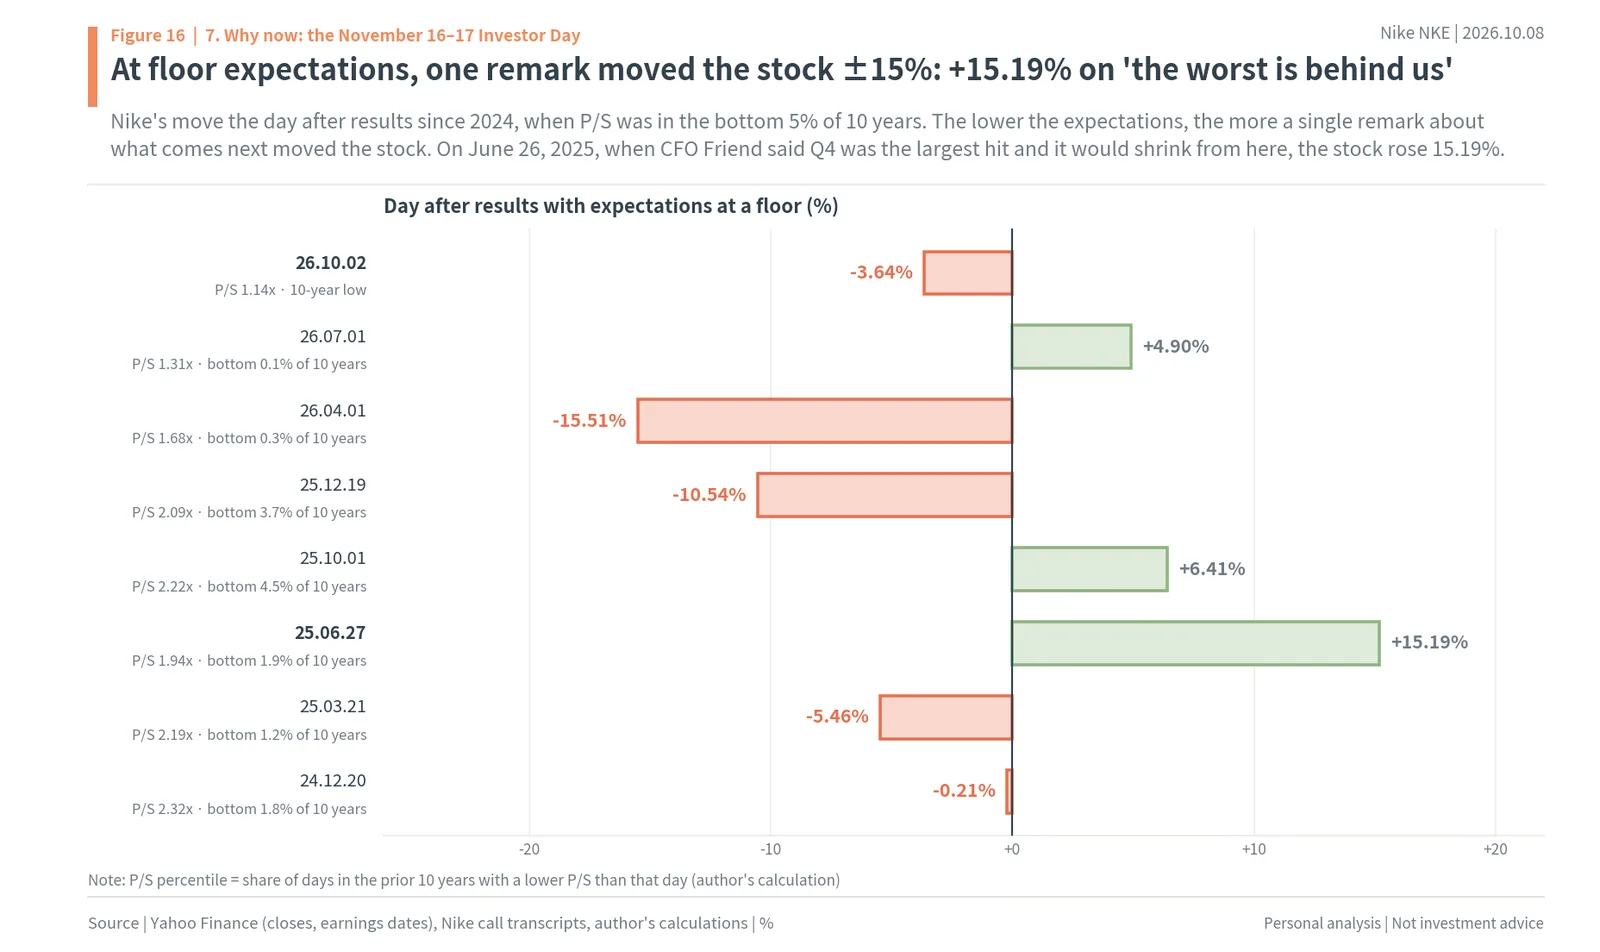
71. The bottom came one day before talks to hire new CEO Bjørn Gulden were confirmed, and on November 4, when they were confirmed, the stock rose 21.4%.
72. The worse numbers, a Q4 2022 operating loss of €724mn (gross margin 39.1%) and the February 9, 2023 outlook of a €700mn operating loss, came after the bottom.
73. With the new management setting expectations low, actual 2023 operating profit was €268mn, about €1bn better than the outlook.
74. At the first growth excluding Yeezy (Q1 2023 results, May 5) the stock was 81.3% above the bottom, and at the Q1 2024 results (April 16), when revenue began to grow without a break, it was 115.5% above.
75. From Q1 2024 revenue grew for 10 straight quarters, up 14% in Q2 2026, and gross margin returned to 50–52.5%.
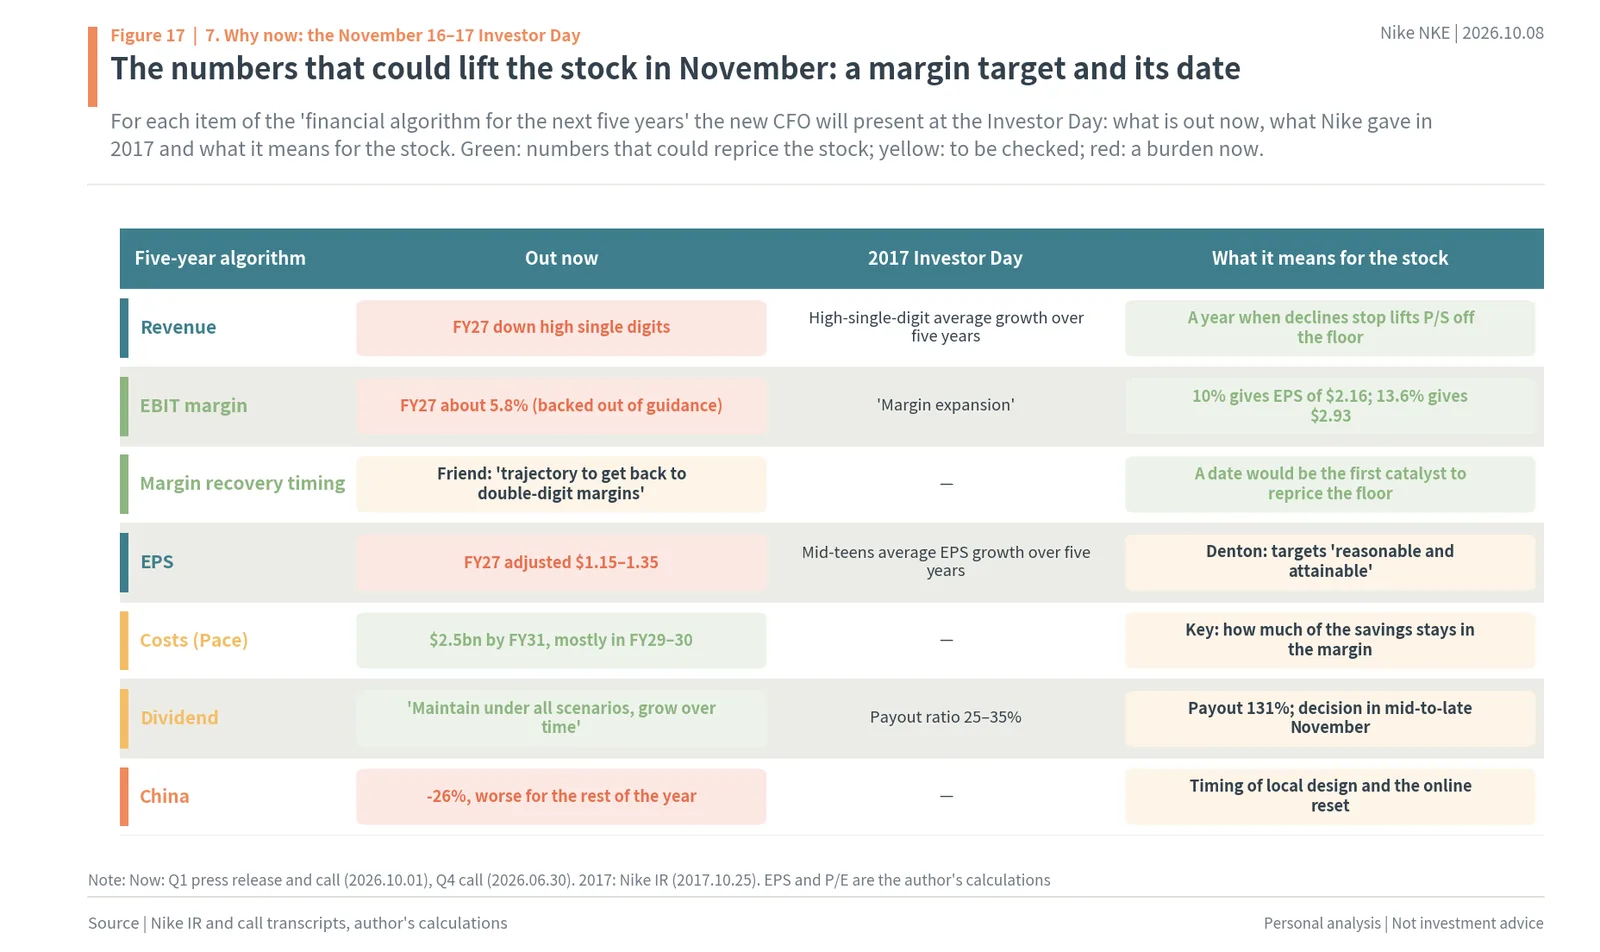
76. adidas stock reacted first not to revenue but to “new management that lowered expectations to the floor” and “less bad numbers.”
77. In China, adidas raised the share of locally designed products from the low single digits before the crisis to about 10% in May 2023 and 60% in October 2025 (about 70% for apparel).
78. It handed the China unit full authority over product, marketing, sourcing and distribution, and its Shanghai creation center turns reorders around in one month to six weeks.
79. As a result, Greater China revenue turned to +16% in Q2 2023 and grew for 13 straight quarters through Q2 2026.
80. In October Nike put its first “made in China, for China” collection in stores, named a vice president for local product and doubled its local product team (China Daily).
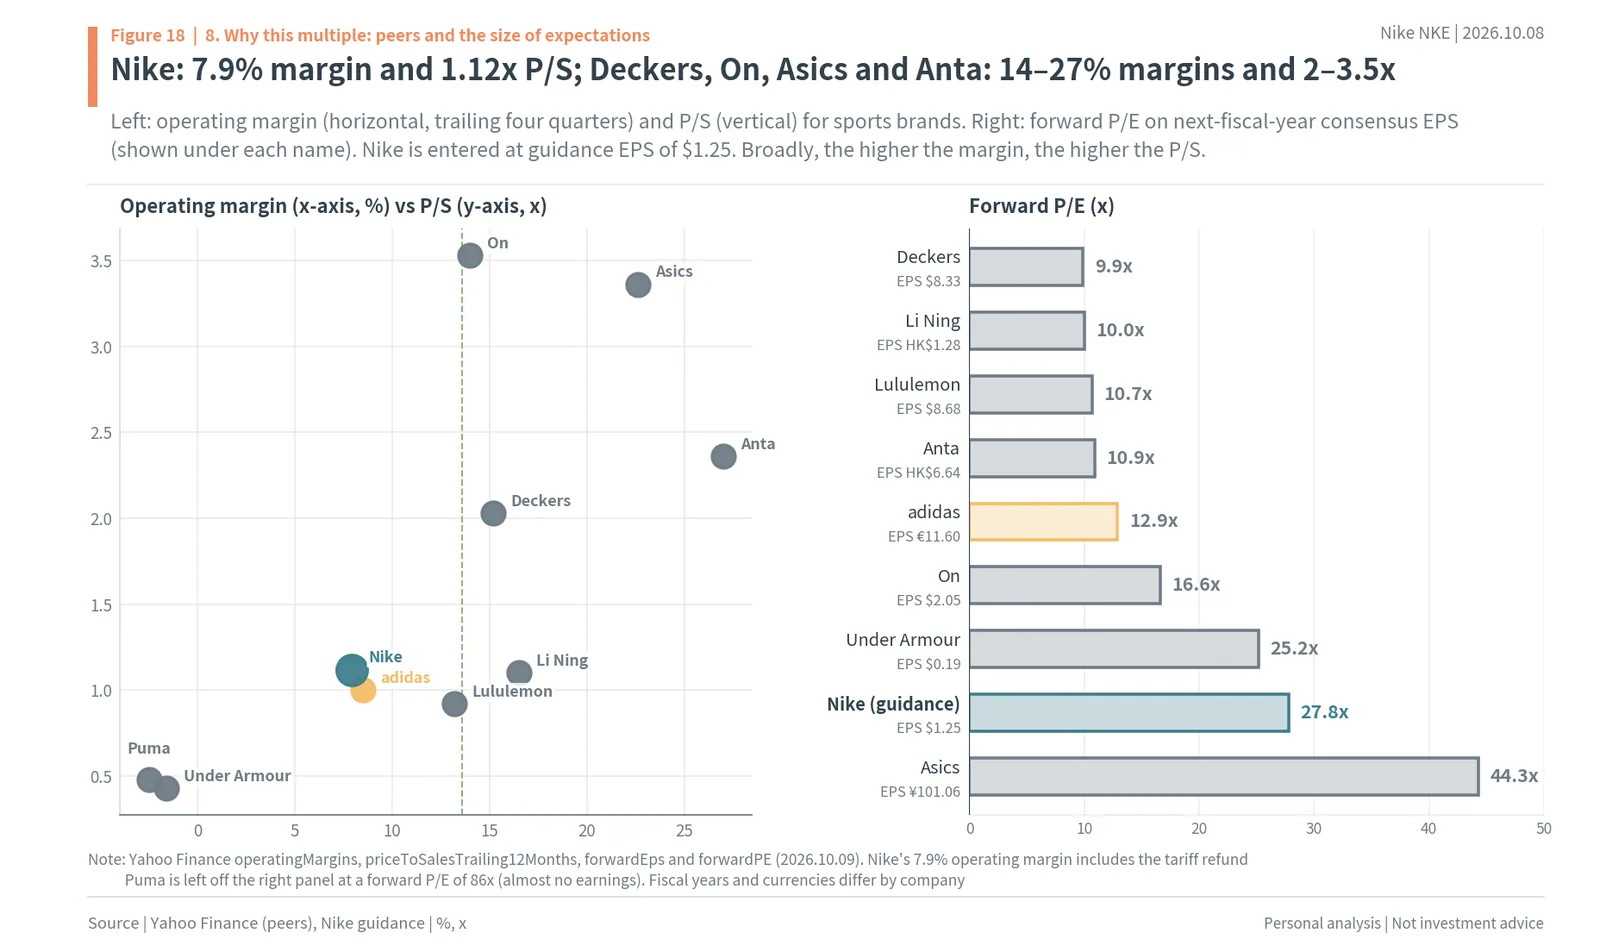
81. Online, from January 2027 it will sell only through official Tmall, JD and Douyin stores and its own app and website, cutting back from more than 1,000 sellers.
82. Nike’s China fix has just started down the path adidas followed (clearing inventory → local design → cleaning up channels).
7. Nike Investor Day, November 16–17, 2026: What Could Lift the Stock
83. Nike postponed the Investor Day it had set for November 19, 2024 because of the CEO change, so this November 16–17 meeting is its first in nine years, since October 25, 2017.
84. CFO David Denton (former CFO of Pfizer and Lowe’s, about 20 years at CVS), appointed on June 23, joined on August 17 and led his first call on October 1.
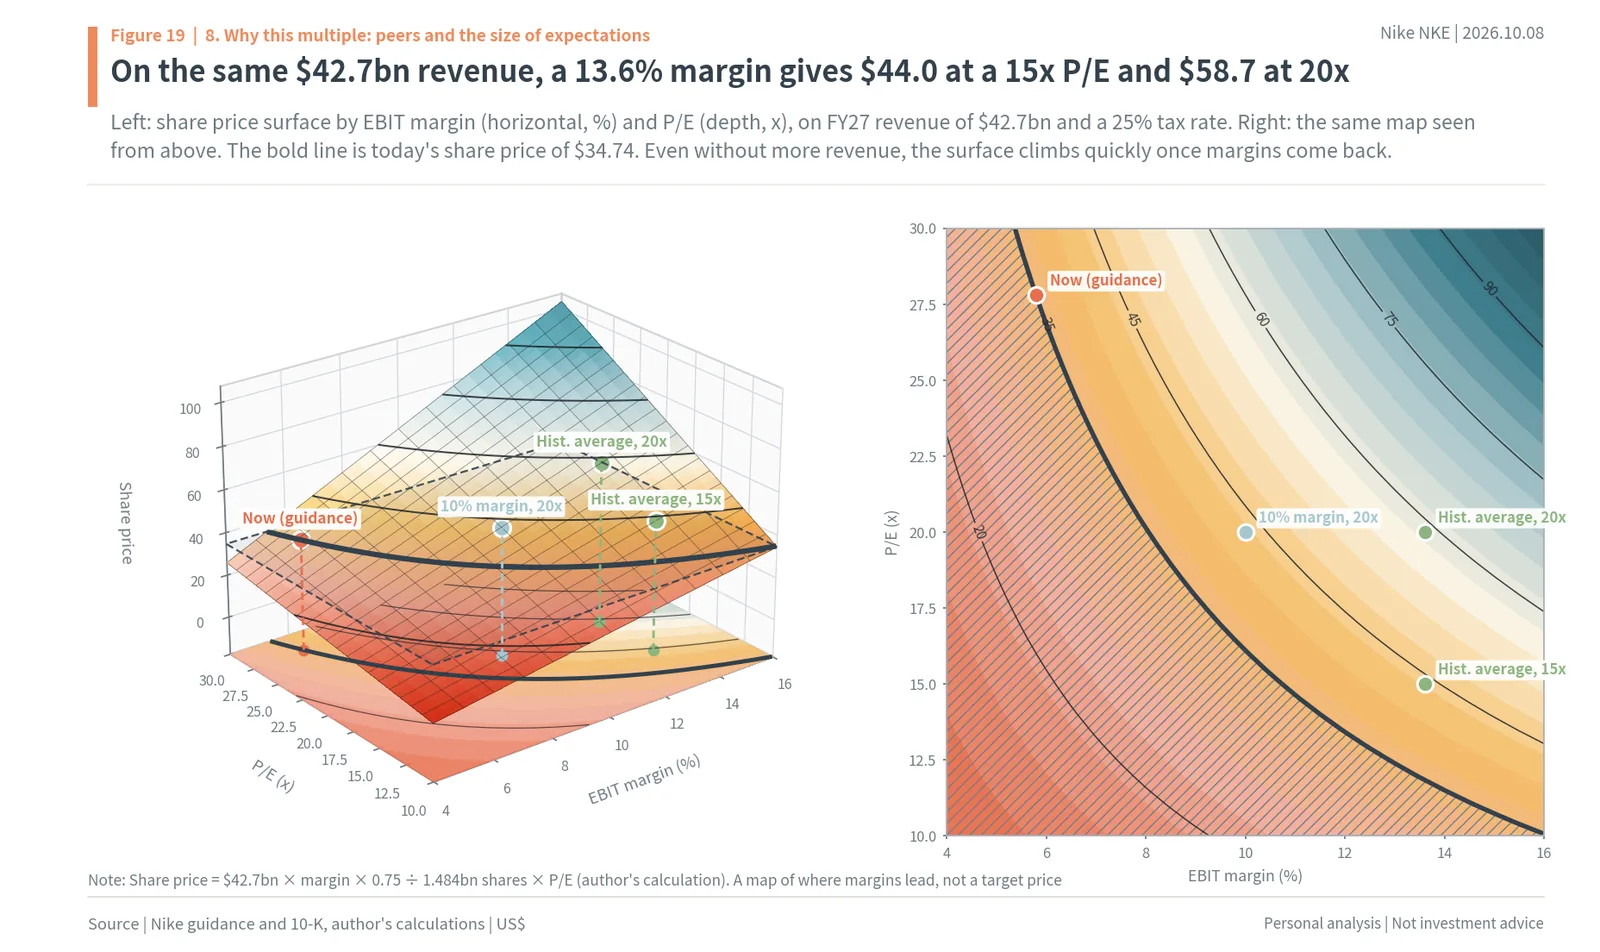
85. Denton said that in November he would present a financial algorithm for revenue and profit over “the next 5 years,” with guidance set at a level that is “reasonable and attainable.”
86. On the June call, former CFO Friend spoke of a “trajectory to get back to double-digit margins,” and analysts asked about that path again on the same call.
87. The new CFO is not bound by past guidance, so this is where he can put a five-year margin path into numbers for the first time, on top of the low Q1 guidance.
88. The last three Investor Days all rose over two days: +4.50% (2013), +2.37% (2015) and +6.35% (2017).
89. All three beat the S&P 500 over the two days (by +2.26, +1.36 and +6.69 percentage points).
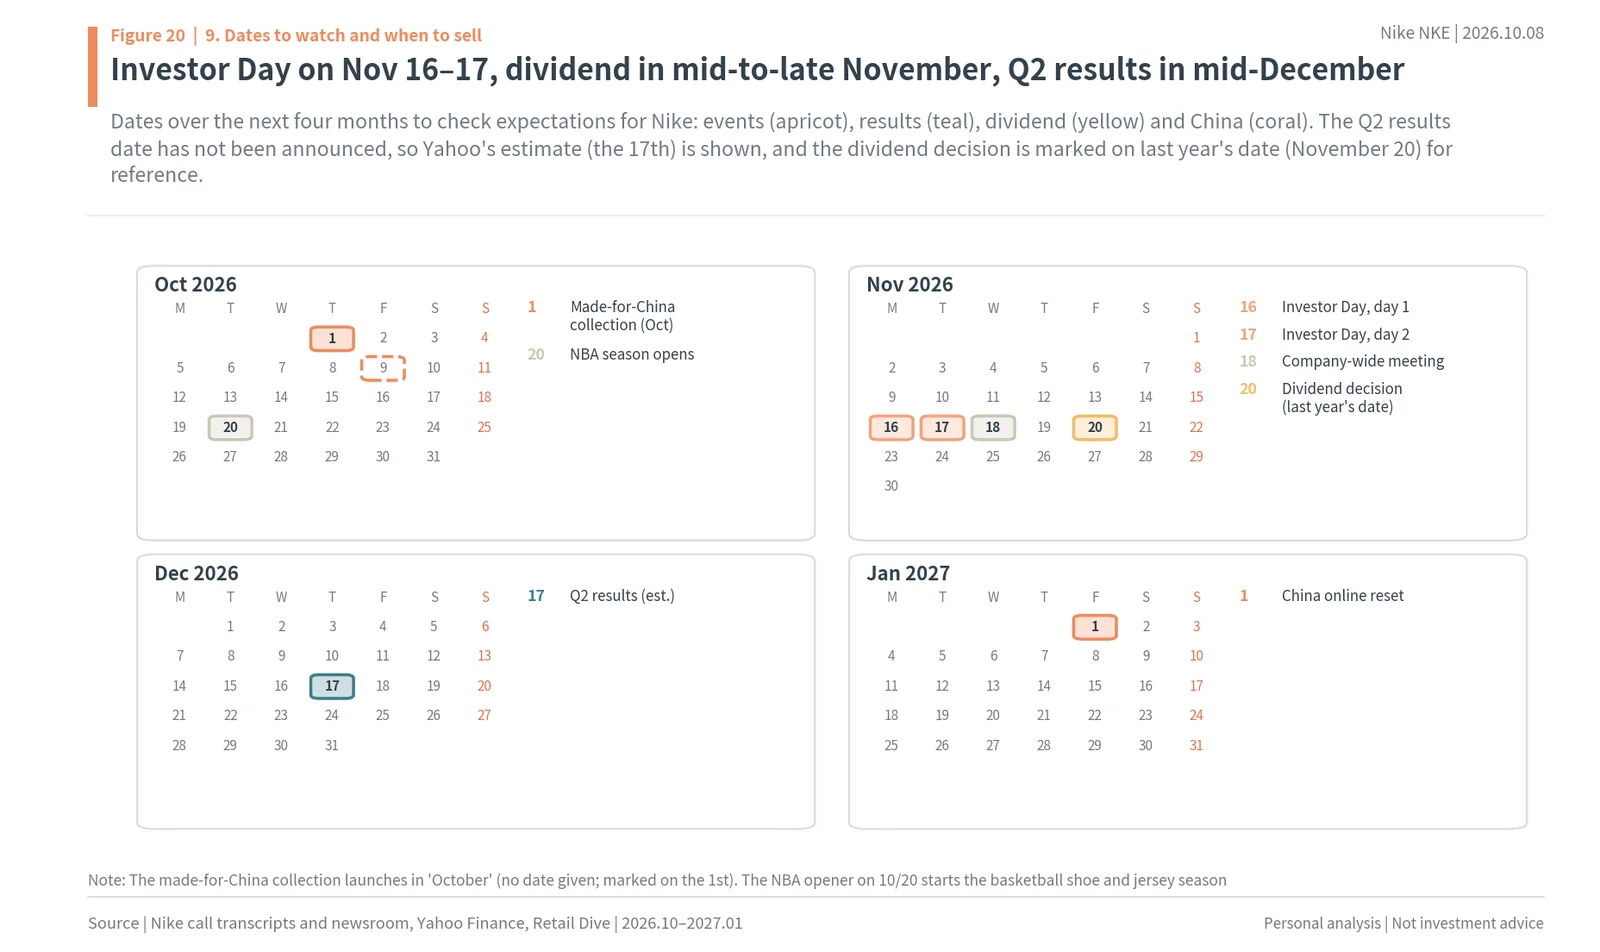
90. In 2015, after a 10.51% run-up in the 20 trading days before the event, the stock was -5.33% 60 trading days later, while in 2017, with no run-up (-0.52%), it was +25.68% 60 trading days later.
91. The P/E in 2017 was 23.4x, the lowest of the three, and over 60 trading days the stock beat the S&P 500 (+10.51%) by 15.17 percentage points.
92. The Investor Day that pulled the stock up the longest was the one held when it had not run up beforehand and was cheap.
93. When expectations were at a floor, a single remark about what comes next mattered a lot.
94. On June 26, 2025, when CFO Friend said that “the fourth quarter reflected the largest financial impact from our Win Now actions,” the stock rose 15.19% the next day, with P/S in the bottom 1.9% of 10 years.
95. On October 1 Nike guided FY27 EPS 26% below consensus, yet the stock recovered from -9.6% before the open to close at -3.64%.
96. Now the stock is down 8.8% over the month before the event, so it has not run up, and short interest is 8.98% of the float, so good numbers could also bring buying from short covering.
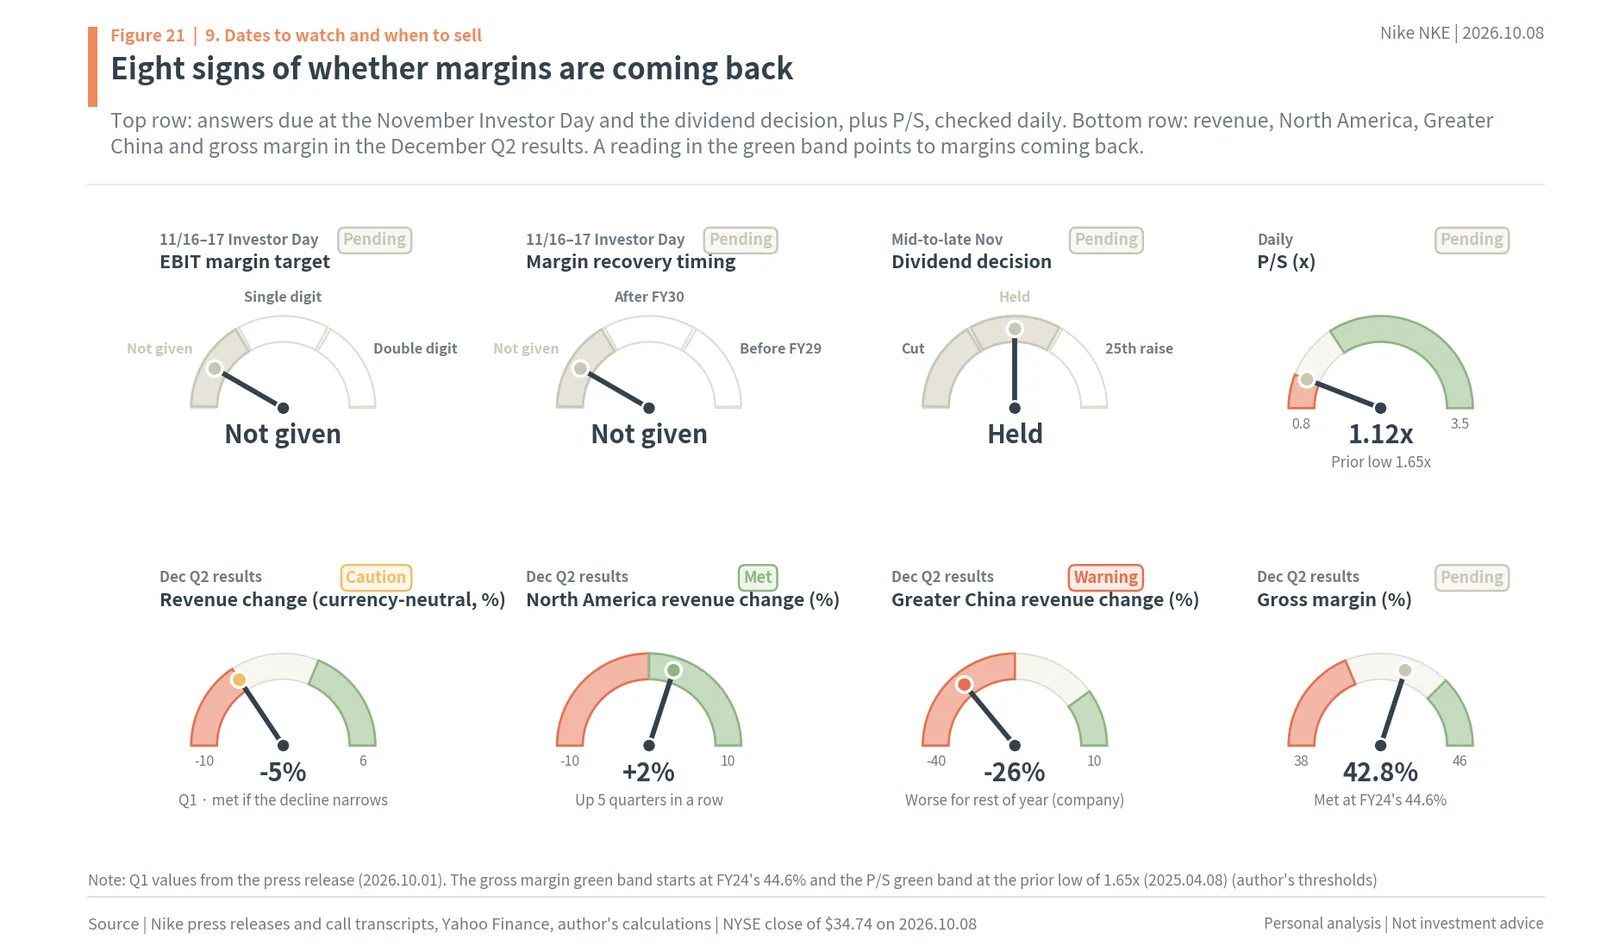
97. Now, when the stock falls less on bad numbers and rises sharply on good words, is when it reacts most to the same answer.
98. The numbers at the Investor Day that could pull the stock up are an EBIT margin target and its date.
99. On the same revenue, a 10% margin gives EPS of $2.16 and the historical average of 13.6% gives $2.93, so the target margin and the year it is reached translate directly into earnings per share.
100. On costs, the Pace program cuts $2.5bn by FY31 (at a cost of about $1bn), with most of the savings showing up in FY29–FY30.
101. In 2017 Nike targeted high-single-digit average revenue growth over five years, margin expansion and mid-teens EPS growth, with a payout ratio of 25–35%.
102. If “the year margins get back to double digits” comes out as a number, the author thinks it becomes the first catalyst to reprice the floor.
8. Nike Valuation vs Peers: Margins, P/S and Forward P/E
103. Sports brands generally get a higher price relative to revenue (P/S) the higher their margins.
104. With operating margins of 14–27%, Deckers (15.2%) trades at 2.03x P/S, On (14.0%) at 3.53x, Asics (22.6%) at 3.36x and Anta (27.0%) at 2.36x.
105. adidas, with an 8.5% operating margin, is at 1.00x, Puma and Under Armour, with almost no profit, are around 0.4x, and Nike, at 7.9% and 1.12x, sits on that line.
106. Forward P/Es are 12.9x for adidas (EPS of €11.60), 9.9x for Deckers ($8.33), 10.7x for Lululemon ($8.68) and 16.6x for On ($2.05), and Nike is 27.8x guidance EPS of $1.25.
107. Nike carries a high P/E because its earnings are at a floor, and if margins return to double digits, its P/S rises too, as it does for peers.
108. The size of expectations is mapped as “EBIT margin × P/E” (revenue of $42.7bn, tax rate of 25%).
109. Today’s price of $34.74 sits at a 5.8% margin and a 27.8x P/E.
110. A 10% margin at a 20x P/E gives $43.1 (+24%), and the historical average of 13.6% gives $44.0 at 15x and $58.7 at 20x (+69%).
111. These are not target prices but a map of “where the stock lands if margins come back to a given level.”
112. Even without revenue growth the surface rises quickly once margins return, so the size of expectations depends on one number: the margin.
9. Nike Stock Calendar: Investor Day, Dividend and Q2 Results
113. In October the first China-only collection reached stores, and the NBA season opens on the 20th.
114. November 16–17 brings the Investor Day (the five-year financial algorithm), and the 18th a company-wide meeting.
115. The dividend decision comes in mid-to-late November (last year a 3% raise on November 20).
116. Q2 results come in mid-December (Yahoo estimates the 17th), and because the company has already flagged a revenue headwind of about 4 percentage points from last year’s promotions and shipments, expectations gather first around the Investor Day.
117. On January 1, 2027 the cleanup of China online sellers begins.
118. For investors who sell when earnings become the talking point, the author sees the first window as the two days after the Investor Day (the stock rose in all of the last three).
119. If the 60-trading-day run continues as in 2017, the second window is before the Q2 results in December.
120. The top row of gauges covers the Investor Day’s margin target and recovery timing, the dividend decision and P/S, checked daily.
121. The bottom row covers December’s results: revenue change (Q1 -5%), North America (+2%), Greater China (-26%) and gross margin (42.8%).
122. The more readings that land in the green band, the more margins are coming back, and the first of them is filled on November 16–17.
10. Summary
123. Too many classics on the market brought more discounting, and with China and tariffs on top the margin fell to 5.8%, while the stock became the cheapest since 2010 at 1.12x revenue.
124. If only the margin returns to the historical average of 13.6% on the same revenue, EPS is $2.93 and today’s price is 11.8x.
125. The company is turning back to full-price selling, cutting Dunk in half, while North America has grown for five quarters and apparel pricing is up 4 percentage points.
126. If the new CFO gives a date for getting back to double-digit margins at the November 16–17 Investor Day, the first in nine years, this is a setup where the stock moves before revenue, as adidas did.
Maochaedung’s take
In short: a floor price on sales, the catalyst on November 16. Nike put too many classics on the market, discounts grew, and with China and tariffs on top, profits collapsed first; as a result its market cap fell to 1.12x a year’s revenue, the cheapest since 2010. The P/E looks expensive at 27.8x because the EBIT margin is at a floor of 5.8%, and if the margin simply returns to the historical average of 13.6% on the same $42.7bn of revenue, EPS is $2.93 and today’s price is 11.8x. The company is turning back to full-price selling, cutting Dunk in half, and North America has grown for five quarters. Just as adidas rose before its revenue did once new management had lowered expectations, the author thinks that if the new CFO puts a date on double-digit margins in numbers at the first Investor Day in nine years, it becomes the first catalyst to reprice the floor. For investors who sell on the earnings story, the two days after the Investor Day are the first window.
Nike (NKE) Stock FAQ
Q. Is Nike stock cheap now?
On revenue, Nike’s market cap is 1.12x trailing-four-quarter revenue, the lowest since 2010, against a 10-year median of 3.26x, and its dividend yield of 4.72% is four times the 10-year median of 1.15%. On earnings, the P/E is 27.8x guidance EPS of $1.25.
Q. Why does Nike’s P/E look high?
Because margins are at a floor. Working FY27 guidance backward gives an EBIT margin of 5.8%, versus an average of 13.6% in FY15–FY24 excluding FY20. On the same $42.7bn of revenue, a 13.6% margin gives EPS of $2.93, or 11.8x today’s price of $34.74.
Q. Why did Nike stock fall?
Nike put too many classics such as the Air Force 1, Dunk and Jordan 1 on the market, they sold at a discount, and with China and tariffs on top, gross margin fell from 45.4% in Q1 FY25 to 40.2% in Q3 FY26. The stock is down 80.4% from its record close of $177.51 on November 5, 2021.
Q. Is Nike’s dividend safe?
The payout ratio on FY27 guidance EPS of $1.15–1.35 is 121–143%, but CFO Denton said on the Q1 call that “under all scenarios, we have support for maintaining and ultimately growing the dividend over time.” Cash and short-term investments are $8.4bn, and the dividend has been raised 24 years in a row.
Q. When is the Nike Investor Day and why does it matter?
The Investor Day is on November 16–17, 2026, the first since October 25, 2017. New CFO David Denton will present a financial algorithm for the next five years, and the numbers that could lift the stock are an EBIT margin target and its date.
Q. How did Nike stock react to past Investor Days?
All three rose over two days: +4.50% in 2013, +2.37% in 2015 and +6.35% in 2017. In 2017, when the stock had not run up beforehand and the P/E was the lowest of the three at 23.4x, it gained 25.68% over 60 trading days.
Sources
- Nike, Q1 fiscal 2027 earnings press release (link), 2026.10.01
- Nike, Q1 10-Q (link), 2026.10.02
- Nike, Q1 earnings call official transcript (link), 2026.10.01
- Nike, Q4 fiscal 2026 earnings press release (link), 2026.06.30
- Nike, Q4 earnings call official transcript (link), 2026.06.30
- Nike, Fiscal 2026 10-K (link), 2026.07.15
- Nike, Fiscal 2025 10-K (link), 2025.07.17
- Nike, Q4 fiscal 2025 earnings call official transcript (link), 2025.06.26
- Nike, Q2 fiscal 2026 earnings call official transcript (link), 2025.12.18
- Nike, CFO transition announcement (link), 2026.06.23
- Nike, 2017 Investor Day press release (link), 2017.10.25
- Fortune, Nike sets $50 billion sales target (link), 2015.10.14
- 24/7 Wall St., Nike pulls back on Bank of America downgrade (link), 2026.09.25
- investinglive, Nike sees fiscal 2027 revenue falling high single digits (link), 2026.10.01
- tradingpedia, Nike drops as weak outlook overshadows earnings beat (link), 2026.10.02
- Hypebeast, Nike S&P 100 removal (link), 2026.09
- Retail Dive, Nike resets online China distribution (link), 2026.07.22
- adidas, Quarterly results and 2023 outlook press releases (link), 2022.05–2026.07
- 36Kr, Gulden interview (60% of products for China designed locally) (link), 2025.10.15
- FashionUnited, adidas wants to win back Chinese consumers (link), 2023.04.25
- Yahoo Finance, Nike and adidas prices, dividends, consensus, short interest and peer data (link), 2026.10.09
- US SEC EDGAR, Nike XBRL financial data (link), 2026.10.09
Disclaimer
This post records the author’s personal analysis and views based on publicly available information and does not recommend choosing any particular product or company. It does not recommend buying or selling any financial investment product and is not a service provided as investment advisory or quasi-investment advisory business.
Figures in this post are values published as of the time of writing. The long-term positions of P/S and dividend yield, the EPS sum excluding the tariff refund, the EBIT margin backed out of guidance, EPS and P/E “if margins return,” and the share price returns around past Investor Days and for adidas are values the author calculated from company filings and Yahoo Finance data, not company guidance or broker consensus. Accuracy and completeness are not guaranteed.
FY27 revenue is calculated by taking the company’s guidance of a “high-single-digit decline” as -8%, and the tax rate by taking the company’s “mid-20 percent range” as 25%. Items marked ‘author’s calculation’ or ‘author’s judgment’ are the author’s calculations and assumptions, not confirmed facts. This post does not give a target price.
The judgments in this post are the author’s personal views; they do not recommend trading at any particular time or promise any return. Nike reports its results in US dollars, and for investors in Korea, gains and losses in won change with the exchange rate.
Author’s interest: not disclosed
Responsibility for decisions and their outcomes lies with the reader.
As of: October 9, 2026